3238.0 estimates and projections, aboriginal and …...6 abs • estimates and projections,...
TRANSCRIPT

71Bibliography . . . . . . . . . . . . . . . . . . . . . . . . . . . . . . . . . . . . . . . . . . .68Glossary . . . . . . . . . . . . . . . . . . . . . . . . . . . . . . . . . . . . . . . . . . . . . .51Explanatory Notes . . . . . . . . . . . . . . . . . . . . . . . . . . . . . . . . . . . . . . . .
A D D I T I O N A L I N F O R M A T I O N
60Using historical estimates of the Aboriginal and Torres Strait Islanderpopulation for comparative analysis and reporting purposes
A3. . . . . . . . . .
58Deriving non-Indigenous population estimates for comparative analysisand reporting purposes
A2. . . . . . . . . . . . . . . . . . . . . . . . . . . . . . . . .
57Backcast estimates for the period 1996-2000A1 . . . . . . . . . . . . . . . . . .A P P E N D I X E S
43Sensitivity of projections to assumptions4 . . . . . . . . . . . . . . . . . . . . . .36Summary of findings3 . . . . . . . . . . . . . . . . . . . . . . . . . . . . . . . . . .10Assumptions2 . . . . . . . . . . . . . . . . . . . . . . . . . . . . . . . . . . . . . . .
6Main features1 . . . . . . . . . . . . . . . . . . . . . . . . . . . . . . . . . . . . . . .C H A P T E R S
3List of tables and graphs . . . . . . . . . . . . . . . . . . . . . . . . . . . . . . . . . . . .2Notes . . . . . . . . . . . . . . . . . . . . . . . . . . . . . . . . . . . . . . . . . . . . . . . .
page
C O N T E N T S
E M B A R G O : 1 1 . 3 0 A M ( C A N B E R R A T I M E ) W E D 3 0 A P R 2 0 1 4
ESTIMATES AND PROJECTIONS,ABORIGINAL AND TORRES STRAITISLANDER AUSTRALIANS A U S T R A L I A
3238.02 0 0 1 T O 2 0 2 6
For further informationabout these and relatedstatistics, contact theNational Information andReferral Service on1300 135 070 orHolly Cockburn onCanberra (02) 6252 6400.
I N Q U I R I E S
w w w . a b s . g o v . a u

J o n a t h a n Pa l m e r
Ac t i n g Au s t r a l i a n S t a t i s t i c i a n
Population estimates and projections in this release have been rounded to the nearest
hundred. Calculations of percentage and numeric change and proportions are based on
unrounded data.
RO U N D E D F I G U R E S
The projections presented are not intended as predictions or forecasts, but are
illustrations of growth and change in the population that would occur if assumptions
made about future demographic trends were to prevail over the projection period.
While the assumptions are formulated on the basis of an assessment of observed
demographic trends, there is no certainty that any of the assumptions will be realised. In
addition, no assessment has been made of possible future changes in non-demographic
factors.
DA T A NO T E S
SuperTABLE data cubes attached to this issue contain 10 projection series for Australia
and the states and territories, for 2012 to 2026. Population estimates for 2001 to 2011 are
also included as spreadsheets.
These estimates and projections supersede the 2006 Census-based series published in
Experimental Estimates and Projections, Aboriginal and Torres Strait Islander
Australians, 1991 to 2021 (cat. no. 3238.0) released in September 2009.
Population estimates for the Northern Territory at 30 June 2011 are based on
age-heaping adjusted data. For further information on this adjustment, see Estimates of
Aboriginal and Torres Strait Islander Australians (cat. no. 3238.0.55.001).
CH A N G E S TO TH I S I S S U E
This release contains estimates and projections of the Aboriginal and Torres Strait
Islander population of Australia, States and Territories and Remoteness Areas for 30 June
2001 to 30 June 2026, based on the 2011 Census of Population and Housing. Estimates
for 30 June 1996 to 30 June 2000 are also included in Appendix 1, however these
estimates should be used with additional caution.
Detailed information is available in data cubes from the ABS web site
<http://www.abs.gov.au>.
Projections of the Aboriginal and Torres Strait Islander population by Indigenous
Regions (scheduled for release 21 May 2014) for 30 June 2012 to 30 June 2026 will also
be available from the ABS web site.
AB O U T TH I S PU B L I C A T I O N
2 A B S • ES T I M A T E S A N D P R O J E C T I O N S , A B O R I G I N A L A N D T O R R E S ST R A I T I S L A N D E R A U S T R A L I A N S • 3 2 3 8 . 0 • 2 0 0 1 T O 2 0 2 6
N O T E S
L I S T OF TA B L E S . . . . . . . . . . . . . . . . . . . . . . . . . . . . . . . . . . . . . .
38
Estimated and projected Aboriginal and Torres Strait Islander
population, by age group, Australia, 2001–2026
3.2. . . . . . . . . . . . . . . . .
37
Estimated and projected Aboriginal and Torres Strait Islander
population, Australia, 2001–2026 (graph)
3.1. . . . . . . . . . . . . . . . . . . . .
CH A P T E R 3 – SU M M A R Y OF F I N D I N G S
34Assumed net internal migration, Remoteness Areas2.20 . . . . . . . . . . . . . . .33Assumed net internal migration, Indigenous Regions2.19 . . . . . . . . . . . . . .32Assumed net interstate migration2.18 . . . . . . . . . . . . . . . . . . . . . . . . . .31Interstate arrivals and departures, 2006–20112.17 . . . . . . . . . . . . . . . . . .30Mortality differentials, Remoteness Areas, 2010–20122.16 . . . . . . . . . . . . . .29
Aboriginal and Torres Strait Islander life expectancy at birth and
mortality differentials, Indigenous Regions, 2010–2012
2.15. . . . . . . . . . . .
28
Aboriginal and Torres Strait Islander life expectancy at birth and
mortality differentials, States and territories, 2010–2012
2.14. . . . . . . . . . . .
25Assumed total paternity rates, Remoteness Areas2.13 . . . . . . . . . . . . . . . .25Assumed total paternity rates, Indigenous Regions2.12 . . . . . . . . . . . . . . .24Assumed paternity rates, States and territories2.11 . . . . . . . . . . . . . . . . . .23Total paternity rates, Australia, 1998–2012 (graph)2.10 . . . . . . . . . . . . . . .22Assumed total fertility rates, Remoteness Areas2.9 . . . . . . . . . . . . . . . . .22Assumed total fertility rates, Indigenous Regions2.8 . . . . . . . . . . . . . . . .21Assumed fertility rates, States and territories2.7 . . . . . . . . . . . . . . . . . . .19Total fertility rates, Australia, 1962–2012 (graph)2.6 . . . . . . . . . . . . . . . .18
Average number of children ever born, Aboriginal and Torres Strait
Islander women, 1981, 1986, 1996, 2006 and 2011 censuses (graph)
2.5. . . .
17Sex ratio, Australia, 2006–2012 (graph)2.4 . . . . . . . . . . . . . . . . . . . . . .16Indigenous status of parents, States and territories, 2012 (graph)2.3 . . . . . .16Indigenous status of parents, Australia, 2001–2012 (graph)2.2 . . . . . . . . . .14Projection series, Assumptions used2.1 . . . . . . . . . . . . . . . . . . . . . . . .
CH A P T E R 2 – AS S U M P T I O N S
9
Estimated and projected Aboriginal and Torres Strait Islander
population, States and territories, 2001–2026
1.3. . . . . . . . . . . . . . . . . . .
8
Estimated and projected Aboriginal and Torres Strait Islander
population, by age group, Australia – 2001, 2011 and 2026 (graph)
1.2. . . . . .
7Main projection series, Australia1.1 . . . . . . . . . . . . . . . . . . . . . . . . . . . .CH A P T E R 1 – MA I N FE A T U R E S
page
A B S • ES T I M A T E S A N D P R O J E C T I O N S , A B O R I G I N A L A N D T O R R E S ST R A I T I S L A N D E R A U S T R A L I A N S • 3 2 3 8 . 0 • 2 0 0 1 T O 2 0 2 6
3

64
Standardised death rates, Per 100,000 population – single series
(graph)
A3.7. . . . . . . . . . . . . . . . . . . . . . . . . . . . . . . . . . . . . . . . . .
64
Full-time school enrolments, Proportion of 6-15 year olds –
combination of series (graph)
A3.6. . . . . . . . . . . . . . . . . . . . . . . . . . . .
63
Full-time school enrolments, Proportion of 6-15 year olds – single
series (graph)
A3.5. . . . . . . . . . . . . . . . . . . . . . . . . . . . . . . . . . . . . .
63
Child mortality rates (0–4 years), Per 100,000 population –
combination of series (graph)
A3.4. . . . . . . . . . . . . . . . . . . . . . . . . . . .
62
Child mortality rates (0–4 years), Per 100,000 population – single
series (graph)
A3.3. . . . . . . . . . . . . . . . . . . . . . . . . . . . . . . . . . . . . .
61Backcast and projected series, 1991–2011 Census bases (graph)A3.2 . . . . . . .61Change in estimated resident population, Between Censuses (graph)A3.1 . . . .
AP P E N D I X 3 – GU I D E L I N E S FO R US I N G H I S T O R I C A L ES T I M A T E S OF TH E AB O R I G I N A L AN D
TO R R E S ST R A I T I S L A N D E R PO P U L A T I O N
57
Estimates of Aboriginal and Torres Strait Islander Australians,
1996–2000
A1.1. . . . . . . . . . . . . . . . . . . . . . . . . . . . . . . . . . . . . . . .
AP P E N D I X 1 – BA C K C A S T ES T I M A T E S FO R TH E PE R I O D 19 9 6 - 2 0 0 0
49
Projected deaths of Aboriginal and Torres Strait Islander persons,
Alternative life expectancy at birth assumptions, year ended 30 June
2012 and 2026
4.6
. . . . . . . . . . . . . . . . . . . . . . . . . . . . . . . . . . . . . .
48
Projected Aboriginal and Torres Strait Islander population,
Alternative life expectancy at birth assumptions, at 30 June 2011 and
2026
4.5
. . . . . . . . . . . . . . . . . . . . . . . . . . . . . . . . . . . . . . . . . . . .
46
Projected births of Aboriginal and Torres Strait Islander children,
Alternative paternity assumptions, year ended 30 June 2012 and 2026
4.4. . . .
46
Projected Aboriginal and Torres Strait Islander population,
Alternative paternity assumptions, at 30 June 2011 and 2026
4.3. . . . . . . . .
44
Projected births of Aboriginal and Torres Strait Islander children,
Alternative fertility assumptions, year ended 30 June 2012 and 2026
4.2. . . .
44
Projected Aboriginal and Torres Strait Islander population,
Alternative fertility assumptions, at 30 June 2011 and 2026
4.1. . . . . . . . . .
CH A P T E R 4 – SE N S I T I V I T Y OF PR O J E C T I O N S TO AS S U M P T I O N S
42
Projected distribution of Aboriginal and Torres Strait Islander
population, States and territories, 30 June 2011 and 2026
3.6. . . . . . . . . . .
40
Estimated and projected Aboriginal and Torres Strait Islander
population, States and territories, 2001–2026
3.5. . . . . . . . . . . . . . . . . .
40
Projected natural increase of Aboriginal and Torres Strait Islander
population, Australia, 2012–2026 (graph)
3.4. . . . . . . . . . . . . . . . . . . . .
39
Estimated and projected Aboriginal and Torres Strait Islander
population, by age group, Australia, Series B, 30 June 2011 and 2026
(graph)
3.3
. . . . . . . . . . . . . . . . . . . . . . . . . . . . . . . . . . . . . . . . . .
CH A P T E R 3 – SU M M A R Y OF F I N D I N G S continued
page
4 A B S • ES T I M A T E S A N D P R O J E C T I O N S , A B O R I G I N A L A N D T O R R E S ST R A I T I S L A N D E R A U S T R A L I A N S • 3 2 3 8 . 0 • 2 0 0 1 T O 2 0 2 6
L I S T OF T A B L E S

65
Standardised death rates, Per 100,000 population – combination of
series (graph)
A3.8. . . . . . . . . . . . . . . . . . . . . . . . . . . . . . . . . . . . . .
AP P E N D I X 3 – GU I D E L I N E S FO R US I N G H I S T O R I C A L ES T I M A T E S OF TH E AB O R I G I N A L AN D
TO R R E S ST R A I T I S L A N D E R PO P U L A T I O N continued
page
A B S • ES T I M A T E S A N D P R O J E C T I O N S , A B O R I G I N A L A N D T O R R E S ST R A I T I S L A N D E R A U S T R A L I A N S • 3 2 3 8 . 0 • 2 0 0 1 T O 2 0 2 6
5
L I S T OF T A B L E S

CHAP T E R 1 MA I N FE A T U R E S . . . . . . . . . . . . . . . . . . . . . . . . . . . . . . . . . . . . .
Using assumptions about future fertility, paternity, life expectancy at birth and migration,
10 series of projections of the Aboriginal and Torres Strait Islander population have been
generated for 2012 to 2026 (see Chapter 2 for more information). Three series, Series A,
B and C, have been chosen for analysis in this release. Detailed information for these and
the remaining series are available in data cubes attached to this release on the ABS web
site.
It is important to recognise that the projections are not predictions or forecasts, but are
illustrations of the growth and change in population which would occur if certain
assumptions about future levels of fertility, paternity, mortality and migration were to
prevail over the projection period. There can be no certainty that any particular outcome
will be realised, or that future outcomes will necessarily fall within the projected ranges.
Populat ion project ions
Estimates for the Aboriginal and Torres Strait Islander population of Australia and the
states and territories have been produced for the period 2001 to 2011. Estimates for 30
June 1996 to 30 June 2000 are also included in Appendix 1, however these estimates
should be used with caution and have not been included in any analysis for this release.
Populat ion est imates
The estimates and projections of Aboriginal and Torres Strait Islander Australians
presented in this release are subject to volatility. Aboriginal and Torres Strait Islander
Census counts and the quality of data on births, deaths and migration of Aboriginal and
Torres Strait Islander people do not support the use of the standard approach to
population estimation.
I N T R O D U C T I O N
6 A B S • ES T I M A T E S A N D P R O J E C T I O N S , A B O R I G I N A L A N D T O R R E S ST R A I T I S L A N D E R A U S T R A L I A N S • 3 2 3 8 . 0 • 2 0 0 1 T O 2 0 2 6

In 2011, the estimated resident Aboriginal and Torres Strait Islander population was
669,900 people, representing 3% of the total Australian population. Between 2001 and
2011 the Aboriginal and Torres Strait Islander population increased by 2.3% (from
534,700 people) per year on average, compared with 1.5% for the total Australian
population.
The population of Aboriginal and Torres Strait Islander Australians is projected to
increase to between 907,800 and 945,600 people in 2026, at an average growth rate of
between 2.0% and 2.3% per year. In comparison, the average growth rate of the total
Australian population is projected to be between 1.5% and 1.8% per year over the same
period (Population Projections, Australia, 2012 (base) to 2101, cat. no. 3222.0).
The Aboriginal and Torres Strait Islander population is projected to increase across all
age groups between 2011 and 2026 albeit at different rates. The number of Aboriginal
and Torres Strait Islander children (0–14 years) is projected to increase from 240,600 in
2011 to between 285,200 and 315,200 in 2026, while the number of Aboriginal and Torres
Strait Islander people aged 15–64 years is projected to increase from 406,600 in 2011 to
between 565,300 and 568,500 in 2026. The number of Aboriginal and Torres Strait
Islander people aged 65 years and over is projected to more than double over the
period, from 22,700 in 2011 to between 57,400 and 61,900 in 2026.
AU S T R A L I A
(a) Births to Aboriginal and Torres Strait Islander men, where the mother's Indigenous status wasnon-Indigenous or not stated, per Aboriginal and Torres Strait Islander man.
(b) Series A assumes Aboriginal and Torres Strait Islander fertility rates remain constant; paternity ratesincrease by 2% per year; and life expectancy at birth increases by 0.5 years per year for males and0.45 years per year for females, reaching 76.5 years for males and 80.4 years for females by 2026.
(c) Series B assumes Aboriginal and Torres Strait Islander fertility rates decline by 0.5% per year;paternity rates increase by 1% per year; and life expectancy at birth increases by 0.3 years per yearfor males and 0.25 years per year for females, reaching 73.5 years for males and 77.4 years forfemales by 2026.
(d) Series C assumes Aboriginal and Torres Strait Islander fertility rates decline by 1% per year; paternityrates remain constant; and life expectancy at birth increases by 0.2 years per year for males and0.15 years per year for females, reaching 72.0 years for males and 75.9 years for females by 2026.
907 789449 798457 99175.972.00.941.95Series C(d)924 953458 246466 70777.473.51.082.09Series B(c)945 594468 470477 12480.476.51.252.25Series A(b)
no.no.no.yearsyearsbabies
per manbabies per
woman
PersonsFemalesMales
30 JUNE 2026Females life
expectancy
at birth
Male life
expectancy
at birth
Total
paternity
rate(a)
Total
fertility
rate
MAIN PROJECT ION SERIES, Aust ra l ia1.1Populat ion project ions
cont inue d
A B S • ES T I M A T E S A N D P R O J E C T I O N S , A B O R I G I N A L A N D T O R R E S ST R A I T I S L A N D E R A U S T R A L I A N S • 3 2 3 8 . 0 • 2 0 0 1 T O 2 0 2 6
7
CH A P T E R 1 • MA I N FE A T U R E S

At 30 June 2011, New South Wales had the largest Aboriginal and Torres Strait Islander
population of the states and territories (208,500 people), followed by Queensland
(189,000), Western Australia (88,300), the Northern Territory (68,900), Victoria (47,300),
South Australia (37,400), Tasmania (24,200) and the Australian Capital Territory (6,200)
(table 1.3).
The Aboriginal and Torres Strait Islander population of the Australian Capital Territory is
projected to be the fastest growing of the states and territories, with an average growth
rate over the projection period of between 2.8% and 3.1% per year, followed by Victoria
(between 2.5% and 2.8%), Queensland (between 2.3% and 2.6%) and Tasmania (between
ST A T E S AN D TE R R I T O R I E S
Consistent with this, the median age of the Aboriginal and Torres Strait Islander
population is estimated to have increased from 20.4 years in 2001 to 21.6 years in 2011,
and is projected to increase to between 24.7 and 25.4 years in 2026.
The proportion of Aboriginal and Torres Strait Islander children aged 0–14 years is
therefore projected to decrease from 36% in 2011 to between 31% and 33% in 2026,
while the proportion of Aboriginal and Torres Strait Islander people aged 15–64 years is
projected to remain relatively stable, from 61% in 2011 to between 60% and 62% in 2026.
The proportion of Aboriginal and Torres Strait Islander people aged 65 years and over is
projected to increase from 3.4% in 2011 to between 6.3% and 6.5% in 2026.
AU S T R A L I A c o n t i n u e d
EST IMATED AND PROJECTED ABORIG INAL AND TORRES STRAIT ISLANDER 1.2 POPULAT ION, by age group, Aust ra l i a —at 30 June
8 A B S • ES T I M A T E S A N D P R O J E C T I O N S , A B O R I G I N A L A N D T O R R E S ST R A I T I S L A N D E R A U S T R A L I A N S • 3 2 3 8 . 0 • 2 0 0 1 T O 2 0 2 6
CH A P T E R 1 • MA I N FE A T U R E S

(a) Average annual growth rate for the period 2011 to 2026.(b) Includes Other Territories.
2.0907 7892.2924 9532.3945 594669 881534 718Aust.(b)
2.89 2862.99 4633.19 6746 1604 256ACT1.484 9221.586 0601.687 48668 85059 702NT2.233 3052.333 9652.434 72424 16519 292Tas.1.9117 4402.0119 4312.2121 83688 27071 994WA2.050 3122.151 2332.352 32137 40829 068SA2.3266 7552.5271 8602.6278 019188 954143 545Qld2.568 1982.669 6372.871 37947 33335 816Vic.1.9277 2332.1282 9622.2289 808208 476170 827NSW
Growth
rate
(%)(a)no.
Growth
rate
(%)(a)no.
Growth
rate
(%)(a)no.no.no.
2026 (SERIES C)2026 (SERIES B)2026 (SERIES A)20112001
ESTIMATED AND PROJECTED ABORIG INAL AND TORRES STRAITISLANDER POPULAT ION, States and ter r i to r ies —2001– 20261.3
2.2% and 2.4%). The Aboriginal and Torres Strait Islander population of the Northern
Territory is projected to have the lowest growth rate of between 1.4% and 1.6% per year
over the projection period.
In Series A, B and C, Queensland is projected to approach New South Wales as the state
or territory with the largest Aboriginal and Torres Strait Islander population in 2026.
Queensland's share of Australia's Aboriginal and Torres Strait Islander population is
projected to increase from 28% in 2011 to 29% in 2026, while New South Wales is
projected to remain stable at 31% in 2011 and 2026. The Northern Territory's proportion
of the Aboriginal and Torres Strait Islander population is projected to decrease from
10.3% in 2011 to between 9.3% and 9.4% in 2026. The distribution amongst the
remaining states and territories is projected to remain largely unchanged.
ST A T E S AN D TE R R I T O R I E S
c o n t i n u e d
A B S • ES T I M A T E S A N D P R O J E C T I O N S , A B O R I G I N A L A N D T O R R E S ST R A I T I S L A N D E R A U S T R A L I A N S • 3 2 3 8 . 0 • 2 0 0 1 T O 2 0 2 6
9
CH A P T E R 1 • MA I N FE A T U R E S

CHAP T E R 2 AS S U M P T I O N S . . . . . . . . . . . . . . . . . . . . . . . . . . . . . . . . . . . . . . .
The base population is the Aboriginal and Torres Strait Islander estimated resident
population of Australia at 30 June 2011, derived from 2011 Census of Population and
Housing counts of Aboriginal and Torres Strait Islander Australians, adjusted for net
undercount as measured by the Post Enumeration Survey (PES). The base population
estimates for the Northern Territory at 30 June 2011 are based on age-heaping adjusted
Base populat ion
Backcast estimates of the Aboriginal and Torres Strait Islander population in this release
span the period 30 June 2001 to 30 June 2011 and are available for Australia and the
states and territories. Estimates for the period 30 June 1996 to 30 June 2000 have also
been produced and are available as an illustrative series in Appendix 1. Given the 15-year
interval for which the assumption of improving life expectancy at birth is applied,
backcast data should be interpreted with caution.
Projections of the Aboriginal and Torres Strait Islander population in this release span
the period 30 June 2012 to 30 June 2026 and are available for Australia, states and
territories, Indigenous Regions and Remoteness Areas. Again, given the 15-year interval
for which the assumptions are applied, projections data should be interpreted with
caution.
Span of est imates and
project ions
The Australian Bureau of Statistics (ABS) uses a cohort-component method for
producing population projections. Using this method, assumptions made about future
levels of fertility, mortality, and migration are applied to a base population (split by sex
and single year of age) to obtain a projected population for the following year. The
assumptions are then applied to this new (projected) population to obtain a projected
population for the next year. This process is repeated until the end of the projection
period is reached.
A similar method can also be used to produce population estimates for previous years
(in this release, years prior to the 2011 Census of Population and Housing). This
technique requires assumptions to be made about past levels of mortality taking into
account the most recent Census data to utilise the best quality estimates available. These
are applied to the base population to obtain a 'reverse-survived' population for the
previous year. The assumptions are then applied to this new (reverse-survived)
population to obtain a population for the preceding year. This process is repeated until
the first year of the estimation period is reached.
Estimates and projections presented in this release supersede estimates and projections
based on earlier censuses. The assumptions used differ from those in previous
publications. As a result, and in addition to the use of a different base population, which
is significantly larger than the previous base population, the size, structure and
components of the estimated and projected Aboriginal and Torres Strait Islander
population are different to those previously published for the same period.
I N T R O D U C T I O N
10 A B S • ES T I M A T E S A N D P R O J E C T I O N S , A B O R I G I N A L A N D T O R R E S ST R A I T I S L A N D E R A U S T R A L I A N S • 3 2 3 8 . 0 • 2 0 0 1 T O 2 0 2 6

data. For further information on this adjustment and the base population, see Estimates
of Aboriginal and Torres Strait Islander Australians (cat. no. 3238.0.55.001).
Base populat ion
cont inue d
A B S • ES T I M A T E S A N D P R O J E C T I O N S , A B O R I G I N A L A N D T O R R E S ST R A I T I S L A N D E R A U S T R A L I A N S • 3 2 3 8 . 0 • 2 0 0 1 T O 2 0 2 6
11
CH A P T E R 2 • A S S U M P T I O N S

Assumptions have been formulated on the basis of past demographic trends, in
conjunction with consultation with various experts and government department
representatives at the national and state/territory level. They do not attempt to allow for
non-demographic factors (such as major government policy decisions, economic factors,
natural disasters, epidemics or significant health treatment improvements) which may
affect future demographic behaviour or outcomes.
Three assumptions are made about fertility rates of Aboriginal and Torres Strait Islander
women:
! constant fertility rates;
! an annual decline of 0.5% in fertility rates; and
! an annual decline of 1.0% in fertility rates.
Three paternity assumptions, that is the proportion of births born to an Aboriginal and
Torres Strait Islander father and mother whose Indigenous status is non-Indigenous or
not stated, were also made:
! constant paternity rates;
! an annual increase of 1.0% in paternity rates; and
! an annual increase of 2.0% in paternity rates.
Three assumptions were made about future Aboriginal and Torres Strait Islander life
expectancy at birth for Australia:
! Aboriginal and Torres Strait Islander life expectancy at birth will increase by 0.2 years
per year for males and 0.15 years per year for females, reaching 72.0 years for males
and 75.9 years for females by 2026. This equates to an increase in life expectancy at
birth of 3 years over the 15 year projection period for males and 2.25 years for
females;
! Aboriginal and Torres Strait Islander life expectancy at birth will increase by 0.3 years
per year for males and 0.25 years per year for females, reaching 73.5 years for males
and 77.4 years for females by 2026. This equates to an increase in life expectancy at
birth of 4.5 years over the 15 year projection period for males and 3.75 years for
females; and
! Aboriginal and Torres Strait Islander life expectancy at birth will increase by 0.5 years
per year for males and 0.45 years per year for females, reaching 76.5 years for males
and 80.4 years for females by 2026. This equates to an increase in life expectancy at
birth of 7.5 years over the 15 year projection period for males and 6.75 years for
females.
PR O J E C T I O N S
Summary of assumptions
A single time series of Aboriginal and Torres Strait Islander estimates for the period 1996
to 2010 has been produced. The assumptions used are summarised below:
! Aboriginal and Torres Strait Islander life expectancy at birth increases by 0.3 years
per year for males and 0.15 years per year for females between 2006 and 2011 and
increases by 0.2 years per year for males and 0.15 years per year females between
1996 and 2006. This assumes Aboriginal and Torres Strait Islander life expectancy at
birth of 65.5 years for males and 71.4 years for females for Australia in 1996;
! net interstate migration for each of the three intercensal periods will be based on
levels observed in each respective intercensal period; and,
! zero net overseas migration occurred across the entire series with no arrivals and
departures.
ES T I M A T E S
Summary of assumptions
12 A B S • ES T I M A T E S A N D P R O J E C T I O N S , A B O R I G I N A L A N D T O R R E S ST R A I T I S L A N D E R A U S T R A L I A N S • 3 2 3 8 . 0 • 2 0 0 1 T O 2 0 2 6
CH A P T E R 2 • A S S U M P T I O N S

By considering likely scenarios of future levels of fertility, paternity, mortality, migration
and using a zero assumption for unexplained growth, 10 projection series were
produced.
Three main series have been selected from these to provide a range, although not the
full range, of projections for analysis and discussion in Chapters 1 and 3. These series are
referred to as series A, B and C. These series are identified as high, medium and low.
Detailed information on these and the remaining projection series are available in the
data cubes for this release on the ABS web site.
Project ion ser ies
As data are required on a financial year basis, life expectancy at birth estimates were
adjusted to account for the six-month period between the midpoint of 2010–2012
(calendar year life expectancy) and 2010–11 (financial year life expectancy). This results
in life expectancy at birth of 69.0 years and 73.6 years for Aboriginal and Torres Strait
Islander males and females respectively for Australia for the year ending 30 June 2011,
which forms the starting point of the life expectancy at birth assumptions.
Additional assumptions regarding the remaining demographic factors for the projections
will be:
! constant interstate migration at levels observed in the 2011 Census;
! zero net overseas migration with no arrivals and no departures; and
! zero unexplained growth in the Aboriginal and Torres Strait Islander population.
Summary of assumptions
cont inue d
A B S • ES T I M A T E S A N D P R O J E C T I O N S , A B O R I G I N A L A N D T O R R E S ST R A I T I S L A N D E R A U S T R A L I A N S • 3 2 3 8 . 0 • 2 0 0 1 T O 2 0 2 6
13
CH A P T E R 2 • A S S U M P T I O N S

The three main series respectively imply a high, medium and low overall growth rate of
the Aboriginal and Torres Strait islander population. It is expected that Series B will be
the most appropriate choice for most users. The Australian Bureau of Statistics will be
using Series B in calculating fertility and mortality rates for inclusion in the annual Births
and Deaths publications.
The population projections are not intended as forecasts or predictions, but are
illustrations of growth and change in the population that would occur if assumptions
made about future demographic trends were to prevail over the projection period.
Which series to use
. . not applicable(a) Levels of interstate migration as observed in the 2011
Census and zero net overseas migration apply to allseries.
(b) Aboriginal and Torres Strait Islander life expectancy atbirth increases by 0.2 years per year for males and0.15 years per year for females, reaching 72.0 yearsfor males and 75.9 years for females by 2026.
(c) Aboriginal and Torres Strait Islander life expectancy atbirth increases by 0.3 years per year for males and0.25 years per year for females, reaching 73.5 yearsfor males and 77.4 years for females by 2026.
(d) Aboriginal and Torres Strait Islander life expectancy atbirth increases by 0.5 years per year for males and0.45 years per year for females, reaching 76.5 yearsfor males and 80.4 years for females by 2026.
. .. .. .Annual decrease of 1%
. .G. .Annual decrease of 0.5%A. .. .Constant
Fertility rates
2% AN N U A L IN C R E A S E IN PA T E R N I T YRA T E S
. .E. .Annual decrease of 1%HBIAnnual decrease of 0.5%
. .D. .ConstantFertility rates
1% AN N U A L IN C R E A S E IN PA T E R N I T YRA T E S
. .. .CAnnual decrease of 1%
. .F. .Annual decrease of 0.5%
. .. .JConstantFertility rates
CO N S T A N T PA T E R N I T Y RA T E S
3(d)2(c)1(b)
LIFE EXPECTANCYAT BIRTH
PROJECT ION SERIES (A- J) , Assumpt ions used(a )2.1Project ion ser ies
cont inue d
14 A B S • ES T I M A T E S A N D P R O J E C T I O N S , A B O R I G I N A L A N D T O R R E S ST R A I T I S L A N D E R A U S T R A L I A N S • 3 2 3 8 . 0 • 2 0 0 1 T O 2 0 2 6
CH A P T E R 2 • A S S U M P T I O N S

Around one-third (30%) of Aboriginal and Torres Strait Islander births registered in 2012
were births for which both parents identified themselves as being of Aboriginal and
Torres Strait Islander origin on the birth registration statement. For 42% of Aboriginal
and Torres Strait Islander births, only the mother was of Aboriginal and Torres Strait
Islander origin (including births where paternity was not acknowledged and those where
the father's Indigenous status was not stated). The remaining 28% of Aboriginal and
Torres Strait Islander births were recorded as having an Aboriginal and Torres Strait
Islander father and a non-Indigenous mother (including births where the mother's
Indigenous status was not stated).
Indigenous status of
parents
The ABS Births collection identifies a birth as being an Aboriginal and/or Torres Strait
Islander person where at least one parent identifies themselves as being of Aboriginal
and Torres Strait Islander origin on the birth registration statement provided to the
relevant state or territory registrar. Therefore Aboriginal and Torres Strait Islander births
can be attributed to either:
! Aboriginal and Torres Strait Islander mothers, including births where both the
mother and father are Aboriginal and Torres Strait Islander; or
! Aboriginal and Torres Strait Islander fathers and non-Indigenous mothers.
For simplicity, birth rates of Aboriginal and Torres Strait Islander mothers are referred to
in this release as fertility rates, while birth rates where the father is Aboriginal and Torres
Strait Islander and the mother's Indigenous status is non-Indigenous or not stated are
referred to as paternity rates.
To produce population projections using the cohort-component method, assumptions
for each year of the projection period are required for age-specific fertility rates,
age-specific paternity rates and the Aboriginal and Torres Strait Islander sex ratio at birth
(the ratio of male to female births, multiplied by 100).
FE R T I L I T Y AN D PA T E R N I T Y
Future uncertainty, along with the subjective nature of assessing current trends, means
that using a range of possible outcomes rather than a single projection series
acknowledges a range of the possible future size, distribution and age structure of
Australia's Aboriginal and Torres Strait Islander population.
There is also some level of uncertainty surrounding 2011 Aboriginal and Torres Strait
Islander Census counts and population estimates on which the projections are based, as
well as data quality issues relating to registered births and deaths of Aboriginal and
Torres Strait Islander people. Information on data quality issues related to Aboriginal and
Torres Strait Islander estimates and projections are available in the Quality Declaration of
this release on the ABS web site.
Which series to use
cont inue d
A B S • ES T I M A T E S A N D P R O J E C T I O N S , A B O R I G I N A L A N D T O R R E S ST R A I T I S L A N D E R A U S T R A L I A N S • 3 2 3 8 . 0 • 2 0 0 1 T O 2 0 2 6
15
CH A P T E R 2 • A S S U M P T I O N S
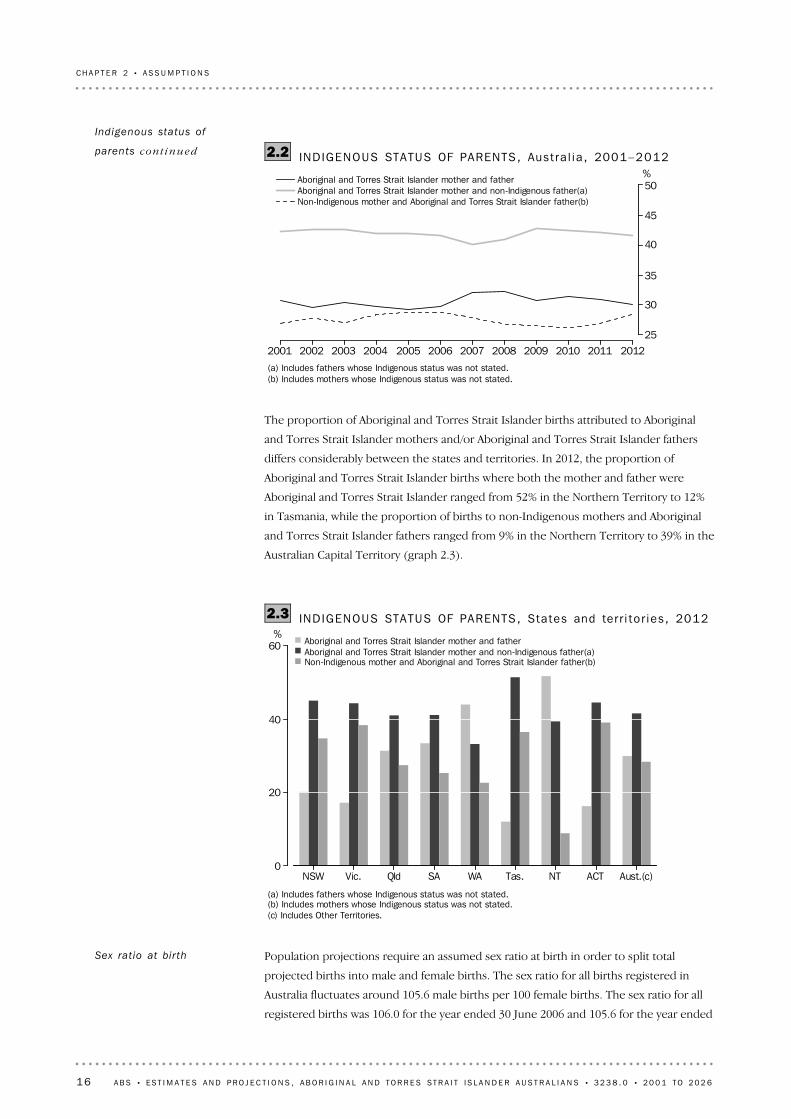
Population projections require an assumed sex ratio at birth in order to split total
projected births into male and female births. The sex ratio for all births registered in
Australia fluctuates around 105.6 male births per 100 female births. The sex ratio for all
registered births was 106.0 for the year ended 30 June 2006 and 105.6 for the year ended
Sex rat io at birth
(a) Includes fathers whose Indigenous status was not stated.(b) Includes mothers whose Indigenous status was not stated.(c) Includes Other Territories.
NSW Vic. Qld SA WA Tas. NT ACT Aust.(c)
%
0
20
40
60 Aboriginal and Torres Strait Islander mother and fatherAboriginal and Torres Strait Islander mother and non-Indigenous father(a)Non-Indigenous mother and Aboriginal and Torres Strait Islander father(b)
INDIGENOUS STATUS OF PARENTS, States and ter r i to r ies , 20122.3
The proportion of Aboriginal and Torres Strait Islander births attributed to Aboriginal
and Torres Strait Islander mothers and/or Aboriginal and Torres Strait Islander fathers
differs considerably between the states and territories. In 2012, the proportion of
Aboriginal and Torres Strait Islander births where both the mother and father were
Aboriginal and Torres Strait Islander ranged from 52% in the Northern Territory to 12%
in Tasmania, while the proportion of births to non-Indigenous mothers and Aboriginal
and Torres Strait Islander fathers ranged from 9% in the Northern Territory to 39% in the
Australian Capital Territory (graph 2.3).
(a) Includes fathers whose Indigenous status was not stated.(b) Includes mothers whose Indigenous status was not stated.
2001 2002 2003 2004 2005 2006 2007 2008 2009 2010 2011 2012
%
25
30
35
40
45
50Aboriginal and Torres Strait Islander mother and fatherAboriginal and Torres Strait Islander mother and non-Indigenous father(a)Non-Indigenous mother and Aboriginal and Torres Strait Islander father(b)
INDIGENOUS STATUS OF PARENTS, Aust ra l i a , 2001–20122.2Indigenous status of
parents cont inu ed
16 A B S • ES T I M A T E S A N D P R O J E C T I O N S , A B O R I G I N A L A N D T O R R E S ST R A I T I S L A N D E R A U S T R A L I A N S • 3 2 3 8 . 0 • 2 0 0 1 T O 2 0 2 6
CH A P T E R 2 • A S S U M P T I O N S

CH I L D R E N EV E R BO R N
Cohort fertility rates, based on the 'children ever born' question asked in the Census of
Population and Housing, illustrate a decline in Aboriginal and Torres Strait Islander
fertility over time.
The number of children ever born provides information on actual fertility outcomes of
women of different ages. In particular, the number of children ever born to women aged
40–44 years can be regarded as a measure of completed fertility; that is, on average how
many children this group of women each had throughout their entire reproductive
lifetimes.
In the 1981 Census, Aboriginal and Torres Strait Islander women aged 40–44 years (born
in 1937–1941) had an average of 4.55 babies per woman. In comparison, Aboriginal and
Torres Strait Islander women aged 40–44 years at the time of the 1986 Census (born in
1942–1946) had an average of 3.97 babies per woman. Those aged 40–44 years at the
time of the 1996 Census (born 1952–1956) had an average of 3.10 babies per woman,
and Aboriginal and Torres Strait Islander women in this age group at the time of the 2006
Census (born in 1962–1966) had fewer children (2.84 babies per woman). The 2011
Trends in fert i l i ty rates
Three main assumptions have been made for future fertility rates of Aboriginal and
Torres Strait Islander women:
! constant fertility rates;
! an annual decline of 0.5% in fertility rates; and
! an annual decline of 1.0% in fertility rates.
These assumptions were primarily chosen on the basis of the declining trend in fertility
as indicated by data from the 'children ever born' question asked in the Census.
The same rate of decline in fertility rates has been assumed for each state and territory,
Indigenous Region, and Remoteness Area; that is, each geographic area is assumed to
experience a 0.5% annual decline in fertility rates over the projection period for Series B.
The effect of alternative fertility assumptions on the number of projected births and size
of the future Aboriginal and Torres Strait Islander population is described in Chapter 4.
FE R T I L I T Y AS S U M P T I O N
(a) Male births per 100 female births.
2006 2008 2010 2012Year ended 30 June
ratio
100
105
110Aboriginal and Torres Strait Islander birthsAll births
SEX RATIO (a) , Aust ra l i a , 2006–20122.4
30 June 2012. While the sex ratio at birth for Aboriginal and Torres Strait Islander births
can be more volatile (graph 2.4), a constant ratio of 105.6 male births per 100 female
births has been assumed for the duration of the projection period.
Sex rat io at birth
cont inue d
A B S • ES T I M A T E S A N D P R O J E C T I O N S , A B O R I G I N A L A N D T O R R E S ST R A I T I S L A N D E R A U S T R A L I A N S • 3 2 3 8 . 0 • 2 0 0 1 T O 2 0 2 6
17
CH A P T E R 2 • A S S U M P T I O N S

TO T A L FE R T I L I T Y RA T E
The total fertility rate (TFR), based on birth registrations, represents the average number
of children a woman could expect to bear during her lifetime if she experienced current
age-specific fertility rates at each age of her reproductive life.
In the early 1960s, based on Census data, the TFR for Aboriginal and Torres Strait
Islander women was 5.8 babies per woman. Since then, fertility levels for Aboriginal and
Torres Strait Islander women have declined substantially, with the largest decreases
being recorded during the 1970s. Fertility of Aboriginal and Torres Strait Islander women
declined to a low of 2.0 babies per woman in 1996, gradually increased to 2.8 in 2010,
before slowly decreasing over the last few years.
(a) Average number of children ever born calculated on assumption that women with six or more children had an average of 6.9 children.(b) The children ever born question was not asked in the 1991 Census.
Source: 1981, 1986, 1996, 2006 and 2011 Censuses of Population and Housing.
15–19 20–24 25–29 30–34 35–39 40–44
no.
0
1
2
3
4
519811986199620062011
AVERAGE NUMBER OF CHILDREN EVER BORN (a) (b ) , Abor ig ina land Tor res Stra i t Is lander women —1981, 1986, 1996, 2006and 2011 Censuses
2.5
CH I L D R E N EV E R BO R N c o n t i n u e d
Census showed that Aboriginal and Torres Strait Islander women in this age group (born
in 1967–1971) had even fewer children (2.63 babies per woman).
As indicated in graph 2.5, the average number of children ever born to Aboriginal and
Torres Strait Islander women has been declining for each age group over the past three
decades. These declines, particularly in the younger age groups, indicate probable
declines in the future overall level of Aboriginal and Torres Strait Islander fertility.
In the 1981 Census, Aboriginal and Torres Strait Islander women aged 25–29 years (born
in 1952–1956) had an average of 2.58 children ever born. In comparison, Aboriginal and
Torres Strait Islander women aged 25–29 years at the time of the 1986 Census (born in
1957–1961) had an average of 2.20 babies per woman. Those aged 25–29 years at the
time of the 1996 Census (born in 1967–1971) had an average of 1.88 babies per woman,
and Aboriginal and Torres Strait Islander women in this age group at the time of the 2006
Census (born in 1977–1981) had an average of 1.73 babies per woman. In 2011, women
in this age group (born in 1982–1986) had an average of 1.49 babies per woman.
Trends in fert i l i ty rates
cont inue d
18 A B S • ES T I M A T E S A N D P R O J E C T I O N S , A B O R I G I N A L A N D T O R R E S ST R A I T I S L A N D E R A U S T R A L I A N S • 3 2 3 8 . 0 • 2 0 0 1 T O 2 0 2 6
CH A P T E R 2 • A S S U M P T I O N S

Assumed age-specific fertility rates for Aboriginal and Torres Strait Islander women are
based on three years of birth registrations (2010 to 2012) in order to minimise the effect
of year-to-year fluctuations in registrations. These rates were adjusted to produce
plausible numbers of projected births in the first year of the projection period in
accordance with Aboriginal and Torres Strait Islander population estimates at younger
ages.
Method used to produce
fert i l i ty assumptions
In summary, while fertility rates based on birth registrations of Aboriginal and Torres
Strait Islander children may provide some evidence for assuming constant or increasing
Aboriginal and Torres Strait Islander fertility, cohort fertility rates based on the 'children
ever born' question asked in the Census indicate long-term declines. Assumptions that
take both sets of evidence into account have been made but with more emphasis given
to the 'children ever born' data. Given the long-term trend of declining fertility in Census
data, three assumptions including a constant fertility rate and decreasing fertility rates
were chosen. The magnitude and duration of any future changes in fertility rates are not
possible to gauge accurately.
Choice of fert i l i ty
assumption
(a) Births per woman.(b) Five-year TFRs (from 1961–66 to 1981–86) and ten-year TFR 1986–96 plotted against the middle year of the period.
Source: Births, Australia, 2012 (cat. no. 3301.0)
Gray A 1997, The Explosion of Aboriginality: Components of Indigenous Population Growth
1991-1996, Discussion Paper no. 142/1997, Centre for Aboriginal Economic PolicyResearch, Australian National University, Canberra
1962 1967 1972 1977 1982 1987 1992 1997 2002 2007 2012
rate
1
2
3
4
5
6Aboriginal and Torres Strait Islander women, census data(b)Aboriginal and Torres Strait Islander women, birth registrationsAll women
TOTAL FERTIL I TY RATES (a) , Aust ra l i a , 1962–20122.6
TO T A L FE R T I L I T Y RA T E c o n t i n u e d
Graph 2.6 presents TFRs for Aboriginal and Torres Strait Islander and all women for the
period 1961–1966 to 2012. Due to the limited availability and variable quality of historical
Aboriginal and Torres Strait Islander birth registration data, fertility rates of Aboriginal
and Torres Strait Islander women up to 1991 were derived using data collected in the
Australian Censuses (Gray, 1997). With improvements in coverage, birth registration data
has been used for 1996 onwards.
The TFRs for Aboriginal and Torres Strait Islander women for the period 1996 to 2012
were derived using the number of births registered to Aboriginal and Torres Strait
Islander mothers, and estimates of the female Aboriginal and Torres Strait Islander
population. As these estimates are derived from different censuses, TFRs for Aboriginal
and Torres Strait Islander women for 1996 to 2012 are not strictly comparable.
Trends in fert i l i ty rates
cont inue d
A B S • ES T I M A T E S A N D P R O J E C T I O N S , A B O R I G I N A L A N D T O R R E S ST R A I T I S L A N D E R A U S T R A L I A N S • 3 2 3 8 . 0 • 2 0 0 1 T O 2 0 2 6
19
CH A P T E R 2 • A S S U M P T I O N S

Adjustment factors were calculated for each state and territory by taking the ratio of the
number of Aboriginal and Torres Strait Islander children aged 0, 1 and 2 at 30 June 2011
to the number of births registered between 2010 and 2012. Differences in the two
sources can be attributed to several factors. These include net undercount, Census
records for which Indigenous status was not stated, lags in the registration of births and
differences in the method of identification between the Census and the Birth
Registrations collection (for example, a child born to an Aboriginal and Torres Strait
Islander and non-Indigenous parent is automatically identified as Aboriginal and Torres
Strait Islander in birth registrations, however the child may be identified as
non-Indigenous on the Census form). For each state and territory, the 2010–2012
age-specific fertility rates were then multiplied by the relevant adjustment factor to
produce adjusted age-specific fertility rates.
In addition, as rates are required on a financial year basis, they were adjusted to account
for the six-month period between the mid-point of the period 2010–2012 (calendar year
fertility rates) and 2011–12 (financial year fertility rates).
Although there is some evidence of greater declines in fertility in the younger age groups
relative to older age groups, analysis suggests that incorporating this trend into the
fertility assumptions would have a negligible effect on the future size of the Aboriginal
and Torres Strait Islander population. Therefore, the assumed 0.5% annual decline in
fertility rates for Series B is applied uniformly across relevant age groups.
Method used to produce
fert i l i ty assumptions
cont inue d
20 A B S • ES T I M A T E S A N D P R O J E C T I O N S , A B O R I G I N A L A N D T O R R E S ST R A I T I S L A N D E R A U S T R A L I A N S • 3 2 3 8 . 0 • 2 0 0 1 T O 2 0 2 6
CH A P T E R 2 • A S S U M P T I O N S

I N D I G E N O U S RE G I O N S
In some previously published ABS projections of the Aboriginal and Torres Strait Islander
population, fertility assumptions for sub-state geographies used the corresponding state
and territory level assumption. The projections presented in this release apply fertility
assumptions for sub-state geographies by aggregating Indigenous Regions (IREGs) into
two groups for each state and territory (except Tasmania and the Australian Capital
Territory):
! capital city IREG (for example, Adelaide IREG); and,
! rest of state/territory IREGs combined (for example, Port Augusta IREG and Port
Lincoln - Ceduna IREG combined).
Fertility rates for each of these groups were adjusted in a similar manner to state and
territory rates to produce plausible numbers of projected births in the first year of the
projection period in accordance with Aboriginal and Torres Strait Islander population
estimates at younger ages.
Regional var iat ions in
fert i l i ty
(c) Includes births to mothers aged less than 15 years.(d) Includes births to mothers aged 50 years and over.(e) Includes Other Territories.
— nil or rounded to zero (including null cells)(a) Births per 1,000 Aboriginal and Torres Strait Islander
women.(b) Births per Aboriginal and Torres Strait Islander woman.
2.090.68.938.280.6109.9119.161.6Aust.(e)
1.563.65.462.557.582.355.345.8ACT2.080.28.433.274.098.6120.780.4NT1.84—8.134.078.1104.699.243.2Tas.2.000.87.833.470.4102.6114.571.5WA2.00—5.736.076.5101.8118.960.5SA2.330.810.242.788.3119.8135.569.1Qld1.891.111.647.980.1104.287.944.3Vic.2.050.38.636.382.7113.0117.751.0NSW
YE A R EN D E D 30 JU N E 20 2 6
2.250.69.541.086.5117.9127.866.1Aust.(e)
1.683.85.867.161.788.359.349.1ACT2.230.29.035.779.4105.8129.586.2NT1.97—8.736.583.8112.2106.446.3Tas.2.150.88.335.875.6110.0122.876.7WA2.14—6.138.782.0109.2127.664.9SA2.500.811.045.894.7128.6145.374.1Qld2.021.212.451.485.9111.894.347.5Vic.2.200.49.238.988.7121.2126.354.7NSW
YE A R EN D E D 30 JU N E 20 1 2
45-49(d)40-4435-3930-3425-2920-2415-19(c) TFR(b)
AGE-SPECIFIC FERTILITY RATES(a)
ASSUMED FERTIL ITY RATES, States and ter r i to r ies2.7
A B S • ES T I M A T E S A N D P R O J E C T I O N S , A B O R I G I N A L A N D T O R R E S ST R A I T I S L A N D E R A U S T R A L I A N S • 3 2 3 8 . 0 • 2 0 0 1 T O 2 0 2 6
21
CH A P T E R 2 • A S S U M P T I O N S

Three main assumptions have been made for future paternity rates of Aboriginal and
Torres Strait Islander men where the mother's Indigenous status was non-Indigenous or
not stated:
! constant paternity rates;
! an annual increase of 1.0% in paternity rates; and
! an annual increase of 2.0% in paternity rates.
PA T E R N I T Y AS S U M P T I O N
(a) Births per Aboriginal and Torres StraitIslander woman.
(b) Includes Other Territories.
2.092.25Australia(b)
2.252.41Remote and Very Remote2.292.45Inner and Outer Regional1.791.92Major Cities
30
June
2026
30
June
2012
ASSUMED TOTAL FERTIL ITY RATES (a) , Remoteness Areas2.9
RE M O T E N E S S AR E A S
Assumed fertility rates for Remoteness Areas were calculated and adjusted using the
same technique as for the states and territories.
(a) Births per Aboriginal and TorresStrait Islander woman.
(b) Includes Other Territories.
2.092.25Australia(b)
1.561.68ACT IREG2.142.30Rest of NT1.902.04Darwin IREG1.841.97Tasmania IREG2.142.29Rest of WA1.801.93Perth IREG1.942.08Rest of SA2.002.15Adelaide IREG2.532.71Rest of Qld1.962.11Brisbane IREG2.182.34Rest of Vic.1.541.66Melbourne IREG2.192.35Rest of NSW1.761.89Sydney IREG
30
June
2026
30
June
2012
ASSUMED TOTAL FERTIL I TY RATES (a) , Ind igenous Reg ions2.8
I N D I G E N O U S RE G I O N S c o n t i n u e dRegional var iat ions in
fert i l i ty cont inued
22 A B S • ES T I M A T E S A N D P R O J E C T I O N S , A B O R I G I N A L A N D T O R R E S ST R A I T I S L A N D E R A U S T R A L I A N S • 3 2 3 8 . 0 • 2 0 0 1 T O 2 0 2 6
CH A P T E R 2 • A S S U M P T I O N S

Assumed paternity rates were calculated using the same method as that used for
assumed fertility rates. This involved the calculation of age-specific paternity rates based
on 2010–2012 registered births to Aboriginal and Torres Strait Islander fathers where the
mother's Indigenous status is non-Indigenous or not stated, which were then adjusted to
ensure consistency with the Aboriginal and Torres Strait Islander population at younger
ages. The assumption of a 1.0% annual increase in paternity rates for Series B was
applied consistently across the relevant age groups.
Method used to produce
paternity assumptions
(a) Births to Aboriginal and Torres Strait Islander men, where the mother's Indigenous status was non-Indigenous or not stated, per Aboriginal and Torres Strait Islander man. The TPR is calculated in the same way as the TFR.
1998 2000 2002 2004 2006 2008 2010 2012
0.6
0.8
1.0
1.2
TOTAL PATERNITY RATES (a) , Aust ra l i a , 1998–20122.10
As with the TFR, the time series of the TPR (graph 2.10) is based on population estimates
which are not strictly comparable over time. Based on birth registrations, the TPR has
been slowly increasing over the past decade, from 0.83 births per Aboriginal and Torres
Strait Islander man in 1998 to 1.19 in 2012.
Paternity rates prior to 1998 are not available as information on births to Aboriginal and
Torres Strait Islander fathers was not available for all states and territories, and no
'children ever born' question is asked of males in the Census.
Trends in paternity rates
The total paternity rate (TPR) is defined in this release as the average number of
Aboriginal and Torres Strait Islander babies born per Aboriginal and Torres Strait Islander
father where the mother's Indigenous status is non-Indigenous or not stated, and is
calculated in the same way as the TFR.
The same rate of increase in paternity rates has been assumed for each state and
territory, Indigenous Region, and Remoteness Area; that is, each geographic area is
assumed to experience a 1.0% annual increase in paternity rates over the projection
period for Series B.
The effect of alternative paternity assumptions on the number of projected births and
size of the future Aboriginal and Torres Strait Islander population is described in
Chapter 4.
PA T E R N I T Y AS S U M P T I O N
c o n t i n u e d
A B S • ES T I M A T E S A N D P R O J E C T I O N S , A B O R I G I N A L A N D T O R R E S ST R A I T I S L A N D E R A U S T R A L I A N S • 3 2 3 8 . 0 • 2 0 0 1 T O 2 0 2 6
23
CH A P T E R 2 • A S S U M P T I O N S

I N D I G E N O U S RE G I O N S
Assumed paternity rates for IREGs were calculated and adjusted in the same way as for
the states and territories.
Regional var iat ions in
paternity
(a) Births to Aboriginal and Torres Strait Islander men, where the mother's Indigenous status wasnon-Indigenous or not stated, per 1,000 Aboriginal and Torres Strait Islander men.
(b) Births to Aboriginal and Torres Strait Islander men, where the mother's Indigenous status wasnon-Indigenous or not stated, per Aboriginal and Torres Strait Islander man.
(c) Includes births to fathers aged less than 15 years.(d) Includes births to fathers aged 50 years and over.(e) Includes Other Territories.
1.089.014.932.552.754.941.710.6Aust.(e)
1.4419.925.467.863.665.337.69.3ACT0.263.44.18.612.812.97.71.7NT1.6215.317.649.566.085.073.616.0Tas.0.775.911.220.838.638.729.58.8WA0.966.314.631.945.849.334.910.1SA1.088.013.429.752.555.746.310.5Qld1.5613.725.350.378.378.553.412.5Vic.1.4411.819.344.872.473.751.713.3NSW
YE A R EN D E D 30 JU N E 20 2 6
0.947.812.928.245.947.836.29.2Aust.(e)
1.2617.322.159.055.456.832.78.1ACT0.223.03.57.511.111.26.71.4NT1.4013.315.343.157.473.964.013.9Tas.0.675.19.818.133.633.725.77.7WA0.845.512.727.739.842.930.38.8SA0.947.011.725.945.748.440.39.1Qld1.3612.022.043.768.168.346.510.9Vic.1.2510.316.839.063.064.145.011.6NSW
YE A R EN D E D 30 JU N E 20 1 2
45-49(d)40-4435-3930-3425-2920-2415-19(c) TPR(b)
AGE-SPECIFIC PATERNITY RATES(a)
ASSUMED PATERNITY RATES, States and ter r i to r ies2.11Method used to produce
paternity assumptions
cont inue d
24 A B S • ES T I M A T E S A N D P R O J E C T I O N S , A B O R I G I N A L A N D T O R R E S ST R A I T I S L A N D E R A U S T R A L I A N S • 3 2 3 8 . 0 • 2 0 0 1 T O 2 0 2 6
CH A P T E R 2 • A S S U M P T I O N S

To produce population projections using the cohort-component method, life tables are
required for each year of the projection period. These are calculated in two steps:
! life expectancy at birth for each projection year is assumed; and
MO R T A L I T Y AS S U M P T I O N S
(a) Births to Aboriginal and Torres Strait Islandermen, where the mother's Indigenous statuswas non-Indigenous or not stated, perAboriginal and Torres Strait Islander man.
(b) Includes Other Territories.
1.080.94Australia(b)
0.290.25Remote and Very Remote1.291.12Inner and Outer Regional1.381.20Major Cities
30
June
2026
30
June
2012
ASSUMED TOTAL PATERNITY RATES (a) , Remoteness Areas2.13
RE M O T E N E S S AR E A S
Assumed paternity rates for Remoteness Areas were calculated and adjusted using the
same technique as for the states and territories.
(a) Births to Aboriginal and TorresStrait Islander men, where themother's Indigenous status isnon-Indigenous or not stated, perAboriginal and Torres StraitIslander man.
(b) Includes Other Territories.
1.080.94Australia(b)
1.441.26ACT IREG0.110.10Rest of NT0.740.64Darwin IREG1.621.40Tasmania IREG0.600.52Rest of WA1.040.91Perth IREG0.440.38Rest of SA1.281.11Adelaide IREG0.900.78Rest of Qld1.451.26Brisbane IREG1.801.56Rest of Vic.1.401.22Melbourne IREG1.491.29Rest of NSW1.351.17Sydney IREG
30
June
2026
30
June
2012
ASSUMED TOTAL PATERNITY RATES (a) , Ind igenous Reg ions2.12
I N D I G E N O U S RE G I O N S c o n t i n u e dRegional var iat ions in
paternity cont inued
A B S • ES T I M A T E S A N D P R O J E C T I O N S , A B O R I G I N A L A N D T O R R E S ST R A I T I S L A N D E R A U S T R A L I A N S • 3 2 3 8 . 0 • 2 0 0 1 T O 2 0 2 6
25
CH A P T E R 2 • A S S U M P T I O N S

The ABS has compiled life tables for Aboriginal and Torres Strait Islander Australians
following the 1996, 2001, 2006 and 2011 Censuses of Population and Housing. Due to
changes in methods, the 2006 and 2011 estimates of life expectancy at birth are not
comparable to estimates for earlier periods. Assumptions about future levels of
Aboriginal and Torres Strait Islander life expectancy at birth can therefore only be based
on observed trends over the most recent intercensal period.
A recent study (Wilson, Condon and Barnes, 2007) found evidence that life expectancy at
birth of Aboriginal and Torres Strait Islander people living in the Northern Territory has
improved, increasing from 52 years for males and 54 years for females in the late 1960s to
around 60 years for males and 68 years for females in recent years. The study found that
improvements in infant mortality contributed considerably to increases in life expectancy
at birth, particularly between the late 1960s and mid-1980s. Since then, life expectancy
gains have been largely the result of improving mortality of Aboriginal and Torres Strait
Islander people aged 45 years and over.
In addition, alternative measures indicate some improvement in mortality of Aboriginal
and Torres Strait Islander Australians over time. For example, declines in Aboriginal and
Torres Strait Islander mortality, as measured by age-standardised death rates, have been
recorded for both males and females in Western Australia, and females in the Northern
Territory between 1991 and 2005. Declines in Aboriginal and Torres Strait Islander infant
mortality have also been recorded in Western Australia, South Australia and the Northern
Territory over the period (see The Health and Welfare of Australia's Aboriginal and
Trends in life expectancy
at birth
At the national level, Aboriginal and Torres Strait Islander life expectancy at birth for the
period 2010–2012 is estimated to be 69.1 years for males and 73.7 years for females (see
Life Tables for Aboriginal and Torres Strait Islander Australians, 2010–2012,
cat. no. 3302.0.55.003).
As survivorship ratios are required on a financial year basis, life expectancy at birth
estimates were adjusted to account for the six-month period between the midpoint of
2010–2012 (calendar year life expectancy) and 2010–11 (financial year life expectancy),
resulting in life expectancy at birth of 69.0 years for Aboriginal and Torres Strait Islander
males and 73.6 years for Aboriginal and Torres Strait Islander females for Australia for the
year ending 30 June 2011, which form the starting point of the life expectancy at birth
assumptions.
Current life expectancy at
birth
! life tables, based on the 2010–2012 age/sex structure of mortality, are generated to
match the assumed life expectancies at birth.
Survivorship ratios from the life tables are then applied to the population by single year
of age and sex.
Assumptions for mortality at lower geographical levels are based on 2010–2012
differentials between Australia and each state or territory, groups of Indigenous Regions,
and Remoteness Areas.
The effect of alternative life expectancy at birth assumptions on the number of projected
deaths and size of the future Aboriginal and Torres Strait Islander population is
described in Chapter 4.
MO R T A L I T Y AS S U M P T I O N S
c o n t i n u e d
26 A B S • ES T I M A T E S A N D P R O J E C T I O N S , A B O R I G I N A L A N D T O R R E S ST R A I T I S L A N D E R A U S T R A L I A N S • 3 2 3 8 . 0 • 2 0 0 1 T O 2 0 2 6
CH A P T E R 2 • A S S U M P T I O N S

Aboriginal and Torres Strait Islander life expectancy at the national level has been
calculated using an age-specific adjustment to allow for different patterns in mortality
amongst different age groups. This adjustment could not be applied at the state and
territory level. For this reason the Australia-level estimates are not strictly comparable
with the state/territory level estimates. However, for the purpose of compiling estimates
and projections, mortality differentials are calculated based on the relationship of
2010-2012 life expectancies at birth for each state/territory (without age adjustment)
compared with Australia (with age adjustment).
Aboriginal and Torres Strait Islander life expectancy at birth differs between the states
and territories. For the purposes of these projections, mortality differentials between
each state/territory and Australia are calculated and applied to the assumed Australian life
expectancies at birth (table 2.14) to obtain assumed life expectancy at birth for the states
and territories. This method assumes that the mortality differentials, based on those
observed during 2010–2012, will remain constant throughout the projection period.
State/terr i tory var iat ions
in mortal i ty
Three life expectancy at birth assumptions have been used to produce the three main
series.
! The first assumption is that Aboriginal and Torres Strait Islander life expectancy at
birth will increase at the rate of 0.2 years per year for males and 0.15 years per year
for females. This is close to the improvement currently being observed in the total
Australia population. Based on this assumption, life expectancy would increase to
72.0 years for males and 75.9 years for females over the projection period.
! The second mortality assumption is that Aboriginal and Torres Strait Islander life
expectancy at birth will increase by 0.3 years per year for males and 0.25 years per
year for females from 2010–11 levels. This level of improvement assumes that
Aboriginal and Torres Strait Islander life expectancy at birth will increase at a faster
rate than total Australian life expectancy (as assumed in the medium mortality
assumption, Population Projections, Australia, 2006 to 2101, cat. no. 3222.0),
resulting in a narrowing of the difference between Aboriginal and Torres Strait
Islander and total Australian life expectancy at birth throughout the projection
period. Based on this assumption, male life expectancy at birth would increase by
4.5 years and female life expectancy would increase by 3.75 years over the 15-year
projection period, reaching 73.5 and 77.4 years respectively in 2026.
! The third mortality assumption is that Aboriginal and Torres Strait Islander life
expectancy at birth will increase at the rate of 0.5 years per year for males and 0.45
years per year for females from 2010–11 levels. Based on this assumption, male life
expectancy at birth would increase by 7.5 years and female life expectancy would
increase by 6.75 years over the 15 year projection period, reaching 76.5 and 80.4
years respectively in 2026.
Assumed life expectancy
at birth
Torres Strait Islander Peoples, Oct 2010, cat. no. 4704.0, Wang Z and Li SQ, 2010,
Mortality in the Northern Territory 1967-2006, Health Gains Planning Information
Sheet, Dec 2010, Northern Territory Government, Casuarina NT and SCRGSP (Steering
Committee for the Review of Government Service Provision) 2011, Overcoming
Indigenous Disadvantage: Key Indicators 2011, Productivity Commission, Canberra).
Trends in life expectancy
at birth cont inue d
A B S • ES T I M A T E S A N D P R O J E C T I O N S , A B O R I G I N A L A N D T O R R E S ST R A I T I S L A N D E R A U S T R A L I A N S • 3 2 3 8 . 0 • 2 0 0 1 T O 2 0 2 6
27
CH A P T E R 2 • A S S U M P T I O N S

I N D I G E N O U S RE G I O N S
To apply assumptions on life expectancy at birth for alternative geographies, Indigenous
Regions (IREGs) were aggregated into two groups for each state and territory (except
Tasmania and the Australian Capital Territory):
! capital city IREG (for example, Adelaide IREG); and,
! rest of state/territory IREGs combined (for example, Port Augusta IREG and Port
Lincoln - Ceduna IREG combined).
To account for under-identification of deaths of Aboriginal and Torres Strait Islander
people at the smaller geographic level, the number of registered deaths of Aboriginal and
Torres Strait Islander people for each IREG group in 2010–2012 was adjusted using state
and territory adjustment factors from the 2011 Census Data Enhancement (CDE)
Indigenous Mortality Study. For more information about the derivation and use of
adjustment factors in the compilation of Aboriginal and Torres Strait Islander life tables
for the states and territories, see Life Tables for Aboriginal and Torres Strait Islander
Australians, 2010–2012 (cat. no. 3302.0.55.003).
A life table methodology was used to obtain life expectancy at birth for 2010–2012 for
each IREG group using adjusted deaths in conjunction with 2011 Aboriginal and Torres
Strait Islander populations for each IREG group. Differentials were calculated as the ratio
of Aboriginal and Torres Strait Islander life expectancy at birth for each IREG group and
Regional var iat ions in
mortal i ty
(a) Mortality differentials are calculated based on the relationship of2010–2012 life expectancies at birth for each state/territory(without age adjustment), compared with Australia (with ageadjustment).
(b) Includes Other Territories.
10010073.769.1Australia(b)
939268.763.4Northern Territory959470.265.0Western Australia
1019974.468.7Queensland10110274.670.5New South Wales
%%yearsyears
FemalesMalesFemalesMales
MORTALITYDIFFERENTIALS
LIFE EXPECTANCYAT BIRTH
ABORIGINAL AND TORRES STRAIT ISLANDER LIFE EXPECTANCYAT BIRTH AND MORTAL ITY DIFFERENT IALS (a) , States andter r i to r ies —2010– 2012
2.14
Aboriginal and Torres Strait Islander life expectancy at birth for 2010–2012 is available for
New South Wales, Queensland, Western Australia and the Northern Territory. Due to
small numbers of deaths registered as Aboriginal and Torres Strait Islander it was not
possible to produce Aboriginal and Torres Strait Islander life tables for the remaining
jurisdictions. For the purposes of the projections, life expectancy at birth for Victoria and
Tasmania is assumed to be the same as that for New South Wales, while life expectancy
at birth for South Australia is assumed to be the same as that for Western Australia. Life
expectancy at birth for the Australian Capital Territory is assumed to be the same as that
derived for Sydney Indigenous Region.
State/terr i tory var iat ions
in mortal i ty cont inue d
28 A B S • ES T I M A T E S A N D P R O J E C T I O N S , A B O R I G I N A L A N D T O R R E S ST R A I T I S L A N D E R A U S T R A L I A N S • 3 2 3 8 . 0 • 2 0 0 1 T O 2 0 2 6
CH A P T E R 2 • A S S U M P T I O N S

As noted above, Aboriginal and Torres Strait Islander life tables were not produced for
Victoria, South Australia, Tasmania and the Australian Capital Territory. The following
differentials have been used for IREG groups in these states and territories where
sufficient data is not available to calculate a relevant differential:
! for Victoria, Melbourne IREG uses the Sydney IREG differential, and rest of Victoria
IREG uses the rest of New South Wales IREG group differential;
! for South Australia, Adelaide IREG uses the Perth IREG differential, and the rest of
South Australia IREG group uses the rest of Western Australia IREG group
differential;
! for Tasmania, the New South Wales state differential is used; and
! for the Australian Capital Territory, the Sydney IREG differential is used.
RE M O T E N E S S AR E A S
Aboriginal and Torres Strait Islander life expectancy at birth differentials for Remoteness
Areas were calculated using the same method as that used for IREG groups (table 2.16).
To account for the under-identification in deaths of Aboriginal and Torres Strait Islander
people, the number of registered deaths of Aboriginal and Torres Strait Islander people
in 2010–2012 for each Remoteness Area was adjusted using Australia-level adjustment
factors from the CDE Indigenous Mortality Study. As with IREGs this method assumes
(a) Mortality differentials based on the relationship of2010–2012 life expectancies at birth for each capital cityIREG and rest of state IREG group, compared withAustralian life expectancy (with age adjustment) of 69.1years for males and 73.7 years for females.
(b) Includes Other Territories.
100100100100Australia(b)
92959194Northern Territory941009397Western Australia
10110398103Queensland99105100106New South Wales
%%%%
Rest
of
state
IREG
group
Capital
city
IREG
Rest
of
state
IREG
group
Capital
city
IREG
FEMALEMORTALITYDIFFERENTIALS
MALEMORTALITYDIFFERENTIALS
ABORIGINAL AND TORRES STRAIT ISLANDER LIFE EXPECTANCYAT BIRTH AND MORTAL ITY DIFFERENT IALS (a) , Ind igenousReg ions —2010– 2012
2.15
I N D I G E N O U S RE G I O N S c o n t i n u e d
Australia with age adjustment (table 2.15). This method assumes that
under-identification of Aboriginal and Torres Strait Islander deaths is consistent across all
regions within each state and territory as information on under-identification is not
available at the IREG level. Mortality differentials are assumed to remain constant
throughout the projection period.
Regional var iat ions in
mortal i ty cont inued
A B S • ES T I M A T E S A N D P R O J E C T I O N S , A B O R I G I N A L A N D T O R R E S ST R A I T I S L A N D E R A U S T R A L I A N S • 3 2 3 8 . 0 • 2 0 0 1 T O 2 0 2 6
29
CH A P T E R 2 • A S S U M P T I O N S

The 2011 Census 'place of usual residence five years ago' question showed that 21,345
Aboriginal and Torres Strait Islander people changed their state or territory of usual
residence between 2006 and 2011. Between 2001 and 2006, 18,445 Aboriginal and Torres
Strait Islander people changed their state or territory of usual residence. The previous
2001 Census showed that 18,671 Aboriginal and Torres Strait Islander people changed
their state or territory of usual residence between 1996 and 2001.
This measure was unable to account for Aboriginal and Torres Strait Islander children
under five years of age on Census Night, people whose place of usual residence five years
ago was overseas, and people whose state or territory of usual residence five years ago
was not recorded. In addition, Aboriginal and Torres Strait Islander people overseas on
Census Night, were not counted in the Census.
Trends in interstate
migrat ion
One assumption has been made for future net internal migration of Aboriginal and
Torres Strait Islander people:
! constant levels of migration as observed in the 2011 Census of Population and
Housing based on address 5 years ago.
I N T E R S T A T E M I G R A T I O N
AS S U M P T I O N
(a) Mortality differentials based on the relationshipof 2010–2012 life expectancies at birth foreach Remoteness Area, compared withAustralian life expectancy (with age adjustment)of 69.1 years for males and 73.7 years forfemales.
(b) Includes Other Territories.
100100Australia(b)
9290Remote and Very Remote102103Inner and Outer Regional104105Major Cities
%%
FemalesMales
MORTAL ITY DIFFERENT IALS (a) , Remoteness Areas —2010–20122.16
RE M O T E N E S S AR E A S c o n t i n u e d
that under-identification of Aboriginal and Torres Strait Islander deaths across
Remoteness Areas is consistent across Australia. Mortality differentials are assumed to
remain constant throughout the projection period.
Investigation into using adjustment factors for three categories of Remoteness Areas
(Major Cities, Inner and Outer Regional combined and Remote and Very Remote
combined) was undertaken, but insufficient data was available to accurately calculate
reliable factors at this level.
Regional var iat ions in
mortal i ty cont inued
30 A B S • ES T I M A T E S A N D P R O J E C T I O N S , A B O R I G I N A L A N D T O R R E S ST R A I T I S L A N D E R A U S T R A L I A N S • 3 2 3 8 . 0 • 2 0 0 1 T O 2 0 2 6
CH A P T E R 2 • A S S U M P T I O N S

The age/sex profile of interstate migration was derived from the 'place of usual residence
one year ago' question from the 2011 Census. Arrival and departure rates for the states
and territories were calculated by single year of age and sex and adjustments were made
where appropriate to ensure the age/sex profiles of projected populations were
plausible. All age/sex arrival and departure disaggregations were constrained by the net
internal migration assumption at the state/territory level.
Age/sex prof i le of
interstate migrat ion
State or territory of usual residence on Census Night was cross-tabulated with state or
territory of usual residence five years ago to obtain net interstate migration for each state
and territory for 2006–2011 (table 2.17).
These figures are affected by a number of data quality issues, including Census net
undercount and records for which Indigenous status was not stated. To account for
these, net interstate migration estimates were adjusted by a proportion calculated by
dividing Aboriginal and Torres Strait Islander population estimates by Aboriginal and
Torres Strait Islander Census counts, for each state and terrritory.
The adjusted net interstate migration estimates were then divided by five to obtain
annual movements, which were assumed to remain constant over the projection period
(table 2.18). In addition, they were used as constraints on migration assumptions for
Indigenous Regions and Remoteness Areas, that is, migration levels were not allowed to
exceed the state totals.
Method used to produce
interstate migrat ion
assumption
. . not applicable(a) Aboriginal and Torres Strait Islander children under five years of age on Census Nights were excluded, as
were people whose place of usual residence five years ago was overseas, and people whose state orterritory of usual residence five years ago was not recorded.
(b) Includes Other Territories.Note: Totals and components may not be consistent within and between tables due to introduced random error
to protect confidentiality of Census respondents - see Census Dictionary, 2011 (cat. no. 2901.0).
. .150–790–502953251 211832–1 997Net movements
21 3459321 8307792 2351 6136 4352 8934 592Total arrivals(b)782. .448142219450443ACT
2 62058. .64456550956261275NT8291937. .12447283175144Tas.
1 9404042795. .225505329316WA1 2881726851219. .272230231SA5 224177660278683296. .6942 436Qld2 06140123120257204578. .739Vic.6 5895812711634782693 6471 154. .NSW
ACTNTTas.WASAQldVic.NSW
Total
departures(b)
STATE/TERRITORY OF ARRIVAL
STATE / TERR I TORY
OF DEPARTURE
INTERSTATE ARRIVALS AND DEPARTURES (a) —2006– 20112.17Trends in interstate
migrat ion cont inued
A B S • ES T I M A T E S A N D P R O J E C T I O N S , A B O R I G I N A L A N D T O R R E S ST R A I T I S L A N D E R A U S T R A L I A N S • 3 2 3 8 . 0 • 2 0 0 1 T O 2 0 2 6
31
CH A P T E R 2 • A S S U M P T I O N S

Annual net migration estimates for each IREG were calculated in the same way as for the
states and territories, and were assumed to remain constant over the 15-year projection
period (table 2.19).
Arrival and departure rates were calculated for each IREG by single year of age and sex.
These were then constrained to the state or territory net migration levels and were
assumed to remain constant over the projection period. Further adjustments were made
where appropriate to ensure the age/sex profiles of the projected populations of IREGs
were plausible.
Indigenous Regions
migrat ion
Note: Totals and components may not be consistent within and between tables due to introduced random errorto protect confidentiality of Census respondents - see Census Dictionary, 2011 (cat. no. 2901.0).
33–164–97155297220–503Annual net migration
personspersonspersonspersonspersonspersonspersonspersons
ACTNTTas.WASAQldVic.NSW
ASSUMED NET INTERSTATE MIGRAT ION2.18Age/sex prof i le of
interstate migrat ion
cont inue d
32 A B S • ES T I M A T E S A N D P R O J E C T I O N S , A B O R I G I N A L A N D T O R R E S ST R A I T I S L A N D E R A U S T R A L I A N S • 3 2 3 8 . 0 • 2 0 0 1 T O 2 0 2 6
CH A P T E R 2 • A S S U M P T I O N S

Annual net migration estimates for each Remoteness Area were calculated in the same
way as for the states and territories, and were assumed to remain constant over the
15-year projection period (table 2.20).
Arrival and departure rates were calculated for each Remoteness Area by single year of
age and sex and were assumed to remain constant over the projection period. Further
adjustments were made where appropriate to ensure that the age/sex profiles of the
projected populations of Remoteness Areas were plausible.
Remoteness Areas
migrat ion
33Australian Capital Territory
–32Tennant Creek100Nhulunbuy
–209Katherine72Jabiru - Tiwi
–68Darwin–89Apatula62Alice Springs
–9Tasmania
–41West Kimberley95South-Western WA91South Hedland36Perth
–67Kununurra26Kalgoorlie
–76Geraldton7Broome
3Port Lincoln - Ceduna–17Port Augusta69Adelaide
58Townsville - Mackay–179Torres Strait
–24Toowoomba - Roma143Rockhampton
–115Mount Isa–147Cape York305Cairns - Atherton256Brisbane
149Victoria exc. Melbourne71Melbourne
–348Sydney - Wollongong21South-Eastern NSW
–51Riverina - Orange131NSW Central and North Coast
–102North-Western NSW–90North-Eastern NSW–64Dubbo
persons
Annual
net
migration
ASSUMED NET INTERNAL MIGRAT ION, Ind igenous Reg ions2.19Indigenous Regions
migrat ion cont inued
A B S • ES T I M A T E S A N D P R O J E C T I O N S , A B O R I G I N A L A N D T O R R E S ST R A I T I S L A N D E R A U S T R A L I A N S • 3 2 3 8 . 0 • 2 0 0 1 T O 2 0 2 6
33
CH A P T E R 2 • A S S U M P T I O N S
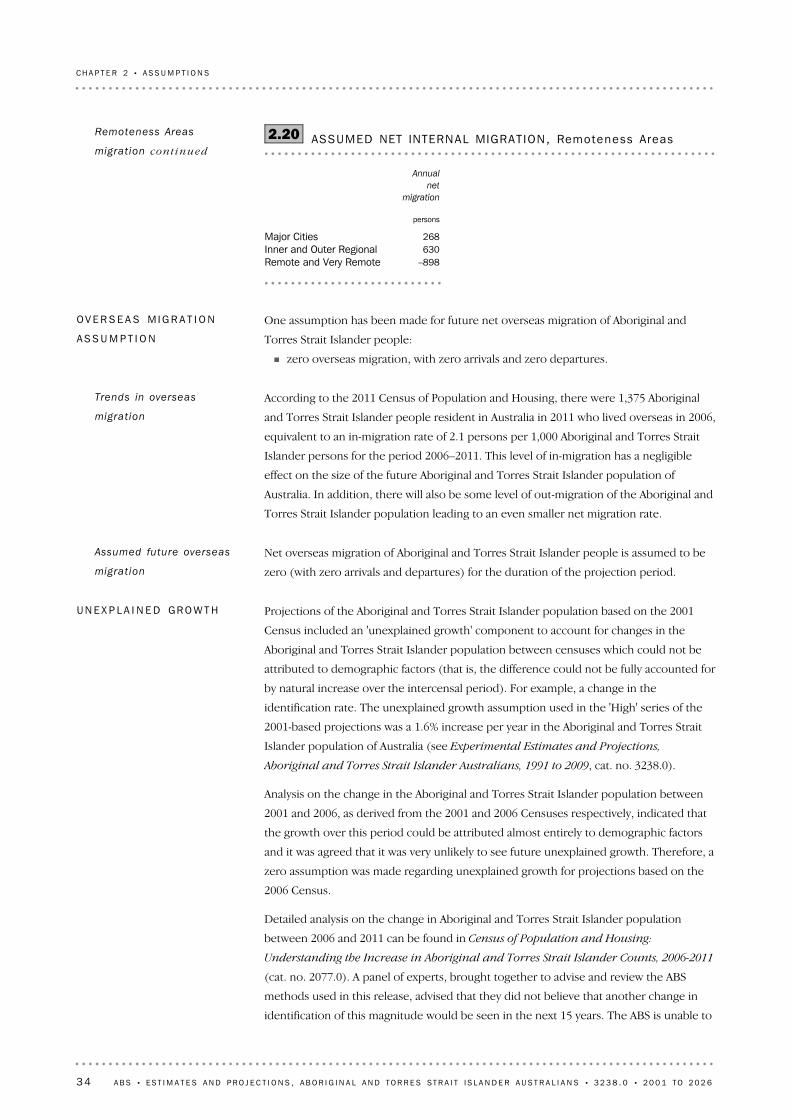
Projections of the Aboriginal and Torres Strait Islander population based on the 2001
Census included an 'unexplained growth' component to account for changes in the
Aboriginal and Torres Strait Islander population between censuses which could not be
attributed to demographic factors (that is, the difference could not be fully accounted for
by natural increase over the intercensal period). For example, a change in the
identification rate. The unexplained growth assumption used in the 'High' series of the
2001-based projections was a 1.6% increase per year in the Aboriginal and Torres Strait
Islander population of Australia (see Experimental Estimates and Projections,
Aboriginal and Torres Strait Islander Australians, 1991 to 2009, cat. no. 3238.0).
Analysis on the change in the Aboriginal and Torres Strait Islander population between
2001 and 2006, as derived from the 2001 and 2006 Censuses respectively, indicated that
the growth over this period could be attributed almost entirely to demographic factors
and it was agreed that it was very unlikely to see future unexplained growth. Therefore, a
zero assumption was made regarding unexplained growth for projections based on the
2006 Census.
Detailed analysis on the change in Aboriginal and Torres Strait Islander population
between 2006 and 2011 can be found in Census of Population and Housing:
Understanding the Increase in Aboriginal and Torres Strait Islander Counts, 2006-2011
(cat. no. 2077.0). A panel of experts, brought together to advise and review the ABS
methods used in this release, advised that they did not believe that another change in
identification of this magnitude would be seen in the next 15 years. The ABS is unable to
UN E X P L A I N E D GR O W T H
Net overseas migration of Aboriginal and Torres Strait Islander people is assumed to be
zero (with zero arrivals and departures) for the duration of the projection period.
Assumed future overseas
migrat ion
According to the 2011 Census of Population and Housing, there were 1,375 Aboriginal
and Torres Strait Islander people resident in Australia in 2011 who lived overseas in 2006,
equivalent to an in-migration rate of 2.1 persons per 1,000 Aboriginal and Torres Strait
Islander persons for the period 2006–2011. This level of in-migration has a negligible
effect on the size of the future Aboriginal and Torres Strait Islander population of
Australia. In addition, there will also be some level of out-migration of the Aboriginal and
Torres Strait Islander population leading to an even smaller net migration rate.
Trends in overseas
migrat ion
One assumption has been made for future net overseas migration of Aboriginal and
Torres Strait Islander people:
! zero overseas migration, with zero arrivals and zero departures.
OV E R S E A S M I G R A T I O N
AS S U M P T I O N
–898Remote and Very Remote630Inner and Outer Regional268Major Cities
persons
Annual
net
migration
ASSUMED NET INTERNAL MIGRAT ION, Remoteness Areas2.20Remoteness Areas
migrat ion cont inued
34 A B S • ES T I M A T E S A N D P R O J E C T I O N S , A B O R I G I N A L A N D T O R R E S ST R A I T I S L A N D E R A U S T R A L I A N S • 3 2 3 8 . 0 • 2 0 0 1 T O 2 0 2 6
CH A P T E R 2 • A S S U M P T I O N S

determine whether any possible change would result in an increase or decrease to
identification and therefore, zero unexplained growth has been assumed for this series of
projections.
UN E X P L A I N E D GR O W T H
c o n t i n u e d
A B S • ES T I M A T E S A N D P R O J E C T I O N S , A B O R I G I N A L A N D T O R R E S ST R A I T I S L A N D E R A U S T R A L I A N S • 3 2 3 8 . 0 • 2 0 0 1 T O 2 0 2 6
35
CH A P T E R 2 • A S S U M P T I O N S

CHAP T E R 3 SU M M A R Y OF F I N D I N G S . . . . . . . . . . . . . . . . . . . . . . . . . . . . .
It is important to recognise that the projections presented in this release are not
predictions or forecasts. Rather, they are an assessment of what would happen to the
size and structure of the Aboriginal and Torres Strait Islander population of Australia if
assumed levels of births, deaths and migration – the components of population change –
were to be realised over the projection period. There can be no certainty that any
particular outcome will be realised, or that future outcomes will necessarily fall within
the projected ranges.
Populat ion project ions
For the purposes of the estimates, Aboriginal and Torres Strait Islander life expectancy at
birth for Australia is assumed to have increased by 0.3 years per year for males and 0.15
years per year for females between 2006 and 2011 and increased by 0.2 years per year for
males and 0.15 years per year for females between 1996 and 2006. The assumption for
net interstate migration for each of the three intercensal periods is based on levels
observed in each respective intercensal period.
Estimates for 1996 to 2000 should be treated with caution given the 15-year interval for
which the assumption of improving life expectancy at birth is applied. Please see
Appendix 1 for more details on the quality of these estimates.
Populat ion est imates
This release contains population estimates and projections of the Aboriginal and Torres
Strait Islander population of Australia, based on results of the 2011 Census of Population
and Housing, for the period 30 June 1996 to 30 June 2026.
Estimates for 1996 to 2010 have been produced by reverse-surviving the estimated
resident Aboriginal and Torres Strait Islander population at 30 June 2011, using
2010–2012 Aboriginal and Torres Strait Islander life tables as a basis on which to make
assumptions about past Aboriginal and Torres Strait Islander life expectancy at birth and
2011 Census information to make assumptions about past levels of interstate migration.
Projections for 2012 to 2026 have been produced by applying a range of assumptions
regarding future levels of components of population change to the 30 June 2011
population (see Chapter 2 for more information).
The base population used for the estimates and projections presented in this release was
the 30 June 2011 Aboriginal and Torres Strait Islander resident population. The base
population estimates for the Northern Territory at 30 June 2011 are based on
age-heaping adjusted data. For further information on this adjustment and the base
population, see Estimates of Aboriginal and Torres Strait Islander Australians (cat. no.
3238.0.55.001).
I N T R O D U C T I O N
36 A B S • ES T I M A T E S A N D P R O J E C T I O N S , A B O R I G I N A L A N D T O R R E S ST R A I T I S L A N D E R A U S T R A L I A N S • 3 2 3 8 . 0 • 2 0 0 1 T O 2 0 2 6

2001 2006 2011 2016 2021 2026
'000
500
600
700
800
900
1000EstimatesSeries ASeries BSeries C
ESTIMATED AND PROJECTED ABORIG INAL AND TORRES STRAITISLANDER POPULAT ION, Aust ra l i a —2001-20263.1
In 2011, there were 669,900 people, representing 3% of the total Australian population.
The estimated resident Aboriginal and Torres Strait Islander population of Australia at
30 June 2001 was 534,700 people. Between 2001 and 2011 the Aboriginal and Torres
Strait Islander population increased by 2.3% per year on average, compared with 1.5% for
the total Australian population.
The population of Aboriginal and Torres Strait Islander Australians is projected to
increase to between 907,800 and 945,600 people in 2026, at an average growth rate of
between 2.0% and 2.3% per year. In comparison, the average growth rate of the total
Australian population is projected to be between 1.5% and 1.8% per year over the same
period (Population Projections, Australia, 2012 (base) to 2101, cat. no. 3222.0).
AU S T R A L I A
As described in Chapter 2, various assumptions have been made about future levels of
Aboriginal and Torres Strait Islander fertility, paternity, life expectancy at birth and
migration, resulting in 10 projection series. Three main series (Series A, B and C) have
been selected for presentation and analysis in this release.
Three assumptions are made about fertility rates:
! in Series A, fertility rates are assumed to remain constant;
! in Series B, fertility rates are assumed to decline by 0.5% annually; and
! in Series C, fertility rates are assumed to decline by 1.0% annually.
Three paternity assumptions are also made:
! in Series A, paternity rates are assumed to increase by 2.0% annually;
! in Series B, paternity rates are assumed to increase by 1.0% annually; and
! in Series C, paternity rates are assumed to remain constant.
Three assumptions are made about life expectancy at birth:
! in Series A, Aboriginal and Torres Strait Islander life expectancy at birth is assumed
to increase by 0.5 years per year for males and 0.45 years per year for females;
! in Series B, Aboriginal and Torres Strait Islander life expectancy at birth is assumed
to increase by 0.3 years per year for males and 0.25 years per year for females; and
! in Series C, Aboriginal and Torres Strait Islander life expectancy at birth is assumed
to increase by 0.2 years per year for males and 0.15 years per year for females.
Populat ion project ions
cont inue d
A B S • ES T I M A T E S A N D P R O J E C T I O N S , A B O R I G I N A L A N D T O R R E S ST R A I T I S L A N D E R A U S T R A L I A N S • 3 2 3 8 . 0 • 2 0 0 1 T O 2 0 2 6
37
CH A P T E R 3 • SU M M A R Y OF F I N D I N G S

The Aboriginal and Torres Strait Islander population has a relatively young age structure.
Between 2001 and 2011 the median age of the Aboriginal and Torres Strait Islander
population is estimated to have increased from 20.4 to 21.6 years, and is projected to
increase to between 24.7 and 25.4 years in 2026.
The proportion of Aboriginal and Torres Strait Islander children aged 0–14 years
decreased from 40% in 2001 to 36% in 2011, and is projected to decrease to between
31% and 33% in 2026. The proportion of Aboriginal and Torres Strait Islander people
aged 65 years and over increased slightly from 2.9% in 2001 to 3.4% in 2011 and is
Populat ion structure
100.0100.0100.0100.0100.0Total
1.91.92.11.00.875 and over4.44.44.52.32.065–747.47.47.35.53.855–648.68.48.39.47.845–54
12.011.811.612.212.635–4416.416.215.813.615.825–3417.817.517.120.017.315–2431.432.433.335.939.80–14
PR O P O R T I O N (% )
907 789924 953945 594669 881534 718Total
17 08918 00419 7307 0304 45275 and over40 28840 96542 18415 65210 91765–7467 50368 00268 89836 75220 36955–6477 84878 13178 65563 00141 56245–54
108 932109 124109 47381 80767 19435–44149 319149 462149 67791 07184 63725–34161 651161 693161 806133 94892 54515–24285 159299 572315 171240 620213 0420–14
NU M B E R
2026
(Series C)
2026
(Series B)
2026
(Series A)20112001
Age group
(yea r s )
ESTIMATED AND PROJECTED ABORIG INAL AND TORRES STRAITISLANDER POPULAT ION, by age group, Aust ra l ia —At 30 June3.2
The Aboriginal and Torres Strait Islander population is projected to increase across all
age groups between 2011 and 2026. The number of Aboriginal and Torres Strait Islander
children (0–14 years) is projected to increase from 240,600 in 2011 to between 285,200
and 315,200 in 2026. This equates to an increase of between 19% and 31% over the
period. The number of young adults (15–24 years) increases by a smaller proportion
(21%), from 133,900 people to between 161,700 and 161,800 people in 2026.
The number of Aboriginal and Torres Strait Islander people aged 25–54 years is projected
to increase from 235,900 in 2011 to between 336,100 and 337,800 in 2026. This equates
to an increase of between 42% and 43% over the period.
The number of Aboriginal and Torres Strait Islander people aged 55 years and over is
projected to more than double over the period, from 59,400 in 2011 to between 124,900
and 130,800 in 2026.
AU S T R A L I A c o n t i n u e d
38 A B S • ES T I M A T E S A N D P R O J E C T I O N S , A B O R I G I N A L A N D T O R R E S ST R A I T I S L A N D E R A U S T R A L I A N S • 3 2 3 8 . 0 • 2 0 0 1 T O 2 0 2 6
CH A P T E R 3 • SU M M A R Y OF F I N D I N G S

At the national level, any growth in the Aboriginal and Torres Strait Islander population is
entirely due to natural increase (that is, the excess of births over deaths), as net overseas
migration is assumed to be zero.
Although decreasing fertility rates are assumed, the number of Aboriginal and Torres
Strait Islander births is projected to increase over the projection period. This is due to
the age structure of the Aboriginal and Torres Strait Islander population, which has large
numbers of people moving into peak child-bearing ages over the projection period, as
well as due to the assumption of increasing paternity rates. As a result, the number of
Aboriginal and Torres Strait Islander births is projected to increase from 16,800 in 2012,
to between 21,000 and 25,400 in 2026.
As the population grows and ages, the number of deaths of Aboriginal and Torres Strait
Islander people is projected to increase from approximately 2,700 in 2012, to between
3,000 and 4,100 in 2026.
As the number of births is considerably larger than the number of deaths, and is
projected to continue to be so, natural increase remains consistently high, reaching
between 17,000 and 22,400 people in 2026.
Natural increase
EST IMATED AND PROJECTED ABORIG INAL AND TORRES STRAIT ISLANDER 3.3 POPULAT ION, by age group, Aust ra l i a —Ser ies B—at 30 June
projected to increase to between 6.3% and 6.5% in 2026. The proportion of Aboriginal
and Torres Strait Islander people aged 15–64 years is projected to remain relatively
stable, from 61% in 2011 to between 60% and 62% in 2026.
Populat ion structure
cont inue d
A B S • ES T I M A T E S A N D P R O J E C T I O N S , A B O R I G I N A L A N D T O R R E S ST R A I T I S L A N D E R A U S T R A L I A N S • 3 2 3 8 . 0 • 2 0 0 1 T O 2 0 2 6
39
CH A P T E R 3 • SU M M A R Y OF F I N D I N G S

All three series project continuing population growth for all states and territories
between 2011 and 2026 (table 3.5).
The Aboriginal and Torres Strait Islander population of the Australian Capital Territory is
projected to be the fastest growing of the states and territories, with an average growth
rate of between 2.8% and 3.1% per year, followed by Victoria (between 2.5% and 2.8%),
Queensland (between 2.3% and 2.6%) and Tasmania (between 2.2% and 2.4%). These
high rates of population growth are in part due to the age structure of the Aboriginal and
Torres Strait Islander population in these states and territories, with relatively large
cohorts of Aboriginal and Torres Strait Islander people moving into peak child-bearing
ages throughout the projection period. The assumption of increasing paternity rates also
contributes to population growth, as does assumed net interstate migration in some
cases, notably for Queensland (a gain of 297 people per year) and Victoria (a gain of 220
people per year).
The Aboriginal and Torres Strait Islander population of New South Wales is projected to
grow at a lower rate, of around 1.9% to 2.2% per year on average. While high levels of
natural increase are projected due to the age structure of the Aboriginal and Torres Strait
Islander population, the net migration assumption of a loss of 503 people per year for
New South Wales has the effect of reducing the rate of population growth.
The Northern Territory is projected to have the lowest average growth rate over the
projection period, of between 1.4% and 1.6% per year. This is in part due to the age
structure of the Northern Territory population which, unlike many of the other states
and territories, is relatively stable. The absolute size of the Aboriginal and Torres Strait
Islander population in child-bearing age groups (15–49 years) therefore increases
relatively consistently throughout the projection period. As a result, projected numbers
of births in the Northern Territory do not increase as rapidly as in the other states and
territories, and therefore population growth is slower. In addition, the projected
Aboriginal and Torres Strait Islander population in the Northern Territory is largely
unaffected by an increasing paternity assumption, as less than 9% of births of Aboriginal
and Torres Strait Islander children in the Northern Territory are born to Aboriginal and
Torres Strait Islander fathers and non-Indigenous mothers compared with, for example,
28% in Queensland in 2012.
ST A T E S AN D TE R R I T O R I E S
2011 2016 2021 2026
'000
14
16
18
20
22
24Series ASeries BSeries C
PROJECTED NATURAL INCREASE OF ABORIG INAL AND TORRESSTRAIT ISLANDER POPULAT ION, Aust ra l i a —2012–20263.4
Natural increase
cont inue d
40 A B S • ES T I M A T E S A N D P R O J E C T I O N S , A B O R I G I N A L A N D T O R R E S ST R A I T I S L A N D E R A U S T R A L I A N S • 3 2 3 8 . 0 • 2 0 0 1 T O 2 0 2 6
CH A P T E R 3 • SU M M A R Y OF F I N D I N G S

New South Wales is projected to continue to have the largest Aboriginal and Torres Strait
Islander population with its share remaining stable at 31% in both 2011 and 2026.
Queensland's share of Australia's Aboriginal and Torres Strait Islander population is
projected to increase from 28% in 2011 to 29% in 2026 and Victoria's share is projected
to increase from 7.1% in 2011 to 7.5% in 2026.
Northern Territory's share is projected to decline, from 10.3% to between 9.3% and 9.4%.
The distribution amongst the remaining states and territories is projected to remain
largely unchanged.
Changing state/terr i tory
share
(a) Average annual growth rate for the period 2011 to 2026.(b) Includes Other Territories.
2.0907 7892.2924 9532.3945 594669 881534 718Aust.(b)
2.89 2862.99 4633.19 6746 1604 256ACT1.484 9221.586 0601.687 48668 85059 702NT2.233 3052.333 9652.434 72424 16519 292Tas.1.9117 4402.0119 4312.2121 83688 27071 994WA2.050 3122.151 2332.352 32137 40829 068SA2.3266 7552.5271 8602.6278 019188 954143 545Qld2.568 1982.669 6372.871 37947 33335 816Vic.1.9277 2332.1282 9622.2289 808208 476170 827NSW
Growth
rate
(%)(a)no.
Growth
rate
(%)(a)no.
Growth
rate
(%)(a)no.no.no.
2026 (SERIES C)2026 (SERIES B)2026 (SERIES A)20112001
ESTIMATED AND PROJECTED ABORIG INAL AND TORRES STRAITISLANDER POPULAT ION, States and ter r i to r ies —2001– 20263.5
Similar to the Northern Territory, projected average annual growth rates for Western
Australia (between 1.9% and 2.2%) and South Australia (between 2.0% and 2.3%) are
lower than those for the Australian Capital Territory, Victoria and Queensland. This is
due in part to the relatively stable age structures of their Aboriginal and Torres Strait
Islander populations. Assumed net interstate migration for Western Australia (a gain of
71 people per year) and South Australia (a gain of 55 people per year) has a small
positive effect on the rate of population growth over the projection period.
Components of population change for Australia and each state and territory are
presented in detail in data cubes attached to this release on the ABS web site.
ST A T E S AN D TE R R I T O R I E S
c o n t i n u e d
A B S • ES T I M A T E S A N D P R O J E C T I O N S , A B O R I G I N A L A N D T O R R E S ST R A I T I S L A N D E R A U S T R A L I A N S • 3 2 3 8 . 0 • 2 0 0 1 T O 2 0 2 6
41
CH A P T E R 3 • SU M M A R Y OF F I N D I N G S

(a) Includes Other Territories
100.0100.0100.0100.0Aust.(a)
1.01.01.00.9ACT9.49.39.310.3NT3.73.73.73.6Tas.
12.912.912.913.2WA5.55.55.55.6SA
29.429.429.428.2Qld7.57.57.57.1Vic.
30.530.630.631.1NSW
%%%%
2026
(SERIES
C)
2026
(SERIES
B)
2026
(SERIES
A)2011
PROJECTED DISTRIBUT ION OF ABORIG INAL AND TORRES STRAITISLANDER POPULAT ION, States and ter r i to r ies —At 30 June3.6
Changing state/terr i tory
share cont inue d
42 A B S • ES T I M A T E S A N D P R O J E C T I O N S , A B O R I G I N A L A N D T O R R E S ST R A I T I S L A N D E R A U S T R A L I A N S • 3 2 3 8 . 0 • 2 0 0 1 T O 2 0 2 6
CH A P T E R 3 • SU M M A R Y OF F I N D I N G S

CHAP T E R 4 SE N S I T I V I T Y OF PR O J E C T I O N S TO AS S U M P T I O N S
Series B uses a fertility assumption that incorporates an annual decline of 0.5% in
Aboriginal and Torres Strait Islander fertility rates, resulting in a total fertility rate (TFR)
of 2.09 by 2026. Sensitivity analysis was undertaken into the effect of alternative fertility
assumptions on the size of the future Aboriginal and Torres Strait Islander population
and the number of projected births.
Extra projection series were generated using the following assumptions:
! no decline in fertility rates (a TFR of 2.25 by 2026); and
! an annual decline of 1.0% in fertility rates (a TFR of 1.95 by 2026).
Table 4.1 shows the Aboriginal and Torres Strait Islander population at 30 June 2011 and
the projected Australian and state/territory populations in 2026 under the three fertility
assumptions. Table 4.2 shows the number of Aboriginal and Torres Strait Islander births
for 2012 and 2026 under these assumptions. In both tables, assumptions relating to
Aboriginal and Torres Strait Islander paternity rates, life expectancy at birth and interstate
migration are at levels specified for Series B.
FE R T I L I T Y RA T E S
The main projection series (Series A, B and C) represent three of a range of possible
outcomes for the size and structure of the future Aboriginal and Torres Strait Islander
population. Future actual levels of the components of population change may differ from
those assumed in this release.
This chapter discusses the effect of differing levels of components of population change
on the projected size, structure and numbers of births and deaths of Aboriginal and
Torres Strait Islander Australians. Overall, sensitivity analysis shows that varying the
assumptions appears to have a minimal effect on the size of the projected Aboriginal and
Torres Strait Islander population.
I N T R O D U C T I O N
A B S • ES T I M A T E S A N D P R O J E C T I O N S , A B O R I G I N A L A N D T O R R E S ST R A I T I S L A N D E R A U S T R A L I A N S • 3 2 3 8 . 0 • 2 0 0 1 T O 2 0 2 6
43

Based on the main fertility assumption (0.5% annual decline in fertility rates), the
Aboriginal and Torres Strait Islander population of Australia is projected to reach 925,000
people in 2026 (Series B), and the number of Aboriginal and Torres Strait Islander births
increases from 16,800 in 2012 to 23,100 in 2026 (table 4.2).
(a) Assuming Aboriginal and Torres Strait Islander paternityrates increase by 1.0% per year, life expectancy at birthreaches 73.5 years for males and 77.4 years for femalesby 2026, and migration remains at the levels observed inthe 2011 Census.
(b) Includes Other Territories.
22.023.124.216.8Aust.(b)
0.20.20.30.2ACT1.51.61.71.5NT0.80.90.90.6Tas.2.62.72.82.1WA1.21.21.30.9SA6.97.27.65.1Qld1.81.91.91.2Vic.7.17.47.75.3NSW
'000'000'000'000
1.0%
annual
decrease
(Series E)
0.5%
annual
decrease
(Series B)
Constant
(Series
D)
2026
2012
PROJECTED BIRTHS OF ABORIGINAL AND TORRES STRAITISLANDER CHILDREN (a) , Al te rna t i ve fer t i l i t y assumpt ions —Yearended 30 June 2012 and 2026
4.2
(a) Assuming Aboriginal and Torres Strait Islander paternityrates increase by 1.0% per year, life expectancy at birthreaches 73.5 years for males and 77.4 years for femalesby 2026, and migration remains at the levels observed inthe 2011 Census.
(b) Includes Other Territories.
917.4925.0932.8669.9Aust.(b)
9.49.59.56.2ACT85.386.186.868.9NT33.734.034.224.2Tas.
118.5119.4120.488.3WA50.851.251.737.4SA
269.4271.9274.4189.0Qld69.269.670.247.3Vic.
280.8283.0285.2208.5NSW
'000'000'000'000
1.0%
annual
decrease
(Series E)
0.5%
annual
decrease
(Series B)
Constant
(Series
D)
2026
2011
PROJECTED ABORIG INAL AND TORRES STRAIT ISLANDERPOPULAT ION (a) , Al te rna t i ve fer t i l i t y assumpt ions —At 30 June2011 and 2026
4.1FE R T I L I T Y RA T E S
c o n t i n u e d
44 A B S • ES T I M A T E S A N D P R O J E C T I O N S , A B O R I G I N A L A N D T O R R E S ST R A I T I S L A N D E R A U S T R A L I A N S • 3 2 3 8 . 0 • 2 0 0 1 T O 2 0 2 6
CH A P T E R 4 • SE N S I T I V I T Y OF P R O J E C T I O N S T O A S S U M P T I O N S

Series B uses a paternity assumption that incorporates an annual increase of 1.0% in
paternity rates for children born to Aboriginal and Torres Strait Islander fathers where
the mother's Indigenous status was non-Indigenous or not stated, resulting in a total
paternity rate (TPR) of 1.08 for Australia by 2026. Sensitivity analysis was undertaken into
the effect of alternative paternity assumptions on the size of the future Aboriginal and
Torres Strait Islander population and the number of projected births.
Extra projection series were generated using the following assumptions:
! no increase in paternity rates (a TPR of 0.94 for Australia by 2026); and
! an annual increase of 2.0% in paternity rates (a TPR of 1.25 for Australia by 2026).
Table 4.3 shows the Aboriginal and Torres Strait Islander population at 30 June 2011 and
the projected Australian and state/territory populations in 2026 under the three paternity
assumptions. Table 4.4 shows the number of Aboriginal and Torres Strait Islander births
for 2012 and 2026 under these assumptions. In both tables, assumptions relating to
Aboriginal and Torres Strait Islander fertility rates, life expectancy at birth and interstate
migration are at levels specified in Series B.
PA T E R N I T Y RA T E S
Assuming fertility rates remain constant (Series D), the Aboriginal and Torres Strait
Islander population of Australia is projected to reach 932,800 people in 2026, 7,900
(0.8%) people more than in Series B. Under this assumption there would be 24,200
Aboriginal and Torres Strait Islander births in 2026, 1,100 (4.9%) more than in Series B.
This equates to 2.6% more Aboriginal and Torres Strait Islander children aged 0–14 years
in 2026 compared with Series B.
Assuming a 1.0% annual decline in fertility rates (Series E), the Aboriginal and Torres
Strait Islander population of Australia is projected to reach 917,400 people in 2026, 7,500
(0.8%) people fewer than in Series B. Under this assumption there would be 22,000
Aboriginal and Torres Strait Islander births in 2026, 1,000 (4.5%) fewer than in Series B.
This equates to 2.5% fewer Aboriginal and Torres Strait Islander children aged 0–14 years
in 2026 compared with Series B.
FE R T I L I T Y RA T E S
c o n t i n u e d
A B S • ES T I M A T E S A N D P R O J E C T I O N S , A B O R I G I N A L A N D T O R R E S ST R A I T I S L A N D E R A U S T R A L I A N S • 3 2 3 8 . 0 • 2 0 0 1 T O 2 0 2 6
45
CH A P T E R 4 • SE N S I T I V I T Y OF P R O J E C T I O N S T O A S S U M P T I O N S
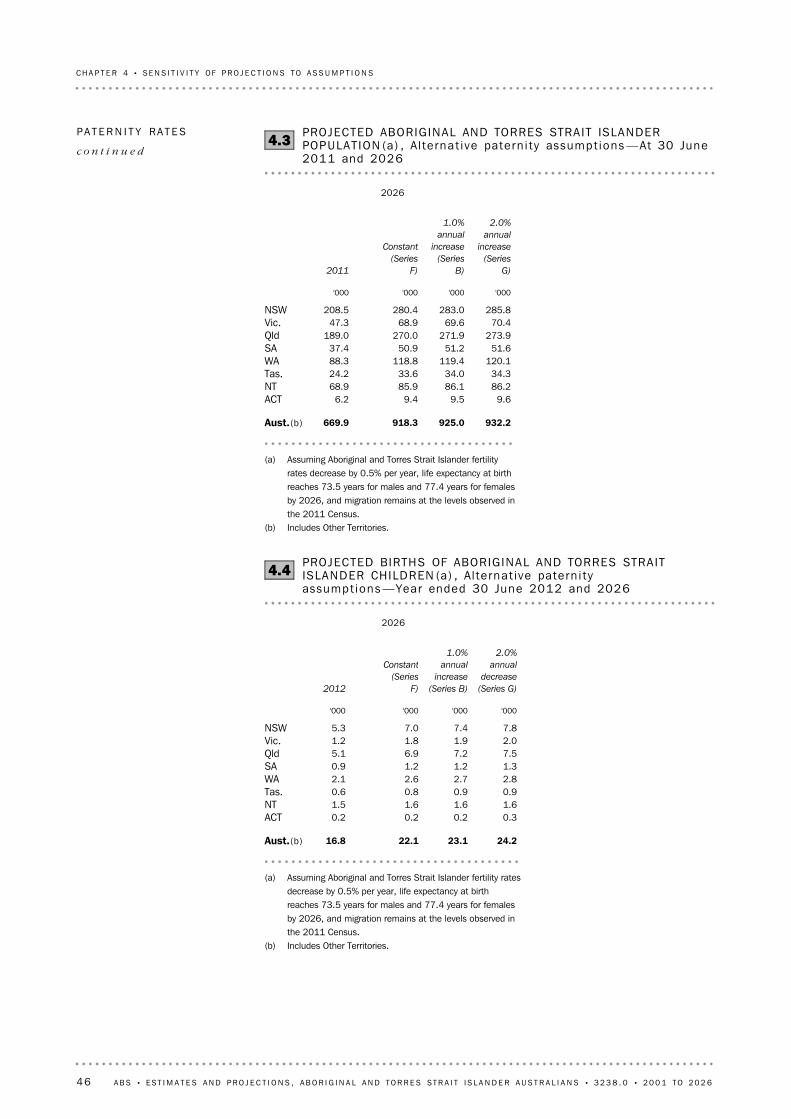
(a) Assuming Aboriginal and Torres Strait Islander fertility ratesdecrease by 0.5% per year, life expectancy at birthreaches 73.5 years for males and 77.4 years for femalesby 2026, and migration remains at the levels observed inthe 2011 Census.
(b) Includes Other Territories.
24.223.122.116.8Aust.(b)
0.30.20.20.2ACT1.61.61.61.5NT0.90.90.80.6Tas.2.82.72.62.1WA1.31.21.20.9SA7.57.26.95.1Qld2.01.91.81.2Vic.7.87.47.05.3NSW
'000'000'000'000
2.0%
annual
decrease
(Series G)
1.0%
annual
increase
(Series B)
Constant
(Series
F)
2026
2012
PROJECTED BIRTHS OF ABORIGINAL AND TORRES STRAITISLANDER CHILDREN (a) , Al te rnat i ve patern i t yassumpt ions —Year ended 30 June 2012 and 2026
4.4
(a) Assuming Aboriginal and Torres Strait Islander fertilityrates decrease by 0.5% per year, life expectancy at birthreaches 73.5 years for males and 77.4 years for femalesby 2026, and migration remains at the levels observed inthe 2011 Census.
(b) Includes Other Territories.
932.2925.0918.3669.9Aust.(b)
9.69.59.46.2ACT86.286.185.968.9NT34.334.033.624.2Tas.
120.1119.4118.888.3WA51.651.250.937.4SA
273.9271.9270.0189.0Qld70.469.668.947.3Vic.
285.8283.0280.4208.5NSW
'000'000'000'000
2.0%
annual
increase
(Series
G)
1.0%
annual
increase
(Series
B)
Constant
(Series
F)
2026
2011
PROJECTED ABORIG INAL AND TORRES STRAIT ISLANDERPOPULAT ION (a) , Al te rna t i ve patern i t y assumpt ions —At 30 June2011 and 2026
4.3PA T E R N I T Y RA T E S
c o n t i n u e d
46 A B S • ES T I M A T E S A N D P R O J E C T I O N S , A B O R I G I N A L A N D T O R R E S ST R A I T I S L A N D E R A U S T R A L I A N S • 3 2 3 8 . 0 • 2 0 0 1 T O 2 0 2 6
CH A P T E R 4 • SE N S I T I V I T Y OF P R O J E C T I O N S T O A S S U M P T I O N S

Series B assumes that life expectancy at birth for Aboriginal and Torres Strait Islander
peoples increases by 0.3 years per year for males and 0.25 years per year for females,
reaching 73.5 years for males and 77.4 years for females by 2026. Sensitivity analysis was
undertaken into the effect of alternative life expectancy at birth assumptions on the size
of the future Aboriginal and Torres Strait Islander population and the number of
projected deaths.
Extra projection series were generated using the following assumptions:
! Aboriginal and Torres Strait Islander life expectancy at birth will increase by 0.2 years
per year for males and 0.15 years per year for females, reaching 72.0 years for males
and 75.9 years for females by 2026; and
! Aboriginal and Torres Strait Islander life expectancy at birth will increase by 0.5 years
per year for males and 0.45 years per year for females, reaching 76.5 years for males
and 80.4 years for females by 2026.
Table 4.5 shows the Aboriginal and Torres Strait Islander population at 30 June 2011 and
the projected Australian and state/territory populations in 2026 under the three life
expectancy at birth assumptions. Table 4.6 shows the number of deaths of Aboriginal and
Torres Strait Islander people for 2012 and 2026 under these assumptions. For both
tables, assumptions relating to Aboriginal and Torres Strait Islander fertility rates,
paternity rates and interstate migration are at levels specified in Series B.
L I F E EX P E C T A N C Y AT
B I R T H
The main paternity assumption (1.0% annual increase in paternity rates) results in the
Aboriginal and Torres Strait Islander population of Australia being projected to reach
925,000 people in 2026 (Series B), and the number of Aboriginal and Torres Strait
Islander births increases from 16,800 in 2012 to 23,100 in 2026 (table 4.4).
Assuming paternity rates remain constant (Series F), the Aboriginal and Torres Strait
Islander population of Australia is projected to reach 918,300 people in 2026, 6,600
(0.7%) people fewer than in Series B. Under this assumption there would be 22,100
Aboriginal and Torres Strait Islander births in 2026, 1,000 (4.3%) fewer than in Series B.
This equates to 2.2% fewer Aboriginal and Torres Strait Islander children aged 0–14 years
in 2026 compared with Series B.
Assuming a 2.0% annual increase in paternity rates (Series G), the Aboriginal and Torres
Strait Islander population of Australia is projected to reach 932,200 people in 2026, 7,300
(0.8%) people more than in Series B. Under this assumption there would be 24,200
births of Aboriginal and Torres Strait Islander children in 2026, 1,100 (4.9%) more than in
Series B. This equates to 2.4% more Aboriginal and Torres Strait Islander children aged
0–14 years in 2026 compared with Series B.
PA T E R N I T Y RA T E S
c o n t i n u e d
A B S • ES T I M A T E S A N D P R O J E C T I O N S , A B O R I G I N A L A N D T O R R E S ST R A I T I S L A N D E R A U S T R A L I A N S • 3 2 3 8 . 0 • 2 0 0 1 T O 2 0 2 6
47
CH A P T E R 4 • SE N S I T I V I T Y OF P R O J E C T I O N S T O A S S U M P T I O N S

(a) Assuming Aboriginal and Torres Strait Islander fertility ratesdecline by 0.5% per year, paternity rates increase by 1.0%per year, and interstate migration remains at the levelsobserved in the 2011 Census.
(b) Aboriginal and Torres Strait Islander life expectancy at birthincreases by 0.2 years per year for males and 0.15 years peryear for females, reaching 72.0 years for males and 75.9years for females by 2026.
(c) Aboriginal and Torres Strait Islander life expectancy at birthincreases by 0.3 years per year for males and 0.25 years peryear for females, reaching 73.5 years for males and 77.4years for females by 2026.
(d) Aboriginal and Torres Strait Islander life expectancy at birthincreases by 0.5 years per year for males and 0.45 years peryear for females, reaching 76.5 years for males and 80.4years for females by 2026.
(e) Includes Other Territories.
930.4925.0921.9669.9Aust.(e)
9.59.59.46.2ACT86.586.185.868.9NT34.134.033.924.2Tas.
120.1119.4119.088.3WA51.551.251.137.4SA
273.5271.9271.0189.0Qld70.169.669.447.3Vic.
284.7283.0282.0208.5NSW
'000'000'000'000
Series
H(d)Series
B(c)Series
I(b)
2026
2011
PROJECTED ABORIG INAL AND TORRES STRAIT ISLANDERPOPULAT ION (a) , Al te rnat i ve l i fe expec tancy at bi r thassumpt ions —At 30 June 2011 and 2026
4.5L I F E EX P E C T A N C Y AT
B I R T H c o n t i n u e d
48 A B S • ES T I M A T E S A N D P R O J E C T I O N S , A B O R I G I N A L A N D T O R R E S ST R A I T I S L A N D E R A U S T R A L I A N S • 3 2 3 8 . 0 • 2 0 0 1 T O 2 0 2 6
CH A P T E R 4 • SE N S I T I V I T Y OF P R O J E C T I O N S T O A S S U M P T I O N S

Using Series B life expectancy assumptions, the Aboriginal and Torres Strait Islander
population of Australia is projected to reach 925,000 in 2026. The number of deaths of
Aboriginal and Torres Strait Islander people would increase from 2,700 in 2012 to 3,700
in 2026.
Assuming Aboriginal and Torres Strait Islander life expectancy at birth increases by 0.2
years per year for males and 0.15 years per year for females (Series I), the Aboriginal and
Torres Strait Islander population of Australia is projected to reach 921,900 people in
2026, 3,000 (0.3%) people less than in Series B. Under this assumption there would be
4,100 deaths of Aboriginal and Torres Strait Islander people in 2026, 390 (11%) more
than in Series B.
Assuming Aboriginal and Torres Strait Islander life expectancy at birth increases by 0.5
years per year for males and 0.45 years per year for females (Series H), the Aboriginal and
Torres Strait Islander population of Australia is projected to reach 930,400 people in
2026, 5,500 (0.6%) people more than in Series B. Under this assumption there would be
(a) Assuming Aboriginal and Torres Strait Islander fertilityrates decline by 0.5% per year, paternity ratesincrease by 1.0% per year, and interstate migrationremains at the levels observed in the 2011 Census.
(b) Number of deaths projected under Series B.(c) Aboriginal and Torres Strait Islander life expectancy at
birth increases by 0.2 years per year for males and0.15 years per year for females, reaching 72.0 yearsfor males and 75.9 years for females by 2026.
(d) Aboriginal and Torres Strait Islander life expectancy atbirth increases by 0.3 years per year for males and0.25 years per year for females, reaching 73.5 yearsfor males and 77.4 years for females by 2026.
(e) Aboriginal and Torres Strait Islander life expectancy atbirth increases by 0.5 years per year for males and0.45 years per year for females, reaching 76.5 yearsfor males and 80.4 years for females by 2026.
(f) Includes Other Territories.
2 9933 6814 0702 666Aust.(f)
16212410ACT247310345198NT
759811159Tas.389476525335WA196235257187SA9241 1241 239818Qld268322352270Vic.8761 0931 215787NSW
no.no.no.no.
Series
H(e)Series
B(d)Series
I(c)
2026
2012(b)
PROJECTED DEATHS OF ABORIG INAL AND TORRES STRAITISLANDER PERSONS (a) , Al te rnat i ve l i fe expec tancy at bi r thassumpt ions —Year ended 30 June 2012 and 2026
4.6L I F E EX P E C T A N C Y AT
B I R T H c o n t i n u e d
A B S • ES T I M A T E S A N D P R O J E C T I O N S , A B O R I G I N A L A N D T O R R E S ST R A I T I S L A N D E R A U S T R A L I A N S • 3 2 3 8 . 0 • 2 0 0 1 T O 2 0 2 6
49
CH A P T E R 4 • SE N S I T I V I T Y OF P R O J E C T I O N S T O A S S U M P T I O N S

In 2011, only one assumption was analysed for interstate migration. The future net
interstate migration of Aboriginal and Torres Strait Islander people was set at constant
levels as observed in the 2011 Census.
Interstate migrat ion
3,000 deaths of Aboriginal and Torres Strait Islander people in 2026, 690 (19%) fewer
than in Series B.
L I F E EX P E C T A N C Y AT
B I R T H c o n t i n u e d
50 A B S • ES T I M A T E S A N D P R O J E C T I O N S , A B O R I G I N A L A N D T O R R E S ST R A I T I S L A N D E R A U S T R A L I A N S • 3 2 3 8 . 0 • 2 0 0 1 T O 2 0 2 6
CH A P T E R 4 • SE N S I T I V I T Y OF P R O J E C T I O N S T O A S S U M P T I O N S

EX P L A N A T O R Y NO T E S . . . . . . . . . . . . . . . . . . . . . . . . . . . . . . .
6 The Aboriginal and Torres Strait Islander population comprises people who are of
Aboriginal origin, Torres Strait Islander origin or both Aboriginal and Torres Strait
Islander origin. The Commonwealth definition of an Aboriginal or Torres Strait Islander
person is:
! a person of Aboriginal or Torres Strait Islander descent who;
! identifies as being of Aboriginal or Torres Strait Islander origin and who is;
! accepted as such by the community with which the person associates.
7 The 2011 Census of Population and Housing (Household Form) asked the following
question of each person:
CL A S S I F I C A T I O N S
Indigenous status
3 The significant volatility in the Aboriginal and Torres Strait Islander Census counts
and the quality of data on births, deaths and migration of Aboriginal and Torres Strait
Islander persons do not support the use of the standard approach to population
estimation (observed numbers of births, deaths and migration during a specified period
are added to the population at the start of the period to obtain an estimate of the
population at the end of the period).
4 Data quality issues relating to Aboriginal and Torres Strait Islander population
estimates for 30 June 2011 derived from the 2011 Census of Population and Housing, on
which the estimates and projections in this release are based, are discussed in more
detail in paragraphs 8 to 18 of the Explanatory Notes of Estimates of Aboriginal and
Torres Strait Islander Australians, Jun 2011 (cat. no. 3238.0.55.001) and the associated
Technical Note: Estimated Aboriginal and Torres Strait Islander Australian Resident
Population - Method of Calculation.
5 For a discussion of the measurement of deaths of Aboriginal and Torres Strait
Islander persons, see Chapter 2 of Life Tables for Aboriginal and Torres Strait Islander
Australians, 2010–2012 (cat. no. 3302.0.55.003).
DA T A QU A L I T Y
1 This release contains annual estimates and projections of the Aboriginal and Torres
Strait Islander population of Australia from 30 June 1996 to 30 June 2011 and 30 June
2012 to 30 June 2026 respectively, based on results of the 2011 Census of Population and
Housing.
2 These estimates and projections supersede the 2006-based series published in
Experimental Estimates and Projections, Aboriginal and Torres Strait Islander
Australians, 1991 to 2021 (cat. no. 3238.0) in September 2009.
I N T R O D U C T I O N
A B S • ES T I M A T E S A N D P R O J E C T I O N S , A B O R I G I N A L A N D T O R R E S ST R A I T I S L A N D E R A U S T R A L I A N S • 3 2 3 8 . 0 • 2 0 0 1 T O 2 0 2 6
51

15 There are many techniques which may be used to produce population projections,
such as simple extrapolations, probabilistic methods, broad economic, social and
time-series analysis, and detailed component methods.
16 As mentioned above (see paragraphs 3-5), data quality issues relating to Census
counts, births, deaths and migration of Aboriginal and Torres Strait Islander persons do
not support the standard approach to population estimation. An alternative method is
therefore required to enable the construction of a time series of the size and structure of
the Aboriginal and Torres Strait Islander population.
17 Estimates of the Aboriginal and Torres Strait Islander population are available for
30 June of the latest Census year (currently, 30 June 2011). Based on these, estimates
(for previous years) and projections (for future years) can be derived using assumptions
about past and future components of population change.
ME T H O D S
10 Estimates and projections in this release are presented by five year age groups, with
upper age groups as follows:
! Australia, states and territories—85 years and over (65 years and over for Tasmania
and the Australian Capital Territory);
! Indigenous Regions—65 years and over; and
! Remoteness Areas—75 years and over.
11 Single year of age data is available on request for Australia and the states and
territories, excluding the Australian Capital Territory and Other Territories. Single year of
age data for these jurisdictions is not available (see paragraphs 34–35).
12 It is important to recognise the inherent uncertainties in these data. Aboriginal and
Torres Strait Islander population estimates for 30 June 2011, on which the estimates and
projections in this release are based, may be subject to errors that cannot be adjusted for
in the population estimates compilation process. This is due to the inability of the Post
Enumeration Survey to adjust for net undercount by Indigenous status by single year of
age and sex. For example, features present in single year of age Census counts, such as
age heaping, will most likely appear in population estimates for 2011, even after
adjustment for net undercount and other factors, and therefore may appear in single
year of age estimates for earlier years as well as projections.
13 An age heaping adjustment has been applied to the population of the Northern
Territory at 30 June 2011. This information was released in Estimates of Aboriginal and
Torres Strait Islander Australians, June 2011 (cat. no. 3238.0.55.001) and has been used
as the base population for the estimates and projections in this release.
14 In addition, the use of assumptions on future levels of fertility, mortality and
migration to obtain population projections adds a further level of uncertainty, the extent
of which cannot be measured.
Age groups
8 This release contains data presented according to a number of geographic
classifications: the Main Structure of the Australian Statistical Geography Standard
(ASGS), the Indigenous Structure, and Remoteness Areas (RAs).
9 For further information see Australian Statistical Geography Standard (ASGS):
Volume 1 - Main Structure and Greater Capital City Statistical Areas, July 2011 (cat. no.
1270.0.55.001); Australian Statistical Geography Standard (ASGS): Volume 2 -
Indigenous Structure, July 2011 (cat. no. 1270.0.55.002); and Australian Statistical
Geography Standard (ASGS): Volume 5 - Remoteness Structure, July 2011 (cat. no.
1270.0.55.005).
Austral ian stat ist ical areas
52 A B S • ES T I M A T E S A N D P R O J E C T I O N S , A B O R I G I N A L A N D T O R R E S ST R A I T I S L A N D E R A U S T R A L I A N S • 3 2 3 8 . 0 • 2 0 0 1 T O 2 0 2 6
EX P L A N A T O R Y N O T E S
25 The estimate for 30 June 2006 based on the 2006 Census was 517,000 Aboriginal
and Torres Strait Islander persons. The estimate for 2006 presented in this release, based
on the 2011 Census, is 601,500 persons (16% more than the previously published 2006
estimate).
26 The total Aboriginal and Torres Strait Islander population of Australia at 30 June
2001, based on the 2001 Census, was 458,500 persons. The estimate for 2001 presented
in this release, based on the 2011 Census, is 534,700 persons (17% more than the
previously published 2001 estimate).
27 The estimate for 30 June 1996 based on the 1996 Census was 386,000 persons. The
estimate for 1996 presented in this release, based on the 2011 Census, is 468,200 persons
(21% more than the previously published 1996 estimate).
Comparison to previously
publ ished est imates
22 Using 30 June 2011 Aboriginal and Torres Strait Islander resident population
estimates as the base population, estimates were survived back one year at a time to 30
June 1996. For example, the number of 19-year old males in 2010 was obtained by
applying survivorship ratios from life tables to the number of 20-year old males in 2011.
This calculation is performed for all ages and both sexes to obtain the complete 2010
population, and repeated to obtain estimates for each year back to 1996.
23 Net interstate migration assumptions have been calculated directly from the net
migration measured in the corresponding Census periods. As Census data indicates that
the level of net overseas migration of Aboriginal and Torres Strait Islander persons is
negligible, zero net overseas migration has been assumed.
24 For the estimates presented in this release, it was assumed that Aboriginal and
Torres Strait Islander life expectancy at birth at the Australia level increased by 0.2 years
per year for males and 0.15 years per year for females for the period 30 June 1996 to 30
June 2006 and then increased by 0.3 years per year for males and 0.15 years per year for
females for the 2006–2011 period. Under this assumption, life expectancy at birth in 1996
would be 65.5 years and 71.4 years for Aboriginal and Torres Strait Islander males and
females respectively. Whether Aboriginal and Torres Strait Islander life expectancy at
birth has changed at a faster or slower rate is unknown.
Method used to derive
est imates
21 A single series of population estimates for the period 1996 to 2010 was calculated
by reverse-surviving the 30 June 2011 estimated Aboriginal and Torres Strait Islander
resident population using assumed life tables based on those calculated for the period
2010–2012. Zero net overseas migration was assumed for the period 1996 to 2011 and
interstate migration levels were based on those measured in the corresponding
intercensal period (i.e. 1996–2001, 2001–2006 and 2006–2011).
ES T I M A T E S
19 The ABS uses the cohort-component method, which begins with a base population
for each sex by single year of age, and advances it year by year by applying assumptions
regarding future fertility, mortality and migration. This procedure is repeated for each
year in the projection period. Projections for each geographic region (for example,
Remoteness Areas) by sex and single years of age are adjusted to sum to state or territory
projections which are in turn adjusted to sum to Australia-level projections.
20 A similar technique can also be used to estimate past populations, by
'reverse-surviving' a population using mortality rates derived from life tables.
Cohort-component method
18 Due to volatility in Aboriginal and Torres Strait Islander Census counts, estimates
for previous years derived from the 30 June 2011 data provide a consistent time series
compared to Census year estimates derived from previous censuses. The estimates and
projections in this release therefore supersede previously published ABS estimates and
projections of the Aboriginal and Torres Strait Islander population. See paragraphs 31–33
for a comparison of population estimates based on the 2006, 2001 and 1996 censuses.
ME T H O D S continued
A B S • ES T I M A T E S A N D P R O J E C T I O N S , A B O R I G I N A L A N D T O R R E S ST R A I T I S L A N D E R A U S T R A L I A N S • 3 2 3 8 . 0 • 2 0 0 1 T O 2 0 2 6
53
EX P L A N A T O R Y N O T E S

34 The Census and Statistics Act, 1905 provides the authority for the ABS to collect
statistical information, and requires that statistical output shall not be published or
disseminated in a manner that is likely to enable the identification of a particular person
or organisation. This requirement means that the ABS must take care and make
assurances that any statistical information about individual respondents cannot be
derived from published data.
35 Some techniques used to guard against identification or disclosure of confidential
information in statistical tables are suppression of sensitive cells, random adjustments to
cells with very small values, and aggregation of data. To protect confidentiality within this
release, some cell values may have been suppressed and are not available for release but
included in totals where applicable. In these cases data may not sum to totals due to the
confidentialisation of individual cells.
CO N F I D E N T I A L I T Y
32 Using 30 June 2011 Aboriginal and Torres Strait Islander resident population
estimates as the base population, the estimates were projected forward one year at a
time to 30 June 2026. For example:
! the number of 21 year-old males in 2012 was obtained by applying survivorship
ratios from life tables to the number of 20 year-old males in 2011. This calculation is
performed for all ages and both sexes to obtain a 'survived' population for 2012;
! net interstate migration (by single year of age and sex) for 2012 was derived by
applying migration rates to the 2011 Aboriginal and Torres Strait Islander population
and adding these to the population at the relevant geography (that is, state or
territory population, Remoteness Area or Indigenous Region); and
! to obtain the number of 0 year-olds in 2012, age-specific fertility and paternity rates
were applied to the female and male populations (respectively) aged 15–49 years to
derive the number of births (that is, 0 year-olds). These are split into males and
females using the assumed sex ratio at birth.
33 The result of these steps is the projected population for 2012. This process is
repeated to produce each successive year of the projection, until the year 2026.
Method used to derive
project ions
29 Assumptions have been formulated on the basis of past demographic trends, in
conjunction with consultation with various experts and government department
representatives at the national and state/territory level. Consultation occurred between
November 2013 and February 2014, after which the assumptions were finalised.
30 The assumptions do not attempt to allow for non-demographic factors (such as
major government policy decisions, economic factors, natural disasters, epidemics or
significant health treatment improvements) which may affect future demographic
behaviour or outcomes. There is no certainty that any of the assumptions will or will not
be realised. For detailed information on the assumptions used, see Chapter 2 for more
information.
31 Projections incorporating alternative levels and combinations of assumptions have
been produced in recognition of this uncertainty and to provide a range of possible
options to users (see Chapter 4 for more information).
Assumptions
28 The ABS publishes Aboriginal and Torres Strait Islander population projections
once every intercensal period. The projections are not intended as predictions or
forecasts, but are illustrations of growth and change in the structure of the Aboriginal
and Torres Strait Islander population that would occur if assumptions made about future
demographic trends were to prevail over the projection period.
PR O J E C T I O N S
54 A B S • ES T I M A T E S A N D P R O J E C T I O N S , A B O R I G I N A L A N D T O R R E S ST R A I T I S L A N D E R A U S T R A L I A N S • 3 2 3 8 . 0 • 2 0 0 1 T O 2 0 2 6
EX P L A N A T O R Y N O T E S

39 As well as the statistics included in this and related publications, the ABS may have
other relevant data available on request. Inquiries should be made to the National
Information and Referral Service on 1300 135 070.
40 ABS products and publications are available free of charge from the ABS web site
<http://www.abs.gov.au>. Click on Statistics to gain access to the full range of ABS
statistical and reference information.
AD D I T I O N A L S T A T I S T I C S
AV A I L A B L E
38 Other ABS publications that may be of interest to users include:
Australian Aboriginal and Torres Strait Islander Health Survey: First Results,
Australia, 2012-13 (cat.no. 4727.0.55.001)
Australian Demographic Statistics (cat. no. 3101.0)
Births, Australia (cat. no. 3301.0)
Census of Population and Housing: Understanding the Increase in Aboriginal and
Torres Strait Islander Counts, 2006-2011 (cat. no. 2077.0)
Deaths, Australia (cat. no. 3302.0)
Demography Working Paper 2001/4 – Issues in Estimating the Aboriginal and
Torres Strait Islander Population (cat. no. 3126.0)
Discussion Paper: Assessment of Methods for Developing Life Tables for Aboriginal
and Torres Strait Islander Australians, Australia, 2006 (cat. no. 3302.0.55.002)
Estimates of Aboriginal and Torres Strait Islander Australians, June 2011 (cat. no.
3238.0.55.001)
Experimental Estimates and Projections, Aboriginal and Torres Strait Islander
Australians, 1991 to 2021 (cat. no. 3238.0)
Life Tables for Aboriginal and Torres Strait Islander Australians, 2010–2012
(cat. no. 3302.0.55.003)
Population Characteristics, Aboriginal and Torres Strait Islander Australians, 2006
(cat. no. 4713.0)
Population Distribution, Aboriginal and Torres Strait Islander Australians, 2006
(cat. no. 4705.0)
The Health and Welfare of Australia's Aboriginal and Torres Strait Islander Peoples
(cat. no. 4704.0)
RE L A T E D PU B L I C A T I O N S AN D
RE F E R E N C E S
37 ABS publications draw extensively on information provided freely by individuals,
businesses, governments and other organisations. Their continued cooperation is very
much appreciated; without it, the wide range of statistics published by the ABS would
not be available. Information received by the ABS is treated in strict confidence as
required by the Census and Statistics Act, 1905.
AC K N O W L E D G E M E N T S
36 In this release population estimates and projections, and their components have
sometimes been rounded. Rounded figures and unrounded figures should not be
assumed to be accurate to the last digit shown. Where figures have been rounded,
discrepancies may occur between sums of component items and totals.
RO U N D I N G
New South WalesNSW
Indigenous RegionIREG
estimated resident populationERP
AustraliaAust.
Australian Statistical Geography StandardASGS
age-specific fertility rateASFR
age-specific death rateASDR
Australian Capital TerritoryACT
Australian Bureau of StatisticsABSAB B R E V I A T I O N S
A B S • ES T I M A T E S A N D P R O J E C T I O N S , A B O R I G I N A L A N D T O R R E S ST R A I T I S L A N D E R A U S T R A L I A N S • 3 2 3 8 . 0 • 2 0 0 1 T O 2 0 2 6
55
EX P L A N A T O R Y N O T E S

Western AustraliaWA
VictoriaVic.
total fertility rateTFR
TasmaniaTas.
South AustraliaSA
Remoteness AreaRA
QueenslandQld
Census of Population and Housing Post Enumeration SurveyPES
Other TerritoriesOT
Northern TerritoryNT
56 A B S • ES T I M A T E S A N D P R O J E C T I O N S , A B O R I G I N A L A N D T O R R E S ST R A I T I S L A N D E R A U S T R A L I A N S • 3 2 3 8 . 0 • 2 0 0 1 T O 2 0 2 6
EX P L A N A T O R Y N O T E S
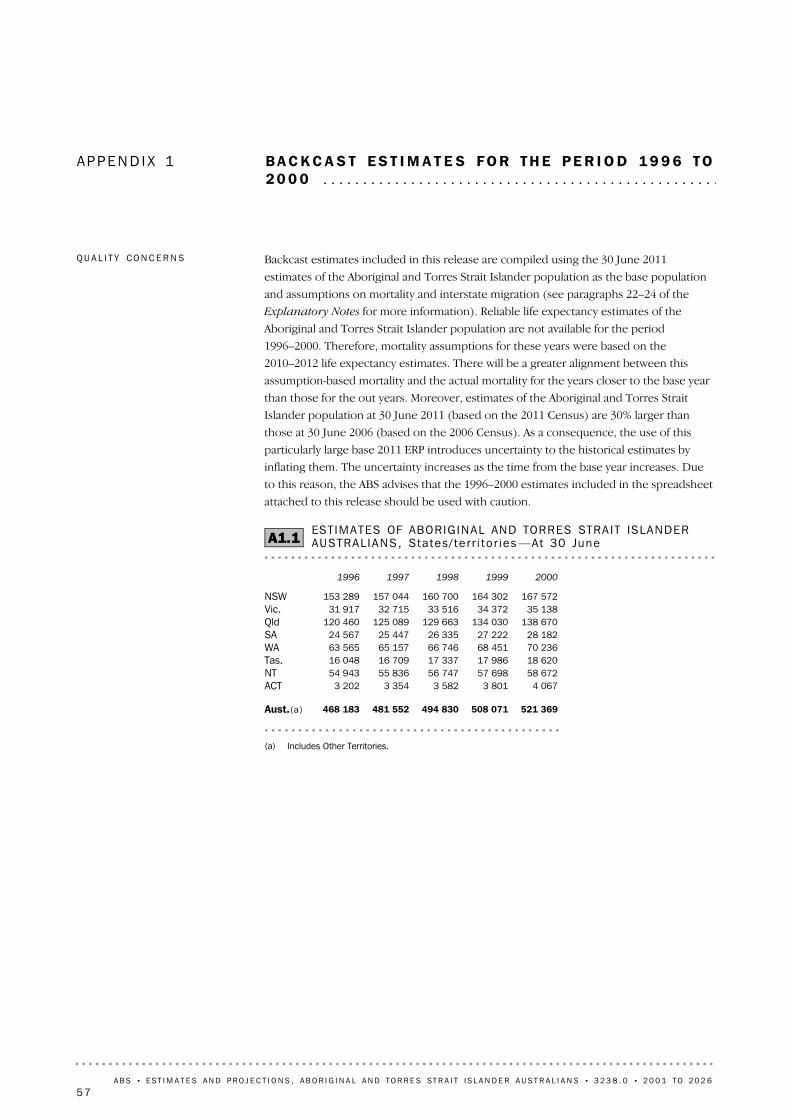
APP E N D I X 1 BA C K C A S T ES T I M A T E S FO R TH E PE R I O D 19 9 6 TO20 0 0 . . . . . . . . . . . . . . . . . . . . . . . . . . . . . . . . . . . . . . . . . . . . . . . . . .
(a) Includes Other Territories.
521 369508 071494 830481 552468 183Aust.(a)
4 0673 8013 5823 3543 202ACT58 67257 69856 74755 83654 943NT18 62017 98617 33716 70916 048Tas.70 23668 45166 74665 15763 565WA28 18227 22226 33525 44724 567SA
138 670134 030129 663125 089120 460Qld35 13834 37233 51632 71531 917Vic.
167 572164 302160 700157 044153 289NSW
20001999199819971996
ESTIMATES OF ABORIG INAL AND TORRES STRAIT ISLANDERAUSTRAL IANS, States / te r r i to r ies —At 30 JuneA1.1
Backcast estimates included in this release are compiled using the 30 June 2011
estimates of the Aboriginal and Torres Strait Islander population as the base population
and assumptions on mortality and interstate migration (see paragraphs 22–24 of the
Explanatory Notes for more information). Reliable life expectancy estimates of the
Aboriginal and Torres Strait Islander population are not available for the period
1996–2000. Therefore, mortality assumptions for these years were based on the
2010–2012 life expectancy estimates. There will be a greater alignment between this
assumption-based mortality and the actual mortality for the years closer to the base year
than those for the out years. Moreover, estimates of the Aboriginal and Torres Strait
Islander population at 30 June 2011 (based on the 2011 Census) are 30% larger than
those at 30 June 2006 (based on the 2006 Census). As a consequence, the use of this
particularly large base 2011 ERP introduces uncertainty to the historical estimates by
inflating them. The uncertainty increases as the time from the base year increases. Due
to this reason, the ABS advises that the 1996–2000 estimates included in the spreadsheet
attached to this release should be used with caution.
QU A L I T Y CO N C E R N S
A B S • ES T I M A T E S A N D P R O J E C T I O N S , A B O R I G I N A L A N D T O R R E S ST R A I T I S L A N D E R A U S T R A L I A N S • 3 2 3 8 . 0 • 2 0 0 1 T O 2 0 2 6
57

APP E N D I X 2 DE R I V I N G NO N - I N D I G E N O U S PO P U L A T I O NES T I M A T E S FO R CO M P A R A T I V E AN A L Y S I S AN DRE P O R T I N G PU R P O S E S . . . . . . . . . . . . . . . . . . . . . . . . . . . . . .
Option 2 involves deriving non-Indigenous population estimates by subtracting
Aboriginal and Torres Strait Islander backcast estimates and projections from total
population projections. The advantages and disadvantages of this option are detailed
below.
Advantages:
! The methods for calculating each population are comparable as both populations
are projections
! Both sets of projections are derived from the same base point and at approximately
the same point in time
OP T I O N 2
Option 1 involves deriving non-Indigenous population estimates by subtracting
Aboriginal and Torres Strait Islander backcast estimates and projections from the total
Australian estimated resident population (ERP) for a given year. This option is currently
being used for national reporting purposes. The advantages and disadvantages are
covered below.
Advantages:
! This option uses the best available number for each population
Disadvantages:
! A mixture of methods is being used — ERP for the total population and projections
and backcast estimates for the Aboriginal and Torres Strait Islander population
OP T I O N 1
After each Census, the ABS produces estimates of the Aboriginal and Torres Strait
Islander population for the Census year only by using information from the Census
(together with some adjustments, the largest being for people missed in the Census).
Using 2001 Census data, the ABS for the first time concurrently produced Aboriginal and
Torres Strait Islander and non-Indigenous population estimates constrained to total
population estimates for 30 June 2001. Accordingly, non-Indigenous population
estimates correspond to the difference between the Aboriginal and Torres Strait Islander
population estimates and the total population estimates. The ABS uses Census year
estimates of the Aboriginal and Torres Strait Islander population and relevant
assumptions on fertility, mortality and migration to compile backcast estimates and
projections of this population group.
Reliable data on births, deaths and migration of the Aboriginal and Torres Strait Islander
population are not available for intercensal years. Due to this reason, it is not possible to
produce credible annual estimates of the Aboriginal and Torres Strait Islander population
and subsequently the non-Indigenous population for intercensal years using a
components based approach. However, the demand for such estimates, particularly as
comparisons for measuring and monitoring differences between various Aboriginal and
Torres Strait Islander and non-Indigenous rates, has substantially increased in recent
years.
This appendix discusses two options for deriving non-Indigenous population estimates
for intercensal years, advantages and disadvantages of these options and then provides a
recommendation about the optimal approach.
CO N T E X T
58 A B S • ES T I M A T E S A N D P R O J E C T I O N S , A B O R I G I N A L A N D T O R R E S ST R A I T I S L A N D E R A U S T R A L I A N S • 3 2 3 8 . 0 • 2 0 0 1 T O 2 0 2 6

The ABS consulted a number of expert stakeholders who agreed that Option 1 is the
preferred method for deriving non-Indigenous population estimates (that is, by
subtracting Aboriginal and Torres Strait Islander backcast estimates and projections from
total population ERP). This option uses the best available number for each population
and hence yields better quality estimates for non-Indigenous population. However,
Option 1 cannot be used when total population ERP is not available (for example, when
considering future trends). In such situations, Option 2 should be used.
As with all advice the ABS provides, the advice given in this article should be considered
in relation to the specific requirements of data users and the appropriateness of the
advice for their needs.
RE C O M M E N D A T I O N
Non-Indigenous population estimates derived using Options 1 and 2 are used in
calculating child (0–4 years) and age-standardised death rates for NSW, Qld, SA, WA, NT
and the total of these five jurisdictions for the periods 2006–2010, 2007–2011 and
2008–2012. Method of calculation is the same as that used for the National Indigenous
Reform Agreement (NIRA), National Healthcare Agreement (NHA) and Health
Performance Framework (HPF) reporting (that is, the average of five years of deaths is
divided by the mid-point population estimates and multiplied by 100,000). Results show
that the difference between the rates based on non-Indigenous population derived using
Option 1 and Option 2 is minimal (less than 3%). This suggests that the non-Indigenous
death rates are not particularly sensitive to the methods used in deriving non-Indigenous
population estimates.
IM P A C T ON NO N - I N D I G E N O U S
MO R T A L I T Y RA T E S
Disadvantages:
! Both sets of projections are based on assumptions of future levels of fertility,
mortality and migration (i.e. it is not measured data)
! Non-Indigenous population is more likely to change demographically (through
fluctuations in NOM) than the projections can effectively foresee
OP T I O N 2 continued
A B S • ES T I M A T E S A N D P R O J E C T I O N S , A B O R I G I N A L A N D T O R R E S ST R A I T I S L A N D E R A U S T R A L I A N S • 3 2 3 8 . 0 • 2 0 0 1 T O 2 0 2 6
59
A P P E N D I X 2 • D E R I V I N G N O N - I N D I G E N O U S P O P U L A T I O N ES T I M A T E S FO R CO M P A R A T I V E A N A L Y S I S A N D R E P O R T I N G P U R P O S E S

APP E N D I X 3 US I N G H I S T O R I C A L ES T I M A T E S OF TH EAB O R I G I N A L AN D TO R R E S ST R A I T I S L A N D E RPO P U L A T I O N FO R CO M P A R A T I V E AN A L Y S I S AN DRE P O R T I N G PU R P O S E S . . . . . . . . . . . . . . . . . . . . . . . . . . . . . .
The Census of Population and Housing (Census) provides the basis of Australia's official
population estimates. For the total Australian population, quarterly estimates can be
produced between Censuses by applying components of population growth (births,
deaths and migration) to the latest Census-based estimate. Generally speaking, the
accuracy of the Census and component data means that only minor adjustments to the
population figures occur after each Census.
However, Aboriginal and Torres Strait Islander Census counts and the quality of data on
births, deaths and migration of Aboriginal and Torres Strait Islander people do not
support the use of the standard approach to population estimation. Instead, the ABS
uses assumptions about future fertility, paternity, life expectancy and migration to
project figures out from each Census. At the same time, it is also necessary to backcast
the Aboriginal and Torres Strait Islander population, because each Census count is
sufficiently different from the last.
The uncertainty in the Census and component data occurs because the Aboriginal and
Torres Strait Islander population is very small compared with the total Australian
population (around 3%), and because the Aboriginal and Torres Strait Islander
population requires people not only to be counted in the Census and component
datasets, but also to be identified as being of Aboriginal or Torres Strait Islander origin.
The differences between the Aboriginal and Torres Strait Islander population estimates
derived from each Census thus tend to be larger than demographic changes can account
for. Each Census-based estimate reflects both the desire of people at that time to be
identified as being of Aboriginal or Torres Strait Islander origin, and the ability at that
time for the information to be effectively collected in the Census.
The Australian Census Longitudinal Dataset (ACLD) also suggests that a certain
proportion of the population will be counted as Aboriginal or Torres Strait Islander in
one Census, but as non-Indigenous in the next, and vice versa (endnote 1).
Graph A3.1, below, shows the percentage increase in estimated resident population
(ERP) between Censuses for both the Aboriginal and Torres Strait Islander population
and the total Australian population, for the last five intercensal periods. The change in
the total population between Censuses remains lower than 10%, and is largely consistent
with birth, death and migration rates observed between Censuses. This is not the case
for the Aboriginal and Torres Strait Islander population, for which implausible
demographic trends would need to have occurred to account for the intercensal
difference.
WH Y TH E AB S RE C A S T S
AB O R I G I N A L AN D TO R R E S
ST R A I T I S L A N D E R
PO P U L A T I O N ES T I M A T E S
AF T E R EA C H CE N S U S
This appendix outlines the issues to consider in choosing an appropriate series of
Aboriginal and Torres Strait Islander population estimates, for the purpose of analysing
or reporting on this population over time.
I N T R O D U C T I O N
60 A B S • ES T I M A T E S A N D P R O J E C T I O N S , A B O R I G I N A L A N D T O R R E S ST R A I T I S L A N D E R A U S T R A L I A N S • 3 2 3 8 . 0 • 2 0 0 1 T O 2 0 2 6

After each Census, the ABS creates a time series for the population based on that Census
count, by projecting and backcasting around this estimate. The backcast series shows
what the Aboriginal and Torres Strait Islander population (based on the latest Census)
would have been in previous periods, based purely on demographic change. Similarly,
the projected series shows how the currently identified Aboriginal and Torres Strait
Islander population may change in future years, if certain demographic assumptions
were to hold. Each Census-based series is independent from the others.
Graph A3.2 shows the five different population series that cover the period 1991–2011,
as well as how each year's estimated population would change if a simple, straight line
interpolation was applied between successive Census-based estimates.
CO M P A R I S O N OF H I S T O R I C A L
SE R I E S
Other collections, such as surveys and administrative datasets also rely on a person's
Indigenous status to be accurately reported and recorded, and therefore may likewise be
susceptible to differing rates of identification, which may also vary over time (endnote 3).
The changing rates of identification of Aboriginal and Torres Strait Islander people in the
Census and other datasets create challenges when comparing data about this population
over time.
1986-91 1991-96 1996-2001 2001-06 2006-11
%change
0
10
20
30
40Aboriginal & Torres Strait Islander populationTotal Australian population
CHANGE IN ESTIMATED RESIDENT POPULAT ION, betweenCensuses
A3.1
Of the increase in the Aboriginal and Torres Strait Islander population observed between
the 2006 and 2011 Censuses, the ABS estimates that 43% was attributable to
demographic change. An estimated 36% of the increase was due to methodological
improvements, with propensity to identify a major contributor to the remaining 21%
unexplained increase (endnote 2).
WH Y TH E AB S RE C A S T S
AB O R I G I N A L AN D TO R R E S
ST R A I T I S L A N D E R
PO P U L A T I O N ES T I M A T E S
AF T E R EA C H CE N S U S continued
A B S • ES T I M A T E S A N D P R O J E C T I O N S , A B O R I G I N A L A N D T O R R E S ST R A I T I S L A N D E R A U S T R A L I A N S • 3 2 3 8 . 0 • 2 0 0 1 T O 2 0 2 6
61
A P P E N D I X 3 • U S I N G H I S T O R I C A L ES T I M A T E S OF T H E A B O R I G I N A L A N D T O R R E S ST R A I T I S L A N D E R P O P U L A T I O N FO R CO M P A R A T I V EA N A L Y S I S A N D R E P O R T I N G P U R P O S E S

(a) Total of NSW, QLD, WA, SA and NT.(b) Uses five-year average deaths, and population for the middle yearof the five-year period.(c) Projected data is based on series B (high projection for2006-based, low projection for 2001-based)
2003 2004 2005 2006 2007 2008 2009 2010
no.
150
175
200
225
250
275 2011-based2006-based (c)2001-based (c)
CHILD MORTAL ITY RATES (0-4 YEARS) (a) (b) , per 100,000popu la t ion – sing le ser ies
A3.3
The use of different Census-based Aboriginal and Torres Strait Islander population
estimates, while showing a similar pattern of change over time, has a considerable
impact on the level of historical child mortality rates, as shown in graph A3.3. When
using a combination of series, as shown in graph A3.4, the downward trend in the rate is
more obvious.
Example 1: Chi ld Mortal i ty
Rates
Often, population estimates for Aboriginal and Torres Strait Islander people are used as
the denominator for rates, to compare data for the Aboriginal and Torres Strait Islanders
population with the non-Indigenous population, or to create time-series indicators about
how various aspects of the well-being of Aboriginal and Torres Strait Islander people are
changing over time. The use of different series of population estimates shown in graph
A3.2 will clearly impact on such indicators.
Following are some examples of the impact that the choice of Aboriginal and Torres
Strait Islander population estimates can have on a rate. The examples use six different
series to demonstrate this:
! the 2011 Census-based series
! the 2006 Census-based series
! the 2001 Census-based series
! a series which uses each Census-based series for the two years before and after that
Census (option 1)
! a series which transitions between Census-based series in a way that minimises the
'jump' in the transition year (option 2)
! linear interpolation between Census estimates.
CO M P A R I S O N OF H I S T O R I C A L
SE R I E S continued
62 A B S • ES T I M A T E S A N D P R O J E C T I O N S , A B O R I G I N A L A N D T O R R E S ST R A I T I S L A N D E R A U S T R A L I A N S • 3 2 3 8 . 0 • 2 0 0 1 T O 2 0 2 6
A P P E N D I X 3 • U S I N G H I S T O R I C A L ES T I M A T E S OF T H E A B O R I G I N A L A N D T O R R E S ST R A I T I S L A N D E R P O P U L A T I O N FO R CO M P A R A T I V EA N A L Y S I S A N D R E P O R T I N G P U R P O S E S

(a) Projected data is based on series B (medium projection for2011-based, high projection for 2006-based, low projection for 2001-based).(b) For the 2001-based series, data for 2010 onwards is pro-ratedfrom five-year age groups.
2001 2003 2005 2007 2009 2011 2013
%
70
80
90
100
110
120
1302011-based2006-based2001-based (b)
FULL-T IME SCHOOL ENROLMENTS (a) , Propor t ion of 6–15 yearolds – sing le ser ies
A3.5
In the case of school enrolments data, the use of previous Census-based series generates
impossible results, with rates exceeding 100%. In contrast, when using a combination of
Census-based population series (graph A3.6), the enrolment rates remain plausible
throughout, although there is no longer a clear trend in the time-series. Further analysis
would be needed to determine the most appropriate choice of Aboriginal and Torres
Strait Islander population estimates. In particular, the choice may depend on an
understanding of how identification rates in the enrolment data (numerator) had
changed over time.
Example 2: School Enrolments
(a) Total of NSW, QLD, WA, SA and NT.(b) Uses five-year average deaths, and population for the middle yearof the five-year period.(c) Option 2 uses the 2001 Census-based estimate for 2001 & 2002,the 2006 Census-based estimate for 2003–2007, and the 2011Census-based estimate for 2008 onwards.
2003 2004 2005 2006 2007 2008 2009 2010
no.
150
175
200
225
250
275 Option 1Option 2 (c)Interpolated
CHILD MORTAL ITY RATES (0-4 YEARS) (a) (b) , per 100,000popu la t ion – combinat ion of ser ies
A3.4
Example 1: Chi ld Mortal i ty
Rates continued
A B S • ES T I M A T E S A N D P R O J E C T I O N S , A B O R I G I N A L A N D T O R R E S ST R A I T I S L A N D E R A U S T R A L I A N S • 3 2 3 8 . 0 • 2 0 0 1 T O 2 0 2 6
63
A P P E N D I X 3 • U S I N G H I S T O R I C A L ES T I M A T E S OF T H E A B O R I G I N A L A N D T O R R E S ST R A I T I S L A N D E R P O P U L A T I O N FO R CO M P A R A T I V EA N A L Y S I S A N D R E P O R T I N G P U R P O S E S

(a) Total of NSW, QLD, WA, SA and NT.(b) Uses five-year average deaths, and population for the middle yearof the five-year period.(c) Projected data is based on series B (high projection for2006-based, low projection for 2001-based).
2003 2004 2005 2006 2007 2008 2009 2010
no.
600
800
1000
1200
1400
2011 based2006 based (c)2001 based (c)
STANDARDISED DEATH RATES (a) (b) , per 100,000 popu la t ion– sing le ser ies
A3.7
In the case of age-standardised death rates, the use of different Aboriginal and Torres
Strait Islander population estimates changes the direction of the trend, as seen in the
2001-based series. This change between the 2001-based and 2006-based data was the
result of an improvement to ERP – specifically, using date of birth information from the
2006 Census to derive better estimates of the population at the older age groups in 2006
compared with 2001. For this reason, it is always recommended not to use 2001-based
estimates when reporting on older age groups.
Example 3: Standardised
Death Rates
(a) Option 2 uses the 2001 Census-based estimate for 2001 & 2002,the 2006 Census-based estimate for 2003–2007, and the 2011Census-based estimate for 2008 onwards.
2001 2003 2005 2007 2009 2011 2013
%
70
80
90
100
110
120
130Option 1Option 2 (a)Interpolated
FULL-T IME SCHOOL ENROLMENTS, Propor t ion of 6–15 yearolds – combinat ion of ser ies
A3.6
Example 2: School Enrolments
continued
64 A B S • ES T I M A T E S A N D P R O J E C T I O N S , A B O R I G I N A L A N D T O R R E S ST R A I T I S L A N D E R A U S T R A L I A N S • 3 2 3 8 . 0 • 2 0 0 1 T O 2 0 2 6
A P P E N D I X 3 • U S I N G H I S T O R I C A L ES T I M A T E S OF T H E A B O R I G I N A L A N D T O R R E S ST R A I T I S L A N D E R P O P U L A T I O N FO R CO M P A R A T I V EA N A L Y S I S A N D R E P O R T I N G P U R P O S E S

The question of which historical population series to use depends on the purposes of
the analysis. The following provides guidelines to help in making these decisions.
The 2011-based series is the most accurate and up-to-date series currently produced by
the ABS, including in terms of the methodology used in the Census collection and in the
estimation/projection processes. Wherever possible, the 2011-based series should be
used. This includes any of the following scenarios:
! for demographic analysis of the Aboriginal and Torres Strait Islander population
! for forward-looking analysis (i.e. from 2011 onwards), for any purpose
! as the denominator of rates being compared over time, if:
! the time series is short, generally no further back than the penultimate (2006)
Census
! the numerator data are known to have been fairly consistently high over time
! analysis is restricted to remote geographies, where the impact of increased
identification is much lower than in non-remote areas (8% compared with 24%
increase in the 2011 Census)
! when there is a known quality issue in the data from earlier Censuses (such as
the older age groups in the 2001 Census, mentioned above).
Using a range of different Census-based population estimate series could be considered
when:
! transitioning from one series to the next will maximise consistency of identification
levels and coverage between the numerator and the denominator
! historical rates are thought to be artificially deflated when using the 2011-based
population estimates (usually due to lower identification rates in the numerator
series in earlier years)
WH I C H SE R I E S TO US E
In each of the examples above, of the three methods of transition between population
estimate series shown, the rate time-series is smoothest when using a linear
interpolation between Census year estimates. Changing from one Census-based series to
the next results in a sharp drop in the rate at the changeover point. This can be seen
around 2003 and around 2008, with the later transition being far more significant. 2013
would be the equivalent 'decision point' for the current intercensal period. The extent of
the 2013 transition will not be known until after the 2016 Census-based ERP series
becomes available.
(a) Total for NSW, QLD, WA, SA, NT.(b) Uses five-year average deaths, and population for the middle yearof the five-year period.(c) Option 2 uses the 2001 Census-based estimate for 2001 & 2002,the 2006 Census-based estimate for 2003–2007, and the 2011Census-based estimate for 2008 onwards.
2003 2004 2005 2006 2007 2008 2009 2010
no.
600
800
1000
1200
1400
Option1Option 2 (c)interpolated
STANDARDISED DEATH RATES (a) (b) , per 100,000 popu la t ion– combinat ion of ser ies
A3.8
Example 3: Standardised
Death Rates continued
A B S • ES T I M A T E S A N D P R O J E C T I O N S , A B O R I G I N A L A N D T O R R E S ST R A I T I S L A N D E R A U S T R A L I A N S • 3 2 3 8 . 0 • 2 0 0 1 T O 2 0 2 6
65
A P P E N D I X 3 • U S I N G H I S T O R I C A L ES T I M A T E S OF T H E A B O R I G I N A L A N D T O R R E S ST R A I T I S L A N D E R P O P U L A T I O N FO R CO M P A R A T I V EA N A L Y S I S A N D R E P O R T I N G P U R P O S E S

(1) The ACLD links a 5% sample of Census records from the 2006 to 2011 Census. The
ACLD can be accessed from
http://www.abs.gov.au/websitedbs/censushome.nsf/home/acld?opendocument&navpos
=267
(2) For more information on the increase between the 2006 and 2011 Census counts, see
Census of Population and Housing: Understanding the Increase in Aboriginal and
Torres Strait Islander Counts, 2006-2011 (cat. no. 2077.0). For information on the
increase between 1991 and 1996, see Occasional Paper: Population Issues, Indigenous
Australians, 1996 (cat. no. 4708.0)
(3) For further discussion of how and why identification differs between contexts, see
Information Paper: Perspectives on Aboriginal and Torres Strait Islander
Identification in Selected Data Collection Contexts, 2012 (cat. no. 4726.0)
(4) For an example of data linkage, see Information paper: Death registrations to
Census linkage project - Key Findings for Aboriginal and Torres Strait Islander peoples,
2001-2012 (cat. no. 3302.0.55.005)
EN D N O T E S
A new series for Aboriginal and Torres Strait Islander population estimates will be
produced following the 2016 Census. Depending on how the 2016 Census-based
estimate compares with the 2011 Census-based estimate, current indicator trends may
change as a result of rebasing any population estimates to the new Census.
Aboriginal and Torres Strait Islander population projections are produced to illustrate
potential future demographic changes to the currently identified population. The
2011-based projections therefore do not include any assumption variable on propensity
to identify. Anyone considering the future population should consider their
requirements for a projection based on a change in propensity to identify, and note that
the ABS projections cannot be used for this purpose.
Impact of Future Changes
! there is a known relationship between identification in the numerator data and the
Census data. Data linkage may be used to inform on this relationship (endnote 4).
This relationship may be applied to the 2011-based series as a factor, or be used to
inform the choice of a transitional series
! data confrontation using supplementary data sources indicates that the 2011-based
population estimates do not produce a plausible result.
In some cases, an alternative data source may exist which is more comparable/consistent
with the numerator data, and could be used rather than a population estimate series. For
example,
! survey data should be compared to the survey population. That is, re-weighting past
surveys to the latest population estimate series is not generally recommended.
! analysis of Census data should be based on Census counts rather than population
estimates (endnote 5).
! numerator data could be compared to a denominator that is internally consistent,
rather than to population estimates – for example retention rates (15 year-old
students in 2013 as a percentage of 12 year-old students in 2010) produces a more
coherent time-series than enrolment rates (15 year-old students as a percentage of
15 year-old population).
If in any doubt, the ABS recommends that data users conduct their own analysis, for
example similar to that illustrated in the examples above. This will highlight the impact
of non-demographic changes on their particular area of interest.
WH I C H SE R I E S TO US E
continued
66 A B S • ES T I M A T E S A N D P R O J E C T I O N S , A B O R I G I N A L A N D T O R R E S ST R A I T I S L A N D E R A U S T R A L I A N S • 3 2 3 8 . 0 • 2 0 0 1 T O 2 0 2 6
A P P E N D I X 3 • U S I N G H I S T O R I C A L ES T I M A T E S OF T H E A B O R I G I N A L A N D T O R R E S ST R A I T I S L A N D E R P O P U L A T I O N FO R CO M P A R A T I V EA N A L Y S I S A N D R E P O R T I N G P U R P O S E S

(5) For more information on the difference between Census counts and Census year
population estimates, see Estimates of Aboriginal and Torres Strait Islander
Australians, June 2011, Technical Note 1: Estimated Resident Aboriginal and Torres
Strait Islander Population - Method of Calculation (cat. no. 3238.0.55.001).
EN D N O T E S continued
A B S • ES T I M A T E S A N D P R O J E C T I O N S , A B O R I G I N A L A N D T O R R E S ST R A I T I S L A N D E R A U S T R A L I A N S • 3 2 3 8 . 0 • 2 0 0 1 T O 2 0 2 6
67
A P P E N D I X 3 • U S I N G H I S T O R I C A L ES T I M A T E S OF T H E A B O R I G I N A L A N D T O R R E S ST R A I T I S L A N D E R P O P U L A T I O N FO R CO M P A R A T I V EA N A L Y S I S A N D R E P O R T I N G P U R P O S E S

GL O S S A R Y . . . . . . . . . . . . . . . . . . . . . . . . . . . . . . . . . . . . . . . . . . . .
The delivery of a child, irrespective of the duration of pregnancy, who, after being born,breathes or shows any evidence of life such as heartbeat.
Birth
where P0 is the population at the start of the period, Pn is the population at the end ofthe period and n is the length of the period between P0 and Pn in years.
Pn
P0
1n
− 1 % 100
The average annual growth rate, r, is calculated as a percentage using the formula:Average annual growth rate
The number of live births (either occurred or registered) during the calendar year,according to the age of the father, per 1,000 of the male estimated resident population ofthe same age at 30 June. In the calculation of these rates, births to fathers under 15 yearsare included in the 15–19 years age group, and births to fathers aged 50 years and overare included in the 45–49 years age group. Pro rata adjustment is made for births forwhich the age of the father is not given.
Age-specific paternity rates
The number of live births (either occurred or registered) during the calendar year,according to the age of the mother, per 1,000 of the female estimated residentpopulation of the same age at 30 June. In the calculation of these rates, births to mothersunder 15 years are included in the 15–19 years age group, and births to mothers aged 50years and over are included in the 45–49 years age group. Pro rata adjustment is madefor births for which the age of the mother is not given.
Age-specific fertility rates
The number of deaths (either occurred or registered) during the calendar year at aspecified age per 1,000 of the estimated resident population of the same age at themid-point of the year (30 June). Pro rata adjustment is made in respect of deaths forwhich the age of the deceased is not given.
Age-specific death rates
A bar chart graphically representing the age structure of the population, usually infive-year age groups, for males and females separately. The age structure of thepopulation usually approximates the shape of a pyramid because mortality progressivelyreduces the number in each birth cohort as it ages. The age pyramid is useful to showthe existence of unusually large or small cohorts, and in this way, not only conveysinformation about a country's past demographic history, but also a great deal about itsdemographic future.
Age-sex pyramid
The phenomenon of uneven population age distribution in Census or survey data. Whenage heaping occurs, data show systematic spikes on particular ages such as those endingin 0 or 5. This happens as a result of 'digit preference' or rounding when respondents areunsure of their age or the age of others they are reporting on behalf of.
Age heaping
The death of a person who is recorded as being an Aboriginal, Torres Strait Islander orboth on the Death Registration Form (DRF). From 2007, Indigenous status for deathsregistered in South Australia, Western Australia, Tasmania, the Northern Territory andthe Australian Capital Territory is also derived from the Medical Certificate of Cause ofDeath (MCCD). If the Indigenous status report on the DRF does not agree with that onthe MCCD, an identification from either source that the deceased was an Aboriginaland/or Torres Strait Islander persons is given preference over non-Indigenous.
Aboriginal and Torres StraitIslander death
The birth of a live-born child where either the mother or the father was identified asbeing of Aboriginal or Torres Strait Islander origin on the birth registration form.
Aboriginal and Torres StraitIslander birth
68 A B S • ES T I M A T E S A N D P R O J E C T I O N S , A B O R I G I N A L A N D T O R R E S ST R A I T I S L A N D E R A U S T R A L I A N S • 3 2 3 8 . 0 • 2 0 0 1 T O 2 0 2 6

Net interstate migration is the net gain or loss of population though interstate migrationbeing the change of a person's place of usual residence from one state or territory toanother state or territory.
Net interstate migration
Excess of births over deaths.Natural increase
The difference in mortality when comparing one population group with another. In thisrelease, it is calculated as the ratio of life expectancy at birth for a particular geographicregion (e.g. state/territory) over the life expectancy at birth for Australia.
Mortality Differentials
The movement of people across a specified boundary for the purpose of establishing anew or semi-permanent residence. Migration can be international (migration betweencountries) and internal (migration within a country).
Migration
For any distribution the median value is that which divides the relevant population intotwo equal parts, half falling below the value, and half exceeding it. Thus, the median ageis the age at which half the population is older and half is younger.
Median age
A tabular, numerical representation of mortality and survivorship of a cohort of births ateach age of life. The conventional life table is based on the assumption that as the cohortpasses through life it experiences mortality at each age in accordance with apredetermined pattern (usually based upon death rates from a real population during aparticular period of time) of mortality rates which do not change from year to year. Thelife table thus constitutes a hypothetical model of mortality, and it does not describe theactual mortality which characterises a cohort as it ages.
Life tables may be complete or abridged, depending on the age interval used in theircompilation. Complete life tables such as those for the Australian population containdata by single years of age, while abridged life tables, such as those for the Aboriginal andTorres Strait Islander population, contain data for five-year age groups. Due todifferences in mortality patterns between males and females at different ages, life tablesare generally constructed separately for each sex.
Life table
The average number of additional years a person of a given age and sex might expect tolive if the age-specific death rates of each period continued throughout his/her lifetime.
Life expectancy
The time period between 30 June in the previous Census year and 30 June of the latest Census year.
Intercensal period
Indigenous Regions (IREGs) are large geographical units loosely based on the formerAboriginal and Torres Strait Islander Commission boundaries. They are created byaggregating one or more Indigenous Areas.
Indigenous Region (IREG)
The official measure of the population of Australia is based on the concept of usualresidence. It refers to all people, regardless of nationality, citizenship or legal status, whousually live in Australia, with the exception of foreign diplomatic personnel and theirfamilies. It includes usual residents who are overseas for less than 12 months over a 16month period. It excludes overseas visitors who are in Australia for less than 12 monthsover a 16 month period.
Estimates of the Australian resident population are generated on a quarterly basis byadding natural increase (the excess of births over deaths) and net overseas migration(NOM) occurring during the period to the population at the beginning of each period.
Estimated resident population(ERP)
The permanent disappearance of all evidence of life after birth has taken place. Thedefinition excludes all deaths prior to live birth. For the purposes of the ABS DeathRegistration collection, a death refers to any death which occurs in, or en route toAustralia and is registered with a state or territory Registry of Births, Deaths andMarriages.
Death
Completed fertility represents the average number of births a cohort of females haveborne over their reproductive lifetimes.
Completed fertility
A B S • ES T I M A T E S A N D P R O J E C T I O N S , A B O R I G I N A L A N D T O R R E S ST R A I T I S L A N D E R A U S T R A L I A N S • 3 2 3 8 . 0 • 2 0 0 1 T O 2 0 2 6
69
GL O S S A R Y

The intercensal growth in the Aboriginal and Torres Strait Islander population countsthat cannot be fully explained by births, deaths and migration.
Unexplained growth
The sum of age-specific paternity rates expressed as a rate per man. It represents thenumber of children a male would father during his lifetime if he experienced currentage-specific paternity rates at each age of his reproductive life.
Total paternity rate (TPR)
The sum of age-specific fertility rates expressed as rate per woman. It represents thenumber of children a female would bear during her lifetime if she experienced currentage-specific fertility rates at each age of her reproductive life.
Total fertility rate (TFR)
State or territory of usual residence refers to the state or territory of usual residence of:! the population;! the mother (Birth Registrations collection); and! the deceased (Death Registrations collection).
State/territory of usualresidence
The number of males per 100 females.Sex ratio
An aggregation of non-continuous geographical areas which share commoncharacteristics of remoteness. The delimitation criteria for Remoteness Areas (RAs) arebased on the Accessibility/Remoteness Index of Australia (ARIA+) which measures theremoteness of a point based on the road distance to the nearest urban centre. The RAcategories range from Major Cities to Very Remote. Within the Australian StatisticalGeography Standard, each RA is created from a grouping of Statistical Areas Level 1having a particular degree of remoteness.
Remoteness Area
A household survey conducted three to four weeks after the Census. The PES allows theABS to estimate the number of people who should have been counted in the Censuscompared to the number who were. Results from the PES contribute to a more accuratecalculation of the estimated resident population (ERP) for Australia and the states andterritories which is then backdated to 30 June of the Census year.
Post Enumeration Survey (PES)
Following the 1992 amendments to the Acts Interpretation Act to include the IndianOcean Territories of Christmas Island and the Cocos (Keeling) Islands as part ofgeographic Australia, another category of the state and territory level has been created,known as Other Territories. Other Territories include Jervis Bay Territory, previouslyincluded with the Australian Capital Territory, as well as Christmas Island and the Cocos(Keeling) Islands.
Other Territories
The difference between the actual Census count (including imputations) and an estimateof the number of people who should have been counted in the Census. This estimate isbased on the Post Enumeration Survey (PES) conducted after each Census. For acategory of person (e.g. based on age, sex and state of usual residence), net undercountis the resultant of Census undercount, overcount, misclassification and imputation error.
Net undercount
For Australia, net population growth is the sum of natural increase and net overseasmigration. For the states and territories, net population growth also includes netinterstate migration.
Net population growth
Net overseas migration is the net gain or loss of population through immigration toAustralia and emigration from Australia.
Net overseas migration
70 A B S • ES T I M A T E S A N D P R O J E C T I O N S , A B O R I G I N A L A N D T O R R E S ST R A I T I S L A N D E R A U S T R A L I A N S • 3 2 3 8 . 0 • 2 0 0 1 T O 2 0 2 6
GL O S S A R Y

B I B L I O G R A P H Y . . . . . . . . . . . . . . . . . . . . . . . . . . . . . . . . . . . . . . .
ABS and AIHW 2012, The Health and Welfare of Australia's Aboriginal and Torres Strait
Islander Peoples, cat. no. 4704.0, ABS, Canberra.
ABS 2009, Experimental Estimates and Projections, Aboriginal and Torres Strait
Islander Australians, 1991 to 2021, cat. no. 3238.0, ABS, Canberra.
ABS 2013, Census of Population and Housing: Understanding the Increase in
Aboriginal and Torres Strait Islander Counts, 2006–2011, cat. no. 2077.0, ABS,
Canberra.
ABS 2013, Estimates of Aboriginal and Torres Strait Islander Australians, June 2011,
cat. no. 3238.0.55.001, ABS, Canberra.
ABS 2013, Life Tables for Aboriginal and Torres Strait Islander Australians, 2010–2012,
cat. no. 3302.0.55.003, ABS, Canberra.
ABS 2013, Population Projections, Australia, 2012 (base) to 2101, cat. no. 3222.0, ABS,
Canberra.
ABS various years, Births, Australia, cat. no. 3301.0, ABS, Canberra
ABS various years, Deaths, Australia, cat. no. 3302.0, ABS, Canberra.
Gray A 1997, The Explosion of Aboriginality: Components of Indigenous Population
Growth 1991–1996, Discussion Paper no. 142/1997, Centre for Aboriginal
Economic Policy Research, Australian National University, Canberra.
Wang Z and Li SW 2010, Mortality in the Northern Territory 1967–2006, Health Gains
Planning Information Sheet, Dec 2010, Northern Territory Government,
Casuarina NT.
Wilson T, Condon JR and Barnes T 2007, Northern Territory Indigenous Life Expectancy
Improvements, 1967–2004, Australian and New Zealand Journal of Public
Health, vol. 31, no. 2, pp 184–8.
A B S • ES T I M A T E S A N D P R O J E C T I O N S , A B O R I G I N A L A N D T O R R E S ST R A I T I S L A N D E R A U S T R A L I A N S • 3 2 3 8 . 0 • 2 0 0 1 T O 2 0 2 6
71

www.abs.gov.auWEB ADDRESS
All statistics on the ABS website can be downloaded freeof charge.
F R E E A C C E S S T O S T A T I S T I C S
Client Services, ABS, GPO Box 796, Sydney NSW 2001POST
1300 135 211FAX
1300 135 070PHONE
Our consultants can help you access the full range ofinformation published by the ABS that is available free ofcharge from our website. Information tailored to yourneeds can also be requested as a 'user pays' service.Specialists are on hand to help you with analytical ormethodological advice.
I N F O R M A T I O N A N D R E F E R R A L S E R V I C E
www.abs.gov.au the ABS website is the best place fordata from our publications and information about the ABS.
INTERNET
F O R M O R E I N F O R M A T I O N . . .
© Commonwealth of Australia 2014Produced by the Australian Bureau of Statistics
32
38
.0
•
ES
TI
MA
TE
S
AN
D
PR
OJ
EC
TI
ON
S,
AB
OR
IG
IN
AL
AN
D
TO
RR
ES
S
TR
AI
T IS
LA
ND
ER
A
US
TR
AL
IA
NS
•
20
01
to 2
02
6