3557 2 review v 8qfhuwdlqw\vxuurxqglqjqhjrwldwlrqvrqkrzwrghdozlwk86ilvfdolvvxhv ³ilvfdofolii´...
TRANSCRIPT

3557
University of Western Ontario
Manager: Phil Cotterill
www.cclinvest.com
QUARTERLY REPORT December 31, 2012

3557

3557
Executive Summary Market Review and Outlook Performance and Attribution Canadian Equities Mandate Review Quarterly Corporate Update Commissions Web-Based Reports (www.cclinvest.com) Portfolio Statements
1
2
3
4
7
8
9
10
12
TABLE OF CONTENTS December 31, 2012
3557
1
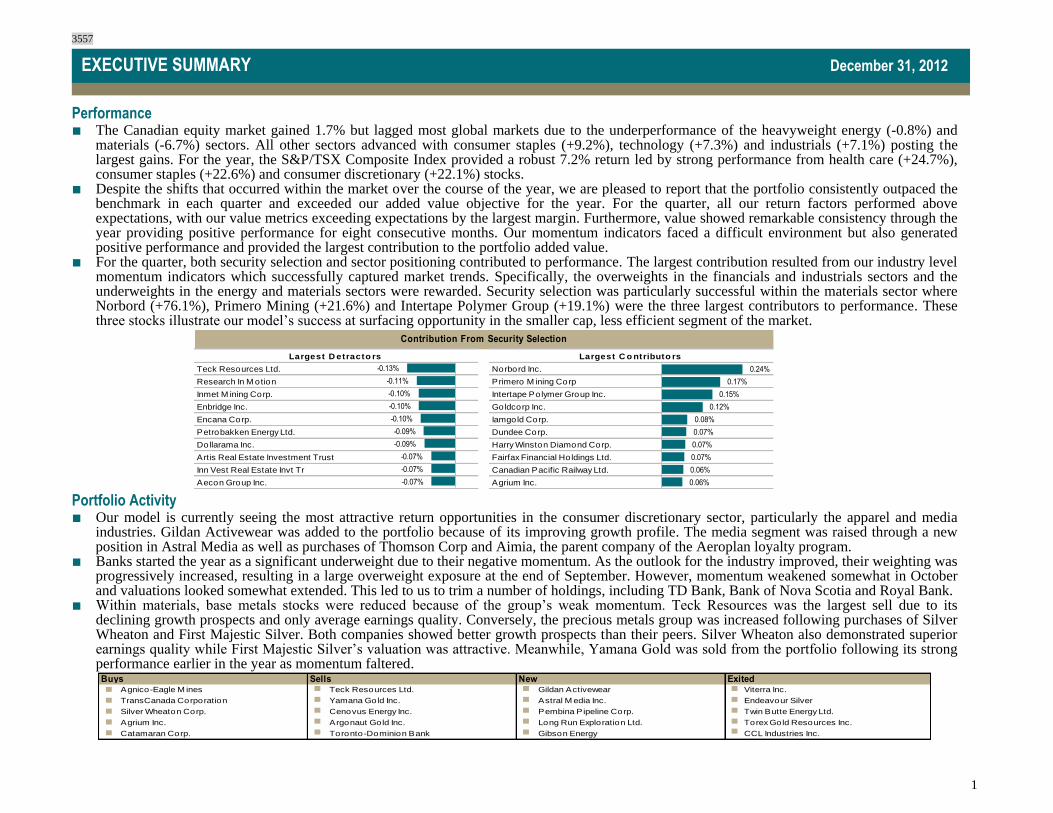
Performance ■ The Canadian equity market gained 1.7% but lagged most global markets due to the underperformance of the heavyweight energy (-0.8%) and
materials (-6.7%) sectors. All other sectors advanced with consumer staples (+9.2%), technology (+7.3%) and industrials (+7.1%) posting the largest gains. For the year, the S&P/TSX Composite Index provided a robust 7.2% return led by strong performance from health care (+24.7%), consumer staples (+22.6%) and consumer discretionary (+22.1%) stocks.
■ Despite the shifts that occurred within the market over the course of the year, we are pleased to report that the portfolio consistently outpaced the benchmark in each quarter and exceeded our added value objective for the year. For the quarter, all our return factors performed above expectations, with our value metrics exceeding expectations by the largest margin. Furthermore, value showed remarkable consistency through the year providing positive performance for eight consecutive months. Our momentum indicators faced a difficult environment but also generated positive performance and provided the largest contribution to the portfolio added value.
■ For the quarter, both security selection and sector positioning contributed to performance. The largest contribution resulted from our industry level momentum indicators which successfully captured market trends. Specifically, the overweights in the financials and industrials sectors and the underweights in the energy and materials sectors were rewarded. Security selection was particularly successful within the materials sector where Norbord (+76.1%), Primero Mining (+21.6%) and Intertape Polymer Group (+19.1%) were the three largest contributors to performance. These three stocks illustrate our model’s success at surfacing opportunity in the smaller cap, less efficient segment of the market.
Teck Resources Ltd. -0.13% Norbord Inc. 0.24%
Research In M otion -0.11% Primero M ining Corp 0.17%
Inmet M ining Corp. -0.10% Intertape Polymer Group Inc. 0.15%
Enbridge Inc. -0.10% Goldcorp Inc. 0.12%
Encana Corp. -0.10% Iamgold Corp. 0.08%
Petrobakken Energy Ltd. -0.09% Dundee Corp. 0.07%
Dollarama Inc. -0.09% Harry Winston Diamond Corp. 0.07%
Artis Real Estate Investment Trust -0.07% Fairfax Financial Holdings Ltd. 0.07%
Inn Vest Real Estate Invt Tr -0.07% Canadian Pacific Railway Ltd. 0.06%
Aecon Group Inc. -0.07% Agrium Inc. 0.06%
Contribution From Security Selection
Largest D etracto rs Largest C o ntributo rs
-0.13%
-0.11%
-0.10%
-0.10%
-0.10%
-0.09%
-0.09%
-0.07%
-0.07%
-0.07%
0.24%
0.17%
0.15%
0.12%
0.08%
0.07%
0.07%
0.07%
0.06%
0.06%
Portfolio Activity ■ Our model is currently seeing the most attractive return opportunities in the consumer discretionary sector, particularly the apparel and media
industries. Gildan Activewear was added to the portfolio because of its improving growth profile. The media segment was raised through a new position in Astral Media as well as purchases of Thomson Corp and Aimia, the parent company of the Aeroplan loyalty program.
■ Banks started the year as a significant underweight due to their negative momentum. As the outlook for the industry improved, their weighting was progressively increased, resulting in a large overweight exposure at the end of September. However, momentum weakened somewhat in October and valuations looked somewhat extended. This led to us to trim a number of holdings, including TD Bank, Bank of Nova Scotia and Royal Bank.
■ Within materials, base metals stocks were reduced because of the group’s weak momentum. Teck Resources was the largest sell due to its declining growth prospects and only average earnings quality. Conversely, the precious metals group was increased following purchases of Silver Wheaton and First Majestic Silver. Both companies showed better growth prospects than their peers. Silver Wheaton also demonstrated superior earnings quality while First Majestic Silver’s valuation was attractive. Meanwhile, Yamana Gold was sold from the portfolio following its strong performance earlier in the year as momentum faltered.
Buys Sells New ExitedAgnico-Eagle M ines Teck Resources Ltd. Gildan Activewear Viterra Inc.
TransCanada Corporation Yamana Gold Inc. Astral M edia Inc. Endeavour Silver
Silver Wheaton Corp. Cenovus Energy Inc. Pembina Pipeline Corp. Twin Butte Energy Ltd.
Agrium Inc. Argonaut Gold Inc. Long Run Exploration Ltd. Torex Gold Resources Inc.
Catamaran Corp. Toronto-Dominion Bank Gibson Energy CCL Industries Inc.
EXECUTIVE SUMMARY December 31, 2012
1

3557
2
Review ■ Uncertainty surrounding negotiations on how to deal with US fiscal issues (“fiscal cliff”) resulted in North American bond and equity markets
trading within a fairly narrow range throughout most of the fourth quarter. However, some modest gains were recorded as the S&P/TSX Composite Index gained 1.7% while the S&P 500 Index returned 0.8% in Canadian dollar terms (-0.4% in US$). Fixed income markets barely squeaked into the positive column with the DEX Universe Bond Index providing a 0.3% return and the DEX Long Term Bond Index only 0.1%.
■ Foreign equity markets fared much better as European stocks advanced 5.2% thanks to some further progress in dealing with the region’s sovereign debt crisis. Asian markets advanced by 12.7% led by Japan and China. The Japanese authorities moved to increase stimulus spending while the Bank of Japan adopted a more aggressive quantitative easing program. The Shanghai Index got a major lift as the fear of a hard landing in China abated and new leadership took the reins of power.
■ Fixed income markets were helped by central bankers’ ongoing commitment to holding down short-term yields (real yields are negative in North America) and the use of unconventional monetary tools such as quantitative easing. Higher yielding corporate bonds and some modest tightening in spreads led to the small gains posted by the DEX Universe Bond Index. The Bank of Canada made no changes to its monetary policy.
Market Statistics Stock Market Indices (Total Return C$) 31/12/2012 28/09/2012 % Change Bond Yields 31/12/2012 28/09/2012 Change
S&P/TSX Composite 35,697 35,094 1.7% Canada:
S&P/TSX 60 1,655 1,617 2.3% 1-Year Gov 't 1.09% 1.07% 0.02%
S&P/TSX Small 799 815 -2.0% 5-Year Gov 't 1.38% 1.30% 0.08%
Dow Jones 24,880 25,022 -0.6% 10-Year Gov 't 1.80% 1.73% 0.07%
S&P 500 2,494 2,474 0.8% 30-Year Gov 't 2.37% 2.32% 0.04%
Nasdaq (Price only ) 3,007 3,066 -1.9% US:
MSCI EAFE 5,415 5,020 7.9% 1-Year Gov 't 0.16% 0.17% -0.01%
MSCI World ex -Canada 4,337 4,180 3.8% 5-Year Gov 't 0.73% 0.64% 0.09%
Currencies 10-Year Gov 't 1.76% 1.64% 0.12%
US$/C$ 1.00 0.98 1.2% 30-Year Gov 't 2.95% 2.83% 0.12%
Yen/US$ 86.47 77.80 11.1% Money Market Rates
US$/Euro 1.32 1.29 2.5% Canada 3-mth T-Bill 0.93% 0.97% -0.04%
Commodities US 3-mth T-Bill 0.04% 0.09% -0.06%
Gold (US$/Troy Ounce) 1,662.41 1,774.45 -6.3% Canada Ov ernight Rate 1.00% 1.00% 0.00%
Oil (WTI, US$/Barrel) 91.82 91.85 0.0% US Fed Funds 0.25% 0.25% 0.00%
Natural Gas 3.40 3.08 10.5% Canada Prime Rate 3.00% 3.00% 0.00%
CRB - All Commodities Index 554.62 580.24 -4.4% US Prime Rate 3.25% 3.25% 0.00%
Outlook ■ Over the next year we expect to see a modest acceleration in global growth (3.3% to 3.8%). Our forecast is based on recent improvements in
global manufacturing (PMI) and industrial production, US consumer confidence/activity, a turnaround in the US housing market, a pick-up in Chinese money and credit growth, and the ongoing monetary support provided by global central bankers. Furthermore, excess capacity will help to maintain the current low inflation environment.
■ There are risks to our modest growth scenario including government austerity programs that become too draconian, a stalemate in US debt ceiling negotiations (credit downgrade), a policy misstep in Europe, rising food inflation in China and an energy shock due to increased conflict in the Middle East. However, risks are roughly in balance with the positive opportunity set we foresee and arguably the situation is tilted to the upside.
■ Given the foregoing and the fact that equity markets remain attractive from a valuation perspective (relatively low P/E multiples with dividend yields higher than government bond yields) and from a technical perspective (momentum models are all positive), an overweight in equities and credit seems appropriate.
MARKET REVIEW AND OUTLOOK December 31, 2012
2

3557
3
Performance
2012 (%)
QTR 1 YR 2 YR 3 YR 4 YR 5 YR Since
Inception
2011 2010 2009 2008
Total Portfolio 2.7 9.7 0.4 6.8 13.1 2.3 8.4 -8.2 21.0 34.3 -31.6
S&P/TSX Composite Index 1.7 7.2 -1.1 4.8 11.7 0.8 7.4 -8.7 17.6 35.1 -33.0
Added Value 1.0 2.6 1.4 2.0 1.4 1.5 1.0 0.5 3.4 -0.8 1.4
Inflation (Canada CPI) -0.1 1.4 1.9 2.0 1.8 1.7 1.8 2.3 2.4 1.3 1.2
Annualized (%) Annual Ending December 31 (%)
Inception Date July 9, 2004
All returns are gross of fees except where noted. Added value may differ due to rounding to 1 decimal place.
Attribution
Total
Attribution
Security
Selection
Sector
Selection
Total
Attribution
Security
Selection
Sector
Selection
Energy 0.0% -0.1 0.1 0.5% 0.4 0.1
Materials 0.8% 0.7 0.1 1.2% 1.1 0.1
Industrials 0.2% 0.0 0.1 0.6% 0.5 0.1
Consumer Discretionary 0.0% 0.0 0.0 -0.1% 0.2 -0.3
Consumer Staples -0.2% -0.1 -0.1 0.3% 0.3 0.0
Health Care 0.0% 0.0 0.0 0.1% 0.0 0.0
Financials 0.1% 0.0 0.2 -0.2% -0.2 0.0
Information Technology 0.0% -0.1 0.1 0.1% 0.2 -0.2
Telecommunication Serv ices 0.0% 0.0 0.0 0.2% 0.1 0.0
Utilities 0.0% 0.0 0.0 0.0% 0.0 0.0
Added Value 1.0 0.5 0.5 2.6 2.7 -0.1
Current Quarter (%) Year to Date (%)
0.0%
0.8%
0.2%
0.0%
-0.2%
0.0%
0.1%
0.0%
0.0%
0.0%
0.5%
1.2%
0.6%
-0.1%
0.3%
0.1%
-0.2%
0.1%
0.2%
0.0%
PERFORMANCE AND ATTRIBUTION December 31, 2012
3

3557
4
Review ■ Our quantitative model performed ahead of expectations for both the quarter and for the year. The trends in the market were captured well in the
performance of our factors. Value was the most successful and consistent theme while momentum faced some volatility due to the reversals in market sentiment. Notwithstanding, our momentum exposures had the greatest influence on the portfolio’s outperformance. Both security selection and sector positioning added a substantial amount of value for the quarter.
■ We are pleased to report that the portfolio outperformed the benchmark very consistently through the different market environments that transpired during the year. A key contributor to our performance was our enhanced ability to manage market risk (beta) exposure as trends shift. This was made possible by a number of enhancements made earlier in 2012 including the North American framework which improved the accuracy of our risk and return forecasts. Our short-term risk measures were also refined, allowing for a more robust and responsive risk model.
■ There were no significant changes made to the portfolio’s sector positioning. The portfolio’s sensitivity to market risk continues to be hedged by maintaining an overweight in banks and underweight in utilities. On the other hand, our return forecasts for consumer discretionary stocks improved because of better growth prospects and improving valuations resulting in purchases of apparel and media companies. In addition, we booked profits in a number of holdings across various industries as return forecasts began to moderate due to faltering momentum.
-6
-4
-2
0
2
4
6
8
10
Q1 2012 Q2 2012 Q3 2012 Q4 2012
CC
&L
Fac
tor
Per
form
ance
Momentum
Value
Quality
All factors perform above expectations. Value and momentum strongly outperform.
Source: Connor, Clark & Lunn Investment Management Ltd.
Canadian Factor Performance
0.0
0.5
1.0
1.5
2.0
2.5
3.0
3.5
2006 2007 2008 2009 2010 2011 2012 2013D
ispe
rsio
n (%
)
Momentum
Value
Quality
Opportunity indicates normalization of the environment; opportunity for quality continues to improve.
Source: Connor, Clark & Lunn Investment Management Ltd.
Canadian Opportunity
Research & Strategy ■ Over the last several years, investors have been concerned with a significant number of macro-related risks, but the risk of an extreme market-wide
event has largely subsided. This has resulted in a renewed focus on company fundamentals on the part of investors. Our dispersion signals, or the level of opportunity for each of our return factors, continued to remain around average levels, indicating the return to a more normalized investment landscape. Similarly, average stock correlations, which indicate the extent to which stocks trade in line with each other, have dropped back to levels confirming that stock returns are being determined more by characteristics specific to each company.
■ The strong performance of our value factor also reflects the more stable economic environment in which cheaper stocks should be better rewarded than expensive stocks. Last quarter, we outlined that market risk had become increasingly correlated with value and that cyclical stocks had been the largest beneficiaries of investors’ search for value. However, this quarter we observed that attractively valued stocks were rewarded more broadly across most sectors.
■ We are nearing completion on a number of research projects that we expect will be integrated into the model during the next few months. For example, an enhancement will be made to our risk model that will result in more accurate risk forecasts for small capitalization stocks. We will also enhance our stock efficiency measures to improve the accuracy of our forecasts for volatile stocks and will also be making an enhancement to our measure of sector valuation.
CANADIAN EQUITIES December 31, 2012
4

3557
5
Sector Breakdown (%) Portfolio Benchmark*
Energy 20.6 25.3 -4.7 -0.8
Materials 17.1 18.6 -1.5 -6.7
Industrials 8.7 6.1 2.6 7.1
Consumer Discretionary 4.9 4.5 0.4 5.6
Consumer Staples 1.2 2.7 -1.5 9.2
Health Care 3.2 1.9 1.3 3.5
Financials 35.4 32.5 2.9 6.3
Information Technology 2.7 1.3 1.4 7.3
Telecommunication Serv ices 4.7 5.1 -0.4 4.3
Utilities 0.9 1.9 -1.0 1.3
Cash 0.6 0.0 0.6
Industry Portfolio Benchmark* Underweight Industry Portfolio Benchmark* Overweight
Utilities 3.6 8.3 -4.7 Banks 24.7 21.5 3.2
Metals 2.2 3.8 -1.6 Transportation 5.0 3.8 1.14651773
Energy Producers 9.7 10.9 -1.2 Industrials 2.6 1.5 1.067586445
Retail Staples 1.2 2.2 -1.0 Pharmaceuticals 2.0 1.1 0.878038999
Insurance 4.4 5.4 -1.0 Energy Equip & Serv ices 1.7 1.0 0.716351227
Golds 9.2 10.1 -0.9 Software 1.5 0.8 0.675951219
Telecom Serv ices 5.2 5.8 -0.7 Hardware 1.1 0.5 0.67527367
Food & Beverage 0.0 0.5 -0.5 Paper & Forest 0.8 0.2 0.589291488
Integrated Energy 5.9 6.4 -0.5 Chemicals 4.1 3.6 0.558472065
Hotel, Restaurant & Leisure 0.1 0.5 -0.4 Airlines 0.7 0.2 0.479648599
*Benchmark: S&P/TSX Composite Index
Under/OverBenchmark Sector Return
Current Quarter (%)
CC&L Proprietary Industry Breakdown (%)
Largest Underweights Largest Overweights
-4.7
-1.5
2.6
0.4
-1.5
1.3
2.9
1.4
-0.4
-1.0
0.6
-4.7
-1.6
-1.2
-1.0
-1.0
-0.9
-0.7
-0.5
-0.5
-0.4
3.2
1.1
1.1
0.9
0.7
0.7
0.7
0.6
0.6
0.5
CANADIAN EQUITIES STRUCTURE December 31, 2012
5
3557
6
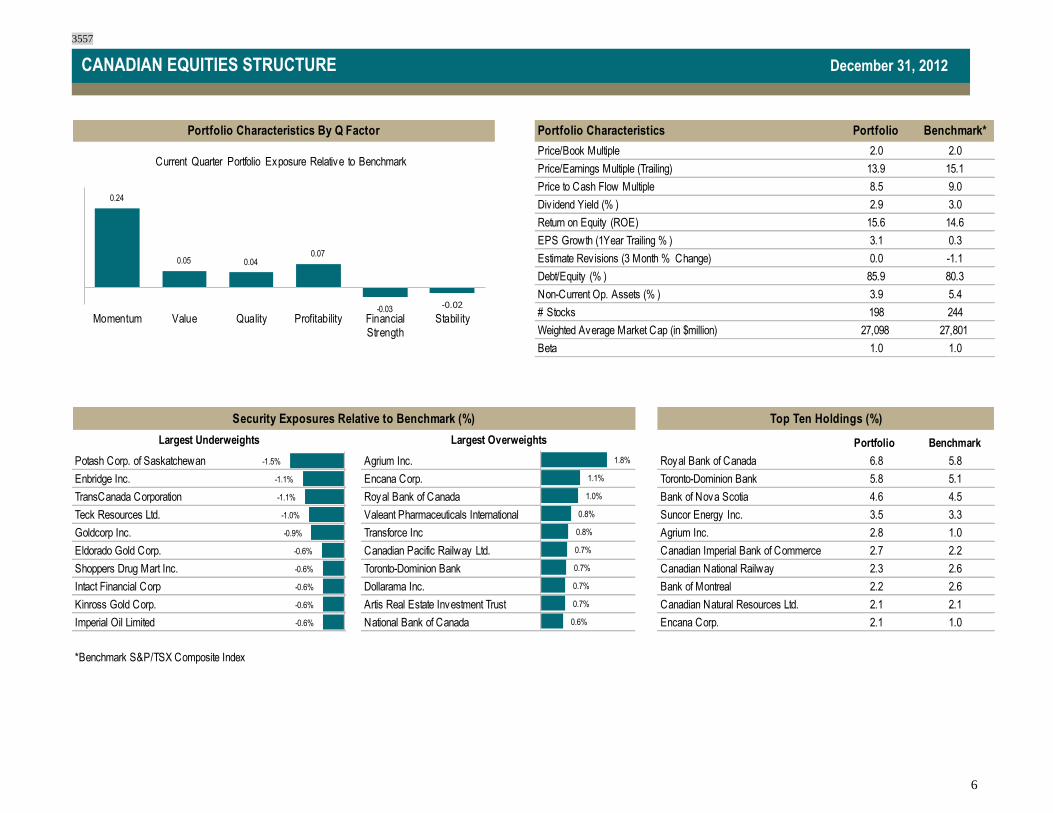
Portfolio Characteristics Portfolio Benchmark*
2.0 2.0
13.9 15.1
english NameTrimestre Courant 8.5 9.0
Momentum0.237125106 2.9 3.0
Value 0.049028463 15.6 14.6
Quality0.044550327 3.1 0.3
Profitability0.070316857 0.0 -1.1
Financial Strength-0.02860618 85.9 80.3
Stability-0.015941733 3.9 5.4
198 244
27,098 27,801
1.0 1.0
Portfolio Benchmark
-1.5% 1.8% Royal Bank of Canada 6.8 5.8
-1.1% 1.1% Toronto-Dominion Bank 5.8 5.1
-1.1% 1.0% Bank of Nova Scotia 4.6 4.5
-1.0% 0.8% Suncor Energy Inc. 3.5 3.3
-0.9% 0.8% Agrium Inc. 2.8 1.0
-0.6% 0.7% Canadian Imperial Bank of Commerce 2.7 2.2
-0.6% 0.7% Canadian National Railway 2.3 2.6
-0.6% 0.7% Bank of Montreal 2.2 2.6
-0.6% 0.7% Canadian Natural Resources Ltd. 2.1 2.1
-0.6% 0.6% Encana Corp. 2.1 1.0
*Benchmark S&P/TSX Composite Index
Return on Equity (ROE)
Portfolio Characteristics By Q Factor
Price/Book Multiple
Price/Earnings Multiple (Trailing)
Price to Cash Flow Multiple
Div idend Yield (% )
Potash Corp. of Saskatchewan Agrium Inc.
EPS Growth (1Year Trailing % )
Estimate Revisions (3 Month % Change)
Debt/Equity (% )
Non-Current Op. Assets (% )
# Stocks
Weighted Average Market Cap (in $million)
Beta
Security Exposures Relative to Benchmark (%) Top Ten Holdings (%)
Largest Underweights Largest Overweights
Enbridge Inc. Encana Corp.
TransCanada Corporation Royal Bank of Canada
Teck Resources Ltd. Valeant Pharmaceuticals International
Goldcorp Inc. Transforce Inc
Eldorado Gold Corp. Canadian Pacific Railway Ltd.
Shoppers Drug Mart Inc. Toronto-Dominion Bank
Intact Financial Corp Dollarama Inc.
Kinross Gold Corp. Artis Real Estate Investment Trust
Imperial Oil Limited National Bank of Canada
0.24
0.05 0.040.07
-0.03-0.02
Momentum Value Quality Profitability FinancialStrength
Stabil ity
Momentum Value Quality Profitability Financial Strength StabilityCurrent Quarter Portfolio Exposure Relative to Benchmark
-1.5%
-1.1%
-1.1%
-1.0%
-0.9%
-0.6%
-0.6%
-0.6%
-0.6%
-0.6%
1.8%
1.1%
1.0%
0.8%
0.8%
0.7%
0.7%
0.7%
0.7%
0.6%
CANADIAN EQUITIES STRUCTURE December 31, 2012
6

3557
7
All percentages set out below are based on market values except if noted otherwise.
Asset Mix Guidelines Actual Compliance
Cash 5 % max 0.6 % Yes
Canadian Equities
Equities of a single issuer compared to the S&P/TSX Composite Index +/- 5 % Yes
Number of holdings 50 min 199 Yes
Other
Registered investment under the ITA Yes
■ With respect to disclosure of a potential conflict of interest, G.H. MacDougall, a non-advising director of Connor, Clark & Lunn Investment Management Ltd., is a director of International Forest Products Limited.
■ UN Suppression of Terrorism, United Nations Act Sanctions, US Department of the Treasury Specially Designated Nationals: We confirm that all applicable reports have been filed with the appropriate regulator reporting possession or control of property owned or controlled by listed persons.
■ We are in compliance with all the terms and conditions of the investment mandate except if noted.
MANDATE REVIEW December 31, 2012
7

3557
8
CC&L Assets Under Management
December 31, 2012 September 30, 2012 Increase/Decrease $25.1 billion $23.9 billion +$1.2 billion
Key Investment Personnel
■ No changes to report.
Investment Process (changes/enhancements)
■ Fixed Income – none. ■ Fundamental Canadian Equities – none. ■ Quantitative Equities – Enhancements were made to our portfolio construction process to facilitate the management of integrated North American
quantitative equity portfolios. ■ Foreign Equities – none.
Organization/Ownership Structure
■ No changes to report.
Other Changes (new/discontinued products, SIPP changes, litigation, fees, etc.)
New Products ■ CC&L Equity Income & Growth Fund is a new pooled fund established exclusively for CC&L’s institutional clients. The fund invests in Canadian
income oriented instruments to generate a portfolio with an excess yield and lower volatility than the S&P/TSX Composite Index. While the fund is new, the strategy has been managed by CC&L’s Fundamental Equity Team for over a decade.
■ CC&L Short Term Bond Fund is a pooled fund investing in bonds with a term between 1 and 5 years. The objective is to generate a return that exceeds the DEX Short Bond Index. CC&L’s fixed income team has managed short-term bond mandates for clients for over a decade.
QUARTERLY CORPORATE UPDATE December 31, 2012
8

3557
9
Quarter ($) YTD ($) Total (%) Quarter ($) YTD ($) Total (%)
Alta Corp Capital 1,390 1,390 0 Bloomberg 2,662 8,702 1
BMO Capital Markets 9,709 50,248 4 Citigroup 5,087 5,087 0
Brockhouse Cooper 0 6,379 0 Empirical Research 3,610 3,610 0
Canaccord Capital 4,152 15,757 1 IBES 8,820 33,955 2
CIBC World Markets 13,909 43,507 3 MSCI 7,273 45,077 3
Cormark Securities 38,412 171,885 13 NYSE 714 714 0
Desjardins Securities 2,420 8,820 1 RosenBlatt Securities 7,269 7,269 1
Dundee Securities 767 1,814 0 Russell Index 2,092 3,219 0
First Boston 172 7,619 1 S&P CIQ/Compustat 6,536 40,568 3
First Boston Canada 491 20,537 1 Standard & Poors 1,293 1,293 0
First Energy 3,214 8,964 1 Starmine 8,337 19,669 1
GMP Capital 3,641 10,085 1 Thomson ONE 482 8,650 1
Goldman Sachs Canada 0 585 0 TSX 2,946 3,705 0
ITG Canada Corp. 13,067 94,791 7 Wall Street Horizon 5,614 5,950 0
Jones Trading 104 579 0
Liquidnet 540 7,527 1 Total 62,735 187,468 14
Macquarie 918 8,078 1
Merrill Lynch Canada 4,469 51,634 4
Morgan Stanley Canada 0 17,115 1
National Bank Financial 12,474 50,782 4
Pacific International 0 1,480 0
Paradigm Capital 1,227 7,055 1
Peters & Co. 592 3,968 0
Raymond James 2,805 53,072 4
RBC Capital Markets 72,639 367,159 27
Scotia Capital 41,537 145,697 11
State Street 2,004 4,981 0
TD Newcrest 45,436 197,098 14
UBS Securities 1,842 15,857 1
Total 277,931 1,374,465 100
The commissions report is in accordance with CFA Institute Soft Dollar Standards. For pooled funds, the amounts shown are total commissions paid by
the fund. Detailed descriptions of research services obtained through soft dollar arrangements are available on request.
Commissions for the CC&L Canadian Q Core Fund Soft Dollars Generated
CANADIAN EQUITY COMMISSIONS December 31, 2012
9

3557
10
The following reporting information can be accessed on our corporate website:
■ Daily and monthly portfolio valuations
■ Quarterly reports
■ North American equity proxy reports (Q4 2012 proxy reports will be posted on January 14, 2013)
■ CC&L EAFE Fund equity proxy reports and commission statements
To access these reports, go to www.cclinvest.com and select Client Services – Institutional Investors – Client Reports on the left hand menu bar.
Access to this information requires a username and password. Please contact us if you did not receive or have misplaced your login information or if
you are having any difficulties on our website.
WEB-BASED REPORTS December 31, 2012
10

3557
11
11

Connor, Clark & Lunn Investment Management Ltd.
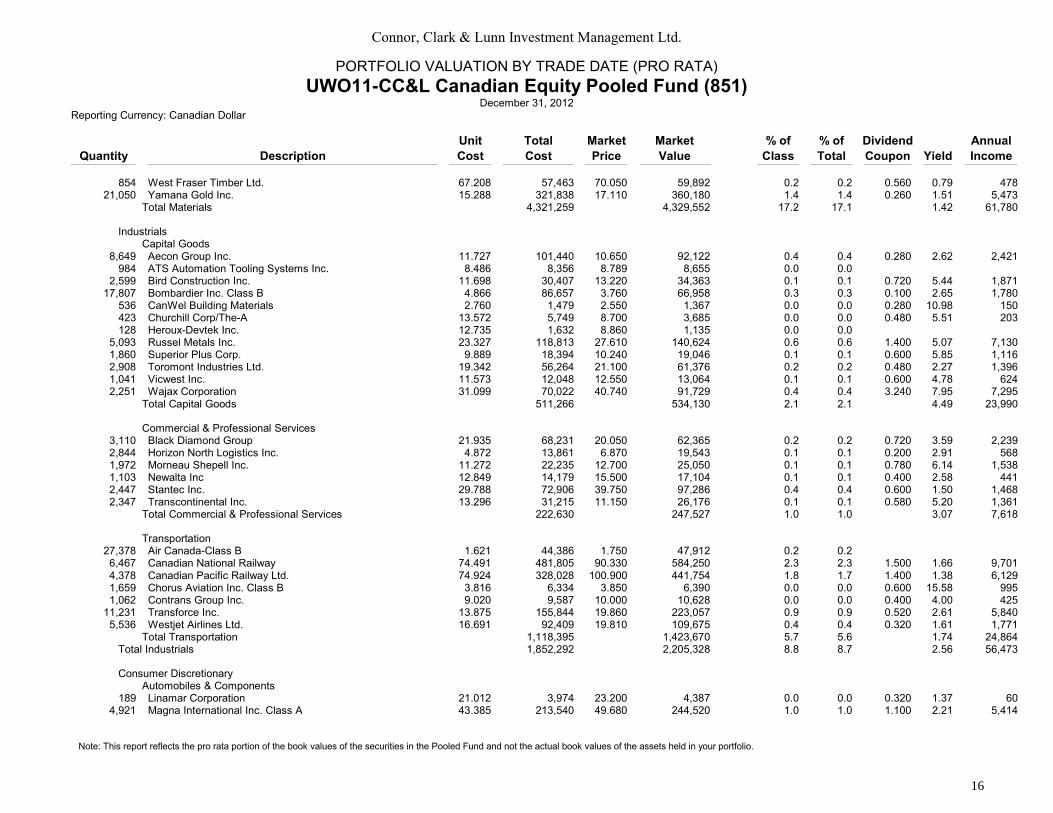
PORTFOLIO VALUATION BY TRADE DATE
UWO11-CC&L Canadian Equity Pooled Fund (851)December 31, 2012
Reporting Currency: Canadian Dollar
Unit Total Market Market % of % of Dividend Annual
Quantity Description Cost Cost Price Value Class Total Coupon Yield Income
Canadian Equity2,714,655.296 CC&L Canadian Q Core Fund 9.537 25,888,657 9.334 25,339,135 100.0 100.0 0.234 2.50 634,211
TOTAL PORTFOLIO 25,888,657 25,339,135 100.0 2.50 634,211
12

Connor, Clark & Lunn Investment Management Ltd.
PORTFOLIO SUMMARY BY TRADE DATE (PRO RATA)
UWO11-CC&L Canadian Equity Pooled Fund (851)December 31, 2012
Reporting Currency: Canadian Dollar
Description Total Cost Market Value % of Class % of Total Yield Annual Income
Canadian EquityCommon Stock
Energy 5,435,897 5,216,671 20.7 20.6 2.94 153,703Materials 4,321,259 4,329,552 17.2 17.1 1.42 61,780Industrials 1,852,292 2,205,328 8.8 8.7 2.56 56,473Consumer Discretionary 1,100,662 1,253,680 5.0 4.9 2.48 31,097Consumer Staples 203,628 308,534 1.2 1.2 1.09 3,367Health Care 636,271 804,131 3.2 3.2 0.43 3,477Financials 8,310,894 8,971,643 35.6 35.4 4.13 371,151Information Technology 609,233 671,681 2.7 2.7 1.21 8,147Telecommunication Services 1,000,540 1,189,128 4.7 4.7 4.50 53,603Utilities 187,488 226,056 0.9 0.9 5.05 11,419
Total Common Stock 23,658,169 25,176,408 100.0 99.4 2.99 754,221
Cash & Equiv.Short Term Paper 188,605 188,669 115.9 0.7 1.07Cash -25,943 -25,943 -15.9 -0.1 3.69
Total Cash & Equiv. 162,661 162,726 100.0 0.6 0.65
TOTAL PORTFOLIO 23,820,831 25,339,135 100.0 2.98 754,221
Note: This report reflects the pro rata portion of the book values of the securities in the Pooled Fund and not the actual book values of the assets held in your portfolio.
13

Connor, Clark & Lunn Investment Management Ltd.
PORTFOLIO VALUATION BY TRADE DATE (PRO RATA)
UWO11-CC&L Canadian Equity Pooled Fund (851)December 31, 2012
Reporting Currency: Canadian Dollar
Unit Total Market Market % of % of Dividend Annual
Quantity Description Cost Cost Price Value Class Total Coupon Yield Income
Canadian EquityCommon Stock
EnergyEnergy
195 Altagas Income ltd. 33.789 6,601 33.570 6,559 0.0 0.0 1.440 4.28 281426 ARC Resources Ltd 24.256 10,350 24.440 10,428 0.0 0.0 1.200 4.90 512
4,646 Avenex Energy Corp 6.121 28,440 2.650 12,312 0.0 0.0 0.420 15.84 1,9512,069 Baytex Energy Corp 45.452 94,063 42.870 88,719 0.4 0.4 2.640 6.15 5,463
531 Bonterra Energy Corp. 54.563 28,997 45.640 24,254 0.1 0.1 3.120 6.83 1,6587,247 Cameco Corp. 23.215 168,264 19.590 141,988 0.6 0.6 0.400 2.04 2,899
18,499 Canadian Natural Resources Ltd. 36.092 667,675 28.640 529,817 2.1 2.1 0.420 1.46 7,7698,893 Canadian Oil Sands Ltd. 23.033 204,853 20.170 179,388 0.7 0.7 1.400 6.94 12,4513,690 Canelson Drilling Inc 4.666 17,221 4.880 18,009 0.1 0.1 0.200 4.09 738
10,005 Cenovus Energy Inc. 32.911 329,289 33.290 333,072 1.3 1.3 0.880 2.64 8,8043,126 Crescent Point Energy Corp. 42.850 133,957 37.620 117,604 0.5 0.5 2.759 7.33 8,6289,250 Crocotta Energy Inc 3.289 30,430 3.000 27,750 0.1 0.13,548 Deethree Exploration Ltd. 6.239 22,143 6.510 23,103 0.1 0.14,048 Delphi Energy Corp 2.208 8,941 1.140 4,615 0.0 0.06,832 Enbridge Inc. 35.388 241,793 43.020 293,932 1.2 1.2 1.260 2.92 8,608
486 Enbridge Income Fund Holdings Inc. 18.844 9,160 24.130 11,729 0.0 0.0 1.335 5.53 64826,681 EnCana Corp. 21.473 572,943 19.660 524,557 2.1 2.1 0.800 4.06 21,345
298 Enerflex Ltd. 13.701 4,090 11.980 3,576 0.0 0.0 0.280 2.33 83456 Freehold Royalties Ltd 21.534 9,828 22.400 10,223 0.0 0.0 1.680 7.50 766387 Gibson Energy 23.288 9,027 24.050 9,322 0.0 0.0 1.040 4.32 403
4,131 Husky Energy Inc. 25.742 106,345 29.400 121,456 0.5 0.5 1.200 4.08 4,957901 Imperial Oil Limited 42.026 37,903 42.729 38,537 0.2 0.2 0.480 1.12 432
3,551 Inter Pipeline Fund 19.486 69,203 23.500 83,455 0.3 0.3 1.110 4.72 3,9413,356 Long Run Exploration LTD. 7.184 24,113 4.900 16,445 0.1 0.18,034 Mullen Group Ltd. 20.619 165,659 20.900 167,913 0.7 0.7 1.000 4.78 8,0348,707 Nexen Inc. 20.107 175,077 26.570 231,346 0.9 0.9 0.200 0.75 1,7411,780 Pace Oil & Gas Ltd. 5.941 10,577 3.290 5,857 0.0 0.09,966 Pacific Rubiales Energy Corp 25.677 255,904 23.110 230,316 0.9 0.9 0.440 1.90 4,3856,177 Parkland Fuel Corp 14.713 90,888 18.930 116,934 0.5 0.5 1.020 5.38 6,300
9 Pason Systems Inc. 16.894 158 17.150 160 0.0 0.0 0.480 2.79 4154 Pembina Pipeline Corp. 28.078 4,345 28.460 4,403 0.0 0.0 1.620 5.69 250
2,088 Petrobakken Energy Ltd. 13.368 27,916 10.250 21,404 0.1 0.1 0.960 9.36 2,0046,167 Petrobank Energy 12.198 75,239 12.400 76,479 0.3 0.33,671 Shawcor Ltd. 35.727 131,179 38.990 143,157 0.6 0.6 0.400 1.02 1,468
493 Spartan Oil Corp. 4.907 2,423 5.240 2,588 0.0 0.027,386 Suncor Energy Inc. 34.662 949,297 32.710 895,827 3.6 3.5 0.520 1.58 14,24113,572 Talisman Energy Inc. 14.184 192,524 11.250 152,693 0.6 0.6 0.270 2.40 3,664
1,442 Total Energy Services Inc. 13.516 19,500 14.990 21,626 0.1 0.1 0.200 1.33 2886,153 TransCanada Pipelines Corp. 44.740 275,306 47.020 289,330 1.1 1.1 1.760 3.74 10,829
495 Transglobe Energy Corp 11.209 5,553 9.330 4,622 0.0 0.0
Note: This report reflects the pro rata portion of the book values of the securities in the Pooled Fund and not the actual book values of the assets held in your portfolio.
14

Connor, Clark & Lunn Investment Management Ltd.
PORTFOLIO VALUATION BY TRADE DATE (PRO RATA)
UWO11-CC&L Canadian Equity Pooled Fund (851)December 31, 2012
Reporting Currency: Canadian Dollar
Unit Total Market Market % of % of Dividend Annual
Quantity Description Cost Cost Price Value Class Total Coupon Yield Income
60 Trilogy Energy Corp. 33.469 2,040 29.110 1,774 0.0 0.0 0.420 1.44 258,984 Trinidad Drilling 8.144 73,177 6.880 61,813 0.2 0.2 0.200 2.90 1,7962,633 Vermilion Energy Inc. 46.856 123,409 51.970 136,876 0.5 0.5 2.400 4.61 6,3212,390 Whitecap Resources Inc. 8.397 20,075 8.650 20,680 0.1 0.1
Total Energy 5,435,897 5,216,671 20.7 20.6 2.94 153,703
MaterialsMaterials
4,661 Agnico-Eagle Mines 53.008 247,075 52.130 242,980 1.0 1.0 0.880 1.68 4,1017,238 Agrium Inc. 88.394 639,847 99.140 717,629 2.9 2.8 2.000 2.01 14,4779,142 Alacer Gold Corp. 9.021 82,481 5.200 47,540 0.2 0.23,413 Alamos Gold 18.904 64,535 17.450 59,569 0.2 0.2 0.200 1.14 6824,898 Argonaut Gold Inc. 7.973 39,057 9.470 46,390 0.2 0.2
24,064 B2Gold Corp. 3.330 80,157 3.560 85,671 0.3 0.313,967 Barrick Gold Corp. 43.546 608,233 34.820 486,346 1.9 1.9 0.800 2.29 11,173
6,583 Brigus Gold Corp 0.964 6,353 0.930 6,122 0.0 0.01,284 Canexus Corp 8.059 10,355 8.480 10,895 0.0 0.0 0.547 6.45 703
137 Canfor Corp. 15.213 2,092 16.579 2,280 0.0 0.0775 Cascades Inc. 4.385 3,399 4.100 3,178 0.0 0.0 0.160 3.90 124
3,157 Dundee Precious Metals 9.101 28,735 8.470 26,743 0.1 0.13,108 First Majestic Silver Crop 22.332 69,431 20.060 62,365 0.2 0.24,504 First Quantum Minerals Ltd 21.890 98,611 21.910 98,699 0.4 0.4 0.120 0.55 5433,082 Franco-Nevada Corp. 47.005 144,886 56.780 175,016 0.7 0.7 0.720 1.26 2,2197,540 Goldcorp Inc. 45.317 341,715 36.570 275,757 1.1 1.1 0.600 1.64 4,5247,071 Harry Winston Diamond Corp. 13.290 93,982 13.980 98,856 0.4 0.4
459 Imperial Metals Corp 16.507 7,585 12.100 5,560 0.0 0.015,047 Intertape Polymer Group Inc. 7.329 110,289 8.000 120,380 0.5 0.5 0.160 2.00 2,407
4,159 Kinross Gold Corp. 9.149 38,054 9.660 40,178 0.2 0.2 0.160 1.65 66510,161 Lundin Mining 4.934 50,141 5.120 52,026 0.2 0.2
3,357 Methanex Corp. 29.125 97,788 31.680 106,364 0.4 0.4 0.740 2.33 2,48410,950 Nevsun Resources Ltd. 4.560 49,936 4.250 46,541 0.2 0.2 0.100 2.35 1,09513,744 New Gold Inc. 9.568 131,520 11.010 151,330 0.6 0.6
5,378 Noranda Income Fund 5.525 29,717 4.740 25,494 0.1 0.1 0.500 10.54 2,6894,481 Norbord Inc. 17.769 79,631 30.190 135,293 0.5 0.58,831 OceanaGold Corp 3.160 27,915 2.850 25,169 0.1 0.15,298 Potash Corp. of Saskatchewan 43.096 228,327 40.479 214,463 0.9 0.8 0.840 2.07 4,4507,233 Pretium Resources Inc 14.542 105,198 13.110 94,835 0.4 0.4
17,482 Primero Mining Corp. 4.761 83,249 6.400 111,887 0.4 0.41,664 Rio Alto Mining Ltd. 5.289 8,805 5.090 8,473 0.0 0.04,154 Sherritt Intl. 5.927 24,628 5.750 23,889 0.1 0.1 0.152 2.64 6315,367 Silver Wheaton Corp 37.753 202,646 35.860 192,480 0.8 0.8 0.280 0.78 1,502
132 Stella-Jones Inc. 62.821 8,346 76.630 10,181 0.0 0.0 0.640 0.83 851,408 Teck Resources Ltd. 39.111 55,076 36.150 50,905 0.2 0.2 0.900 2.48 1,267
16,046 TIMMINS GOLD CORP 2.626 42,142 2.990 47,978 0.2 0.2
Note: This report reflects the pro rata portion of the book values of the securities in the Pooled Fund and not the actual book values of the assets held in your portfolio.
15
Connor, Clark & Lunn Investment Management Ltd.
PORTFOLIO VALUATION BY TRADE DATE (PRO RATA)
UWO11-CC&L Canadian Equity Pooled Fund (851)December 31, 2012
Reporting Currency: Canadian Dollar
Unit Total Market Market % of % of Dividend Annual
Quantity Description Cost Cost Price Value Class Total Coupon Yield Income
854 West Fraser Timber Ltd. 67.208 57,463 70.050 59,892 0.2 0.2 0.560 0.79 47821,050 Yamana Gold Inc. 15.288 321,838 17.110 360,180 1.4 1.4 0.260 1.51 5,473
Total Materials 4,321,259 4,329,552 17.2 17.1 1.42 61,780
IndustrialsCapital Goods
8,649 Aecon Group Inc. 11.727 101,440 10.650 92,122 0.4 0.4 0.280 2.62 2,421984 ATS Automation Tooling Systems Inc. 8.486 8,356 8.789 8,655 0.0 0.0
2,599 Bird Construction Inc. 11.698 30,407 13.220 34,363 0.1 0.1 0.720 5.44 1,87117,807 Bombardier Inc. Class B 4.866 86,657 3.760 66,958 0.3 0.3 0.100 2.65 1,780
536 CanWel Building Materials 2.760 1,479 2.550 1,367 0.0 0.0 0.280 10.98 150423 Churchill Corp/The-A 13.572 5,749 8.700 3,685 0.0 0.0 0.480 5.51 203128 Heroux-Devtek Inc. 12.735 1,632 8.860 1,135 0.0 0.0
5,093 Russel Metals Inc. 23.327 118,813 27.610 140,624 0.6 0.6 1.400 5.07 7,1301,860 Superior Plus Corp. 9.889 18,394 10.240 19,046 0.1 0.1 0.600 5.85 1,1162,908 Toromont Industries Ltd. 19.342 56,264 21.100 61,376 0.2 0.2 0.480 2.27 1,3961,041 Vicwest Inc. 11.573 12,048 12.550 13,064 0.1 0.1 0.600 4.78 6242,251 Wajax Corporation 31.099 70,022 40.740 91,729 0.4 0.4 3.240 7.95 7,295
Total Capital Goods 511,266 534,130 2.1 2.1 4.49 23,990
Commercial & Professional Services3,110 Black Diamond Group 21.935 68,231 20.050 62,365 0.2 0.2 0.720 3.59 2,2392,844 Horizon North Logistics Inc. 4.872 13,861 6.870 19,543 0.1 0.1 0.200 2.91 5681,972 Morneau Shepell Inc. 11.272 22,235 12.700 25,050 0.1 0.1 0.780 6.14 1,5381,103 Newalta Inc 12.849 14,179 15.500 17,104 0.1 0.1 0.400 2.58 4412,447 Stantec Inc. 29.788 72,906 39.750 97,286 0.4 0.4 0.600 1.50 1,4682,347 Transcontinental Inc. 13.296 31,215 11.150 26,176 0.1 0.1 0.580 5.20 1,361
Total Commercial & Professional Services 222,630 247,527 1.0 1.0 3.07 7,618
Transportation27,378 Air Canada-Class B 1.621 44,386 1.750 47,912 0.2 0.2
6,467 Canadian National Railway 74.491 481,805 90.330 584,250 2.3 2.3 1.500 1.66 9,7014,378 Canadian Pacific Railway Ltd. 74.924 328,028 100.900 441,754 1.8 1.7 1.400 1.38 6,1291,659 Chorus Aviation Inc. Class B 3.816 6,334 3.850 6,390 0.0 0.0 0.600 15.58 9951,062 Contrans Group Inc. 9.020 9,587 10.000 10,628 0.0 0.0 0.400 4.00 425
11,231 Transforce Inc. 13.875 155,844 19.860 223,057 0.9 0.9 0.520 2.61 5,8405,536 Westjet Airlines Ltd. 16.691 92,409 19.810 109,675 0.4 0.4 0.320 1.61 1,771
Total Transportation 1,118,395 1,423,670 5.7 5.6 1.74 24,864Total Industrials 1,852,292 2,205,328 8.8 8.7 2.56 56,473
Consumer DiscretionaryAutomobiles & Components
189 Linamar Corporation 21.012 3,974 23.200 4,387 0.0 0.0 0.320 1.37 604,921 Magna International Inc. Class A 43.385 213,540 49.680 244,520 1.0 1.0 1.100 2.21 5,414
Note: This report reflects the pro rata portion of the book values of the securities in the Pooled Fund and not the actual book values of the assets held in your portfolio.
16

Connor, Clark & Lunn Investment Management Ltd.
PORTFOLIO VALUATION BY TRADE DATE (PRO RATA)
UWO11-CC&L Canadian Equity Pooled Fund (851)December 31, 2012
Reporting Currency: Canadian Dollar
Unit Total Market Market % of % of Dividend Annual
Quantity Description Cost Cost Price Value Class Total Coupon Yield Income
2,275 Martinrea International Inc. 8.096 18,425 7.750 17,637 0.1 0.1Total Automobiles & Components 235,940 266,546 1.1 1.1 2.05 5,474
Consumer Durables & Apparel1,194 Dorel Industries Inc. Class B 34.461 41,153 35.950 42,930 0.2 0.2 1.200 3.33 1,4332,487 Gildan Activewear Class A 35.369 87,988 36.330 90,378 0.4 0.4 0.360 0.99 895
Total Consumer Durables & Apparel 129,141 133,309 0.5 0.5 1.74 2,328
Consumer Services92 Boston Pizza Royalties-Units 17.611 1,624 19.300 1,779 0.0 0.0 1.176 6.09 108
2,189 Enercare 7.496 16,415 8.180 17,912 0.1 0.1 0.672 8.21 1,471131 Great Canadian Gaming Corp. 8.282 1,087 9.550 1,253 0.0 0.0
1,159 Transat AT Inc. - Class B 5.300 6,143 5.930 6,873 0.0 0.01,364 Whistler Blackcomb Holdings Inc 11.030 15,051 12.300 16,784 0.1 0.1 0.975 7.92 1,330
Total Consumer Services 40,321 44,604 0.2 0.2 6.52 2,910
Media12,596 Aimia Inc. 14.109 177,731 14.870 187,313 0.7 0.7 0.640 4.30 8,061
514 Astral Media Inc. Class A 39.663 20,396 46.229 23,773 0.1 0.1 1.000 2.16 5141,624 Cineplex Inc. 29.489 47,891 31.830 51,692 0.2 0.2 1.350 4.24 2,1921,928 Corus Entertainment Inc. 22.540 43,476 24.579 47,410 0.2 0.2 0.960 3.90 1,8513,004 Quebecor Inc. Class B 36.076 108,381 38.670 116,172 0.5 0.5 0.200 0.51 6003,388 Thomson Reuters Corporation 28.009 94,916 28.780 97,527 0.4 0.4 1.280 4.44 4,337
480 Torstar Corp. Class B 8.412 4,043 7.810 3,753 0.0 0.0 0.525 6.72 252Total Media 496,837 527,644 2.1 2.1 3.37 17,810
Retailing518 Canadian Tire Corp. Ltd. Class A 68.260 35,422 69.380 36,003 0.1 0.1 1.400 2.01 726
4,123 Dollarama Inc. 38.914 160,456 58.970 243,154 1.0 1.0 0.440 0.74 1,814226 Rona Inc. 11.213 2,541 10.670 2,418 0.0 0.0 0.140 1.31 31
Total Retailing 198,421 281,576 1.1 1.1 0.91 2,572Total Consumer Discretionary 1,100,662 1,253,680 5.0 4.9 2.48 31,097
Consumer StaplesFood & Staples Retailing
4,085 Alimentation Couche-Tard Class B 28.236 115,371 48.930 199,920 0.8 0.8 0.300 0.61 1,2254,892 Jean Coutu Group 12.286 60,112 14.530 71,086 0.3 0.3 0.280 1.92 1,369
481 Metro Inc. 45.653 21,978 63.330 30,488 0.1 0.1 0.860 1.35 414Total Food & Staples Retailing 197,462 301,495 1.2 1.2 0.99 3,009
Food Beverage & Tobacco272 Cott Corp. 8.023 2,185 8.000 2,179 0.0 0.0 0.240 3.00 65811 Rogers Sugar Inc. 4.905 3,979 5.990 4,859 0.0 0.0 0.360 6.01 292
Total Food Beverage & Tobacco 6,165 7,038 0.0 0.0 5.07 357Total Consumer Staples 203,628 308,534 1.2 1.2 1.09 3,367
Note: This report reflects the pro rata portion of the book values of the securities in the Pooled Fund and not the actual book values of the assets held in your portfolio.
17

Connor, Clark & Lunn Investment Management Ltd.
PORTFOLIO VALUATION BY TRADE DATE (PRO RATA)
UWO11-CC&L Canadian Equity Pooled Fund (851)December 31, 2012
Reporting Currency: Canadian Dollar
Unit Total Market Market % of % of Dividend Annual
Quantity Description Cost Cost Price Value Class Total Coupon Yield Income
Health CareHealth Care Equipment & Services
5,437 Catamaran Corporation 44.913 244,234 46.780 254,384 1.0 1.03,893 Extendicare Inc. 7.557 29,424 7.650 29,785 0.1 0.1 0.840 10.98 3,270
Total Health Care Equipment & Services 273,658 284,170 1.1 1.1 1.15 3,270
Pharmaceuticals Biotechnology & Life Sciences517 Nordion Inc. 6.448 3,336 6.480 3,352 0.0 0.0 0.400 6.17 206234 Paladin Labs Inc 35.459 8,313 41.720 9,781 0.0 0.0
1,019 QLT Inc. 6.443 6,570 7.800 7,953 0.0 0.08,407 Valeant Pharmaceuticals International 40.964 344,392 59.340 498,873 2.0 2.0
Total Pharmaceuticals Biotechnology & Life Sciences 362,613 519,960 2.1 2.1 0.03 206Total Health Care 636,271 804,131 3.2 3.2 0.43 3,477
FinancialsBanks
9,074 Bank of Montreal 58.461 530,526 60.860 552,296 2.2 2.2 2.880 4.73 26,13520,233 Bank of Nova Scotia 53.570 1,083,927 57.460 1,162,617 4.6 4.6 2.279 3.96 46,132
8,417 Canadian Imperial Bank of Commerce 74.437 626,585 79.970 673,157 2.7 2.7 3.760 4.70 31,650151 Equitable Group Inc. 27.088 4,107 32.650 4,950 0.0 0.0 0.560 1.71 84
7,299 Genworth MI Canada Inc. 22.142 161,632 22.590 164,895 0.7 0.7 1.280 5.66 9,3431,017 Home Capital Group Inc 41.915 42,659 59.070 60,118 0.2 0.2 1.040 1.76 1,0581,555 Laurentian Bank of Canada 44.800 69,675 44.240 68,804 0.3 0.3 1.960 4.43 3,0484,801 National Bank of Canada 73.293 351,934 77.240 370,885 1.5 1.5 3.320 4.29 15,941
28,867 Royal Bank of Canada 54.541 1,574,465 59.880 1,728,585 6.9 6.8 2.400 4.00 69,28117,690 Toronto-Dominion Bank 76.369 1,351,035 83.750 1,481,593 5.9 5.8 3.080 3.67 54,487
Total Banks 5,796,550 6,267,904 24.9 24.7 4.10 257,164
Diversified Financials1,344 AGF Management Ltd. Cl B Non Voting 16.663 22,399 9.920 13,334 0.1 0.1 1.080 10.88 1,451
193 Davis & Henderson Income Corp 21.212 4,111 21.560 4,178 0.0 0.0 1.280 5.93 2484,689 Dundee Corp. 20.907 98,039 30.650 143,723 0.6 0.6 0.066 0.21 312
609 GMP Capital Inc. 5.048 3,077 5.850 3,566 0.0 0.0 0.200 3.41 121207 Onex Corp. 41.038 8,531 41.870 8,704 0.0 0.0 0.110 0.26 22
43 Sprott Resource Lending Corp. 1.469 64 1.540 67 0.0 0.0 0.060 3.89 2148 TMX Group Ltd. 50.325 7,472 50.720 7,531 0.0 0.0 1.600 3.15 237
Total Diversified Financials 143,697 181,106 0.7 0.7 1.32 2,397
Insurance5,585 Great West Lifeco 21.790 121,719 24.350 136,019 0.5 0.5 1.230 5.05 6,870
27,616 Manulife Financial Corp. 13.582 375,090 13.510 373,095 1.5 1.5 0.520 3.84 14,3608,362 Power Corp. of Canada 25.094 209,845 25.380 212,233 0.8 0.8 1.160 4.57 9,7004,081 Power Financial Corp. 27.526 112,363 27.240 111,192 0.4 0.4 1.400 5.13 5,714
Note: This report reflects the pro rata portion of the book values of the securities in the Pooled Fund and not the actual book values of the assets held in your portfolio.
18

Connor, Clark & Lunn Investment Management Ltd.
PORTFOLIO VALUATION BY TRADE DATE (PRO RATA)
UWO11-CC&L Canadian Equity Pooled Fund (851)December 31, 2012
Reporting Currency: Canadian Dollar
Unit Total Market Market % of % of Dividend Annual
Quantity Description Cost Cost Price Value Class Total Coupon Yield Income
10,507 Sun Life Financial Inc. 23.483 246,750 26.370 277,083 1.1 1.1 1.440 5.46 15,130Total Insurance 1,065,769 1,109,622 4.4 4.4 4.66 51,776
Real Estate554 Allied Ptys R/Est Inv T/U 29.633 16,443 33.000 18,311 0.1 0.1 1.359 4.11 754
1,757 Altus Group Inc. 7.846 13,791 8.260 14,518 0.1 0.1 0.600 7.26 1,05413,018 Artis Real Estate Investment Trust 14.770 192,296 15.640 203,613 0.8 0.8 1.080 6.90 14,060
29 Boardwalk Real Estate Investment Trust 64.078 1,903 64.530 1,916 0.0 0.0 1.920 2.97 5712,129 Brookfield Asset Management Inc. 32.497 394,173 36.440 441,994 1.8 1.7 0.560 1.53 6,792
98 Brookfield Canada Office Properties Trust Units
25.531 2,514 29.270 2,882 0.0 0.0 1.170 3.99 115
5,734 Brookfield Office Properties Inc. 17.038 97,713 16.960 97,263 0.4 0.4 0.560 3.30 3,21128 Calloway Real Estate Invt Tr 28.655 806 28.950 814 0.0 0.0 1.548 5.34 43
3,002 Canadian Apt Pptys Reit 23.176 69,591 24.900 74,765 0.3 0.3 1.119 4.49 3,3621,114 Chartwell Seniors Housing REIT 8.985 10,013 10.869 12,114 0.0 0.0 0.540 4.96 6013,696 Dundee Real Estate Investment Trust 34.452 127,360 37.430 138,365 0.5 0.5 2.196 5.86 8,1171,405 Granite Real Estate Inc. 36.074 50,691 37.760 53,060 0.2 0.2 2.000 5.29 2,810
453 H&R REIT Units 23.738 10,760 24.100 10,924 0.0 0.0 1.350 5.60 61111,444 Inn Vest Real Estate Invt Tr 4.584 52,464 4.130 47,266 0.2 0.2 0.399 9.67 4,573
289 Killam Properties Inc. 12.760 3,689 12.490 3,611 0.0 0.0 0.579 4.64 167290 Morguard Corp. 82.975 24,123 114.600 33,317 0.1 0.1 0.600 0.52 174683 Morguard Real Estate Invt Tr 15.882 10,848 18.280 12,486 0.0 0.0 0.960 5.25 655
1,436 Northwest Healthcare Property REIT 12.795 18,380 12.480 17,926 0.1 0.1 0.800 6.41 1,1491,509 Primaris Retail REIT 25.733 38,855 26.900 40,616 0.2 0.2 1.270 4.72 1,9186,793 Riocan REIT Units 24.795 168,454 27.560 187,238 0.7 0.7 1.410 5.11 9,579
Total Real Estate 1,304,877 1,413,009 5.6 5.6 4.23 59,812Total Financials 8,310,894 8,971,643 35.6 35.4 4.13 371,151
Information TechnologySoftware & Services
3,985 Absolute Software Corp 6.217 24,782 5.100 20,327 0.1 0.16,381 CGI Group Class A 17.754 113,303 22.940 146,399 0.6 0.6
786 Constellation Software Inc. 94.674 74,435 119.990 94,338 0.4 0.4 4.000 3.33 3,1442,238 MacDonald Dettwiler & Assoc 46.950 105,089 55.960 125,255 0.5 0.5 1.300 2.32 2,909
Total Software & Services 317,610 386,321 1.5 1.5 1.56 6,054
Technology Hardware & Equipment472 Aastra Technologies 19.040 8,987 16.570 7,821 0.0 0.0 0.800 4.82 377
8,178 Celestica Inc. 8.235 67,355 8.070 66,002 0.3 0.31,397 Com Dev International Ltd. 2.348 3,281 3.180 4,443 0.0 0.0
1 EXFO Inc. 10.417 16 5.280 8 0.0 0.011,522 Research In Motion 9.709 111,876 11.800 135,970 0.5 0.5
1,972 Sierra Wireless Inc. 8.803 17,366 7.920 15,622 0.1 0.1
Note: This report reflects the pro rata portion of the book values of the securities in the Pooled Fund and not the actual book values of the assets held in your portfolio.
19

Connor, Clark & Lunn Investment Management Ltd.
PORTFOLIO VALUATION BY TRADE DATE (PRO RATA)
UWO11-CC&L Canadian Equity Pooled Fund (851)December 31, 2012
Reporting Currency: Canadian Dollar
Unit Total Market Market % of % of Dividend Annual
Quantity Description Cost Cost Price Value Class Total Coupon Yield Income
12,249 Wi-LAN Inc. 6.754 82,738 4.530 55,491 0.2 0.2 0.140 3.09 1,714Total Technology Hardware & Equipment 291,622 285,360 1.1 1.1 0.73 2,092
Total Information Technology 609,233 671,681 2.7 2.7 1.21 8,147
Telecommunication ServicesTelecommunication Services
9,760 BCE Inc. 35.403 345,556 42.630 416,091 1.7 1.6 2.270 5.32 22,1565,167 Manitoba Telecom Services Inc. 31.989 165,305 32.460 167,736 0.7 0.7 1.700 5.23 8,7845,866 Rogers Comm Inc. Class B 38.860 227,965 45.159 264,918 1.1 1.0 1.580 3.49 9,2684,737 Telus Corp. 51.278 242,948 65.100 308,435 1.2 1.2 2.560 3.93 12,128
493 Telus Corp. Non-voting 37.990 18,764 64.680 31,947 0.1 0.1 2.560 3.95 1,264Total Telecommunication Services 1,000,540 1,189,128 4.7 4.7 4.50 53,603
UtilitiesUtilities
1,186 Algonquin Power & Utilities Co 6.333 7,513 6.840 8,114 0.0 0.0 0.310 4.53 3671,886 Atco Ltd. Class I 46.956 88,578 80.720 152,268 0.6 0.6 1.310 1.62 2,4716,920 Just Energy Group Inc. 13.207 91,396 9.490 65,673 0.3 0.3 1.239 13.06 8,580
Total Utilities 187,488 226,056 0.9 0.9 5.05 11,419Total Common Stock 23,658,169 25,176,408 100.0 99.4 2.99 754,221
Cash & Equiv.Short Term Paper
2,344 Bank of Montreal BDN 01-17-13 99.721 2,338 99.950 2,343 1.4 0.0 1.051,563 Bank of Nova Scotia BDN 02-04-13 99.726 1,558 99.899 1,561 1.0 0.0 1.041,563 CIBC B/A 03-01-13 99.763 1,559 99.828 1,560 1.0 0.0 1.04
157,869 Bank of Nova Scotia BDN 03-25-13 99.720 157,427 99.753 157,479 96.8 0.6 1.0725,790 National Bank B/A 03-28-13 99.731 25,721 99.744 25,724 15.8 0.1 1.07
Total Short Term Paper 188,605 188,669 115.9 0.7 1.07
CashCanadian Cash Account 0.000 111,026 111,026 68.2 0.4 -1.00Due To Broker -257,881 -257,881 -158.4 -1.0 1.00Due From Broker 50,967 50,967 31.3 0.2 1.00Dividend Accrual 0.000 69,943 69,943 43.0 0.3
Total Cash -25,943 -25,943 -15.9 -0.1 3.69Total Cash & Equiv. 162,661 162,726 100.0 0.6 0.65
TOTAL PORTFOLIO 23,820,831 25,339,135 100.0 2.98 754,221
Note: This report reflects the pro rata portion of the book values of the securities in the Pooled Fund and not the actual book values of the assets held in your portfolio.
20
Connor, Clark & Lunn Investment Management Ltd.
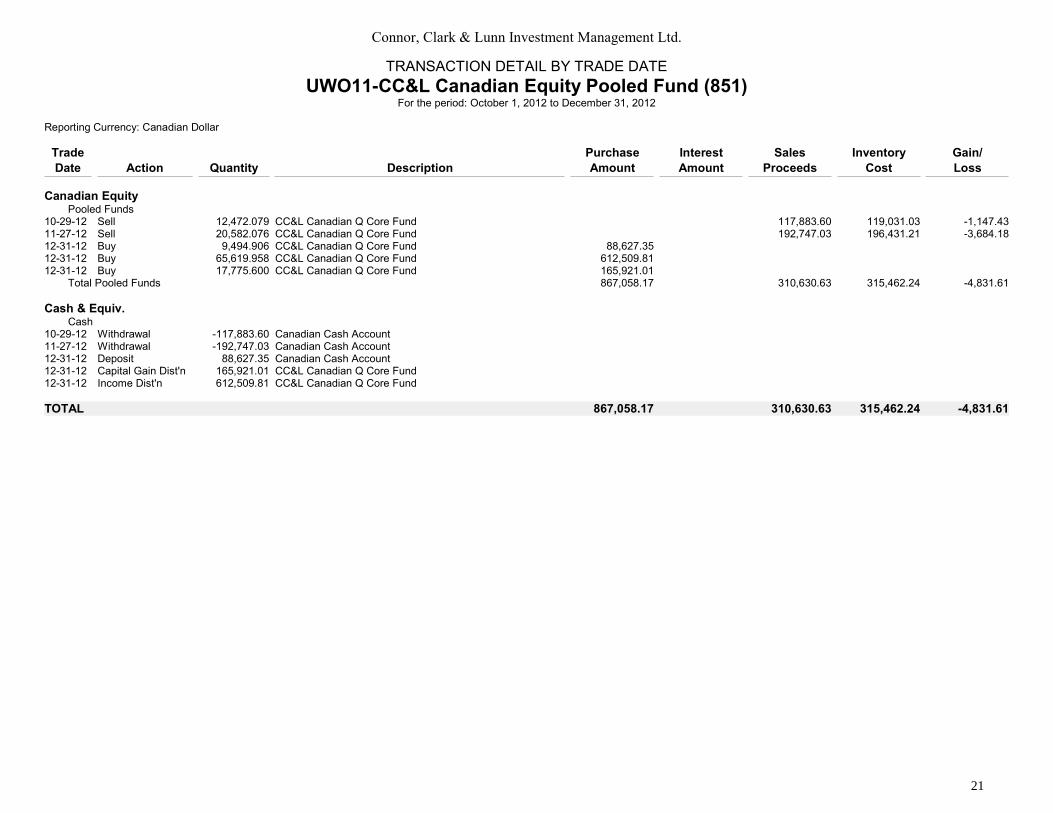
TRANSACTION DETAIL BY TRADE DATE
UWO11-CC&L Canadian Equity Pooled Fund (851)For the period: October 1, 2012 to December 31, 2012
Reporting Currency: Canadian Dollar
Trade Purchase Interest Sales Inventory Gain/
Date Action Quantity Description Amount Amount Proceeds Cost Loss
Canadian EquityPooled Funds
10-29-12 Sell 12,472.079 CC&L Canadian Q Core Fund 117,883.60 119,031.03 -1,147.4311-27-12 Sell 20,582.076 CC&L Canadian Q Core Fund 192,747.03 196,431.21 -3,684.1812-31-12 Buy 9,494.906 CC&L Canadian Q Core Fund 88,627.3512-31-12 Buy 65,619.958 CC&L Canadian Q Core Fund 612,509.8112-31-12 Buy 17,775.600 CC&L Canadian Q Core Fund 165,921.01
Total Pooled Funds 867,058.17 310,630.63 315,462.24 -4,831.61
Cash & Equiv.Cash
10-29-12 Withdrawal -117,883.60 Canadian Cash Account11-27-12 Withdrawal -192,747.03 Canadian Cash Account12-31-12 Deposit 88,627.35 Canadian Cash Account12-31-12 Capital Gain Dist'n 165,921.01 CC&L Canadian Q Core Fund12-31-12 Income Dist'n 612,509.81 CC&L Canadian Q Core Fund
TOTAL 867,058.17 310,630.63 315,462.24 -4,831.61
21

Connor, Clark & Lunn Investment Management Ltd.
PORTFOLIO VALUATION BY TRADE DATE
UWO10-CC&L Diversified Equity Pooled Fund (852)December 31, 2012
Reporting Currency: Canadian Dollar
Unit Total Market Market % of % of Dividend Annual
Quantity Description Cost Cost Price Value Class Total Coupon Yield Income
Canadian Equity4,968,652.757 CC&L Canadian Q Core Fund 9.386 46,635,016 9.334 46,378,399 100.0 100.0 0.234 2.50 1,160,802
TOTAL PORTFOLIO 46,635,016 46,378,399 100.0 2.50 1,160,802
22
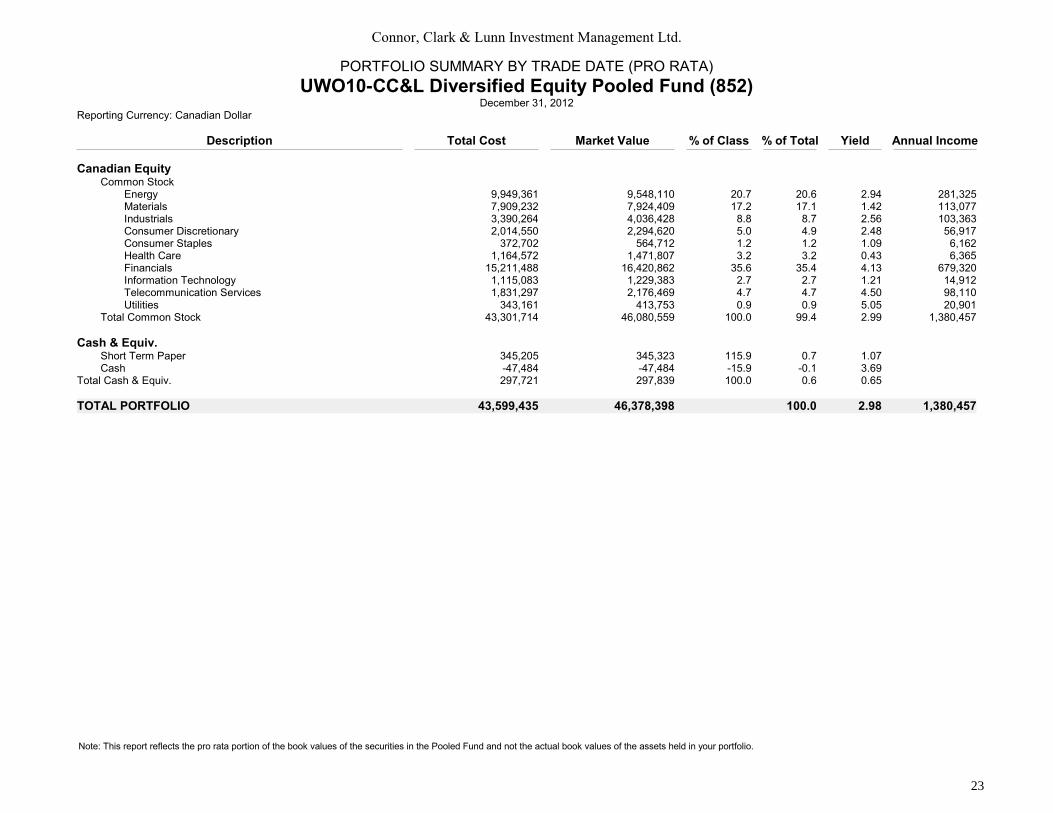
Connor, Clark & Lunn Investment Management Ltd.
PORTFOLIO SUMMARY BY TRADE DATE (PRO RATA)
UWO10-CC&L Diversified Equity Pooled Fund (852)December 31, 2012
Reporting Currency: Canadian Dollar
Description Total Cost Market Value % of Class % of Total Yield Annual Income
Canadian EquityCommon Stock
Energy 9,949,361 9,548,110 20.7 20.6 2.94 281,325Materials 7,909,232 7,924,409 17.2 17.1 1.42 113,077Industrials 3,390,264 4,036,428 8.8 8.7 2.56 103,363Consumer Discretionary 2,014,550 2,294,620 5.0 4.9 2.48 56,917Consumer Staples 372,702 564,712 1.2 1.2 1.09 6,162Health Care 1,164,572 1,471,807 3.2 3.2 0.43 6,365Financials 15,211,488 16,420,862 35.6 35.4 4.13 679,320Information Technology 1,115,083 1,229,383 2.7 2.7 1.21 14,912Telecommunication Services 1,831,297 2,176,469 4.7 4.7 4.50 98,110Utilities 343,161 413,753 0.9 0.9 5.05 20,901
Total Common Stock 43,301,714 46,080,559 100.0 99.4 2.99 1,380,457
Cash & Equiv.Short Term Paper 345,205 345,323 115.9 0.7 1.07Cash -47,484 -47,484 -15.9 -0.1 3.69
Total Cash & Equiv. 297,721 297,839 100.0 0.6 0.65
TOTAL PORTFOLIO 43,599,435 46,378,398 100.0 2.98 1,380,457
Note: This report reflects the pro rata portion of the book values of the securities in the Pooled Fund and not the actual book values of the assets held in your portfolio.
23

Connor, Clark & Lunn Investment Management Ltd.
PORTFOLIO VALUATION BY TRADE DATE (PRO RATA)
UWO10-CC&L Diversified Equity Pooled Fund (852)December 31, 2012
Reporting Currency: Canadian Dollar
Unit Total Market Market % of % of Dividend Annual
Quantity Description Cost Cost Price Value Class Total Coupon Yield Income
Canadian EquityCommon Stock
EnergyEnergy
357 Altagas Income ltd. 33.789 12,083 33.570 12,004 0.0 0.0 1.440 4.28 514781 ARC Resources Ltd 24.256 18,945 24.440 19,088 0.0 0.0 1.200 4.90 937
8,503 Avenex Energy Corp 6.121 52,055 2.650 22,535 0.0 0.0 0.420 15.84 3,5713,787 Baytex Energy Corp 45.452 172,164 42.870 162,383 0.4 0.4 2.640 6.15 9,999
972 Bonterra Energy Corp. 54.563 53,073 45.640 44,394 0.1 0.1 3.120 6.83 3,03413,266 Cameco Corp. 23.215 307,976 19.590 259,881 0.6 0.6 0.400 2.04 5,30633,859 Canadian Natural Resources Ltd. 36.092 1,222,051 28.640 969,729 2.1 2.1 0.420 1.46 14,22016,278 Canadian Oil Sands Ltd. 23.033 374,943 20.170 328,336 0.7 0.7 1.400 6.94 22,789
6,754 Canelson Drilling Inc 4.666 31,519 4.880 32,962 0.1 0.1 0.200 4.09 1,35018,312 Cenovus Energy Inc. 32.911 602,701 33.290 609,625 1.3 1.3 0.880 2.64 16,115
5,721 Crescent Point Energy Corp. 42.850 245,183 37.620 215,253 0.5 0.5 2.759 7.33 15,79216,930 Crocotta Energy Inc 3.289 55,696 3.000 50,792 0.1 0.1
6,495 Deethree Exploration Ltd. 6.239 40,528 6.510 42,285 0.1 0.17,409 Delphi Energy Corp 2.208 16,365 1.140 8,447 0.0 0.0
12,505 Enbridge Inc. 35.388 442,556 43.020 537,986 1.2 1.2 1.260 2.92 15,756889 Enbridge Income Fund Holdings Inc. 18.844 16,766 24.130 21,469 0.0 0.0 1.335 5.53 1,187
48,835 EnCana Corp. 21.473 1,048,661 19.660 960,101 2.1 2.1 0.800 4.06 39,068546 Enerflex Ltd. 13.701 7,486 11.980 6,546 0.0 0.0 0.280 2.33 153835 Freehold Royalties Ltd 21.534 17,989 22.400 18,712 0.0 0.0 1.680 7.50 1,403709 Gibson Energy 23.288 16,523 24.050 17,063 0.0 0.0 1.040 4.32 737
7,561 Husky Energy Inc. 25.742 194,644 29.400 222,302 0.5 0.5 1.200 4.08 9,0731,650 Imperial Oil Limited 42.026 69,375 42.729 70,535 0.2 0.2 0.480 1.12 7926,499 Inter Pipeline Fund 19.486 126,662 23.500 152,748 0.3 0.3 1.110 4.72 7,2146,143 Long Run Exploration LTD. 7.184 44,135 4.900 30,100 0.1 0.1
14,704 Mullen Group Ltd. 20.619 303,208 20.900 307,333 0.7 0.7 1.000 4.78 14,70415,936 Nexen Inc. 20.107 320,446 26.570 423,434 0.9 0.9 0.200 0.75 3,187
3,258 Pace Oil & Gas Ltd. 5.941 19,359 3.290 10,720 0.0 0.018,241 Pacific Rubiales Energy Corp 25.677 468,384 23.110 421,549 0.9 0.9 0.440 1.90 8,02611,306 Parkland Fuel Corp 14.713 166,353 18.930 214,026 0.5 0.5 1.020 5.38 11,532
17 Pason Systems Inc. 16.894 289 17.150 294 0.0 0.0 0.480 2.79 8283 Pembina Pipeline Corp. 28.078 7,952 28.460 8,060 0.0 0.0 1.620 5.69 458
3,822 Petrobakken Energy Ltd. 13.368 51,095 10.250 39,176 0.1 0.1 0.960 9.36 3,66911,288 Petrobank Energy 12.198 137,710 12.400 139,981 0.3 0.3
6,720 Shawcor Ltd. 35.727 240,098 38.990 262,021 0.6 0.6 0.400 1.02 2,688904 Spartan Oil Corp. 4.907 4,436 5.240 4,737 0.0 0.0
50,126 Suncor Energy Inc. 34.662 1,737,505 32.710 1,639,640 3.6 3.5 0.520 1.58 26,06524,842 Talisman Energy Inc. 14.184 352,379 11.250 279,475 0.6 0.6 0.270 2.40 6,707
2,640 Total Energy Services Inc. 13.516 35,691 14.990 39,582 0.1 0.1 0.200 1.33 52811,262 TransCanada Pipelines Corp. 44.740 503,895 47.020 529,563 1.1 1.1 1.760 3.74 19,822
906 Transglobe Energy Corp 11.209 10,165 9.330 8,461 0.0 0.0
Note: This report reflects the pro rata portion of the book values of the securities in the Pooled Fund and not the actual book values of the assets held in your portfolio.
24

Connor, Clark & Lunn Investment Management Ltd.
PORTFOLIO VALUATION BY TRADE DATE (PRO RATA)
UWO10-CC&L Diversified Equity Pooled Fund (852)December 31, 2012
Reporting Currency: Canadian Dollar
Unit Total Market Market % of % of Dividend Annual
Quantity Description Cost Cost Price Value Class Total Coupon Yield Income
111 Trilogy Energy Corp. 33.469 3,734 29.110 3,247 0.0 0.0 0.420 1.44 4616,444 Trinidad Drilling 8.144 133,937 6.880 113,137 0.2 0.2 0.200 2.90 3,288
4,820 Vermilion Energy Inc. 46.856 225,877 51.970 250,526 0.5 0.5 2.400 4.61 11,5694,375 Whitecap Resources Inc. 8.397 36,744 8.650 37,851 0.1 0.1
Total Energy 9,949,361 9,548,110 20.7 20.6 2.94 281,325
MaterialsMaterials
8,531 Agnico-Eagle Mines 53.008 452,224 52.130 444,729 1.0 1.0 0.880 1.68 7,50713,248 Agrium Inc. 88.394 1,171,117 99.140 1,313,482 2.9 2.8 2.000 2.01 26,49716,733 Alacer Gold Corp. 9.021 150,967 5.200 87,013 0.2 0.2
6,248 Alamos Gold 18.904 118,120 17.450 109,030 0.2 0.2 0.200 1.14 1,2498,966 Argonaut Gold Inc. 7.973 71,487 9.470 84,908 0.2 0.2
44,046 B2Gold Corp. 3.330 146,713 3.560 156,804 0.3 0.325,564 Barrick Gold Corp. 43.546 1,113,253 34.820 890,164 1.9 1.9 0.800 2.29 20,45112,050 Brigus Gold Corp 0.964 11,628 0.930 11,206 0.0 0.0
2,351 Canexus Corp 8.059 18,953 8.480 19,941 0.0 0.0 0.547 6.45 1,286251 Canfor Corp. 15.213 3,830 16.579 4,174 0.0 0.0
1,418 Cascades Inc. 4.385 6,222 4.100 5,817 0.0 0.0 0.160 3.90 2275,778 Dundee Precious Metals 9.101 52,594 8.470 48,948 0.1 0.15,690 First Majestic Silver Crop 22.332 127,080 20.060 114,147 0.2 0.28,245 First Quantum Minerals Ltd 21.890 180,488 21.910 180,649 0.4 0.4 0.120 0.55 9945,641 Franco-Nevada Corp. 47.005 265,187 56.780 320,333 0.7 0.7 0.720 1.26 4,062
13,801 Goldcorp Inc. 45.317 625,445 36.570 504,721 1.1 1.1 0.600 1.64 8,28012,942 Harry Winston Diamond Corp. 13.290 172,016 13.980 180,938 0.4 0.4
841 Imperial Metals Corp 16.507 13,884 12.100 10,177 0.0 0.027,541 Intertape Polymer Group Inc. 7.329 201,864 8.000 220,334 0.5 0.5 0.160 2.00 4,406
7,612 Kinross Gold Corp. 9.149 69,651 9.660 73,539 0.2 0.2 0.160 1.65 1,21818,598 Lundin Mining 4.934 91,774 5.120 95,224 0.2 0.2
6,145 Methanex Corp. 29.125 178,983 31.680 194,679 0.4 0.4 0.740 2.33 4,54720,043 Nevsun Resources Ltd. 4.560 91,399 4.250 85,184 0.2 0.2 0.100 2.35 2,00425,157 New Gold Inc. 9.568 240,723 11.010 276,980 0.6 0.6
9,844 Noranda Income Fund 5.525 54,392 4.740 46,662 0.1 0.1 0.500 10.54 4,9228,202 Norbord Inc. 17.769 145,750 30.190 247,629 0.5 0.5
16,164 OceanaGold Corp 3.160 51,094 2.850 46,067 0.1 0.19,696 Potash Corp. of Saskatchewan 43.096 417,910 40.479 392,533 0.9 0.8 0.840 2.07 8,145
13,240 Pretium Resources Inc 14.542 192,546 13.110 173,578 0.4 0.431,998 Primero Mining Corp. 4.761 152,372 6.400 204,787 0.4 0.4
3,046 Rio Alto Mining Ltd. 5.289 16,115 5.090 15,508 0.0 0.07,604 Sherritt Intl. 5.927 45,077 5.750 43,724 0.1 0.1 0.152 2.64 1,1559,824 Silver Wheaton Corp 37.753 370,905 35.860 352,298 0.8 0.8 0.280 0.78 2,750
243 Stella-Jones Inc. 62.821 15,276 76.630 18,634 0.0 0.0 0.640 0.83 1552,577 Teck Resources Ltd. 39.111 100,807 36.150 93,173 0.2 0.2 0.900 2.48 2,319
29,369 TIMMINS GOLD CORP 2.626 77,133 2.990 87,815 0.2 0.2
Note: This report reflects the pro rata portion of the book values of the securities in the Pooled Fund and not the actual book values of the assets held in your portfolio.
25
Connor, Clark & Lunn Investment Management Ltd.
PORTFOLIO VALUATION BY TRADE DATE (PRO RATA)
UWO10-CC&L Diversified Equity Pooled Fund (852)December 31, 2012
Reporting Currency: Canadian Dollar
Unit Total Market Market % of % of Dividend Annual
Quantity Description Cost Cost Price Value Class Total Coupon Yield Income
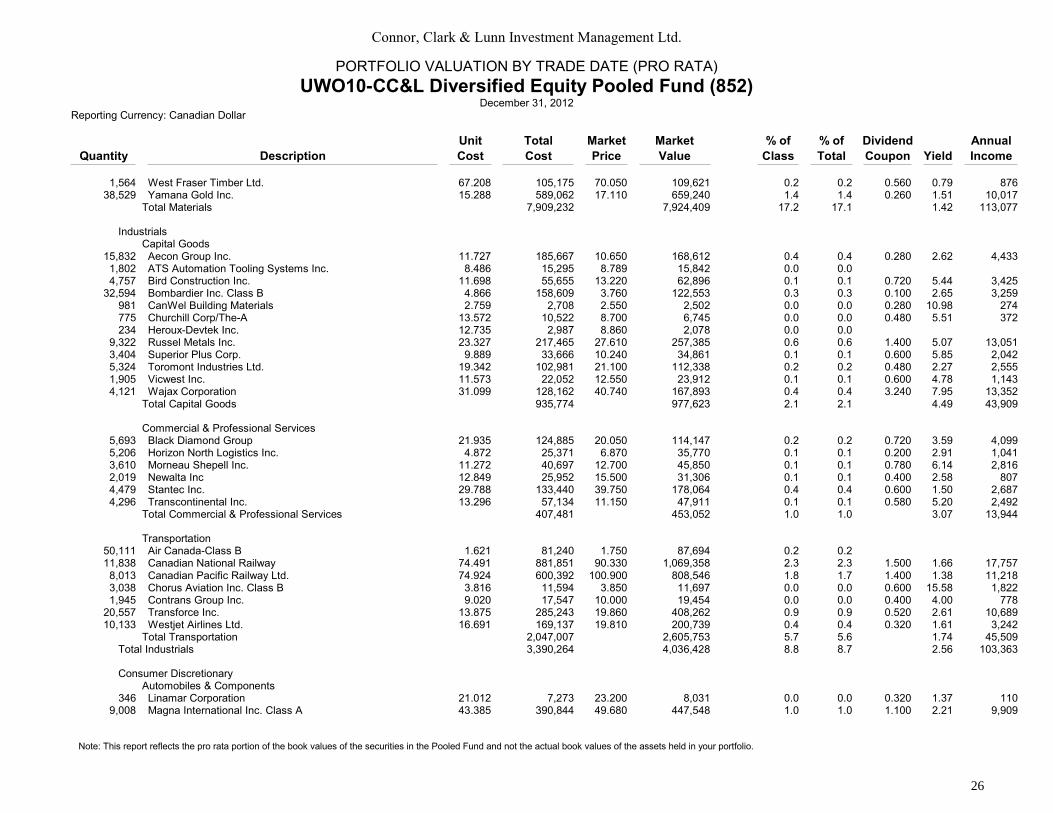
1,564 West Fraser Timber Ltd. 67.208 105,175 70.050 109,621 0.2 0.2 0.560 0.79 87638,529 Yamana Gold Inc. 15.288 589,062 17.110 659,240 1.4 1.4 0.260 1.51 10,017
Total Materials 7,909,232 7,924,409 17.2 17.1 1.42 113,077
IndustrialsCapital Goods
15,832 Aecon Group Inc. 11.727 185,667 10.650 168,612 0.4 0.4 0.280 2.62 4,4331,802 ATS Automation Tooling Systems Inc. 8.486 15,295 8.789 15,842 0.0 0.04,757 Bird Construction Inc. 11.698 55,655 13.220 62,896 0.1 0.1 0.720 5.44 3,425
32,594 Bombardier Inc. Class B 4.866 158,609 3.760 122,553 0.3 0.3 0.100 2.65 3,259981 CanWel Building Materials 2.759 2,708 2.550 2,502 0.0 0.0 0.280 10.98 274775 Churchill Corp/The-A 13.572 10,522 8.700 6,745 0.0 0.0 0.480 5.51 372234 Heroux-Devtek Inc. 12.735 2,987 8.860 2,078 0.0 0.0
9,322 Russel Metals Inc. 23.327 217,465 27.610 257,385 0.6 0.6 1.400 5.07 13,0513,404 Superior Plus Corp. 9.889 33,666 10.240 34,861 0.1 0.1 0.600 5.85 2,0425,324 Toromont Industries Ltd. 19.342 102,981 21.100 112,338 0.2 0.2 0.480 2.27 2,5551,905 Vicwest Inc. 11.573 22,052 12.550 23,912 0.1 0.1 0.600 4.78 1,1434,121 Wajax Corporation 31.099 128,162 40.740 167,893 0.4 0.4 3.240 7.95 13,352
Total Capital Goods 935,774 977,623 2.1 2.1 4.49 43,909
Commercial & Professional Services5,693 Black Diamond Group 21.935 124,885 20.050 114,147 0.2 0.2 0.720 3.59 4,0995,206 Horizon North Logistics Inc. 4.872 25,371 6.870 35,770 0.1 0.1 0.200 2.91 1,0413,610 Morneau Shepell Inc. 11.272 40,697 12.700 45,850 0.1 0.1 0.780 6.14 2,8162,019 Newalta Inc 12.849 25,952 15.500 31,306 0.1 0.1 0.400 2.58 8074,479 Stantec Inc. 29.788 133,440 39.750 178,064 0.4 0.4 0.600 1.50 2,6874,296 Transcontinental Inc. 13.296 57,134 11.150 47,911 0.1 0.1 0.580 5.20 2,492
Total Commercial & Professional Services 407,481 453,052 1.0 1.0 3.07 13,944
Transportation50,111 Air Canada-Class B 1.621 81,240 1.750 87,694 0.2 0.211,838 Canadian National Railway 74.491 881,851 90.330 1,069,358 2.3 2.3 1.500 1.66 17,757
8,013 Canadian Pacific Railway Ltd. 74.924 600,392 100.900 808,546 1.8 1.7 1.400 1.38 11,2183,038 Chorus Aviation Inc. Class B 3.816 11,594 3.850 11,697 0.0 0.0 0.600 15.58 1,8221,945 Contrans Group Inc. 9.020 17,547 10.000 19,454 0.0 0.0 0.400 4.00 778
20,557 Transforce Inc. 13.875 285,243 19.860 408,262 0.9 0.9 0.520 2.61 10,68910,133 Westjet Airlines Ltd. 16.691 169,137 19.810 200,739 0.4 0.4 0.320 1.61 3,242
Total Transportation 2,047,007 2,605,753 5.7 5.6 1.74 45,509Total Industrials 3,390,264 4,036,428 8.8 8.7 2.56 103,363
Consumer DiscretionaryAutomobiles & Components
346 Linamar Corporation 21.012 7,273 23.200 8,031 0.0 0.0 0.320 1.37 1109,008 Magna International Inc. Class A 43.385 390,844 49.680 447,548 1.0 1.0 1.100 2.21 9,909
Note: This report reflects the pro rata portion of the book values of the securities in the Pooled Fund and not the actual book values of the assets held in your portfolio.
26

Connor, Clark & Lunn Investment Management Ltd.
PORTFOLIO VALUATION BY TRADE DATE (PRO RATA)
UWO10-CC&L Diversified Equity Pooled Fund (852)December 31, 2012
Reporting Currency: Canadian Dollar
Unit Total Market Market % of % of Dividend Annual
Quantity Description Cost Cost Price Value Class Total Coupon Yield Income
4,165 Martinrea International Inc. 8.096 33,724 7.750 32,282 0.1 0.1Total Automobiles & Components 431,843 487,861 1.1 1.1 2.05 10,020
Consumer Durables & Apparel2,185 Dorel Industries Inc. Class B 34.461 75,323 35.950 78,576 0.2 0.2 1.200 3.33 2,6224,553 Gildan Activewear Class A 35.369 161,045 36.330 165,420 0.4 0.4 0.360 0.99 1,639
Total Consumer Durables & Apparel 236,369 243,996 0.5 0.5 1.74 4,262
Consumer Services168 Boston Pizza Royalties-Units 17.611 2,972 19.300 3,257 0.0 0.0 1.176 6.09 198
4,008 Enercare 7.496 30,045 8.180 32,786 0.1 0.1 0.672 8.21 2,693240 Great Canadian Gaming Corp. 8.282 1,990 9.550 2,295 0.0 0.0
2,121 Transat AT Inc. - Class B 5.300 11,244 5.930 12,580 0.0 0.02,497 Whistler Blackcomb Holdings Inc 11.030 27,548 12.300 30,719 0.1 0.1 0.975 7.92 2,435
Total Consumer Services 73,801 81,639 0.2 0.2 6.52 5,327
Media23,055 Aimia Inc. 14.109 325,304 14.870 342,841 0.7 0.7 0.640 4.30 14,755
941 Astral Media Inc. Class A 39.663 37,332 46.229 43,513 0.1 0.1 1.000 2.16 9412,972 Cineplex Inc. 29.489 87,655 31.830 94,613 0.2 0.2 1.350 4.24 4,0123,530 Corus Entertainment Inc. 22.540 79,575 24.579 86,775 0.2 0.2 0.960 3.90 3,3895,498 Quebecor Inc. Class B 36.076 198,370 38.670 212,631 0.5 0.5 0.200 0.51 1,0996,202 Thomson Reuters Corporation 28.009 173,726 28.780 178,505 0.4 0.4 1.280 4.44 7,939
879 Torstar Corp. Class B 8.412 7,400 7.810 6,870 0.0 0.0 0.525 6.72 461Total Media 909,365 965,750 2.1 2.1 3.37 32,599
Retailing949 Canadian Tire Corp. Ltd. Class A 68.260 64,834 69.380 65,898 0.1 0.1 1.400 2.01 1,329
7,547 Dollarama Inc. 38.914 293,685 58.970 445,047 1.0 1.0 0.440 0.74 3,320414 Rona Inc. 11.213 4,651 10.670 4,426 0.0 0.0 0.140 1.31 58
Total Retailing 363,171 515,372 1.1 1.1 0.91 4,708Total Consumer Discretionary 2,014,550 2,294,620 5.0 4.9 2.48 56,917
Consumer StaplesFood & Staples Retailing
7,478 Alimentation Couche-Tard Class B 28.236 211,164 48.930 365,916 0.8 0.8 0.300 0.61 2,2438,954 Jean Coutu Group 12.286 110,024 14.530 130,109 0.3 0.3 0.280 1.92 2,507
881 Metro Inc. 45.653 40,227 63.330 55,803 0.1 0.1 0.860 1.35 757Total Food & Staples Retailing 361,416 551,829 1.2 1.2 0.99 5,508
Food Beverage & Tobacco498 Cott Corp. 8.023 4,000 8.000 3,989 0.0 0.0 0.240 3.00 119
1,484 Rogers Sugar Inc. 4.905 7,284 5.990 8,893 0.0 0.0 0.360 6.01 534Total Food Beverage & Tobacco 11,285 12,883 0.0 0.0 5.07 654
Total Consumer Staples 372,702 564,712 1.2 1.2 1.09 6,162
Note: This report reflects the pro rata portion of the book values of the securities in the Pooled Fund and not the actual book values of the assets held in your portfolio.
27

Connor, Clark & Lunn Investment Management Ltd.
PORTFOLIO VALUATION BY TRADE DATE (PRO RATA)
UWO10-CC&L Diversified Equity Pooled Fund (852)December 31, 2012
Reporting Currency: Canadian Dollar
Unit Total Market Market % of % of Dividend Annual
Quantity Description Cost Cost Price Value Class Total Coupon Yield Income
Health CareHealth Care Equipment & Services
9,953 Catamaran Corporation 44.913 447,023 46.780 465,602 1.0 1.07,126 Extendicare Inc. 7.557 53,855 7.650 54,517 0.1 0.1 0.840 10.98 5,986
Total Health Care Equipment & Services 500,879 520,120 1.1 1.1 1.15 5,986
Pharmaceuticals Biotechnology & Life Sciences946 Nordion Inc. 6.448 6,106 6.480 6,136 0.0 0.0 0.400 6.17 378429 Paladin Labs Inc 35.459 15,216 41.720 17,903 0.0 0.0
1,866 QLT Inc. 6.443 12,025 7.800 14,556 0.0 0.015,387 Valeant Pharmaceuticals International 40.964 630,344 59.340 913,091 2.0 2.0
Total Pharmaceuticals Biotechnology & Life Sciences 663,693 951,687 2.1 2.1 0.03 378Total Health Care 1,164,572 1,471,807 3.2 3.2 0.43 6,365
FinancialsBanks
16,609 Bank of Montreal 58.461 971,026 60.860 1,010,872 2.2 2.2 2.880 4.73 47,83637,033 Bank of Nova Scotia 53.570 1,983,919 57.460 2,127,946 4.6 4.6 2.279 3.96 84,43615,406 Canadian Imperial Bank of Commerce 74.437 1,146,844 79.970 1,232,085 2.7 2.7 3.760 4.70 57,929
277 Equitable Group Inc. 27.088 7,517 32.650 9,060 0.0 0.0 0.560 1.71 15513,360 Genworth MI Canada Inc. 22.142 295,836 22.590 301,810 0.7 0.7 1.280 5.66 17,101
1,862 Home Capital Group Inc 41.915 78,080 59.070 110,036 0.2 0.2 1.040 1.76 1,9372,846 Laurentian Bank of Canada 44.800 127,528 44.240 125,932 0.3 0.3 1.960 4.43 5,5798,788 National Bank of Canada 73.293 644,148 77.240 678,834 1.5 1.5 3.320 4.29 29,178
52,836 Royal Bank of Canada 54.541 2,881,755 59.880 3,163,842 6.9 6.8 2.400 4.00 126,80732,379 Toronto-Dominion Bank 76.369 2,472,809 83.750 2,711,770 5.9 5.8 3.080 3.67 99,728
Total Banks 10,609,466 11,472,190 24.9 24.7 4.10 470,689
Diversified Financials2,460 AGF Management Ltd. Cl B Non Voting 16.663 40,998 9.920 24,406 0.1 0.1 1.080 10.88 2,657
354 Davis & Henderson Income Corp 21.212 7,525 21.560 7,648 0.0 0.0 1.280 5.93 4548,582 Dundee Corp. 20.907 179,443 30.650 263,058 0.6 0.6 0.066 0.21 5721,115 GMP Capital Inc. 5.048 5,633 5.850 6,527 0.0 0.0 0.200 3.41 223
380 Onex Corp. 41.038 15,614 41.870 15,931 0.0 0.0 0.110 0.26 4180 Sprott Resource Lending Corp. 1.469 117 1.540 123 0.0 0.0 0.060 3.89 4
271 TMX Group Ltd. 50.325 13,677 50.720 13,784 0.0 0.0 1.600 3.15 434Total Diversified Financials 263,011 331,480 0.7 0.7 1.32 4,388
Insurance10,224 Great West Lifeco 21.790 222,784 24.350 248,956 0.5 0.5 1.230 5.05 12,57550,546 Manulife Financial Corp. 13.582 686,531 13.510 682,878 1.5 1.5 0.520 3.84 26,28315,305 Power Corp. of Canada 25.094 384,081 25.380 388,452 0.8 0.8 1.160 4.57 17,754
7,471 Power Financial Corp. 27.526 205,659 27.240 203,515 0.4 0.4 1.400 5.13 10,459
Note: This report reflects the pro rata portion of the book values of the securities in the Pooled Fund and not the actual book values of the assets held in your portfolio.
28

Connor, Clark & Lunn Investment Management Ltd.
PORTFOLIO VALUATION BY TRADE DATE (PRO RATA)
UWO10-CC&L Diversified Equity Pooled Fund (852)December 31, 2012
Reporting Currency: Canadian Dollar
Unit Total Market Market % of % of Dividend Annual
Quantity Description Cost Cost Price Value Class Total Coupon Yield Income
19,231 Sun Life Financial Inc. 23.483 451,628 26.370 507,147 1.1 1.1 1.440 5.46 27,694Total Insurance 1,950,684 2,030,950 4.4 4.4 4.66 94,767
Real Estate1,015 Allied Ptys R/Est Inv T/U 29.633 30,096 33.000 33,515 0.1 0.1 1.359 4.11 1,3803,217 Altus Group Inc. 7.846 25,243 8.260 26,572 0.1 0.1 0.600 7.26 1,930
23,828 Artis Real Estate Investment Trust 14.770 351,961 15.640 372,675 0.8 0.8 1.080 6.90 25,73454 Boardwalk Real Estate Investment Trust 64.078 3,483 64.530 3,507 0.0 0.0 1.920 2.97 104
22,200 Brookfield Asset Management Inc. 32.497 721,458 36.440 808,985 1.8 1.7 0.560 1.53 12,432180 Brookfield Canada Office Properties
Trust Units25.531 4,601 29.270 5,275 0.0 0.0 1.170 3.99 210
10,496 Brookfield Office Properties Inc. 17.038 178,845 16.960 178,022 0.4 0.4 0.560 3.30 5,87851 Calloway Real Estate Invt Tr 28.655 1,475 28.950 1,490 0.0 0.0 1.548 5.34 79
5,495 Canadian Apt Pptys Reit 23.176 127,373 24.900 136,844 0.3 0.3 1.119 4.49 6,1552,039 Chartwell Seniors Housing REIT 8.985 18,328 10.869 22,172 0.0 0.0 0.540 4.96 1,1016,765 Dundee Real Estate Investment Trust 34.452 233,108 37.430 253,251 0.5 0.5 2.196 5.86 14,8582,571 Granite Real Estate Inc. 36.074 92,780 37.760 97,116 0.2 0.2 2.000 5.29 5,143
829 H&R REIT Units 23.738 19,694 24.100 19,994 0.0 0.0 1.350 5.60 1,12020,947 Inn Vest Real Estate Invt Tr 4.584 96,026 4.130 86,512 0.2 0.2 0.399 9.67 8,370
529 Killam Properties Inc. 12.760 6,753 12.490 6,610 0.0 0.0 0.579 4.64 306532 Morguard Corp. 82.975 44,153 114.600 60,981 0.1 0.1 0.600 0.52 319
1,250 Morguard Real Estate Invt Tr 15.882 19,856 18.280 22,853 0.0 0.0 0.960 5.25 1,2002,629 Northwest Healthcare Property REIT 12.795 33,641 12.480 32,811 0.1 0.1 0.800 6.41 2,1032,763 Primaris Retail REIT 25.733 71,117 26.900 74,341 0.2 0.2 1.270 4.72 3,512
12,434 Riocan REIT Units 24.795 308,323 27.560 342,704 0.7 0.7 1.410 5.11 17,533Total Real Estate 2,388,326 2,586,240 5.6 5.6 4.23 109,475
Total Financials 15,211,488 16,420,862 35.6 35.4 4.13 679,320
Information TechnologySoftware & Services
7,295 Absolute Software Corp 6.217 45,359 5.100 37,205 0.1 0.111,680 CGI Group Class A 17.754 207,380 22.940 267,955 0.6 0.6
1,439 Constellation Software Inc. 94.674 136,239 119.990 172,668 0.4 0.4 4.000 3.33 5,7564,096 MacDonald Dettwiler & Assoc 46.950 192,346 55.960 229,256 0.5 0.5 1.300 2.32 5,325
Total Software & Services 581,325 707,086 1.5 1.5 1.56 11,081
Technology Hardware & Equipment863 Aastra Technologies 19.040 16,450 16.570 14,316 0.0 0.0 0.800 4.82 691
14,969 Celestica Inc. 8.235 123,281 8.070 120,804 0.3 0.32,557 Com Dev International Ltd. 2.348 6,006 3.180 8,133 0.0 0.0
2 EXFO Inc. 10.417 29 5.280 15 0.0 0.021,090 Research In Motion 9.709 204,767 11.800 248,867 0.5 0.5
3,610 Sierra Wireless Inc. 8.803 31,785 7.920 28,594 0.1 0.1
Note: This report reflects the pro rata portion of the book values of the securities in the Pooled Fund and not the actual book values of the assets held in your portfolio.
29

Connor, Clark & Lunn Investment Management Ltd.
PORTFOLIO VALUATION BY TRADE DATE (PRO RATA)
UWO10-CC&L Diversified Equity Pooled Fund (852)December 31, 2012
Reporting Currency: Canadian Dollar
Unit Total Market Market % of % of Dividend Annual
Quantity Description Cost Cost Price Value Class Total Coupon Yield Income
22,420 Wi-LAN Inc. 6.754 151,436 4.530 101,566 0.2 0.2 0.140 3.09 3,138Total Technology Hardware & Equipment 533,758 522,297 1.1 1.1 0.73 3,830
Total Information Technology 1,115,083 1,229,383 2.7 2.7 1.21 14,912
Telecommunication ServicesTelecommunication Services
17,864 BCE Inc. 35.403 632,475 42.630 761,574 1.7 1.6 2.270 5.32 40,5529,458 Manitoba Telecom Services Inc. 31.989 302,559 32.460 307,009 0.7 0.7 1.700 5.23 16,078
10,736 Rogers Comm Inc. Class B 38.860 417,246 45.159 484,881 1.1 1.0 1.580 3.49 16,9648,671 Telus Corp. 51.278 444,669 65.100 564,530 1.2 1.2 2.560 3.93 22,199
904 Telus Corp. Non-voting 37.990 34,345 64.680 58,473 0.1 0.1 2.560 3.95 2,314Total Telecommunication Services 1,831,297 2,176,469 4.7 4.7 4.50 98,110
UtilitiesUtilities
2,171 Algonquin Power & Utilities Co 6.333 13,752 6.840 14,852 0.0 0.0 0.310 4.53 6733,452 Atco Ltd. Class I 46.956 162,125 80.720 278,698 0.6 0.6 1.310 1.62 4,522
12,666 Just Energy Group Inc. 13.207 167,283 9.490 120,202 0.3 0.3 1.239 13.06 15,705Total Utilities 343,161 413,753 0.9 0.9 5.05 20,901
Total Common Stock 43,301,714 46,080,559 100.0 99.4 2.99 1,380,457
Cash & Equiv.Short Term Paper
4,291 Bank of Montreal BDN 01-17-13 99.722 4,279 99.950 4,289 1.4 0.0 1.052,860 Bank of Nova Scotia BDN 02-04-13 99.726 2,853 99.899 2,858 1.0 0.0 1.042,860 CIBC B/A 03-01-13 99.764 2,854 99.828 2,855 1.0 0.0 1.04
288,949 Bank of Nova Scotia BDN 03-25-13 99.720 288,141 99.753 288,236 96.8 0.6 1.0747,204 National Bank B/A 03-28-13 99.731 47,077 99.744 47,084 15.8 0.1 1.07
Total Short Term Paper 345,205 345,323 115.9 0.7 1.07
CashCanadian Cash Account 0.000 540,998 540,998 181.6 1.2 -1.00Due To Broker -809,787 -809,787 -271.8 -1.7 1.00Due From Broker 93,286 93,286 31.3 0.2 1.00Dividend Accrual 0.000 128,018 128,018 43.0 0.3
Total Cash -47,484 -47,484 -15.9 -0.1 3.69Total Cash & Equiv. 297,721 297,839 100.0 0.6 0.65
TOTAL PORTFOLIO 43,599,435 46,378,398 100.0 2.98 1,380,457
Note: This report reflects the pro rata portion of the book values of the securities in the Pooled Fund and not the actual book values of the assets held in your portfolio.
30
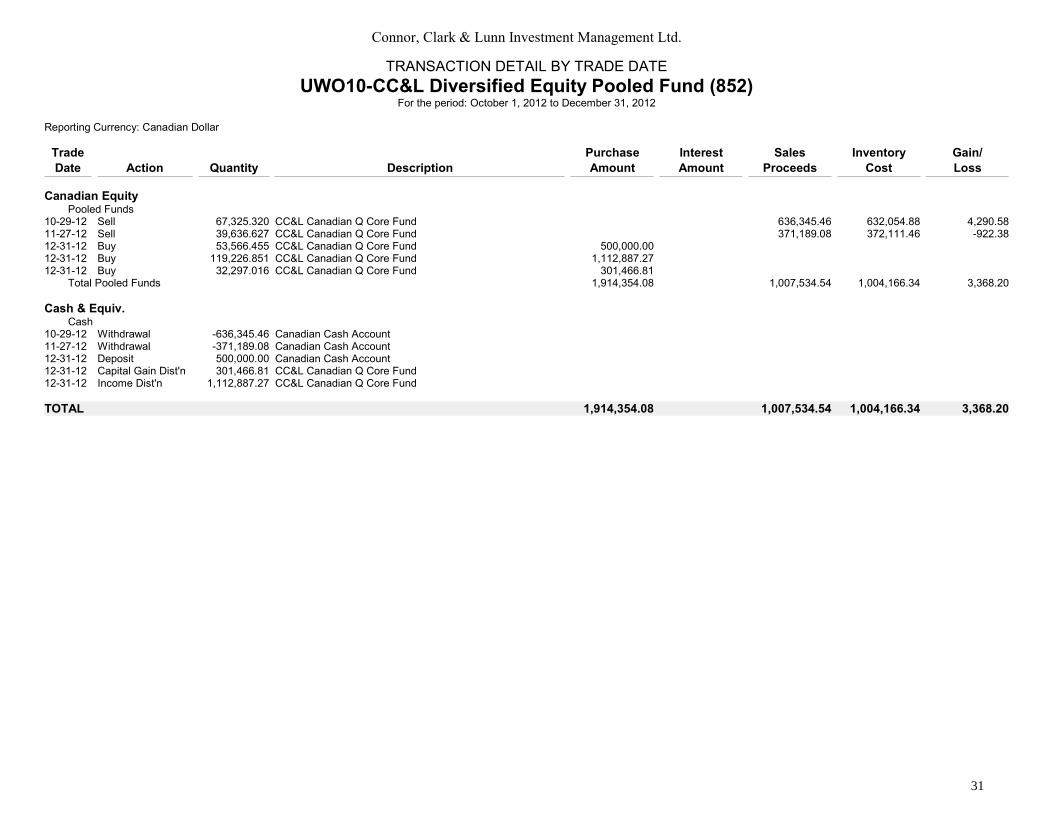
Connor, Clark & Lunn Investment Management Ltd.
TRANSACTION DETAIL BY TRADE DATE
UWO10-CC&L Diversified Equity Pooled Fund (852)For the period: October 1, 2012 to December 31, 2012
Reporting Currency: Canadian Dollar
Trade Purchase Interest Sales Inventory Gain/
Date Action Quantity Description Amount Amount Proceeds Cost Loss
Canadian EquityPooled Funds
10-29-12 Sell 67,325.320 CC&L Canadian Q Core Fund 636,345.46 632,054.88 4,290.5811-27-12 Sell 39,636.627 CC&L Canadian Q Core Fund 371,189.08 372,111.46 -922.3812-31-12 Buy 53,566.455 CC&L Canadian Q Core Fund 500,000.0012-31-12 Buy 119,226.851 CC&L Canadian Q Core Fund 1,112,887.2712-31-12 Buy 32,297.016 CC&L Canadian Q Core Fund 301,466.81
Total Pooled Funds 1,914,354.08 1,007,534.54 1,004,166.34 3,368.20
Cash & Equiv.Cash
10-29-12 Withdrawal -636,345.46 Canadian Cash Account11-27-12 Withdrawal -371,189.08 Canadian Cash Account12-31-12 Deposit 500,000.00 Canadian Cash Account12-31-12 Capital Gain Dist'n 301,466.81 CC&L Canadian Q Core Fund12-31-12 Income Dist'n 1,112,887.27 CC&L Canadian Q Core Fund
TOTAL 1,914,354.08 1,007,534.54 1,004,166.34 3,368.20
31