36-309/749 lecture 6: 2-way anova 10/1/2013
TRANSCRIPT

36-309/749
Experimental Design for Behavioral and Social Sciences
Oct. 6, 2015 Lecture 6: 2-way ANOVA

2

2-Way (Between Subjects) ANOVA Quantitative outcome and two categorical
explanatory variables (“factors”)
Each subject used once & no collusion, etc.
Both factors may be of primary interest, or one is of primary interest and the other represents “blocks”. In the latter case the block p-value is usually ignored.
Each factor may have 2 or more levels.
“Full factorial design”: every combination of the levels of the two factors is represented by some subjects.
Shorthand: “2 × 3” or “3 by 5” factorial experiment (shows number of levels)
3
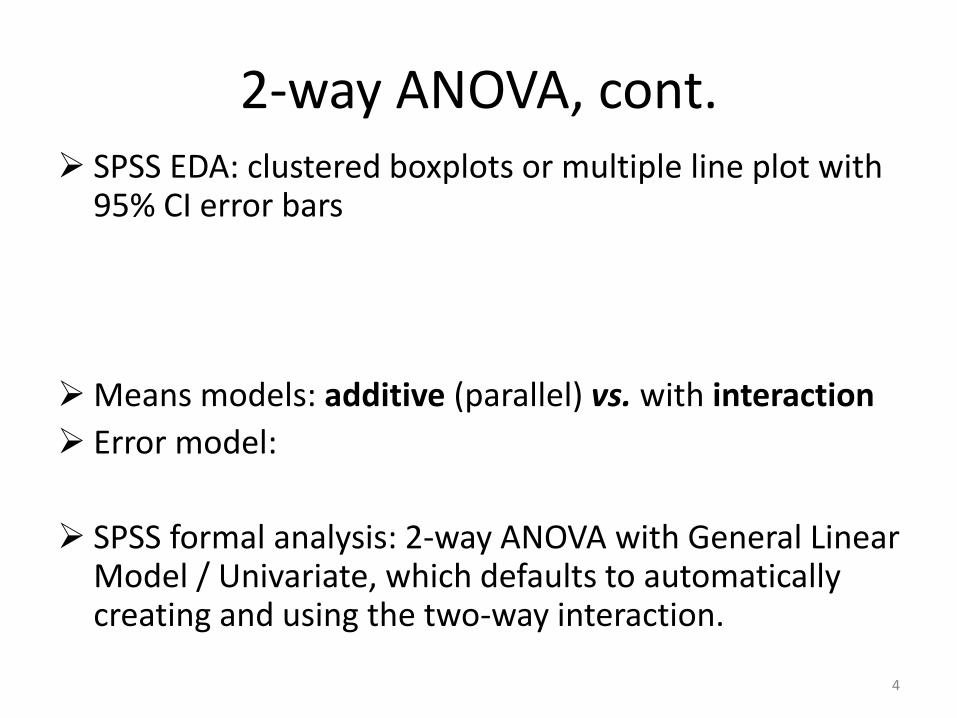
2-way ANOVA, cont. SPSS EDA: clustered boxplots or multiple line plot with
95% CI error bars
Means models: additive (parallel) vs. with interaction
Error model:
SPSS formal analysis: 2-way ANOVA with General Linear Model / Univariate, which defaults to automatically creating and using the two-way interaction.
4
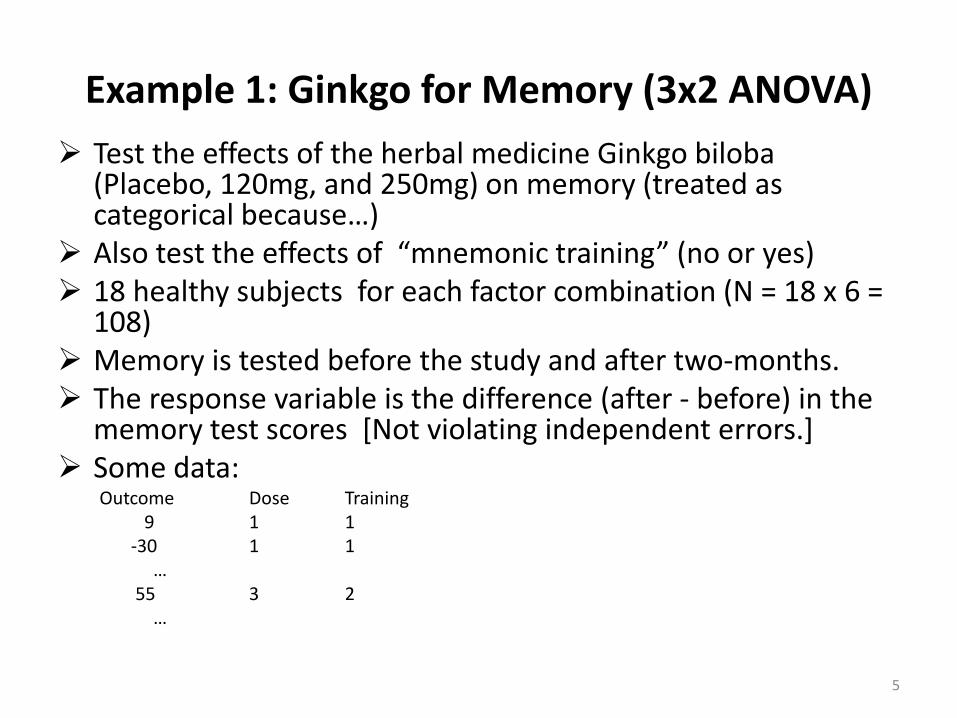
Example 1: Ginkgo for Memory (3x2 ANOVA)
Test the effects of the herbal medicine Ginkgo biloba (Placebo, 120mg, and 250mg) on memory (treated as categorical because…)
Also test the effects of “mnemonic training” (no or yes) 18 healthy subjects for each factor combination (N = 18 x 6 =
108) Memory is tested before the study and after two-months. The response variable is the difference (after - before) in the
memory test scores [Not violating independent errors.] Some data:
Outcome Dose Training 9 1 1 -30 1 1 … 55 3 2 …
5
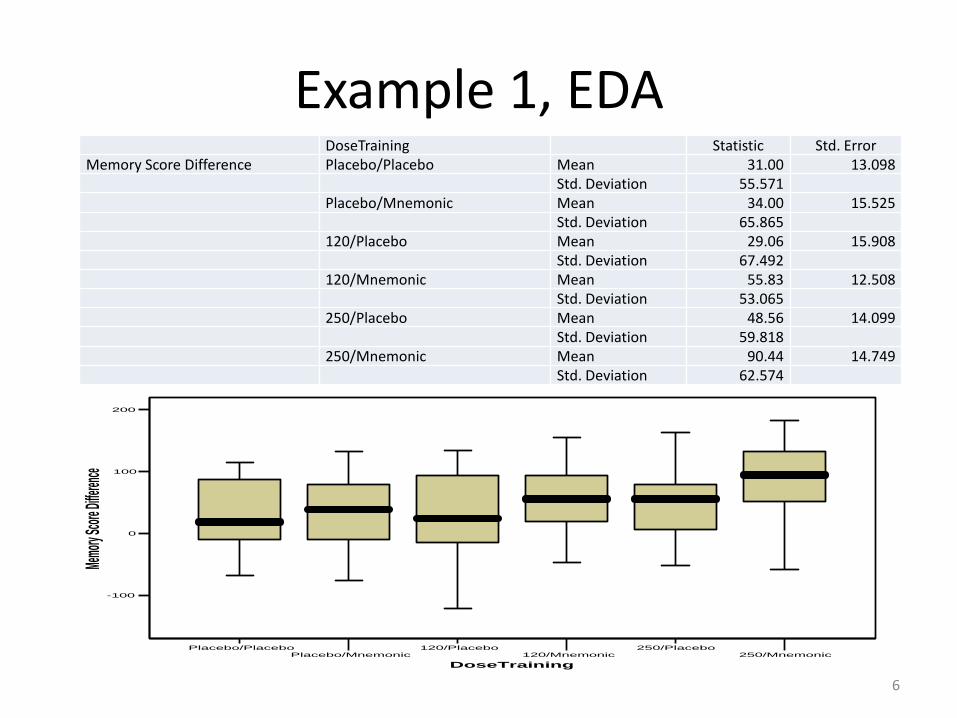
Example 1, EDA DoseTraining Statistic Std. Error Memory Score Difference Placebo/Placebo Mean 31.00 13.098
Std. Deviation 55.571 Placebo/Mnemonic Mean 34.00 15.525
Std. Deviation 65.865 120/Placebo Mean 29.06 15.908
Std. Deviation 67.492 120/Mnemonic Mean 55.83 12.508
Std. Deviation 53.065 250/Placebo Mean 48.56 14.099
Std. Deviation 59.818 250/Mnemonic Mean 90.44 14.749
Std. Deviation 62.574
6
Placebo/PlaceboPlacebo/Mnemonic
120/Placebo120/Mnemonic
250/Placebo250/Mnemonic
DoseTraining
-100
0
100
200
Memo
ry Sc
ore Di
fferen
ce
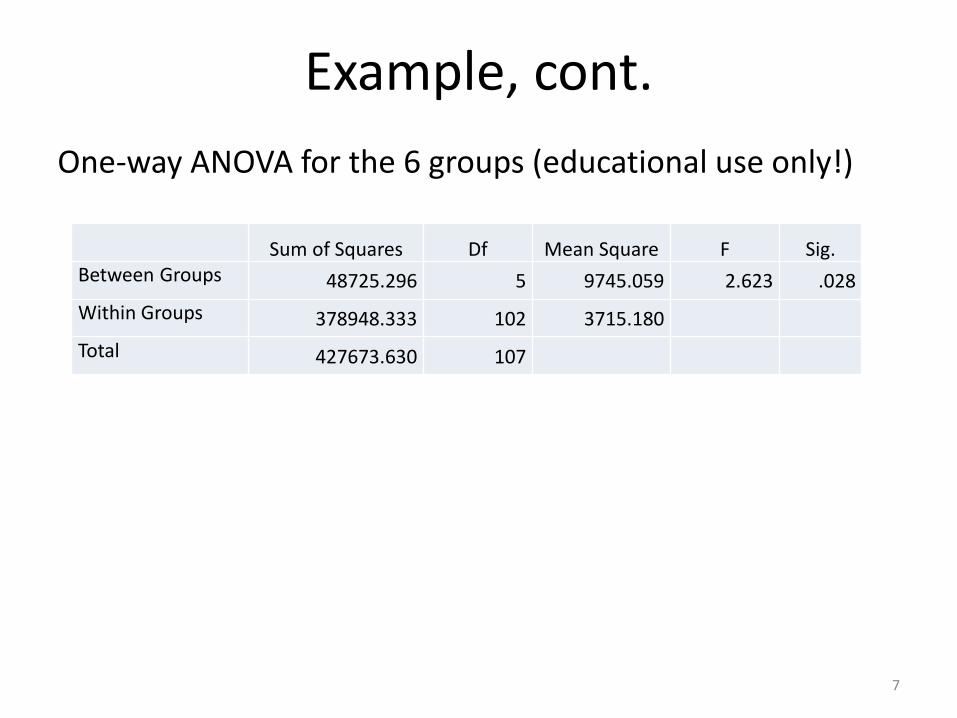
Example, cont.
One-way ANOVA for the 6 groups (educational use only!)
7
Sum of Squares Df Mean Square F Sig. Between Groups 48725.296 5 9745.059 2.623 .028
Within Groups 378948.333 102 3715.180
Total 427673.630 107

Example: Two-way ANOVA with interaction
8
Source
Type III Sum of Squares df Mean Square F Sig.
Corrected Model 48725.296(a) 5 9745.059 2.623 .028
Intercept 250370.370 1 250370.370 67.391 .000
Dose 26398.741 2 13199.370 3.553 .032
Training 15408.333 1 15408.333 4.147 .044
dose * training 6918.222 2 3459.111 .931 .397
Error 378948.333 102 3715.180
Total 678044.000 108
Corrected Total 427673.630 107
Sum of Squares Df Mean Square F Sig. Between Groups 48725.296 5 9745.059 2.623 .028
Within Groups 378948.333 102 3715.180
Total 427673.630 107

The meaning of interaction and interaction (profile) plots
An interaction is always described as being between two (or more) explanatory variables, and it indicates that the effects of changes in level of any one IV on the outcome depends on the level of the other IV. Also, the interaction is not between “levels” of one or both of the factors.
Interaction (profile) plots Be sure to take into account the sampling error.
SPSS “profile” plots show the current model, not the truth, i.e. those made with an additive model are always parallel.
“Crossing” is not synonymous with interaction!!!
9
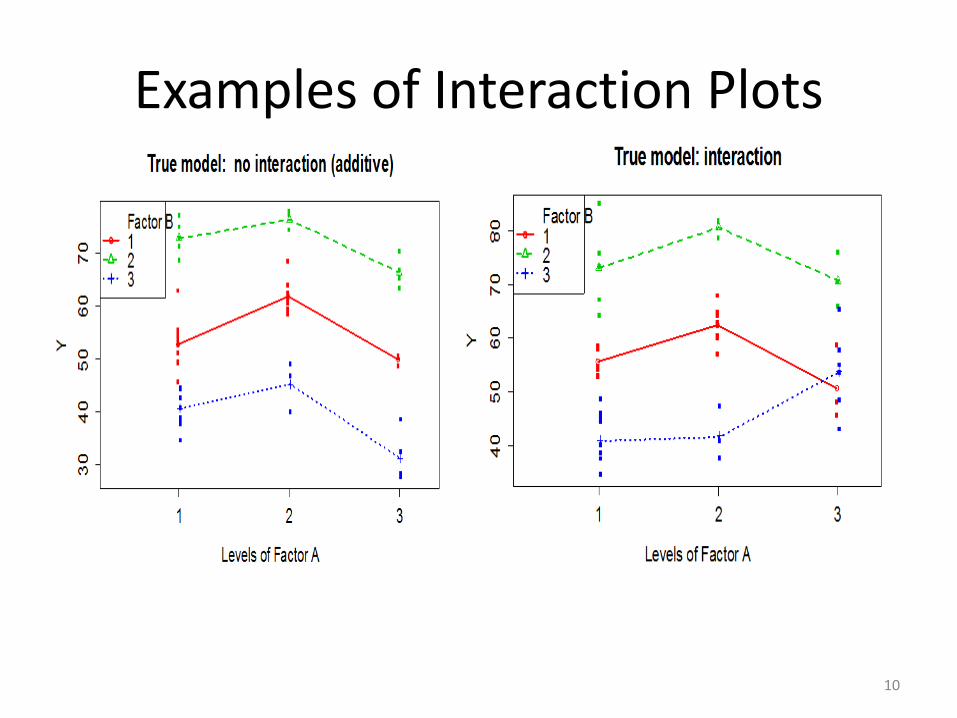
Examples of Interaction Plots
10

Example, cont. : SPSS profile plot
11
placebo 120 mg 250 mg
Ginkgo Dose
30
40
50
60
70
80
90
100
Est
imat
ed M
argi
nal M
eans
Training
placebo
mnemonic
Estimated Marginal Means of Memory Score Difference

Example: rerun ANOVA without interaction
12
Source Type III Sum of Squares df Mean Square F Sig. Corrected Model 41807.074(a) 3 13935.691 3.756 .013
Intercept 250370.370 1 250370.370 67.481 .000
dose 26398.741 2 13199.370 3.558 .032
training 15408.333 1 15408.333 4.153 .044
Error 385866.556 104 3710.255
Total 678044.000 108
Corrected Total 427673.630 107
1. Ginkgo Dose
Dependent Variable: Memory Score Difference
Ginkgo Dose Mean Std. Error
95% Confidence Interval
Lower Bound Upper Bound
placebo 32.500 10.397 11.882 53.118
120 mg 40.972 10.397 20.354 61.590
250 mg 69.500 10.397 48.882 90.118
2. Training
Dependent Variable: Memory Score Difference
Training Mean Std. Eror
95% Confidence Interval
Lower Bound Upper Bound
placebo 35.222 8.489 18.388 52.057
mnemonic 60.093 8.489 43.258 76.927

Example, cont. Additive model profile plot (fitted values):
13
placebo 120 mg 250 mg
Ginkgo Dose
20
30
40
50
60
70
80
90
Est
imat
ed M
arg
inal
Mea
ns
Training
placebo
mnemonic
Estimated Marginal Means of Memory Score Difference

Two-way ANOVA interpretation
14
Which analysis should we use to estimate treatment effects? If the “no interaction” null hypothesis is rejected, use the “with
interaction” model’s ANOVA.
If the “no interaction” null hypothesis is not rejected (“retained”), use the additive model’s ANOVA. (This may be making a false assumption of no interaction. i.e. a type-2 error.)
If the p-value for interaction is significant, do not interpret the “main effects” (dose and training); simply state that both of the explanatory variables affect the outcome in such a way that the effects of each factor depends on the level of the other factor. (Contrasts and the profile plots add more interpretability.)

Two-way ANOVA interpretation
15

Two way ANOVA interpretation When the interaction is not statistically significant interpret each
main effect relative to the null hypothesis of equal means across all levels using language like “ignoring” or “averaging over” or “at each level of” the other factor(s). If a factor’s p-value is statistically significant (≤0.05) and the factor has
just two levels (like training) look at which of the two levels has the higher mean and make a statement like “mnemonic training improves memory at each dosage” or, better, “mnemonic training improves memory by 24.1 points on average at each dosage”. Adding a 95% CI is even better (1.1 to 48.7 point rise).
If a factor’s p-value is statistically significant (≤0.05) and the factor has
more than two levels (like dose), then we reject H0:m1=…=mk. Simply state that the (population) mean of the memory score difference for both training types “varies by dose” or “depends on dose” or “differs for at least two doses” for both levels of training. (With contrast testing we can make more detailed conclusions.)
16

Model checking: Residual Analysis
Quantile normal checks for Normality (robust)
17
Predicted Value for SCORDIFF
9080706050403020
Resid
ual fo
r SCO
RDIFF
200
100
0
-100
-200
Dose/Training
250mg/mnemonic
250mg/placebo
120mg/mnemonic
120mg/placebo
placebo/mnemonic
placebo/placebo
Total Population
Residual vs. fit checks equal spread and need for interaction
Normal Q-Q Plot of Residual for SCORDIFF
Observed Value
2001000-100-200
Expect
ed Nor
mal Va
lue
200
100
0
-100
-200

Three way ANOVA Subjects: infants
Setup: new toy (one per child) introduced along with distracting sounds
Outcome: attention (amount of time till distraction)
Explanatory variables: Age of child (8,10,12 months)
Size of toy (small vs. large)
Color of toy (red vs. yellow vs. transparent)
Color:size interaction (but no three-way interaction):
18

Three way ANOVA, cont.
Three way interaction:
19

Three way ANOVA, cont.
Results:
20
Source
Type III Sum of Squares df Mean Square F Sig.
Corrected Model 25000 8 3125 6.25 0.000
Intercept 4000 1 4000 8.00 0.006
Color 7000 2 3500 7.00 0.002
Size 3000 1 3000 6.00 0.017
Color*Size 5000 2 2500 5.00 0.009 Age 6000 2 3000 6.00 0.004
Error 35000 70 500 Corrected Total 60000 78 769

Summary Multi-way between-subjects ANOVA is used for a
quantitative DV, independent errors and any number of categorical IVs.
With no interactions (additive model) it is assumed that the effect on the DV of any level change in each specific IV is a fixed value unaffected by the level(s) of the other factor(s).
Interactions may be present between any 2 or more IVs (whole variable, not levels!!!) in their effects on the DV. This gives a non-parallel plot and says that for at least some level changes of a specific IV, the effect on the DV depends on (varies with) the level(s) of some other IV(s).
21