360-degree feedback: the influence of ...ii abstract 360-degree feedback: the influence of...
TRANSCRIPT
360-DEGREE FEEDBACK:
THE INFLUENCE OF PERCEPTIONS OF ORGANIZATIONAL
CULTURE ON UPWARD APPRAISAL SYSTEM ATTITUDES
The Institute of Economics and Social Sciences
of
Bilkent University
by
MURAT YALÇIN
In Partial Fulfillment of the requirements for the
of
MASTER OF BUSINESS ADMINISTRATION
in
DEPARTMENT OF MANAGEMENT
BILKENT UNIVERSITY
ANKARA
SEPTEMBER 2003
I certify that I have read this thesis and I have found that it is fully adequate, in scope
and in quality, as a thesis for the degree of Master of Business Administration.
-----------------------------
Prof. A. Ümit Berkman
Thesis Supervisor
I certify that I have read this thesis and I have found that it is fully adequate, in scope
and in quality, as a thesis for the degree of Master of Business Administration.
-----------------------------
Assoc. Prof. D. Nadi Leblebici
Examining Committee Member
I certify that I have read this thesis and I have found that it is fully adequate, in scope
and in quality, as a thesis for the degree of Master of Business Administration.
-----------------------------
Asst. Prof. Levent Akdeniz
Examining Committee Member
Approval of the Institute of Economics and Social Sciences
-----------------------------
Prof. Kürşat Aydoğan
Director
ii
ABSTRACT
360-DEGREE FEEDBACK:
THE INFLUENCE OF PERCEPTIONS OF ORGANIZATIONAL CULTURE ON
UPWARD APPRAISAL SYSTEM ATTITUDES
Yalçın, Murat
M.B.A., Department of Management
Supervisor: Prof. Ümit Berkman
September 2003
At the threshold of the 21st century, organizations have reinterpreted organizational
achievement factors for employees and they have started to emphasize the importance of human
resources more in their organizational activities. Moreover, human resources have become a
global competition element for organizations in their institutional environments. For that reason,
organizations have to manage their human resources in a better way to motivate their employees
and to drive their energy into organizational achievement. It is also necessary and critical to
evaluate properly the performance of employees for various human resource practices such as
promoting, compensating, etc. In other words since organizational achievement can be
considered as a synergic sum of individual efforts, performance appraisal for improvement
purpose is crucial for such an organisation. Ie army organization.
The way that an organization measures and evaluates individual employee performance
will directly effect organizational achievement. Therefore, evaluation results should reflect the
factual evidences about the performance of organizations at the unitary level. To produce
iii
objective appraisal results, it is necessary to combine evaluations of all stakeholders involved in
the process. It is also important to have positive perception of organization wide on the appraisal
methods.
This study discusses 360-degree feedback and upward appraisal systems that provide
supervisors the opportunity to increase their self-awareness. This will also help them to improve
their leadership conducts by having feedback from various sources. The system will also
increase individual commitment of subordinates by giving them chance to express their opinions
about supervisors, and thus, to participate more in the decision making process which is likely
to create a higher level of motivation.
However if organizations try to implement 360-degree feedback or upward appraisal
system without studying the organizational culture, their effort may be futile.
This thesis aims at identifying attitudes toward 360-degrees feedback and upward
appraisal systems. It also tries to provide a general profile of organizational climate for Turkish
Army through perceptions of Army officers.
KEY WORDS: 360-degree feedback, upward appraisal, attitudes, perception, values.
iv
ÖZET
360-DERECE GERİ BESLEME:
ORGANİZASYONDA OLUŞMUŞ DEĞERLERE AİT ALGILARIN, AST
DEĞERLENDİRMESİNE BAKIŞA ETKİSİ
Yalçın, Murat
Yüksek Lisans Tezi, İşletme Fakültesi
Tez Danışmanı: Prof. Dr. Ümit BERKMAN
Eylül 2003
21nci y.y. a girerken organizasyonlar başarı faktörlerini değiştirmişler ve “hedefe giden
yolda her şey mubahtır” anlayışının içi boş söylemlerinden sıyrılarak, dünyanın merkezine
insanı yerleştirmiş ve gerçek başarının,o küçücük dünyanın beyni ile yüreği (duygu ve hisleri)
arasındaki patikanın buluşma noktasında gizli olduğunu anlamışlardır.
Bir de bu organizasyonun içine girdiği ve girebileceği mücadelede 2’nci ye yer yok ise;o
mücadelenin başrol oyuncularına, astları ile olan ilişkilerine ve astların amirlere ait algılarına
önem verebilecek ve bu algıları ortaya koyabilecek bir sistem yaratmak, dolayısıyla
organizasyonun gerçek performansına ulaşması için personeli anlamaya çalışmak, sanırım
TSK’nin üzerinde durması gereken en önemli konulardan biri olsa gerek.
Bu çalışma, değişik kaynaklardan gelen geri beslemelerle liderlere, kendilerini daha iyi
anlama ve geliştirebilme, bunun yanında astlara da söz sahibi olma hakkı vererek,onları motive
etme anlayışına dayanan, “360-derece geri besleme” ve bunun en önemli dalı olan ,”astların
değerlendirmesi” sistemlerini analiz etmektedir.
v
Doğruluğu ispatlanmış veya dünyadaki başarılı şirket ve organizasyonlar tarafından
uygulanan sistemlerin, birçok kurumda başarısız olmasının altında, merkezinde insan olan
organizasyonların matematik kurallarına göre yönetiliyor olması faktörü yatmaktadır. Kendi
içinde ne kadar başarılı olursa olsun, düşünüp araştırılmadan, paket program mantığıyla
uygulanmaya çalışılan sistemlerin başarısız olması çok yüksek bir ihtimaldir.
Bu nedenle, herhangi bir sistemin, uygulanmadan önce organizasyonda oluşmuş değerler
ile uyumu, değişim sancılarını hafifletecek karşılıklı güven ve sağlıklı iletişim gibi ağrı
kesicilerin varlığı yada bizim açımızdan başarı faktörleri ortaya koyulduktan sonra
sistemin,organizasyondaki geleceği hakkında karar verilmelidir.
Bu tez, bu anlayıştan hareketle, TSK”de oluşmuş değerleri, 360-derece performans
değerlendirme sistemine ait algıları ve bu değerlerle algılılar arasındaki ilişkiyi analiz etmeye
çalışmaktadır.
ANAHTAR KELİMELER: 360-derece geri besleme, ast değerlendirmesi, tutum, algı,
değer.
vi
ACKNOWLEDGEMENTS
I would like to express my gratitude to my thesis advisor Prof. Ümit Berkman, to Assoc. Prof.
Doğan Nadi Leblebici.
I would like to express my best regards to Captain Özgür Toy for his invaluable comments and
advices during my study. I would like to thank to Canan Sümer for her assistance in statistical
analysis. I also would like to acknowledge all respondents for their patience.
I would like to thank to my mother for her psychological support, my wife Sema for her
contribution, help and endless trust, and my real friends for everything.

vii
Annem, kardeşim ve eşime
viii
TABLE OF CONTENTS
ABSTRACT . . . . . . . . . . .ii
ÖZET. . . . . . . . . . . .iv
ACKNOWLEDGEMENTS . . . . . . . .vi
TABLE OF CONTENTS . . . . . . . . .vii
LIST OF TABLES. . . . . . . . . . .xii
LIST OF FIGURES. . . . . . . . . .xiii
CHAPTER I INTRODUCTION. . . . . . . . .1
1.1 . PURPOSE OF THE STUDY . . . . . . .1
1.2 . BACKGROUND. . . . . . . . .1
1.3 . PLAN OF THE THESIS . . . . . . .3
CHAPTER II. 360-DEGREE FEEDBACK:LITERATURE REVIEW . .5
2.1. INTRODUCTION . . . . . . . .5
2.2 . HISTORY OF 360-DEGREE FEEDBACK . . . . .6
2.3 . ADOPTING 360-DEGREE FEEDBACK . . . . .8
2.3.1 . Self- awareness . . . . . . . .9
2.3.2 . Organizational culture change . . . . . .10
2.3.3 . Legal protection . . . . . . . .11
2.4. FACTORS INFLUENCING THE ACCEPTABILITY OF
360-DEGREE FEEDBACK . . . . . . . .12
2.4.1. Organizational characteristics . . . . . .13
2.4.1.1. Total quality management culture. . . . .13
2.4.1.2. Organizational cynicism . . . . .14
2.4.2. Rater-ratee relationship characteristics and appraisal context. .15
2.4.2.1. Ratings used for evaluative purposes. . . . .15
2.4.2.2. Anonymity of ratings . . . . . .17
2.4.2.3. Team-based job design. . . . . . .18
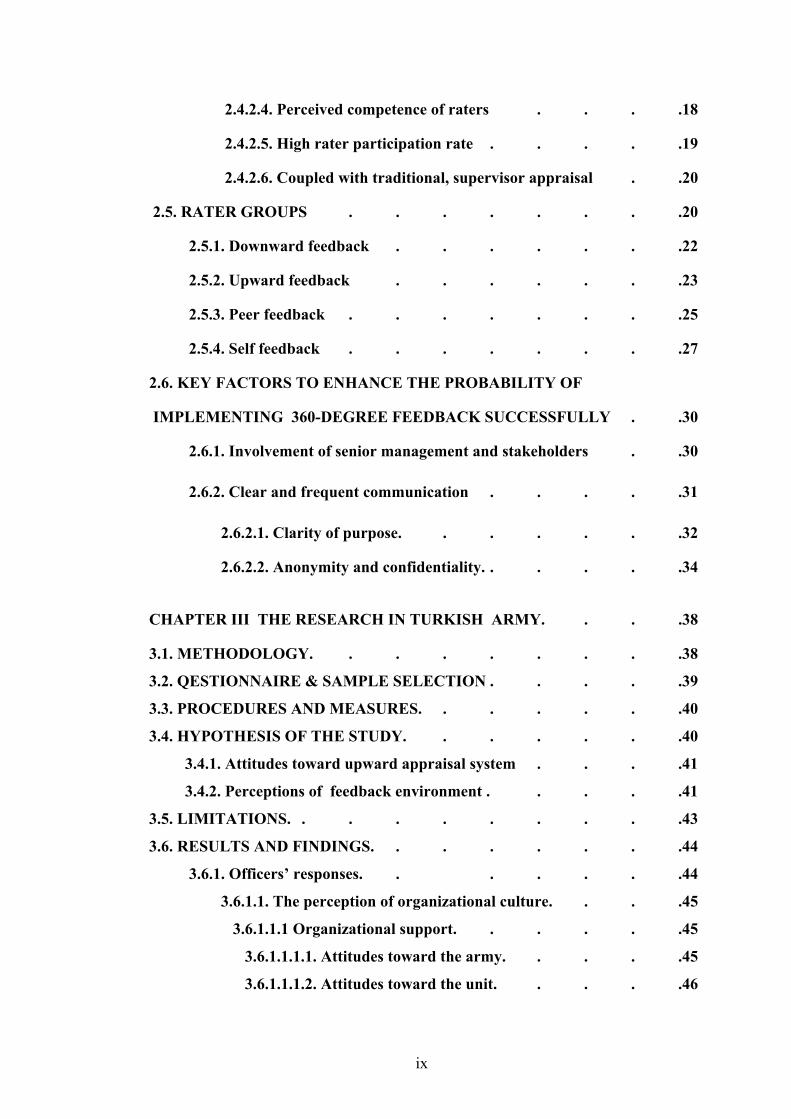
ix
2.4.2.4. Perceived competence of raters . . . .18
2.4.2.5. High rater participation rate . . . . .19
2.4.2.6. Coupled with traditional, supervisor appraisal . .20
2.5. RATER GROUPS . . . . . . . .20
2.5.1. Downward feedback . . . . . . .22
2.5.2. Upward feedback . . . . . . .23
2.5.3. Peer feedback . . . . . . . .25
2.5.4. Self feedback . . . . . . . .27
2.6. KEY FACTORS TO ENHANCE THE PROBABILITY OF
IMPLEMENTING 360-DEGREE FEEDBACK SUCCESSFULLY . .30
2.6.1. Involvement of senior management and stakeholders . .30
2.6.2. Clear and frequent communication . . . . .31
2.6.2.1. Clarity of purpose. . . . . . .32
2.6.2.2. Anonymity and confidentiality. . . . . .34
CHAPTER III THE RESEARCH IN TURKISH ARMY. . . .38
3.1. METHODOLOGY. . . . . . . . .38
3.2. QESTIONNAIRE & SAMPLE SELECTION . . . . .39
3.3. PROCEDURES AND MEASURES. . . . . . .40
3.4. HYPOTHESIS OF THE STUDY. . . . . . .40
3.4.1. Attitudes toward upward appraisal system . . . .41
3.4.2. Perceptions of feedback environment . . . . .41
3.5. LIMITATIONS. . . . . . . . . .43
3.6. RESULTS AND FINDINGS. . . . . . . .44
3.6.1. Officers’ responses. . . . . . .44
3.6.1.1. The perception of organizational culture. . . .45
3.6.1.1.1 Organizational support. . . . . .45
3.6.1.1.1.1. Attitudes toward the army. . . . .45
3.6.1.1.1.2. Attitudes toward the unit. . . . .46
x
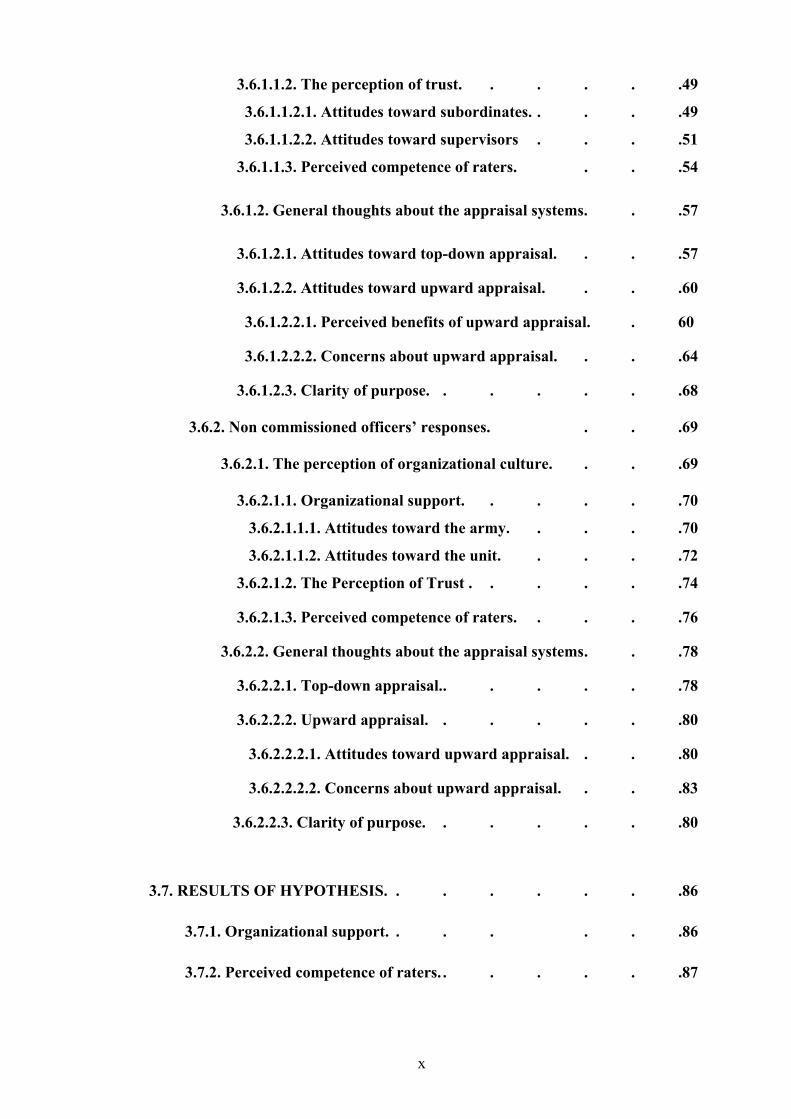
3.6.1.1.2. The perception of trust. . . . . .49
3.6.1.1.2.1. Attitudes toward subordinates. . . . .49
3.6.1.1.2.2. Attitudes toward supervisors . . . .51
3.6.1.1.3. Perceived competence of raters. . . .54
3.6.1.2. General thoughts about the appraisal systems. . .57
3.6.1.2.1. Attitudes toward top-down appraisal. . . .57
3.6.1.2.2. Attitudes toward upward appraisal. . . .60
3.6.1.2.2.1. Perceived benefits of upward appraisal. . 60
3.6.1.2.2.2. Concerns about upward appraisal. . . .64
3.6.1.2.3. Clarity of purpose. . . . . . .68
3.6.2. Non commissioned officers’ responses. . . .69
3.6.2.1. The perception of organizational culture. . . .69
3.6.2.1.1. Organizational support. . . . . .70
3.6.2.1.1.1. Attitudes toward the army. . . . .70
3.6.2.1.1.2. Attitudes toward the unit. . . . .72
3.6.2.1.2. The Perception of Trust . . . . . .74
3.6.2.1.3. Perceived competence of raters. . . . .76
3.6.2.2. General thoughts about the appraisal systems. . .78
3.6.2.2.1. Top-down appraisal.. . . . . .78
3.6.2.2.2. Upward appraisal. . . . . . .80
3.6.2.2.2.1. Attitudes toward upward appraisal. . . .80
3.6.2.2.2.2. Concerns about upward appraisal. . . .83
3.6.2.2.3. Clarity of purpose. . . . . . .80
3.7. RESULTS OF HYPOTHESIS. . . . . . . .86
3.7.1. Organizational support. . . . . . .86
3.7.2. Perceived competence of raters. . . . . . .87
xi
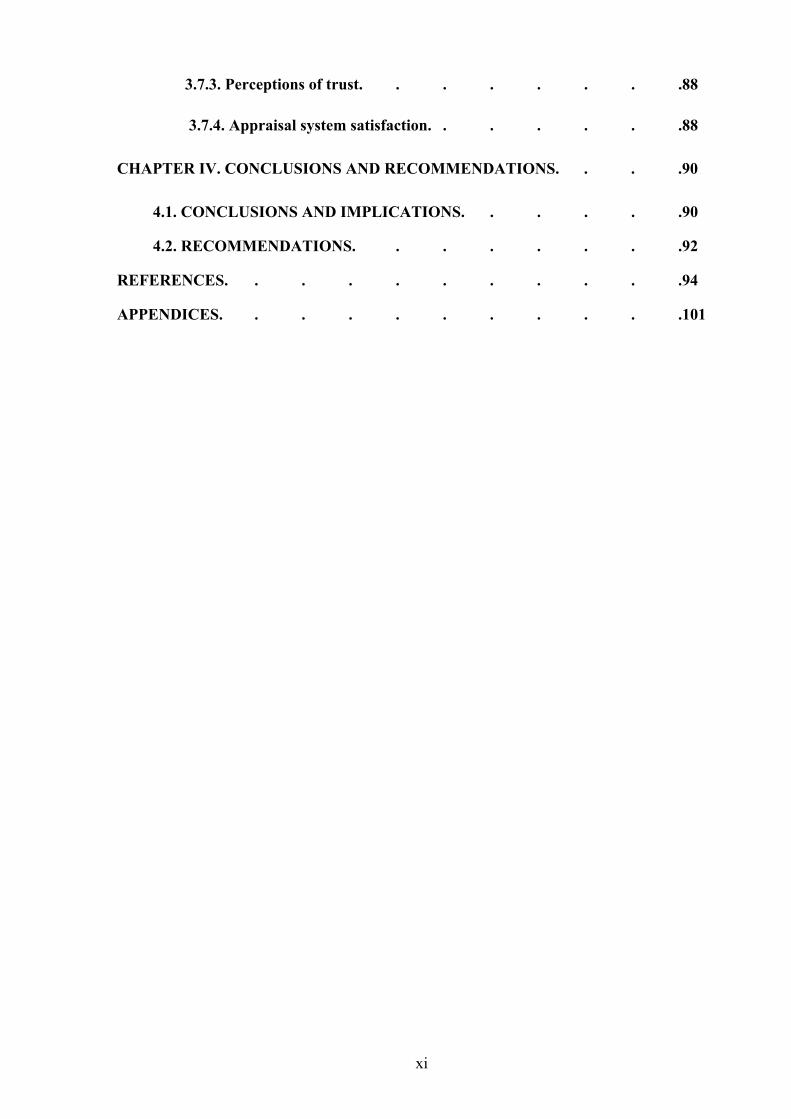
3.7.3. Perceptions of trust. . . . . . . .88
3.7.4. Appraisal system satisfaction. . . . . . .88
CHAPTER IV. CONCLUSIONS AND RECOMMENDATIONS. . . .90
4.1. CONCLUSIONS AND IMPLICATIONS. . . . . .90
4.2. RECOMMENDATIONS. . . . . . . .92
REFERENCES. . . . . . . . . . .94
APPENDICES. . . . . . . . . . .101
xii
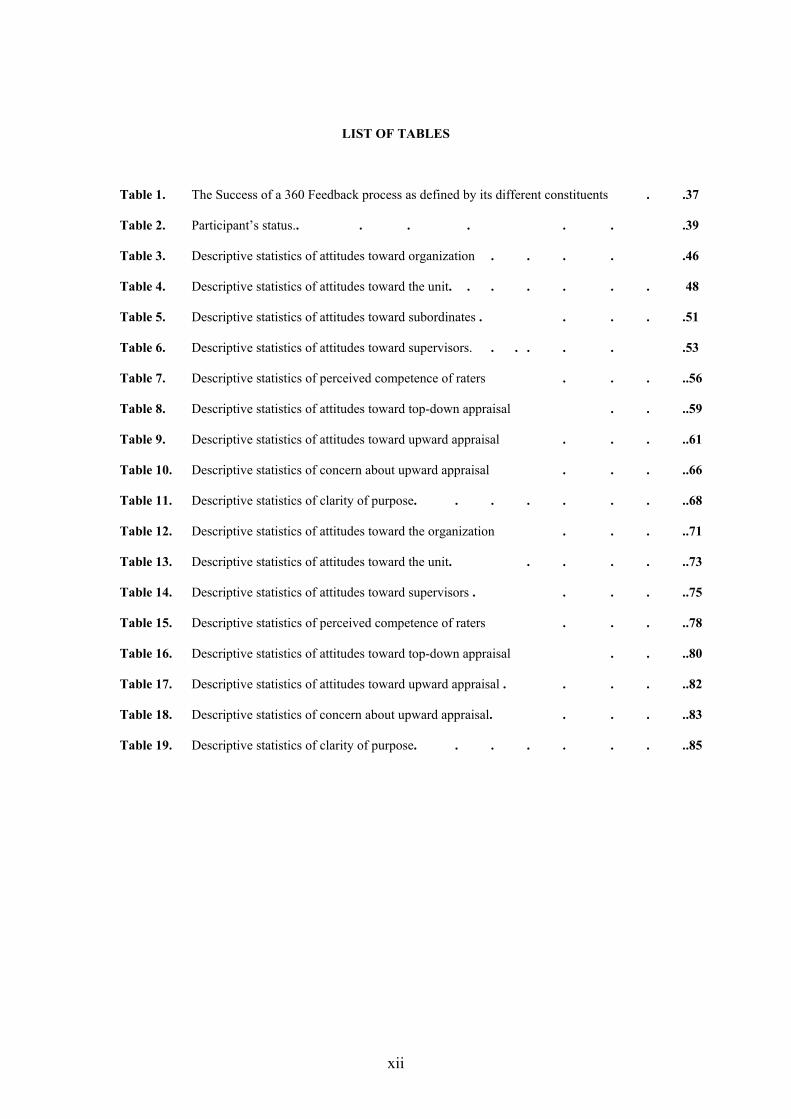
LIST OF TABLES
Table 1. The Success of a 360 Feedback process as defined by its different constituents . .37
Table 2. Participant’s status.. . . . . . .39
Table 3. Descriptive statistics of attitudes toward organization . . . . .46
Table 4. Descriptive statistics of attitudes toward the unit. . . . . . . 48
Table 5. Descriptive statistics of attitudes toward subordinates . . . . .51
Table 6. Descriptive statistics of attitudes toward supervisors. . . . . . .53
Table 7. Descriptive statistics of perceived competence of raters . . . ..56
Table 8. Descriptive statistics of attitudes toward top-down appraisal . . ..59
Table 9. Descriptive statistics of attitudes toward upward appraisal . . . ..61
Table 10. Descriptive statistics of concern about upward appraisal . . . ..66
Table 11. Descriptive statistics of clarity of purpose. . . . . . . ..68
Table 12. Descriptive statistics of attitudes toward the organization . . . ..71
Table 13. Descriptive statistics of attitudes toward the unit. . . . . ..73
Table 14. Descriptive statistics of attitudes toward supervisors . . . . ..75
Table 15. Descriptive statistics of perceived competence of raters . . . ..78
Table 16. Descriptive statistics of attitudes toward top-down appraisal . . ..80
Table 17. Descriptive statistics of attitudes toward upward appraisal . . . . ..82
Table 18. Descriptive statistics of concern about upward appraisal. . . . ..83
Table 19. Descriptive statistics of clarity of purpose. . . . . . . ..85
xiii
LIST OF FIGURES
Figure 1. Organizational Culture Pulling 360-degree feedback along. . . .14
Figure 2. Rater groups. . . . . . . . .20
Figure 3. A model of self-perception accuracy. . . . . . .29
Figure 4. The histogram of attitudes toward organization . . . .. 45
Figure 5. The histogram of attitudes toward the unit. . . . . .47
Figure 6. The histogram of attitudes toward subordinates . . . .50
Figure 7. The histogram of attitudes toward supervisors . . . .52
Figure 8. The histogram of attitudes toward supervisors’ criticism . . . .53
Figure 9. The histogram of attitudes toward upward appraisal . . . . .54
Figure 10. The histogram of perceived competence of raters. . . . .55
Figure 11. The histogram of attitudes toward top-down appraisal . . .58
Figure 12. The histogram of attitudes toward top-down appraisal. . . .59
Figure 13. The histogram of attitudes toward upward appraisal . . . .61
Figure 14. The histogram of attitudes toward upward vs. top-down appraisal . .63
Figure 15. The histogram of attitudes toward anonymous/identified upward appraisal. .63
Figure 16. The histogram of concern about upward appraisal . . . .65
Figure 17. The histogram of concern about authority. . . . . .67
Figure 18. Upward appraisal for developmental purposes . . . . 68
Figure 19. Upward appraisal for administrative purposes. . . . .68
Figure 20. The histogram of concern about upward appraisal . . . .70
Figure 22. The histogram of attitudes toward supervisors .. . . .75
Figure 23. The histogram of perceived competence of raters . . . .77
Figure 24. The histogram of attitudes toward top-down appraisal . . . . 79
Figure 25. The histogram of attitudes toward upward appraisal . . . .81
Figure 26. The histogram of concern about upward appraisal. . 83
1
CHAPTER I
INTRODUCTION
1.4 PURPOSE OF THE STUDY
The purpose of this study is to examine the relationship between 360-degree feedback as
an appraisal method and organizational culture, to search for the applicability of upward
appraisal, which is the most important part of 360-degree feedback, within the organizational
culture of Turkish Armed Forces.
1.5 BACKGROUND
The performance appraisal method of 360-degree feedback – known also as multi-rater
valuation, multi-source assessment (Mandy et all, 2002; 288) or 360-degree appraisal (Dessler
2003; 260), has gained importance in recent years for organizations trying to expand feedback
communication channels.
A 360-degree appraisal system provides opportunity to organizational members to
receive feedback about their performance, from all the major constituencies they serve.
Unlike the traditional (top-down) approach to performance appraisal, the 360-degree feedback
concept does not only rely on the supervisors as the unique source of information. Instead, it
involves evaluations of superiors, peers, subordinates, and thus it provides individuals
feedback about different aspects of their performance. Ratees (feedback recipients) can also
rate their own performance and compare it with feedback provided by others (Jai Ghorpade,
2000). Contrary to traditional top-down appraisal approach which focuses primarily on
2
performance appraisal, 360-degree feedback system is used primarily for developing an
individual’s skills and competencies.
The development and assessment of future officer leadership style in Turkish Army will
more likely to be one of the most important challenges for Turkish Army in the 21st Century.
Officer evaluation system for Armed Forces should have some unique and supplementary
specialties to provide early and continuous feedback in a structured manner to make sure that
officers have the necessary information to develop their attributes, skills, and values required
for career progress.
Number of officers in the near future will decrease, and they will have to deal with
greater challenges due to a more complex operational environment, increased sophistication
of weapon systems, smarter and more complex war equipments. Also institutional
environment requires them to act with legal and moral standards. “Army leaders must set high
standards, lead by example, do what is legally and morally right, and influence other people to
do the same. They must establish and sustain a climate that ensures people are treated with
dignity and respect and create an environment in which people are challenged and motivated
to be all they can be.”(Antonioni, 1996).
The officer evaluation system of the 21st century must address these challenges. At
least, system is expected to contribute to the development of leadership competencies required
to handle these new challenges in the Armed Forces.
One of the main reasons for implementing a 360-degree feedback system is to provide
the individual with feedback so that he can improve his or her performance in the future. The
current evaluation (top-down) system in Turkish Army provides the officer with feedback
from, at most, three different levels at hierarchy: The first is normally the officer’s immediate
3
superior, the second is a senior rater, and the third one is officer’s senior rater’s immediate
superior. There is no formal and structured feedback from any other hierarchy level.
The thesis examines the topic of 360-degree feedback. The objective is to explain the
merits of 360-degree feedback ,to discuss specific nuances of its relevance in Turkish Armed
Forces and to analyze the connection between the reactions of supervisors and subordinates to
upward appraisal which is the most important and effective part of 360-degree feedback and
organizational culture.
This study is important because supervisors’ and subordinates’ reactions to upward
feedback can have a significant impact on the success of 360-degree appraisal method. Since
360-degree or upward feedback systems are generally used for developmental purposes, it
should be ensured that individuals have a positive perception about this appraisal system so
that they utilize feedbacks for their own developmental purposes. Therefore, it is critical to
understand factors that may increase the positive perception of supervisors and subordinates
about the appraisal system. If they accept and value the feedback, they may tend to use it for
developmental purpose, and thus goals of 360-degree feedback and upward appraisal systems
could better be achieved.
1.6 PLAN OF THE THESIS
In the first chapter, the purpose of this study is elaborated. Peculiarities of 360-degree
feedback system which are superior to current evaluation system in armed forces and the
reasons for the need of such kind of feedback system are discussed.
4
In the second chapter, the definition and the history of 360-degree feedback system are
explained. The motives for organizations to adopt this system and factors influencing the
acceptability of 360-degree feedback system are elucidated in detail.
In the third chapter, the methodology used in this study is explicated. Sample selection
and data collection process in an empirical study conducted in the Turkish Army are
presented with sample characteristics and problems faced with respectively. Then, the
findings of the empirical study are presented & interpreted.
Finally, in conclusion and recommendation, cultural aspects of upward feedback are
discussed and certain recommendations are developed for the successful application of the
system in Turkish Army.
5
CHAPTER II
360-DEGREE FEEDBACK
2.1 INTRODUCTION
Performance appraisal in organizations has been used primarily for supervisor’s
evaluation of subordinate performance. Recently, a lot of organizations have begun to
recognize the potential benefits of gathering performance feedback from, not only the
supervisors but also peers and subordinates as sources. These benefits may include; better
performance information, more reliable ratings than from a single supervisor, and improved
leader performance after receiving feedback (Atwater, Roush, & Fischthal, 1995).
Because of these potential benefits, organizations, with increasing number, have been
implementing 360-degree feedback system or upward appraisal as a beginning. (London &
Beatty, 1993).This system may include feedback from peers, subordinates, self, supervisors,
higher level managers, or customers, and contain feedback from many of these sources, not all
of them at the same time. Companies, spent an estimated 152 million dollars on 360-degree
feedback system development in 1992, may be an evidence of the increasing popularity of
360-degree feedback systems (Romano, 1994).
6
This chapter presents an in-depth literature review and discussion of 360-degree
feedback. It also introduces many of the key attributes required to implement a 360-degree
feedback system successfully, such as the proper training of participants, establishing clarity
of purpose, and designing well constructed procedures for soliciting feedback. Additionally,
this chapter presents a brief overview of the history of 360-degree feedback.
2.4 HISTORY OF 360-DEGREE FEEDBACK
Individuals getting feedback on their behavior and productivity is not new. Initially this
feedback was coming from the individual’s supervisor or the owner of the organization.
Descriptions of working environment indicate that feedback historically focused on levels of
productivity and was only provided by the boss (Lepsinger & Lucia, 1997). Working directly
next to their subordinates, superiors were able to provide continuing feedback when things
were not going well. However, organizational and human resource management trends of the
1950s and 1960s gradually widened both the content of feedback that people received and the
way in which it was given (Lepsinger & Lucia, 1997).
The first trend that leads to the coming of 360-degree feedback was the result of new
research on employee behavior. Studies showed that employee motivation and job satisfaction
increased when people received timely, fair, and accurate information related to their
performance (Lepsinger & Lucia, 1997). Thus, organizations gradually transitioned away
from the traditional (superior–subordinate) evaluation system to a more comprehensive
approach of providing feedback, characterized by 360-degree feedback system methodology.
The second trend is to avoid negative impact of the lack of feedback from both
customers and employees and to improve communication channels of organizations. As
7
organizations attempted to succeed in an increasingly competitive environment and meet the
expectations of a better informed, more demanding, more training customers, these
weaknesses (lack of feedback) made it difficult to take advantage of new opportunities and
respond quickly to changes in the market place (Lepsinger & Lucia, 1997). Therefore, many
organizations began shifting from traditional hierarchical structures to flatter corporate
designs that required communication and teamwork across organizational boundaries and
empowered people at lower levels of organization to make their own decision.
As a result of this transition, managers at all levels of the organization experienced
increased levels of interdependence and had more people reporting (feedback) to them than
ever before. In the face of these circumstances, managers did not have to provide feedback to
subordinates who they had little or no experience observing. In many cases, managers were
forced to evaluate employees with whom they had no direct contact. Thus, traditional forms
of downward feedback provided less than useful information to those individuals being
evaluated (Lepsinger and Lucia, 1997).
Consequently, 360-degree feedback provided a solution to this dilemma by affording
managers and employees with different sources of information. For the first time, other
individuals within the organization, such as subordinates and peers, were given opportunity to
provide feedback to co-workers or supervisors on behaviors that were not readily apparent to
the manager or direct supervisor. Thus, managers or supervisors were provided with a
complete portrait of their behavior.
As a result of this working environment changes, 360-degree feedback has become a
popular technique in today’s organizations (Tornow & London, 1998). Getting information
from many different individuals provides a complete portrait of behavior and performance
8
on the job.” One that looks at people from every angle and perspective, in their roles
as direct reports, team members, managers of both internal and external relationships, and
source of knowledge and expertise” (Lepsinger & Lucia, 1997).
The evolution and growth of 360-degree feedback is attributable to the efforts of the
Center for Creative Leadership (CCL) (Edwards & Ewen, 1996). Their studies have
dramatically advanced the practice and methodology of 360-degree feedback. One significant
CCL study opened the door to organizational acceptance of multi-source feedback by
concluding that;
• Feedback is an important tool to a person’s personal and professional growth,
• Most effective managers are learners and make everything into a learning experience,
• Despite their desire to learn and improve, most managers operate in feedback-poor
environments (Lepsinger & Lucia, 1997).
It may be concluded that the trend toward flatter and open system organizations making
it more urgent for employees to communicate and perform effectively, and organizations
gradually focus their attentions to 360-degree feedback as a means to increase organizational
effectiveness (Lepsinger & Lucia, 1997).
2.5 ADOPTING 360-DEGREE FEEDBACK
As explained above, a number of organizations have begun to recognize the potential
benefits of gathering performance feedback from different sources other than supervisor such
as peers and subordinates and customers. These benefits may include; increased self-
awareness, better performance information (Mohrman, Resnick-West, & Lawlet, 1989), more
reliable ratings than those from a single supervisor (Wohlers & London, 1989), support for
high involvement styles of management (Budman & Rice, 1994; McGarvey & Smith, 1993),
9
and improved leader performance after receiving feedback (Atwater, Roush, &
Fischthal, 1995).
Feedback from multiple sources may reinforce and support the feedback provided from
the supervisor, thus making it harder to discount negative feedback as just one (perhaps
biased) person’s viewpoint (Waldman & Atwater, 2002).
2.5.1 SELF- AWARENESS
The role of 360-degree feedback is to give opportunity to leaders to compare their own
views of themselves with views that others have about them. “This comparison has the
potential for leading them through an “unfreezing” process, where leaders are motivated to
rethink their behavior and its impact to others” (McCauley & Moxley,1996).
The most obvious goals of 360-degree feedback are to increase the accuracy of self-
perception and to give individuals information about how others perceive their behavior. This
awareness can inform the leader about the need for behavior change. If the leader never
receives feedback, the self-perception may remain inaccurate and uninformed, and thus the
leader does not make necessary behavior changes.
A lot of researches suggest that people do not evaluate themselves accurately-or at least
not in line with how others view them. Studies have documented that self-ratings of behavior,
personality, and other job performance categories suffer from unreliability and bias, generally
susceptive and inaccurate when compared with ratings provided by others objective measures
(Waldman,1998). Generally, the self-perception of people has reflected positive biases.
There are two reasons that are why self-perception is inaccurate;
10
• Lack of information; most individuals do not enjoy giving others
negative feedback. As a result, most people receive less negative feedback than is
realistic. This provides a tendency for individuals to see themselves in an
unrealistically positive manner.
• Individuals’ tendency to discount or rationalize negative feedback.
Positive feedback is accepted easily as accurate and informational than negative
feedback (Antonioni, 1996).
However, some researchers have found that managers have a tendency to change when
they have received negative feedback. When negative information comes in the form of
anonymous feedback from a number of individuals (multiple sources) about specific
behaviors, it is more difficult to discount or deny and therefore may more likely to be
accepted (Waldman,1998).
For example, Atwater (1995) investigated changes in self-ratings following feedback
and found that those who were over-raters (rated themselves high relative to their
subordinates) lowered their self-ratings following feedback, while those who were under –
raters raised their self ratings. They suggested that this was evidence that the feedback process
impacts self-awareness as well as performance.
Of course, others’ evaluations are not always accurate, but others’ ratings of
performance tend to be related closer to objective criteria than a person’s own ratings do.
2.5.2 ORGANIZATIONAL CULTURE CHANGE
Many companies have introduced 360-degree feedback or upward appraisal for the
beginning as a step toward a more participative and empowering organizational culture.
Asking subordinates to provide feedback to their supervisors implies that the organization
11
believes that the subordinates have valuable information to contribute. It also gives
message to supervisors that the organization gives importance to how they manage people.
Not only getting results, but also how supervisors get those results are important. Besides,
suggesting to supervisors that they should be accountable to their subordinates can be a very
new concept in some organizations in which traditional (top-down), hierarchical management
has been the approved system (Waldman,1998).
Discussion of expectations and conversation created by the 360-degree feedback process
also creates opportunities for sharing and clarifying the organization’s values. Individuals
question why they have particular expectations and why they have attitudes in particular ways
(Waldman,1998). This process of questioning clarify individuals’ beliefs and values, which
may not align with those of the organization’s culture.
Upward appraisal can also give subordinates a sense of participation in the evaluation
system and increase their feelings of importance to the organization (Cotton, 1993). Ideally,
feedback from subordinates would help managers do their jobs better, increase productivity of
the work unit, and add an important dimension to the performance appraisal system. There is
also evidence that subordinate evaluations can be an effective motivators of behavioral
change (Denisi, Randolph,& Blencoe, 1982). This may be due to the credibility of
subordinates’ opinions.
2.5.3 LEGAL PROTECTION
When appraisals, feedback or decisions are based on a single-source, the organization
may find itself in the position of defending the judgement of a single person. One person
(supervisor), no matter how fair, may be subjected to claims of bias. On the other hand 360-
degree feedback offers stronger legal protection because the model combines multiple
perspectives (Edwards, 1996). When an individual is rated by multiple sources independently,
12
the probability of all people sharing the same bias is very low. In addition, a formalized 360-
degree feedback process may offer substantial safeguards by demonstrating fairness process
to individuals.
2.4. FACTORS INFLUENCING THE ACCEPTABILITY OF 360-DEGREE
FEEDBACK
The issue of acceptability has generally been overlooked in the design and
implementation of appraisal processes. Acceptability should be more important than technical
accuracy issues for managers practicing 360-degree performance appraisal systems. As
compared to traditional, top-down appraisal, acceptability takes more importance for 360-
degree feedback. Acceptability is desirable but not absolutely essential for implementing
traditional appraisal systems. That is, even in the absence of acceptability, other factors help
ensure that the two groups in traditional appraisal actually do participate (Waldman & Bowen,
1998).
There are two reasons which increase the importance of understanding the acceptability
factors of 360-degree feedback. First, it is still relatively new and potentially threatening for
existing system. Second, resistance to change is more likely to be strong. Another problem
associated with 360-degree feedback is the paradox that anonymity makes acceptance critical
because it is difficult to follow who has provided such appraisals, and who has not. If raters
do not accept the process, there simply will be no 360-degree feedback (Waldman &
Bowen,1998).
Superiors should contemplate such factors, -mentioned above superficially -carefully
before they design and implement 360- degree feedback systems if they hope to realize many
positive profits that can come from this new appraisal approach—if and only if it is accepted.
13
The evidence about the acceptability of 360-degree feedback to organizational members
with few exceptions is still limited ( Auteri, 1994; Bernardinet., 1993). There is not any
accepted form for 360-degree feedback. In this part of the thesis, the factors that are likely to
affect the acceptability of multi-source feedback for both raters and ratees are suggested to be
taken into account. However, the evidence is limited to contextual factors rather than personal
or psychological issues.
2.4.1. ORGANIZATIONAL CHARACTERISTICS
2.4.1.1. TOTAL QUALITY MANAGAMENT (TQM) CULTURE
The connection between a Total Quality Management culture and 360-degree feedback
processes is apparent. For instance, TQM stresses the development of leadership and as
explained above, individuals best develop leadership qualities through the type of self-
awareness that 360-degree feedback, especially upward feedback, can provide (Waldman,
1998).
Acceptance should be strong in organizations with a TQM culture, since such a culture
emphasizes openness of communication, trust, lack of cynicism (or organizational support)
and change efforts (Waldman & Bowen, 1998). Blackburn and Rosen (1993) reported that
“firms with a strong TQM orientation tended to use 360-degree appraisals more than those
with a weaker TQM orientation”.
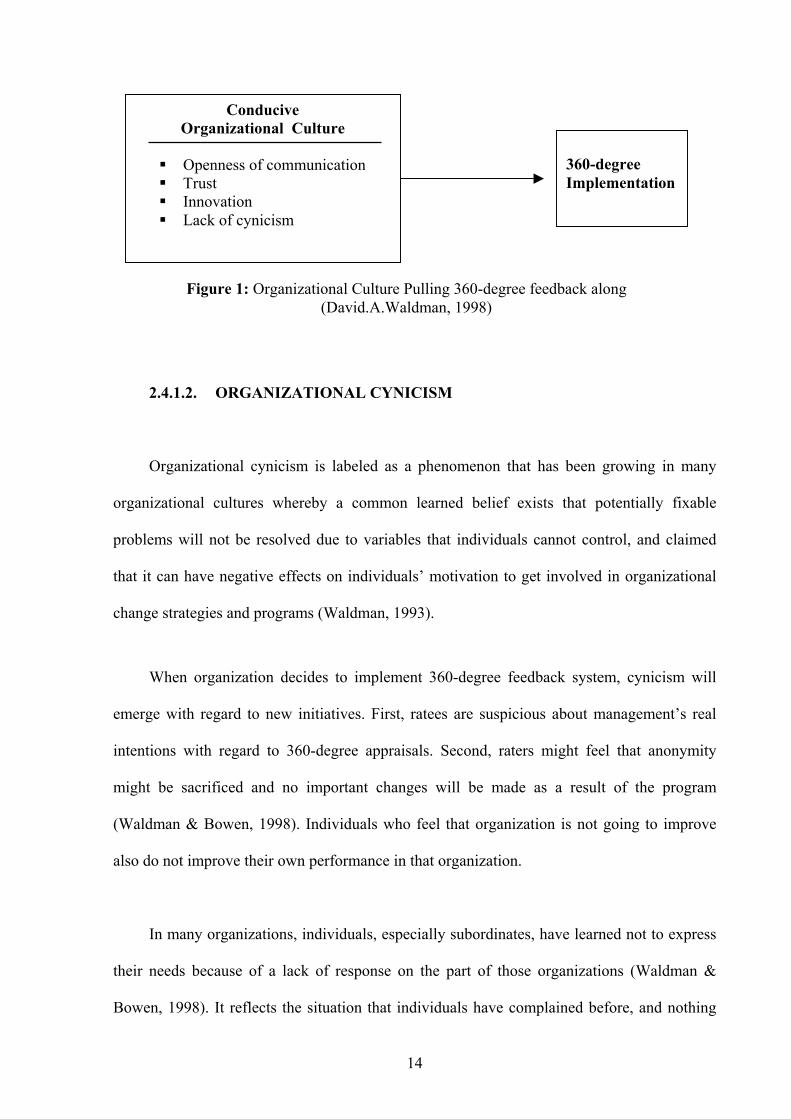
As figure 1 shows, acceptance becomes a relatively smooth, easy process since 360-
degree feedback fits in efficiently with the existing culture.
14
2.4.1.2. ORGANIZATIONAL CYNICISM
Organizational cynicism is labeled as a phenomenon that has been growing in many
organizational cultures whereby a common learned belief exists that potentially fixable
problems will not be resolved due to variables that individuals cannot control, and claimed
that it can have negative effects on individuals’ motivation to get involved in organizational
change strategies and programs (Waldman, 1993).
When organization decides to implement 360-degree feedback system, cynicism will
emerge with regard to new initiatives. First, ratees are suspicious about management’s real
intentions with regard to 360-degree appraisals. Second, raters might feel that anonymity
might be sacrificed and no important changes will be made as a result of the program
(Waldman & Bowen, 1998). Individuals who feel that organization is not going to improve
also do not improve their own performance in that organization.
In many organizations, individuals, especially subordinates, have learned not to express
their needs because of a lack of response on the part of those organizations (Waldman &
Bowen, 1998). It reflects the situation that individuals have complained before, and nothing
ConduciveOrganizational Culture
Openness of communication Trust Innovation Lack of cynicism
360-degreeImplementation
Figure 1: Organizational Culture Pulling 360-degree feedback along(David.A.Waldman, 1998)
15
has changed. This creates the “silent majority” of dissatisfied individuals (Hart, Heskett, &
Sasser, 1990). These individuals are cynical about any new attempts to get their appraisal.
2.4.2. RATER-RATEE RELATIONSHIP CHARACTERISTICS AND
APPRAISAL CONTEXT
The acceptability of 360-degree feedback is also strongly related to characteristics of
ratee-rater relationships and the appraisal context. Justice and fairness provide a useful
framework for understanding acceptability issues in the 360-degree appraisal context (Barclay
and Harland, 1995). Justice refers to the perceived fairness of the means and tools used to
determine outcomes, such as performance appraisal ratings. In essence, this framework would
suggest that individuals find appraisal procedures fairer when certain procedural conditions
are adhered to. (Lind, MacCoun, Ebener, Felstiner, Hensler, Resnik, & Tyler, 1990). So
fairness may lead to acceptance of the process and its implementation.
Conditions that could increase the acceptance of 360 degree appraisals are outlined
below.
2.4.2.1. RATINGS USED FOR EVALUATIVE PURPOSES
For what purposes should performance evaluations be used are important controversies
taking place today. It revolves around the questions, should 360- degree feedback be used
only for development or should it also be used for administrative purposes such as deciding
who gets raises and promotions1?
This controversy is perhaps even more evident for 360 degree feedback, as opposed to
traditional appraisal system (Waldman & Bowen,1998). Evaluation implies that the feedback
could be used for either positive or negative personnel decision-making (e.g., promotion or
1 Center for Creative Leadership, 1997 ‘should 360-degree feedback be used only for developmental purposes?’
16
dismissal). Development implies that the feedback is used solely for making ratees aware of
how their actions and results are being perceived in the eyes of constituents.
Several studies of peer and subordinate appraisals suggest that recipients, have a strong
preference for development rather than evaluation. In other words, coworkers prefer that
ratings from their peers be used only for developmental purposes (Farh, Cannella, & Bedeian,
1991; McEvoy & Buller, 1987); also, supervisors prefer that subordinate ratings be used in a
similar manner (Antonioni, 1994). Although little evidence is available, it is expected that
most subordinates would prefer that upward appraisals should be used for evaluative
purposes, if they could be kept anonymous.
However, an increasing number of firms move in the direction of making 360-degree
feedback processes more evaluative in nature (London & Smither, 1995). In the upward
feedback pilot project, one of the authors asked subordinates supplying ratings whether those
ratings would have been higher, lower, or about the same if those ratings were directly linked
into their supervisors’ appraisal system. Most respondents indicated that their ratings would
have either been higher or lower. The implication is that while participation would still be
high, acceptability would still be low because of biased ratings—that is, acceptability may be
compromised by moving too quickly toward evaluation (Waldman & Bowen,1998).
It is suggested that implementing evaluative process gradually may result in a high
degree of acceptability (Brotherton, 1996).
17
2.4.2.2. ANONYMITY OF RATINGS
In traditional top-down appraisal system, anonymity is not an issue. A written appraisal
is made by one’s supervisor which is shown to the subordinate (four out of all items shown in
the army) and then filed in personnel records. For two reasons this is not the situation with
360-degree feedback.
First, in the case of upward appraisals, the subordinates are at lower organizational
levels, as compared to the ratees of such appraisals. This situation necessitates that 360-degree
feedback be collected anonymously, or at least confidentially, to protect the subordinates who
provide feedback (Antonioni, 1994; Smither, Millsap, & Salvemini, 1995).
Second, even in the case of peer appraisal, individuals may fear repercussions if their
feedback can be personally identified. That is, cooperation could be disrupted. Even with
assurances of anonymity or confidentiality, raters may fear that attempts will be made to
uncover their identity. For example, subordinates may fear that supervisors will try to
determine from feedback reports which of their subordinates provided low appraisals. In
briefly, despite assurances of anonymity or confidentiality, raters may not be convinced that
their feedback will remain secret, so it may be slow to accept the process or use it as intended
(Waldman & Bowen,1998).
On the other hand, supervisors may refuse to follow up on the feedback received if
raters are not identified. Supervisors may fear that upward appraisals and feedback will
simply provide a vehicle for subordinates to “blow off steam” if they cannot be identified. In
other words, they will not be able to obtain more specific information and suggestions for
improvement.
18
2.4.2.3. TEAM-BASED JOB DESIGN.
Since coworkers are at the same organizational level within the same group, this makes
them more likely to have closer interpersonal relationships and to be in direct competition for
organizational rewards. So they may not be comfortable with the opinion of formally
appraising each other. (Barclay & Harland, 1995).
The acceptability of peer feedback is more likely to be highest when the group’s tasks
and activities are highly interrelated and the group is operating in teamwork to solve problems
and improve performance. (Waldman, 1995). From the rater’s perspective, interrelated nature
of the work situation would provide much opportunity to observe the cooperativeness and
helpfulness of coworkers, thus making the rating process seem more appropriate and fair.
Likewise, the ratee would be more likely to see the rating process as fair since
cooperativeness and helpfulness will increase when work settings are team-based (Waldman
& Bowen,1998).
2.4.2.4. PERCEIVED COMPETENCE OF RATERS
A worry on the part of supervisors is that raters being asked to provide appraisals may
not be competent enough to do so, and any ratings provided would be perceived as unfair and
likely biased. A lack of competence is associated with two issues;
1. The supervisors may worry that raters are not familiar enough with their work. For
example, they may not understand other work-related pressures facing the supervisors.
Also, supervisors may feel that certain subordinates, peers, do not observe their
performance frequently enough to act as competent raters.
19
2. Supervisors are less likely to accept ratings from subordinates or peers who they
perceive are either not able to adequately perform the rating task and are not willing to
do so. Either way bias results (Waldman & Bowen,1998).
Bias can take two forms. Unintentional bias results from a lack of either rating ability or
unfamiliarity with the supervisor’s job. Intentional bias involves the purposeful inflation or
deflation of ratings of a supervisor by the subordinates or peers being solicited, (Barclay &
Harland 1995).
Upward feedback provide a good example of how ratees (or supervisors) could fear bias
thus, supervisors do not accept of the rating process. Supervisors may not trust the rating or
feedback abilities of subordinates who themselves are not accustomed to performing such
tasks. Moreover, subordinates can most effectively provide feedback on issues most relevant
to them e.g., the supervisor’s leadership skills and behaviors. Other issues may not be as
familiar to subordinates e.g., the extent to which the supervisor achieves operational goals. If
rated though, the process could be discredited in the eyes of supervisors (Bernardin , Dahmus,
& Redmon, 1993). Supervisors also fear intentional bias. They worry that subordinates may
use the upward appraisal process as a means of intentional retribution toward them.
2.4.2.5. HIGH RATER PARTICIPATION RATE
Supervisor acceptance of 360-degree feedback should be enhanced if the participation
rate on the part of raters is high. Also, cumulative feedback from various raters (subordinates,
peers, immediate supervisor) will tend to be seen as valid. It is proposed that 360-degree
feedback will be most accepted if data are received not only from multiple subordinates or
peers individually, but also from all of these rater groups or types at the same time (Waldman
& Bowen, 1998).
20
2.4.2.6. COUPLED WİTH TRADITIONAL, SUPERVISOR APPRAISAL
Related to the above discussion, 360-degree appraisals should be more readily accepted
when coupled with traditional supervisory appraisals, e.g. in an upward appraisal process,
supervisors became more positive toward subordinate appraisals when appraisals were
simultaneously received from superiors of those individuals. Presumably, supervisors believe
that subordinate appraisals can be interpreted best when balanced with input from superiors.
For example, subordinates may feel that they have not been receiving enough training and
development activities. The superior could provide counterbalancing input suggesting that
this was not the fault of the supervisor; rather, operational pressures were being placed on the
supervisor by higher levels of management ( Bernardin ,1993).
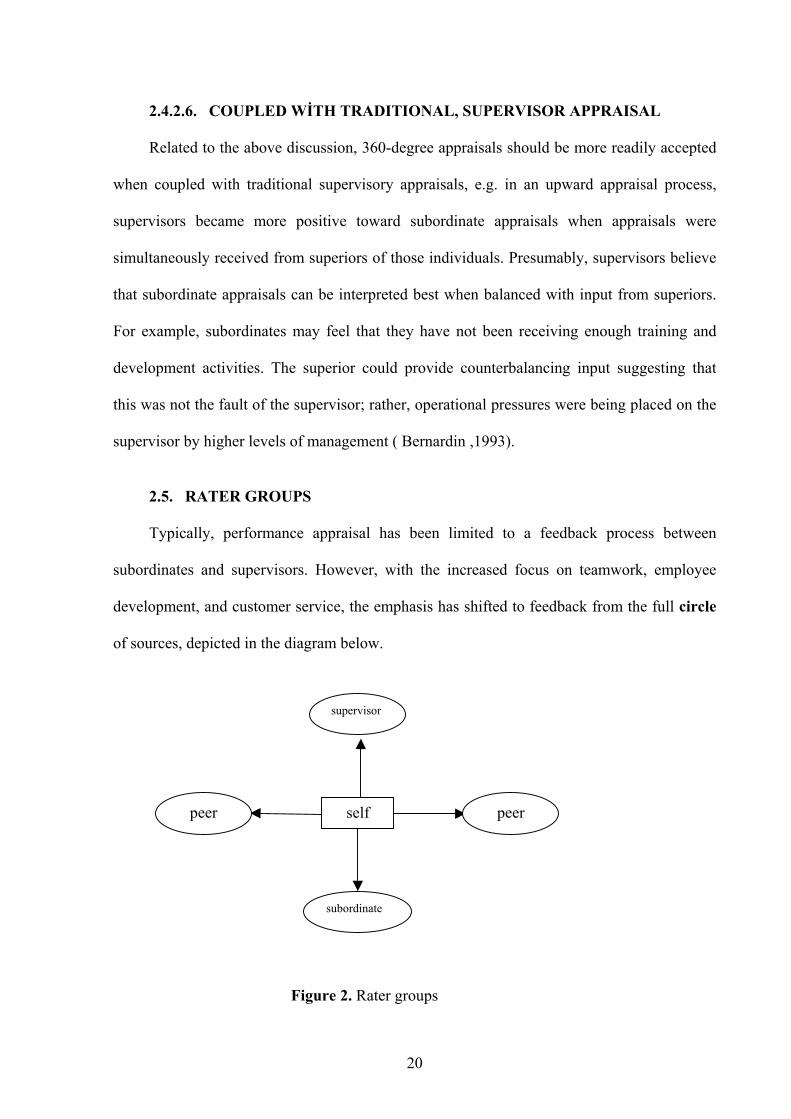
2.5. RATER GROUPS
Typically, performance appraisal has been limited to a feedback process between
subordinates and supervisors. However, with the increased focus on teamwork, employee
development, and customer service, the emphasis has shifted to feedback from the full circle
of sources, depicted in the diagram below.
subordinate
peer self peer
supervisor
Figure 2. Rater groups
21
That is why performance feedback is sometimes called “360-degree feedback” to point
out that circle.
This feedback sources consists of supervisors, peers, subordinates, customers, and one’s
self. It is not necessary, or always appropriate, to include all of the sources in a particular
appraisal program. The organizational culture and mission must be considered, and also the
purpose of feedback may differ with each source, e.g. subordinate assessments on a
supervisor’s performance can provide valuable developmental guidance, and peer feedback
can be the heart of excellence in teamwork. The objectives of performance appraisal and the
particular aspects of performance to be assessed must be set before determining appropriate
sources for feedback.
Assigning the most appropriate people to rate is a key part of the feedback process.
Ideally, each selected rater is expected to have sufficient experience observing the specific
behaviors to be evaluated. Accordingly, feedback recipients should have full involvement in
identifying who they think is in the best position to comment on their performance. The
feedback recipient is often qualified to make this decision and should do so in accordance
with the following key determinants (Lepsinger & Lucia, 1997);
What is the nature and length of the relationship between the rater and the
ratee?
Does the rater understand the full nature of what the ratee does?
A balanced selection of raters from the peer, subordinate, and supervisor
groups should be made.
A balanced selection of raters-some that work well with the ratee and some that
do not.
22
2.5.1. DOWNWARD FEEDBACK
Assessments by superiors are the most traditional source of performance feedback. As
stated by Murphy and Cleveland (1995; 135), “Supervisory evaluations follow the natural
flow of power and authority within organizations”. Evaluating a subordinate’s performance is
generally part of the supervisor’s job.
The supervisor has the best position to effectively carry out the full cycle of
performance management: Planning, Monitoring, Developing, Appraising, and Rewarding2.
He may also have the broadest perspective on the job requirements and be able to take into
account changes in those requirements.
The superiors (both the immediate supervisors and the senior managers) have the
authority to redesign and reassign subordinates’ work based on their assessment of individual
and team performance. Most Federal employees (about 90 percent in a large, Government
wide survey3) feel that the greatest contribution to their performance feedback should come
from their first-level supervisors.
However, research demonstrates that appraisal programs that rely solely on the ratings
of superiors are less reliable and valid than programs that use a variety of other rating sources
to supplement the supervisor’s evaluation (London,1995).
Superiors should be able to observe and measure all facets of the work to make a fair
evaluation. In some work situations, the supervisor or rating official is not in the same
2 United States Office of Personnel Management,1997, 360-Degree Assessment3 Survey of Federal Employees, USOPM, May 1992.
23
location or is supervising very large numbers of subordinates as in the case of Army and the
superior does not have detailed knowledge of each subordinate’s performance.
Therefore, superiors need training about how to make performance appraisals. They
should be capable of coaching and developing subordinates as well as planning and evaluating
their performance.
2.5.2. UPWARD FEEDBACK
An upward-appraisal process or feedback survey (sometimes referred to as a SAS, for
“Subordinates Appraising Supervisors”) is among the most significant and yet controversial
features of a “full circle” performance evaluation program that is why this thesis deals mostly
with. Both supervisors, being appraised and their own superiors agree that subordinates have a
unique, often essential, perspective (London & Smither, 1995). The subordinate ratings provide
particularly valuable data on performance elements concerning managerial and supervisory
behaviors.
The opinions of subordinates regarding their supervisor’s performance can be an extremely
valuable source of information for an organization for a variety of reasons:
Subordinates are sometimes able to observe supervisory performance that
superiors and peers may not be able to view,
The behaviors of subordinates toward supervisors might affect subordinate
performance and their overall attitude toward the organization,
Subordinates might provide information that can have analytical value in terms of
organizational training, policies and procedures,
24
Subordinate appraisals might increase the validity of supervisor evaluations and
hence increase the defensibility of performance appraisal of supervisors when challenged
in court (Rubin, 1995).
Of course, such information in itself is not sufficient for a complete assessment, which
requires information obtained from a variety of sources.
However, there is usually great reluctance, even fear, concerning implementation of this
rating dimension. The contributions can outweigh the concerns if the precautions noted below are
addressed.
When subordinate ratings are used as a source of performance feedback data, the need
for anonymity is very important. Subordinates simply will not participate, or they will give,
unnecessary, dishonest feedback, if they fear reprisal from their supervisors. If there are fewer
than four subordinates in the rating pool for a particular supervisor, the ratings (even though
they are averaged) should not be given to the supervisor ( Ghorpade, 2000).
Supervisors may feel threatened and perceive that their authority has been undermined
when they must take into consideration that their subordinates will be formally evaluating
them. However, research suggests that supervisors who are more responsive to their
subordinates, based on the feedback they receive, are more effective managers (Tornow &
London, 1998).
Subordinate feedback is most beneficial when used for developmental purposes.
Appraisals used for developmental purposes are believed more likely to produce positive and
less likely to produce negative outcomes than appraisals used for administrative purposes (
Fedor & Bettenhausen, 1997). It can also be used in arriving at the performance rating of
25
record, but precautions should be taken to ensure that subordinates are appraising elements of
which they have knowledge4. For example, if a supervisor’s performance plan contains
elements that address effective leadership behaviors, subordinate input would be appropriate.
It also may not be appropriate for the subordinate to appraise the supervisor’s individual
technical assignments.
Only those subordinates who have worked with a sufficient length under the supervisor
(at least 1 year is the most common standard) should be included in the pool of raters.
Moreover, subordinates currently involved in a disciplinary action or a formal performance
improvement period should be excluded from the rating group5.
2.5.3. PEER FEEDBACK
Someone with whom an individual works is called as peer. It is not so important to be
the members of the same organization or of same units, as long as they have some work-based
relationship. Peer appraisal refers to performance feedback given by anyone other than an
individual’s supervisor, subordinates or external customers. (London and Beatty, 1993;
Tornow, 1993; Edwards and Ewen, 1996).
Peer feedback refers to input provided when the rater and ratee are at the same
organizational level. Studies indicate that peer feedback is both a valid and reliable aspect of
the 360-degree feedback process (Tornow & London, 1998).
There are both significant contributions and serious pitfalls that must be carefully
considered before including this type of feedback in a multi-source appraisal program.
4United States Office of Personnel Management,1997, 360-Degree Assessment5 United States Office of Personnel Management,1997, 360-Degree Assessment
26
Peer effect through peer approval and peer pressure is often more effective than
the traditional emphasis to please the supervisor. Subordinates report resentment when
they believe that their extra efforts are required to “make the superior look good” as
opposed to meeting the organization’s goals6.
Peer ratings have proven to be excellent predictors of future performance.
Therefore, they are particularly useful as input for employee development.
Peer ratings are remarkably valid and reliable in rating behaviors and “manner
of performance,” but may be limited in rating outcomes that often require the
perspective of the supervisor.
The use of multiple raters in the peer dimension of 360-degree assessment
programs tends to average out the possible biases of any one member of the group of
raters.
The increased use of self-directed teams makes the contribution of peer
evaluations the central input to the formal appraisal because by definition the
supervisor is not directly involved in the day-to-day activities of the team.
The addition of peer feedback can help moving the supervisor into a coaching
role rather than a purely judging role.
There are cautions which should be addressed during peer appraisal process:
Rather than using them for pay, promotion, or job retention purposes, peer
evaluations are almost always appropriate for developmental purposes. It has been
demonstrated that peer appraisals provide better and more favorable information
(Fedor and Bettenhausen, 1989) if they believe that the results will be used for the
ratee’ s benefit only - that is, not in compensation or promotion decisions.
6 United States Office of Personnel Management,1997, 360-Degree Assessment
27
There is a difference of opinion about the need for anonymity of the peer
evaluators. Generally, the identities of the raters should be kept confidential to assure
honest feedback7.
To prevent competition among peer evaluators, the feedback should only be
used for developmental purposes. If this point is not successfully applied, peers may
be reluctant to evaluate each other in fear of disturbing the group climate. If a peer
group feels that the information will be used for evaluative purposes, the perceived
competition among members of a peer group may result in a rating bias (Tornow &
London, 1998).
2.5.4. SELF FEEDBACK
Multi-source feedback involves a process whereby a target individual is evaluated by
supervisors, peers, subordinates, sometimes customers, and ratings of each group is presented
to the ratee and compared to his or her own self-ratings. Mostly, this kind of appraisal is used
for developmental purposes, although there is a tendency towards the use of ‘ 360-degree
feedback’ in performance appraisal ( Bettenhausen &Fedor, 1997; Waldman, Atwater, &
Antonioni, 1998).
Such developmental appraisals are usually based on two main assumptions:
The awareness of any discrepancy between how an individual sees himself and
how others see him, improves self-awareness,
High self-awareness is a key factor associated with higher performance as a
leader ( Velsor, Taylor, Leslie, 1993).
7 United States Office of Personnel Management,1997, 360-Degree Assessment
28
The extent to which self-ratings are similar with the assessments of others, has been
taken as a measure of the degree to which individuals understand their own strengths and
weaknesses, as such has been termed ‘self-awareness’ by a number of researchers in this field
( London & Smither, 1995; Wohlers & London, 1991).
Atwater and Yammarino (1992) found that the individuals with high self- awareness
will have a more accurate self-appraisal since ‘self-awareness stems from the individual’s
ability to evaluate others’ assessments of the self and to incorporate those evaluations into
one’s self-appraisal’. Conversely, people with low self-awareness are more likely to ignore or
discount feedback about them and have negative attitudes towards work (Ashford, 1989).
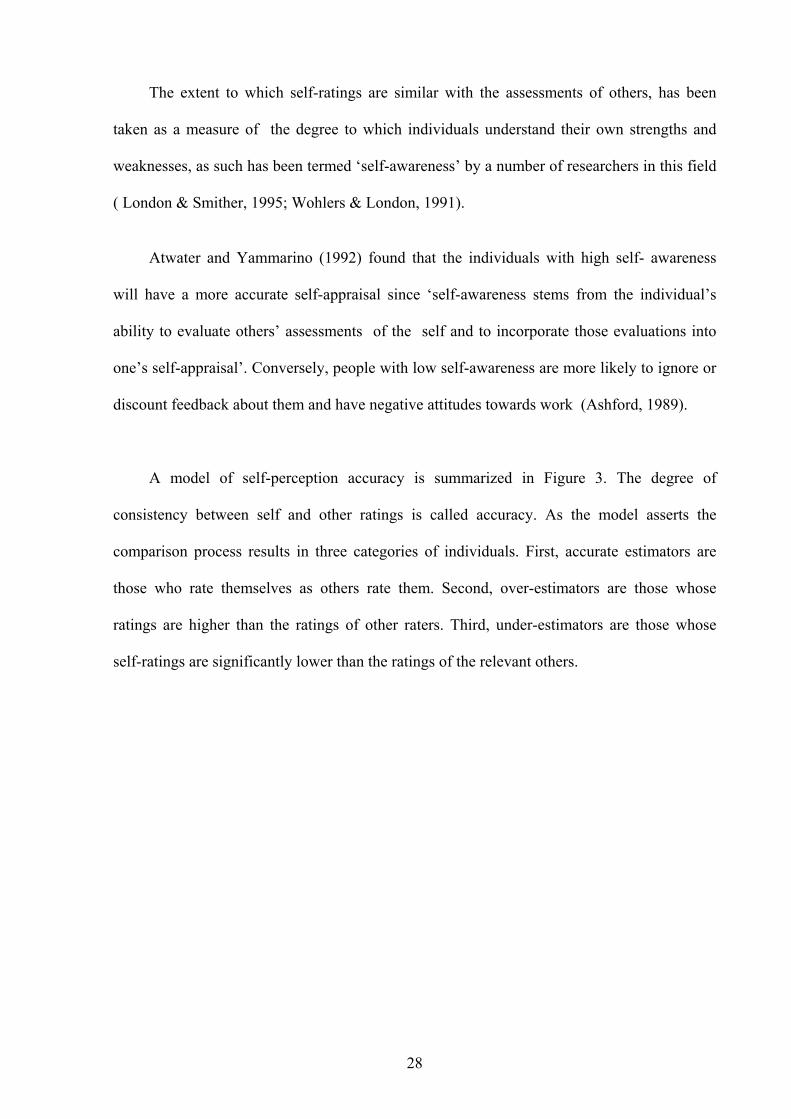
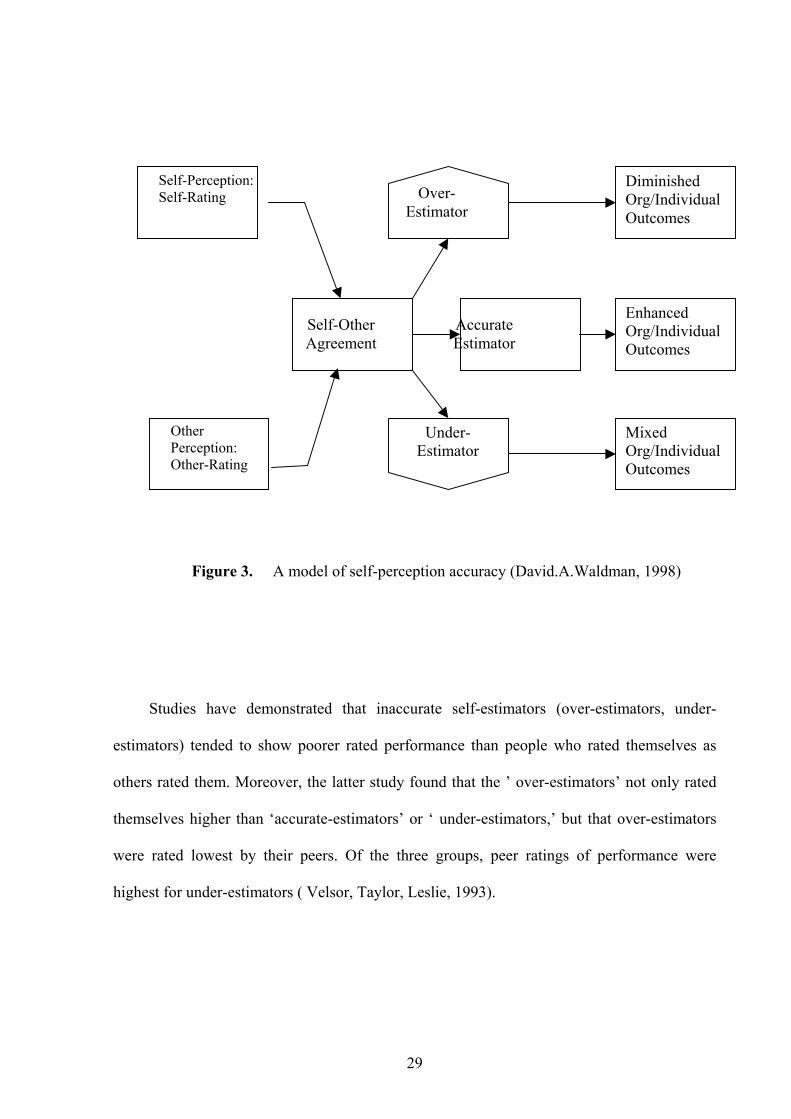
A model of self-perception accuracy is summarized in Figure 3. The degree of
consistency between self and other ratings is called accuracy. As the model asserts the
comparison process results in three categories of individuals. First, accurate estimators are
those who rate themselves as others rate them. Second, over-estimators are those whose
ratings are higher than the ratings of other raters. Third, under-estimators are those whose
self-ratings are significantly lower than the ratings of the relevant others.
29
Studies have demonstrated that inaccurate self-estimators (over-estimators, under-
estimators) tended to show poorer rated performance than people who rated themselves as
others rated them. Moreover, the latter study found that the ’ over-estimators’ not only rated
themselves higher than ‘accurate-estimators’ or ‘ under-estimators,’ but that over-estimators
were rated lowest by their peers. Of the three groups, peer ratings of performance were
highest for under-estimators ( Velsor, Taylor, Leslie, 1993).
AccurateEstimator
Figure 3. A model of self-perception accuracy (David.A.Waldman, 1998)
Over-Estimator
Self-OtherAgreement
Self-Perception:Self-Rating
DiminishedOrg/IndividualOutcomes
EnhancedOrg/IndividualOutcomes
Under-Estimator
MixedOrg/IndividualOutcomes
OtherPerception:Other-Rating
30
2.6. KEY FACTORS TO ENHANCE THE PROBABILITY OF
IMPLEMENTING 360-DEGREE FEEDBACK SUCCESSFULLY
2.6.1. INVOLVEMENT OF SENIOR MANAGEMENT AND STAKEHOLDERS
The support and participation of senior management is crucial to the success of the 360-
degree feedback process. Management support sends a clear message to the organization
about the importance of the activity. The allocation of time and organizational resources by
senior management shows the process credibility and helps to ensure that the organization
will remain committed until feedback objectives have been achieved. Obtaining senior
management’s true commitment guarantees that sufficient human and monetary resources will
be made available in support of the feedback effort (Lepsinger & Lucia, 1997). Senior
management’s participation in the feedback process also helps ensure that the behaviors and
competencies that are being measured will be supported day-to-day.
Experience shows that the foundation for a successful 360-degree system rests on a
commitment from management (Roebuck, 1996).
Key stakeholders should be made aware of important decisions related to the feedback
process and the rationale behind them. Also every stakeholder should view the feedback
program from both a personal and organizational perspective (Lepsinger & Lucia, 1998).
Consequently, if stakeholders are not given the opportunity to provide input to decisions
or help the implementation, they may either withhold support or actively sabotage the
feedback process.
Thus, all stakeholders should be made aware of;
31
The strategic competencies to be measured,
The methods for gathering and summarizing the feedback,
How the feedback will be integrated into existing development or evaluation
systems,
The individual and organizational benefits to be derived (Wimer & Nowack,
1998).
2.6.2. CLEAR AND FREQUENT COMMUNICATION
The more people understand about why 360-degree feedback is being introduced in the
organization and how the information will be used, the more likely they support the effort, or
at least not actively resist it (Lepsinger & Lucia, 1997).
In case feedback can be threatening to some within the organization, it is essential that
the goals and procedures of multi-rater feedback be communicated openly and early in the
implementation process (Wimer & Nowack, 1998). All stakeholders may have concerns prior
to implementation and they should, at least, understand the rationale underlying major
implementation decisions. When implementing a multi-source feedback system, the primary
method of communicating with participants is training. Whether formal or informal, group or
one-on-one, 360-degree feedback training makes participants to the part of a multi-source
system, eases uncertainty, and serves to minimize system breakdowns.
There are also two issues that routinely prevent the 360-degree feedback implementation
process, these are;
32
2.6.2.1. CLARITY OF PURPOSE
One of the main reasons for the unsuccessful implementation of 360-degree feedback
process is the lack of a clear purpose. The feedback doesn't address an organizational
performance issue or strategic need. Instead, it's being done because it's the latest
management trend, because a senior manager thinks it's a good idea, or because a recent
benchmarking study reports that world-class organizations are doing it. Performing an
intervention without a clear purpose is like prescribing an antibiotic for a virus; it doesn't treat
the underlying problems and may lead to undesirable outcomes (Wimer & Nowack, 1998).
Multi-rater system should be designed and implemented to address specific business and
strategic needs. For example, managers may need to increase the critical competencies for
competitive performance, based on feedback from multiple internal and external stakeholders
, organization may be operating "in a vacuum" and need to open channels of feedback to be
able to serve customers better, the compensation and reward systems may be outdated and
360-degree feedback may be a way to bring about actual or symbolic change or the
organizational hierarchy may have become rigid and 360-degree feedback may be a way to
develop a different culture that emphasizes continuous feedback and improvement (Wimer &
Nowack, 1998).
The question lies at the center of clarity of purpose; “Is the feedback to be used
primarily for individual development or is the feedback to be used for administrative purposes
such as performance appraisal and salary action?”. When the purpose is not clearly
communicated to participants, resulting uncertainty will often create a vacuum that may be
filled by anxiety, rumors, and suspicion. Communication that effectively clarifies the purpose
behind getting feedback is the most powerful tool for eliminating this type of resistance
(Lepsinger & Lucia, 1998).
33
Developmental feedback helps managers or employees provide information related to
their behavior and work attitudes that might otherwise go unnoticed in the traditional top-
down appraisal system. Developmental feedback is designed to help people improve their
skills or performance and there are probably no reactions for negative feedback. During a time
which is characterized by increased job complexity and the need to cultivate human capital,
this method of feedback provides organizations with a personnel development mechanism that
expands the reliance on supervisor-subordinate feedback systems.
Feedback for the purpose of manager and employee development became popular in the
late 1980s and today is the most common use of 360-degree feedback (Bracken, 1994). When
used for this purpose, feedback results are generally used by an independent third party and
given only to the ratee. In addition, the third-party will frequently assume a coaching role,
assisting the ratee in developing an action plan correlated to his or her specific feedback
results. A development-only approach gives participants experience using multi-source
feedback and helps ease their resistance to change. Also, there is less personal risk associated
with this method since there are no organizational repercussions linked to the feedback results
and individuals have more control over the data and how they are used (Wimer & Nowack,
1998).
The 360-degree feedback process, when used for appraisal and evaluative purposes, is
the same as developmental feedback except;
The results are shared with the ratee’s supervisor who uses this information to
make judgments about performance,
The ratee will be rewarded or punished based on the results (Edwards & Ewen,
1996).
34
Since supervisors review and use the results of appraisal and evaluative feedback, these
systems are relatively more complex than their developmental type. Also, under an appraisal
and evaluative system, participant concerns involving anonymity and system implementation
is frequently difficult and met with mixed results (Lepsinger & Lucia, 1998).
Consequently, experts recommend that, especially if it is the organization’s first
experience, 360-degree feedback should be used for developmental purposes only (Lepsinger
& Lucia, 1998).
Whatever the needs, it's imperative to have a clear and well-defined understanding or
contract with employees on why the organization is undertaking a 360-degree feedback
process.
2.6.2.2. ANONYMITY AND CONFIDENTALITY
Anonymity refers to the extent to which a rater’s identity will be revealed in conjunction
with the completion of a feedback questionnaire or interview.
Most 360-degree feedback systems provide for the anonymity of the raters. In fact, some
would claim that, if raters are not anonymous, then it is not what has come to be known as
360-degree feedback (Dalton, 1998).
Most practitioners believe that anonymous feedback will be more honest than open
feedback, especially when subordinates are asked to rate their supervisors. If anonymity is
ensured through communications and instructions, more reliable (honest) feedback might be
expected if a climate of trust exists- that is, if the raters believe that anonymity is ensured.
35
But, if they believe that anonymity is not assured, then less honesty can be expected with a
corresponding decrease in reliability and validity (Antonioni, 1994; London & Wohlers,
1991).
Anonymity and confidentiality are two significant terms often confused when
referencing the 360-degree process. Confidentiality refers to the limitations placed on who
within an organization will have access to a ratee’s feedback results. Ensuring that adequate
safeguards are applied to both anonymity and confidentiality is essential to the success of any
360-degree system.
An organization must provide a sound feedback environment to effectively assure
anonymity and confidentiality (Tornow & London, 1998). This involves not only establishing
adequate anonymity and confidentiality safeguards, but also fostering an attitude within the
organization that is supportive of individuals and respectful of their need for privacy. To this
end, there are several suggestions in the literature for assuring anonymity. First, feedback
questionnaires should be distributed in adequate numbers such that individual raters cannot be
identified via their completed surveys (Chappelow, 1998). Second, when forming results,
individual rater input should be aggregated into a group score. This prevents the ratee from
tracing a single response back to the responsible rater. Third, care should be taken to ensure
the anonymity of small rater groups and questionnaires with extreme marks or easily
decipherable comments (Lepsinger & Lucia, 1997).
Care should be taken to maintain ratee trust in system confidentiality through
established procedures for disseminating and handling feedback. Furthermore, a set of
organizational rules should manage the use of feedback results. When established, these rules
should not be changed or violated during the process of a feedback cycle. Most participants,
36
once comfortable with the anonymity and confidentiality procedures during the feedback
system, will provide open and honest input essential to the 360-degree process.
As Table I indicates, “success” is defined differently depending on the constituent
group, one is trying to satisfy. Raters, for example, would consider a 360-degree feedback
process successful if ratees appeared to accept the feedback and change their behaviors, if
their working relationships with ratees improved, if they were not retaliated against for
providing honest feedback, and if the overall feedback climate improved.
Similarly, each of the other principal constituencies (ratees, bosses, and the organization
itself) has its own definition of the factors that contribute to successful implementation of the
process.
37
Table 1. The success of a 360 feedback process as defined by its different constituents. ( Dawid W.Bracken, 2001).
· Anonymity· Ratee accountability· Multiple administrations· Policies and practices
communicated· Hotline to report problems
· Consistency· Confidentiality· Rater training· Rater accountability (i.e., honesty)· Consistent rater selection· Sufficient number of raters with knowledge
(i.e.,census)· Valid, reliable instrument· Organization commitment (e.g., resources)· Access to raters for follow-up· Development and action planning
Constituent Group
Rater
Definitions of Success
Boss
Ratee· Received feedback that was fair,
constructive, valid, actionable,credible, reliable
· Improved communications· Improved working relationship· Improved feedback climate· Improved performance
· Access to timely, quality feedbackappropriate for use in performancemanagement and/or development· Feedback aligned with organizationgoals and/or values (i.e., relevant,important)· Improvement in ratee’s behaviorconsistent with the process’ objectives· Improvement in ratee’s workgroup· Improved feedback climate· Not overly intrusive (time, cost)
· Boss receives data that are clear, actionable,relevant
· Boss receives training on proper use of data· Ratee accountability for follow-through· Organization commitment (e.g., resources)· Process is a business priority· Process is administered regularly, consistently· All bosses held accountable· Valid, reliable instrument· Efficient data collection, reporting
· Perception that feedback wasaccepted and ratee behaviorimproved
· Improved working relationship· No negative repercussions· Improved feedback climate
Factors Contributing to Success
Organization · Sustained focused behavioral change inlarge number of individuals that leads toorganizational effectiveness· Viability of the process (sustainable)· Improved feedback climate· Legal defensibility· Supports learning environment
· Top management commitment· System-wide implementation· Resources to develop valid process· Sufficient resources to sustain the process· Valid, reliable instrument· Alignment· Efficient, cost effective data collection, processingand reporting
38
CHAPTER III
3. THE RESEARCH IN TURKISH ARMY
The study analyzes 360-degree feedback and upward appraisal system which is used
primarily as a bridge to implement the 360-deegree feedback (Atwater, Roush, & Fischthal,
1995). Especially supervisors' reactions can have a significant impact on their eventual
response to 360 feedback. Because 360-degree feedback systems (upward, peer, downward
appraisal) often are used for developmental purposes, organizations may not be able to force
leaders' use of the feedback. Therefore, it is critical to understand what factors may increase
the likelihood that supervisors (officers) will accept feedback and regard it as useful. If
leaders accept and value the information from their subordinates, they should then be more
likely to use the information for development, thus achieving a primary goal of 360-degree
feedback systems.
3.1. METHODOLOGY
Mainly two factors are analyzed in this study, as they are presented below;
1. The perception of organizational culture;
A. Organizational Support;
(1) Attitudes toward the organization,
(2) Attitudes toward the unit,
39
B. Trust;
(1) Attitudes toward subordinates,
(2) Attitudes toward supervisors,
C. Perceived competence of raters;
2. General thoughts about appraisal systems;
A. Attitudes toward top-down appraisal;
B. Attitudes toward upward appraisal;
(1) The perceived benefits of upward appraisal,
(2) Concerns about upward appraisal,
(3) Clarity of purpose.
3.2. QESTIONNAIRE & SAMPLE SELECTION
Data for this study were collected through two types of questionnaires: one for officers
and one for non commissioned officers. Participants were selected from different units of
army and from different regions of Turkey in collaboration with Land Force Commander
Personnel Department. 345 survey recipients were categorized into four levels of hierarchical
positions: Lieutenant, Captain, Major and Non Commissioned Officers. Number of each
category is figured out in table 2 below.
Table 2: Participant’s status
N
Lieutenant 111
Captain 50
Major 60
NCO 124
40
3.3. PROCEDURES AND MEASURES
Participants were asked to indicate on a 5-point likert scale, ranging from 1(strongly
disagree) to 5 (strongly agree), the extent to which they agreed with each of 40 and 37
statements prepared to evaluate their perceptions and attitudes toward organizational culture
and appraisal systems respectively8.
The coefficient alpha for each of the measures used in this thesis exceeds 0.60,
suggesting that these measures have acceptable reliability, since Nunnally(1978) says that the
coefficient Alpha of 0,60 is satisfactory in most research. These values are presented in the
following chapter.
In order to search for the influence of individual variables and organizational culture on
attitudes toward upward appraisal system, it is hypothesized that contextual factors would
influence participants’ receptivity to implementation of upward appraisal and multi-source
feedback system. Correlation between variables is analyzed in the following chapter.
The questionnaire forms are presented in Appendix A and Appendix B.
3.4. HYPOTHESIS OF THE STUDY
To understand the officers’ and noncommissioned officers’ reactions to upward
appraisal, the relationship of four independent variables to a dependent variable of attitudes
toward subordinate feedback is analyzed. The hypotheses are discussed below.
8 SPSS 11.0 Program was used to analyze the data
41
3.4.1. Attitudes Toward Upward Appraisal System
Seven and six items were asked to officers and NCOs respectively, to measure the
attitudes toward the future use of upward feedback system. (e.g. “I believe that upward
appraisal should be used in the evaluation system”). These items were measured on a five-
point Likert-type scale.
3.4.2. Perceptions of the Feedback Environment
It was predicted that three variables relevant to supervisors' and noncommissioned
officers’ perceptions of the feedback environment would positively be related to respondents'
reactions to feedback. The first variable, perceived organizational support (explained above),
is the extent to which subjects perceive that they are valued and cared about by the
organization and believe the development of organization on behalf of their usage.
In this study, it was proposed that perceived organizational support would be related to
respondents' acceptance of feedback and their belief that upward feedback is useful. 3-item
measure of organizational support was used to indicate a respondent’s tendency to believe that
the organization cares about their personnel.
Hypothesis 1a: Supervisors' perceptions of organizational support are positively related to
their acceptance of feedback and belief that upward appraisal is useful.
Hypothesis 1b: Noncommissioned officers' perceptions of organizational support are
positively related to their acceptance of feedback and belief that upward appraisal is useful.
The second feedback environment variable is perceived rater ability, or respondents'
perceptions that subordinates have the requisite skills and abilities necessary to accurately rate
their supervisors’ performance. 3 items were used to measure the individuals’ perceptions
42
regarding the perceived competence of raters. These items were measured on a 5-point
Likert-type scale. Previous research has showed that the credibility of the source- in terms of
skill, ability to observe performance - can have a strong influence on ratees’ reactions to
feedback (Bannister, 1986).
Hypothesis 2a: Supervisors' perceptions of rater ability are positively related to their
acceptance of feedback and belief that upward appraisal is useful.
Hypothesis 2b: NCOs' perceptions of rater ability are positively related to their acceptance
of feedback and belief that upward appraisal is useful.
The third feedback environment variable is perceived trust to supervisors and
subordinates. It was proposed that perceived trust to subordinates and supervisors would
positively be related to officers' and NCOs’ acceptance of feedback and belief that upward
feedback is useful. Higher score on a 5-point Likert-type scale indicated greater feeling of
trust to subordinates and supervisors.
Hypothesis 3a: Officers’ perceptions of trust toward their supervisors and subordinates are
positively related to their acceptance of feedback and belief that upward appraisal is useful.
Hypothesis 3b: NCO’s perceptions of trust toward their supervisors are positively related to
their acceptance of feedback and belief that upward appraisal is useful.
The fourth feedback environment is the perception of current appraisal system. The
current evaluation system can be considered as an alternative factor that affects the attitudes
toward upward appraisal system. This hypothesis examines the relationship between the
extent to which respondents perceived the upward appraisal positively and to be fair and their
overall satisfaction with current system.
43
Hypothesis 4: A high degree of satisfaction with one’s current, traditional appraisal system
would be negatively related to attitudes toward upward appraisal system.
3.5. LIMITATIONS
It should not certainly be overlooked that this study reflects only the respondents’ views
to which interpretations are based on. So the results or conclusions about the attitudes toward
the upward appraisal system and other variables can not be regarded as the opinions of all
Army personnel. Interpretations of this study’s results are limited only by its research
methodology and sample.
Sample sizes in each group are relatively small because the study required two different
samples (officers and NCO) to complete two surveys. As a result, our samples might not have
provided adequate statistical power for detecting stronger and weaker attitudes. Therefore,
future research should attempt to replicate our findings using larger samples to determine if
the unimportant findings reported here is a function of low statistical power, as well as to
assess the stability of these results.
Final limitation of this study is the fact that the nature of the collecting data system does
not guarantee natural views of respondents, because of this, future research should assure
anonymity of questionnaire for recipients by doing it as a group to analyze whether the
relationships found in this thesis between the predictor variable and upward appraisal system
attitudes are of a causal nature.
44
3.6. FINDINGS AND RESULTS
This section is designed to analyze findings of the questionnaire, in relation to
perception of organizational culture and general thoughts about appraisal systems. The section
presents analysis for officers’ responses and NCOs’ responses separately.
3.6.1. OFFICERS’ RESPONSES
In the sections, perception of organizational culture for three main points is analyzed;
1. Attitudes, expressed by officers toward their organization and units for
organizational support;
2. Attitudes toward supervisors and attitudes toward subordinates for the
perception of trust;
3. Perceived competence of raters (subordinates).
In the sections for general thoughts about appraisal systems three things are analyzed;
What the comments of respondents about the current evaluation (Top-down appraisal)
system, such as;
1. The effects of top-down appraisal system to the command-control relations,
2. The effects of current evaluation system to the behaviors of supervisors,
3. The extent to degree of perceived objectivity of this system.
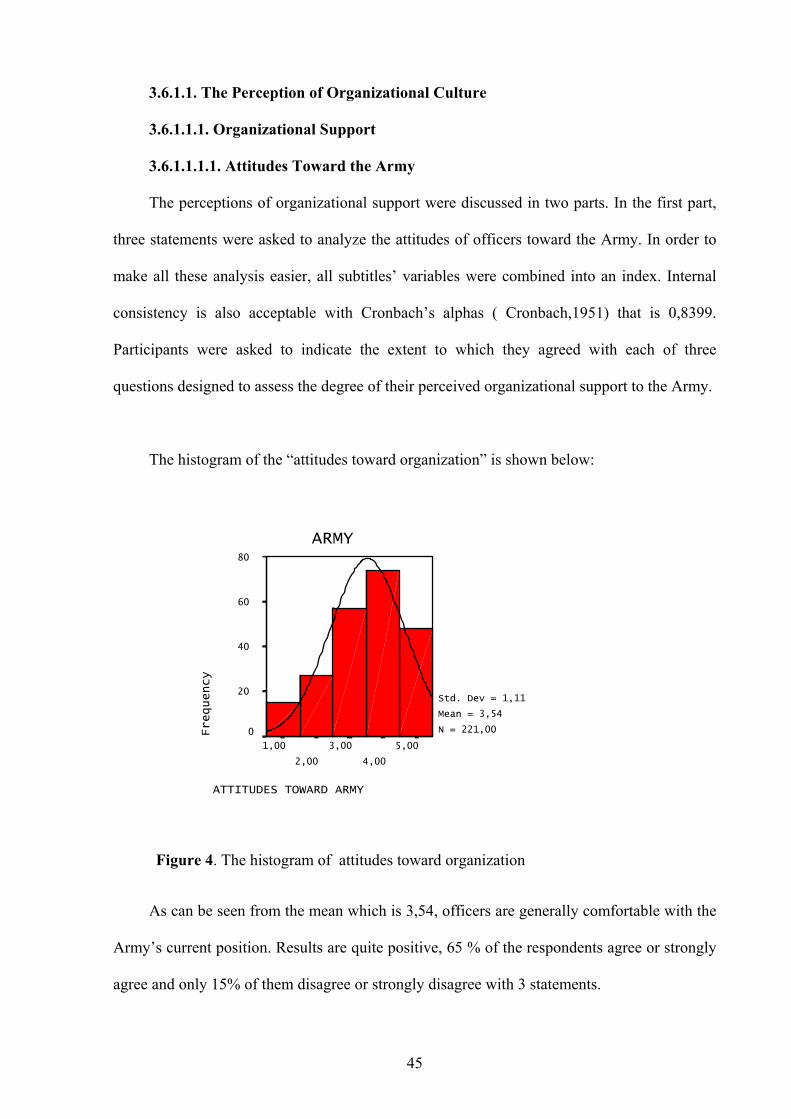
45
3.6.1.1. The Perception of Organizational Culture
3.6.1.1.1. Organizational Support
3.6.1.1.1.1. Attitudes Toward the Army
The perceptions of organizational support were discussed in two parts. In the first part,
three statements were asked to analyze the attitudes of officers toward the Army. In order to
make all these analysis easier, all subtitles’ variables were combined into an index. Internal
consistency is also acceptable with Cronbach’s alphas ( Cronbach,1951) that is 0,8399.
Participants were asked to indicate the extent to which they agreed with each of three
questions designed to assess the degree of their perceived organizational support to the Army.
The histogram of the “attitudes toward organization” is shown below:
ATTITUDES TOWARD ARMY
5,00
4,00
3,00
2,00
1,00
ARMY
Frequency
80
60
40
20
0
Std. Dev = 1,11
Mean = 3,54
N = 221,00
As can be seen from the mean which is 3,54, officers are generally comfortable with the
Army’s current position. Results are quite positive, 65 % of the respondents agree or strongly
agree and only 15% of them disagree or strongly disagree with 3 statements.
Figure 4. The histogram of attitudes toward organization
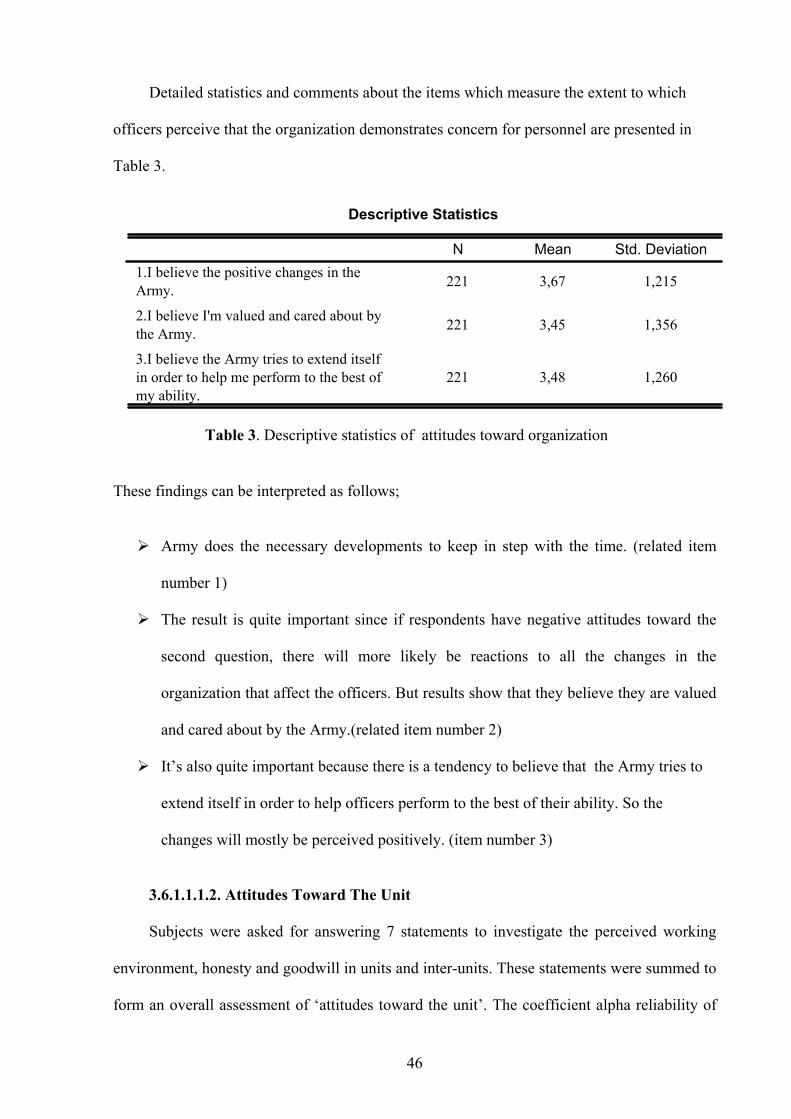
46
Detailed statistics and comments about the items which measure the extent to which
officers perceive that the organization demonstrates concern for personnel are presented in
Table 3.
Descriptive Statistics
221 3,67 1,215
221 3,45 1,356
221 3,48 1,260
1.I believe the positive changes in theArmy.
2.I believe I'm valued and cared about bythe Army.
3.I believe the Army tries to extend itselfin order to help me perform to the best ofmy ability.
N Mean Std. Deviation
These findings can be interpreted as follows;
Army does the necessary developments to keep in step with the time. (related item
number 1)
The result is quite important since if respondents have negative attitudes toward the
second question, there will more likely be reactions to all the changes in the
organization that affect the officers. But results show that they believe they are valued
and cared about by the Army.(related item number 2)
It’s also quite important because there is a tendency to believe that the Army tries to
extend itself in order to help officers perform to the best of their ability. So the
changes will mostly be perceived positively. (item number 3)
3.6.1.1.1.2. Attitudes Toward The Unit
Subjects were asked for answering 7 statements to investigate the perceived working
environment, honesty and goodwill in units and inter-units. These statements were summed to
form an overall assessment of ‘attitudes toward the unit’. The coefficient alpha reliability of
Table 3. Descriptive statistics of attitudes toward organization
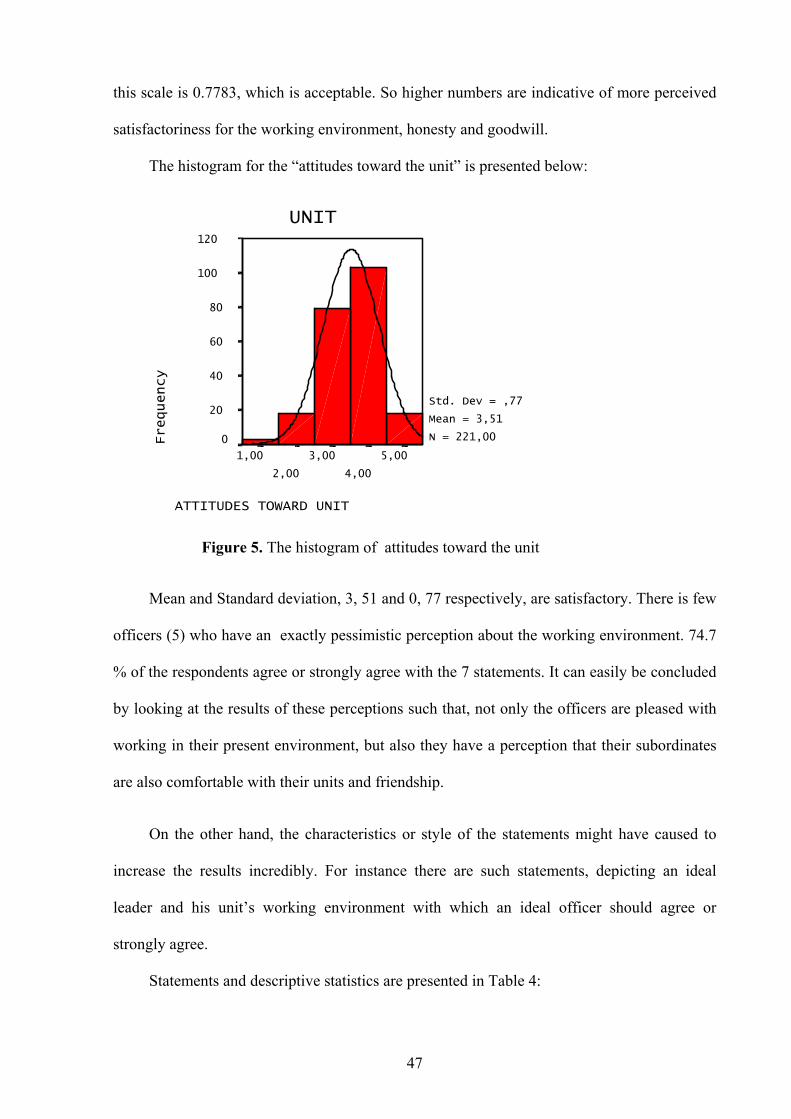
47
this scale is 0.7783, which is acceptable. So higher numbers are indicative of more perceived
satisfactoriness for the working environment, honesty and goodwill.
The histogram for the “attitudes toward the unit” is presented below:
ATTITUDES TOWARD UNIT
5,00
4,00
3,00
2,00
1,00
UNIT
Frequency
120
100
80
60
40
20
0
Std. Dev = ,77
Mean = 3,51
N = 221,00
Mean and Standard deviation, 3, 51 and 0, 77 respectively, are satisfactory. There is few
officers (5) who have an exactly pessimistic perception about the working environment. 74.7
% of the respondents agree or strongly agree with the 7 statements. It can easily be concluded
by looking at the results of these perceptions such that, not only the officers are pleased with
working in their present environment, but also they have a perception that their subordinates
are also comfortable with their units and friendship.
On the other hand, the characteristics or style of the statements might have caused to
increase the results incredibly. For instance there are such statements, depicting an ideal
leader and his unit’s working environment with which an ideal officer should agree or
strongly agree.
Statements and descriptive statistics are presented in Table 4:
Figure 5. The histogram of attitudes toward the unit
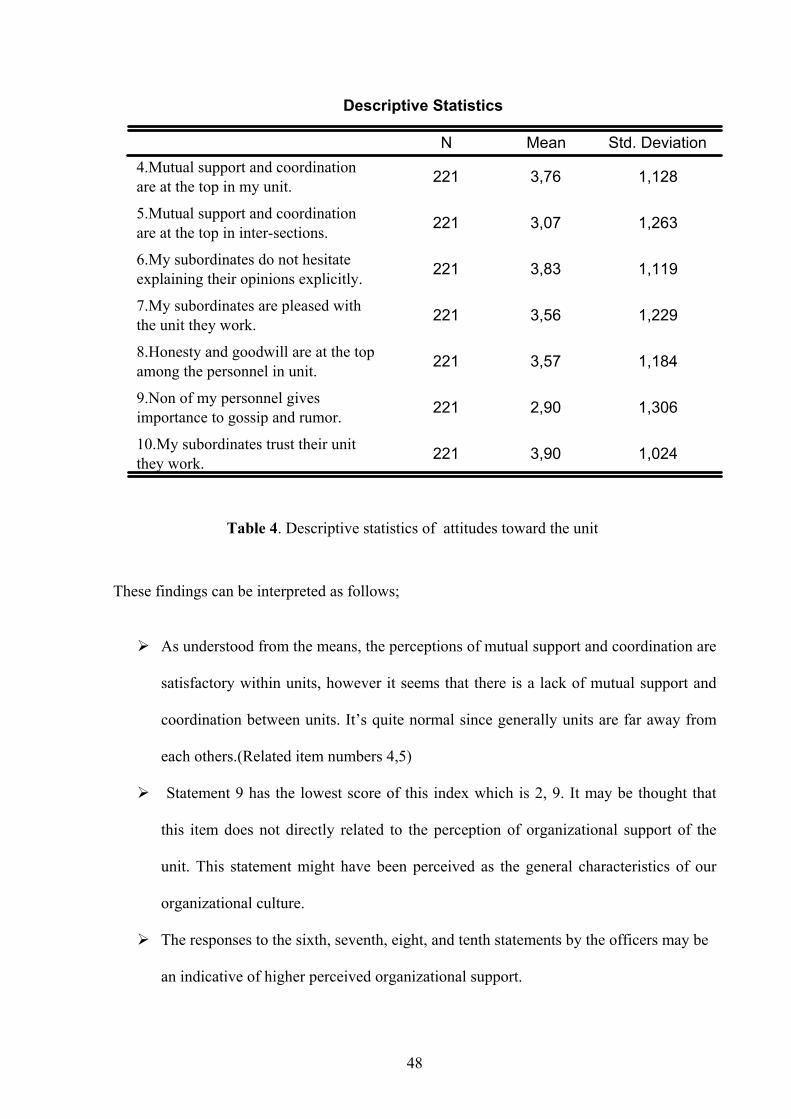
48
Descriptive Statistics
221 3,76 1,128
221 3,07 1,263
221 3,83 1,119
221 3,56 1,229
221 3,57 1,184
221 2,90 1,306
221 3,90 1,024
4.Mutual support and coordinationare at the top in my unit.
5.Mutual support and coordinationare at the top in inter-sections.
6.My subordinates do not hesitateexplaining their opinions explicitly.
7.My subordinates are pleased withthe unit they work.
8.Honesty and goodwill are at the topamong the personnel in unit.
9.Non of my personnel givesimportance to gossip and rumor.
10.My subordinates trust their unitthey work.
N Mean Std. Deviation
These findings can be interpreted as follows;
As understood from the means, the perceptions of mutual support and coordination are
satisfactory within units, however it seems that there is a lack of mutual support and
coordination between units. It’s quite normal since generally units are far away from
each others.(Related item numbers 4,5)
Statement 9 has the lowest score of this index which is 2, 9. It may be thought that
this item does not directly related to the perception of organizational support of the
unit. This statement might have been perceived as the general characteristics of our
organizational culture.
The responses to the sixth, seventh, eight, and tenth statements by the officers may be
an indicative of higher perceived organizational support.
Table 4. Descriptive statistics of attitudes toward the unit
49
3.6.1.1.2. The Perception of Trust
In this section, the following points are discussed;
1. Management style,
2. The level of trust to subordinates,
3. Respondents’ perceptions to their supervisors’ attitudes,
4. Thoughts about upward appraisal,
5. Perceived trust of supervisors,
3.6.1.1.2.1. Attitudes toward Subordinates
Officers were asked for answering 4 statements to investigate the perceived relationship
with subordinates, the degree of trust and the management style of the officers. These
statements were summed up to form an overall assessment of ‘attitudes toward the
subordinates’. The coefficient alpha reliability of this scale is 0.6881, which is acceptable.
According to scale, higher score shows the extent to which officers trust their subordinates
and they have a good perceived relationship with each other. Five–point Likert scale, ranging
from 1( strongly disagree) to 5 (strongly agree ), were used to analyze the statements.
The histogram for the “attitudes toward subordinates” is presented below:
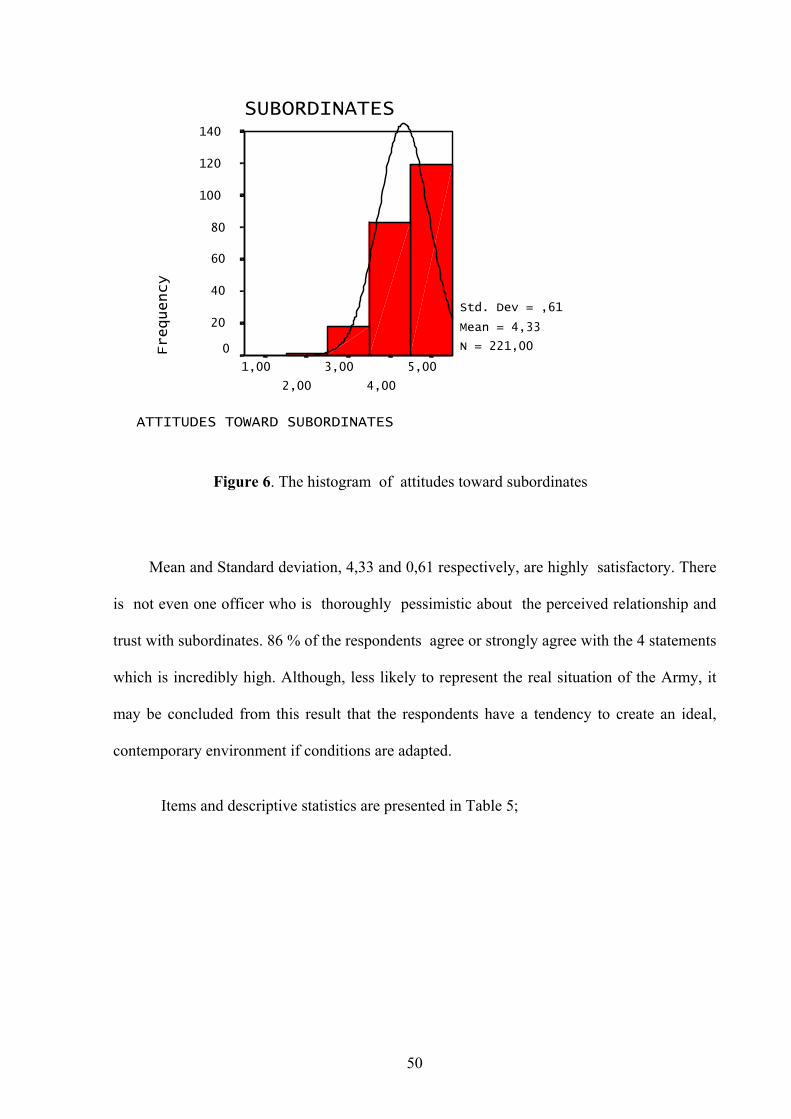
50
ATTITUDES TOWARD SUBORDINATES
5,00
4,00
3,00
2,00
1,00
SUBORDINATES
Frequency
140
120
100
80
60
40
20
0
Std. Dev = ,61
Mean = 4,33
N = 221,00
Mean and Standard deviation, 4,33 and 0,61 respectively, are highly satisfactory. There
is not even one officer who is thoroughly pessimistic about the perceived relationship and
trust with subordinates. 86 % of the respondents agree or strongly agree with the 4 statements
which is incredibly high. Although, less likely to represent the real situation of the Army, it
may be concluded from this result that the respondents have a tendency to create an ideal,
contemporary environment if conditions are adapted.
Items and descriptive statistics are presented in Table 5;
Figure 6. The histogram of attitudes toward subordinates
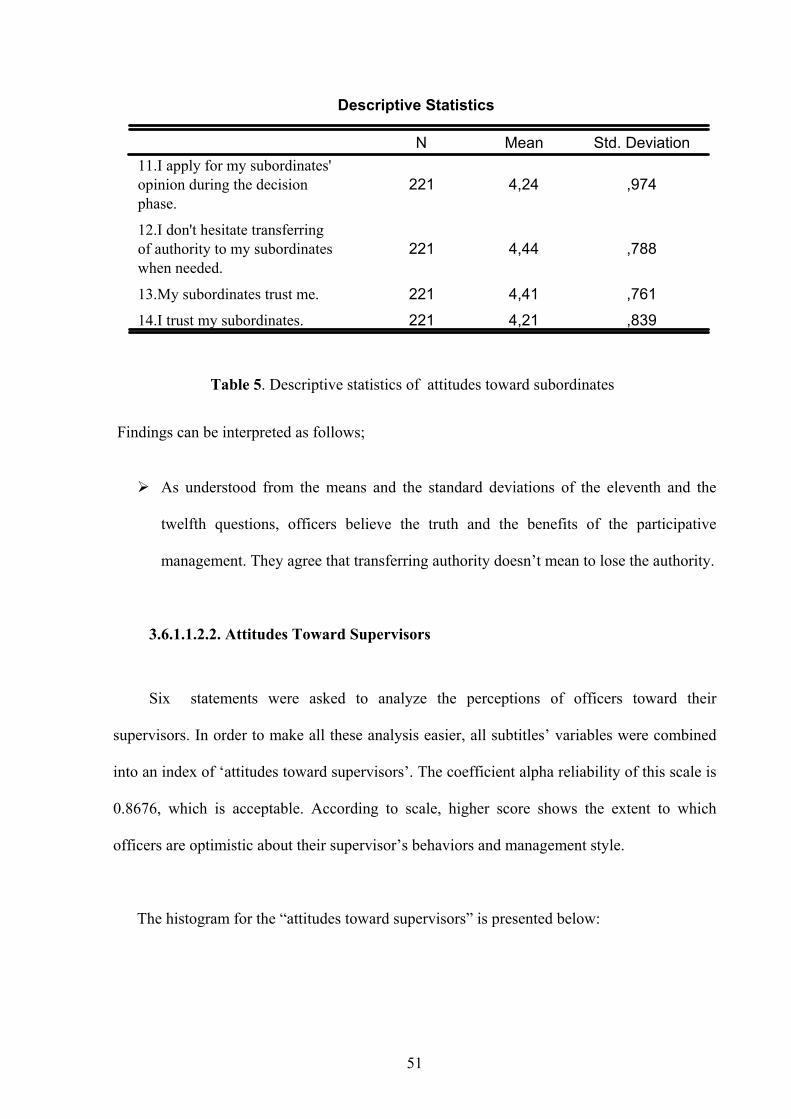
51
Descriptive Statistics
221 4,24 ,974
221 4,44 ,788
221 4,41 ,761221 4,21 ,839
11.I apply for my subordinates'opinion during the decisionphase.
12.I don't hesitate transferringof authority to my subordinateswhen needed.
13.My subordinates trust me.
14.I trust my subordinates.
N Mean Std. Deviation
Findings can be interpreted as follows;
As understood from the means and the standard deviations of the eleventh and the
twelfth questions, officers believe the truth and the benefits of the participative
management. They agree that transferring authority doesn’t mean to lose the authority.
3.6.1.1.2.2. Attitudes Toward Supervisors
Six statements were asked to analyze the perceptions of officers toward their
supervisors. In order to make all these analysis easier, all subtitles’ variables were combined
into an index of ‘attitudes toward supervisors’. The coefficient alpha reliability of this scale is
0.8676, which is acceptable. According to scale, higher score shows the extent to which
officers are optimistic about their supervisor’s behaviors and management style.
The histogram for the “attitudes toward supervisors” is presented below:
Table 5. Descriptive statistics of attitudes toward subordinates
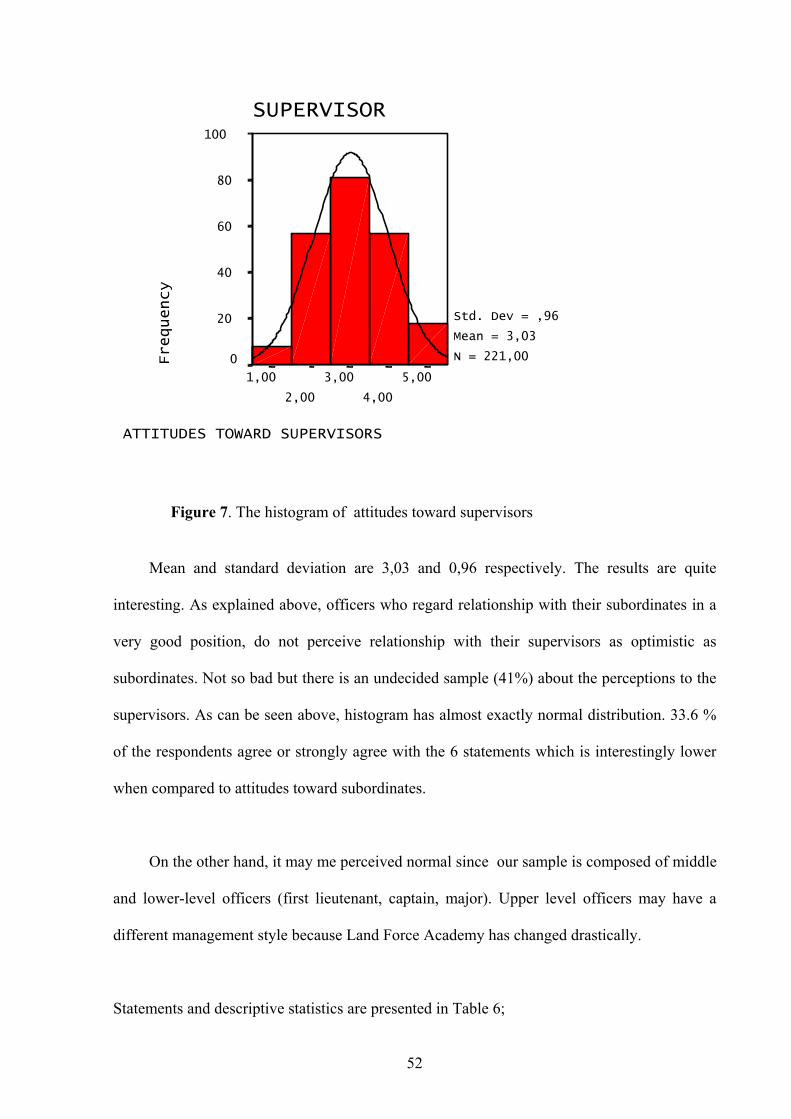
52
ATTITUDES TOWARD SUPERVISORS
5,00
4,00
3,00
2,00
1,00
SUPERVISOR
Frequency
100
80
60
40
20
0
Std. Dev = ,96
Mean = 3,03
N = 221,00
Mean and standard deviation are 3,03 and 0,96 respectively. The results are quite
interesting. As explained above, officers who regard relationship with their subordinates in a
very good position, do not perceive relationship with their supervisors as optimistic as
subordinates. Not so bad but there is an undecided sample (41%) about the perceptions to the
supervisors. As can be seen above, histogram has almost exactly normal distribution. 33.6 %
of the respondents agree or strongly agree with the 6 statements which is interestingly lower
when compared to attitudes toward subordinates.
On the other hand, it may me perceived normal since our sample is composed of middle
and lower-level officers (first lieutenant, captain, major). Upper level officers may have a
different management style because Land Force Academy has changed drastically.
Statements and descriptive statistics are presented in Table 6;
Figure 7. The histogram of attitudes toward supervisors
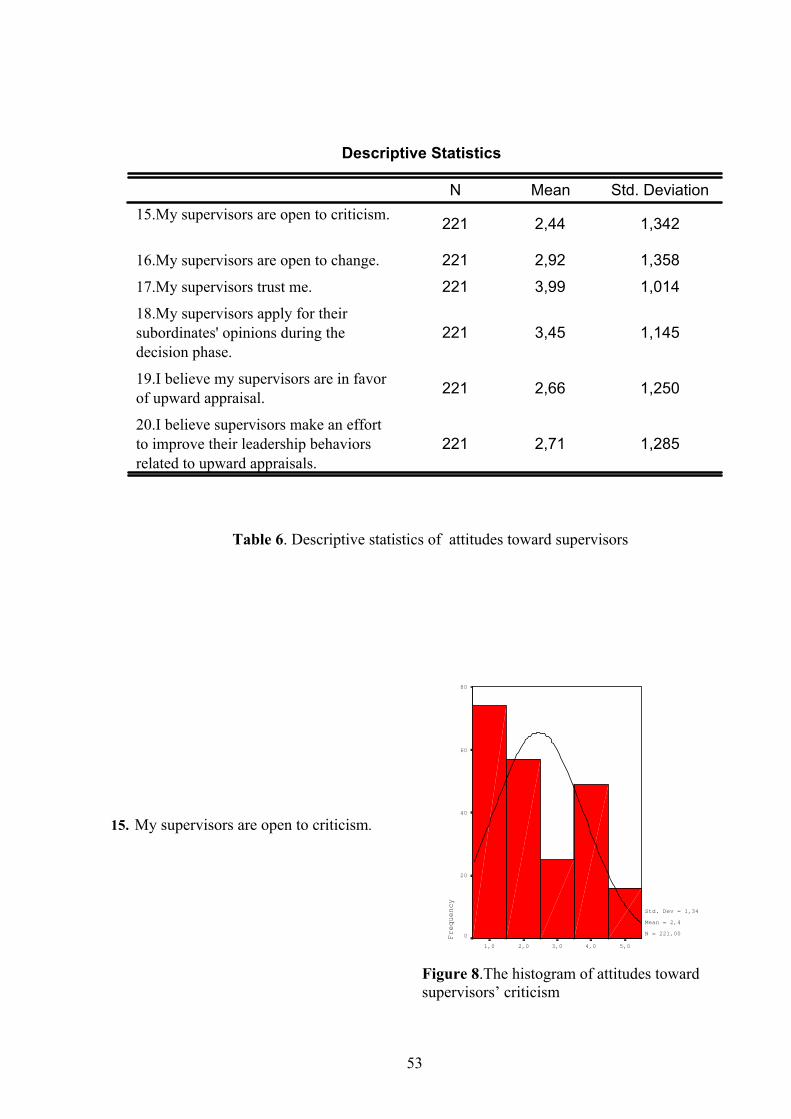
53
Descriptive Statistics
221 2,44 1,342
221 2,92 1,358221 3,99 1,014
221 3,45 1,145
221 2,66 1,250
221 2,71 1,285
15.My supervisors are open to criticism.
16.My supervisors are open to change.
17.My supervisors trust me.
18.My supervisors apply for theirsubordinates' opinions during thedecision phase.
19.I believe my supervisors are in favorof upward appraisal.
20.I believe supervisors make an effortto improve their leadership behaviorsrelated to upward appraisals.
N Mean Std. Deviation
5,04,03,02,01,0
Frequency
80
60
40
20
0
Std. Dev = 1,34
Mean = 2,4
N = 221,00
15. My supervisors are open to criticism.
Table 6. Descriptive statistics of attitudes toward supervisors
Figure 8.The histogram of attitudes towardsupervisors’ criticism
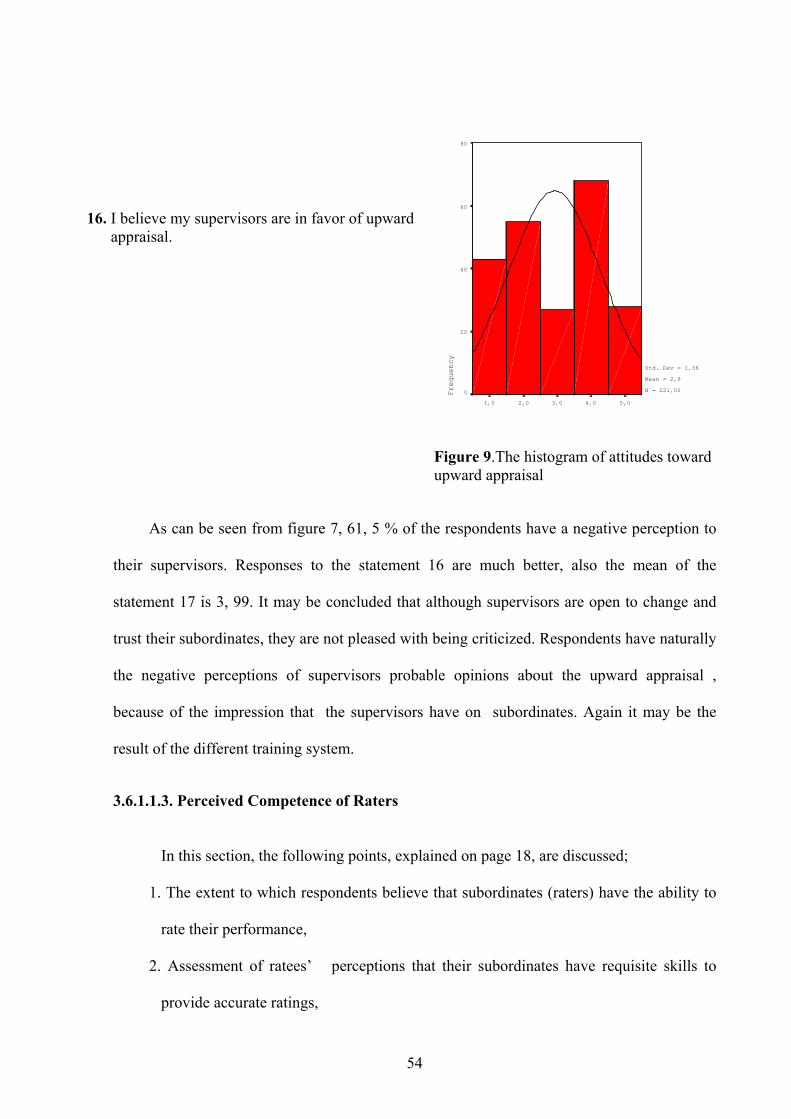
54
5,04,03,02,01,0
Frequency
80
60
40
20
0
Std. Dev = 1,36
Mean = 2,9
N = 221,00
As can be seen from figure 7, 61, 5 % of the respondents have a negative perception to
their supervisors. Responses to the statement 16 are much better, also the mean of the
statement 17 is 3, 99. It may be concluded that although supervisors are open to change and
trust their subordinates, they are not pleased with being criticized. Respondents have naturally
the negative perceptions of supervisors probable opinions about the upward appraisal ,
because of the impression that the supervisors have on subordinates. Again it may be the
result of the different training system.
3.6.1.1.3. Perceived Competence of Raters
In this section, the following points, explained on page 18, are discussed;
1. The extent to which respondents believe that subordinates (raters) have the ability to
rate their performance,
2. Assessment of ratees’ perceptions that their subordinates have requisite skills to
provide accurate ratings,
16. I believe my supervisors are in favor of upwardappraisal.
Figure 9.The histogram of attitudes towardupward appraisal
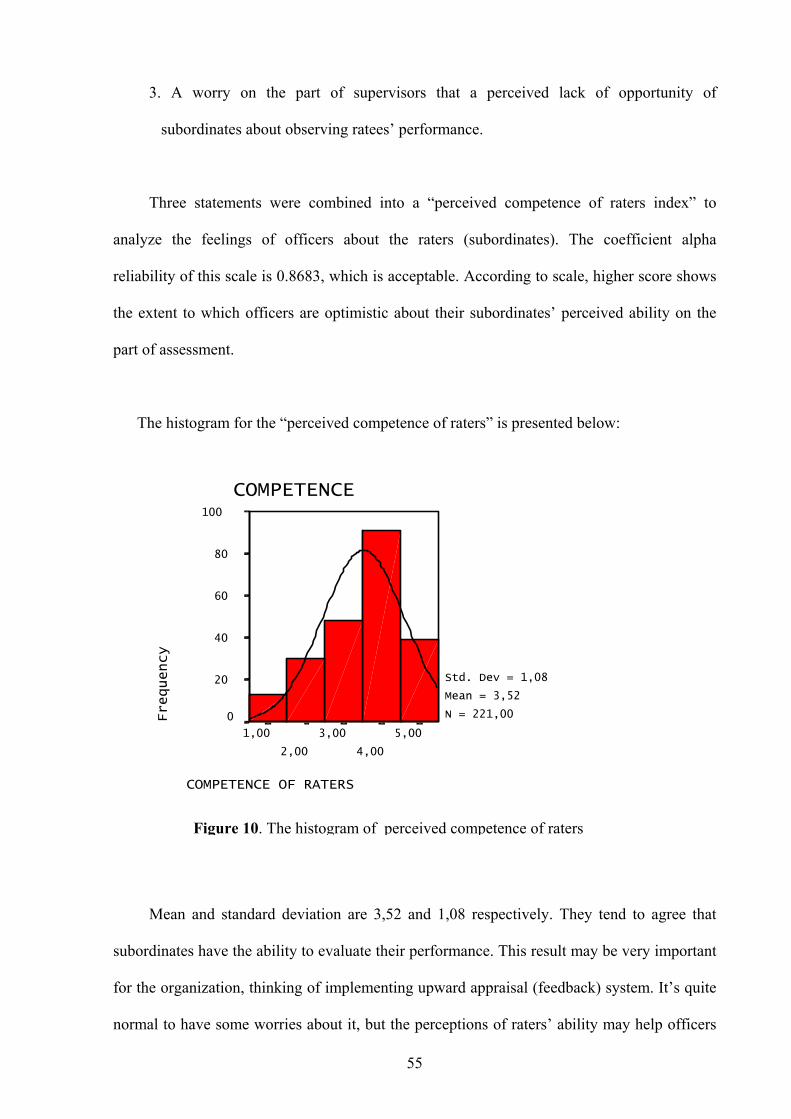
55
3. A worry on the part of supervisors that a perceived lack of opportunity of
subordinates about observing ratees’ performance.
Three statements were combined into a “perceived competence of raters index” to
analyze the feelings of officers about the raters (subordinates). The coefficient alpha
reliability of this scale is 0.8683, which is acceptable. According to scale, higher score shows
the extent to which officers are optimistic about their subordinates’ perceived ability on the
part of assessment.
The histogram for the “perceived competence of raters” is presented below:
COMPETENCE OF RATERS
5,00
4,00
3,00
2,00
1,00
COMPETENCE
Frequency
100
80
60
40
20
0
Std. Dev = 1,08
Mean = 3,52
N = 221,00
Mean and standard deviation are 3,52 and 1,08 respectively. They tend to agree that
subordinates have the ability to evaluate their performance. This result may be very important
for the organization, thinking of implementing upward appraisal (feedback) system. It’s quite
normal to have some worries about it, but the perceptions of raters’ ability may help officers
Figure 10. The histogram of perceived competence of raters
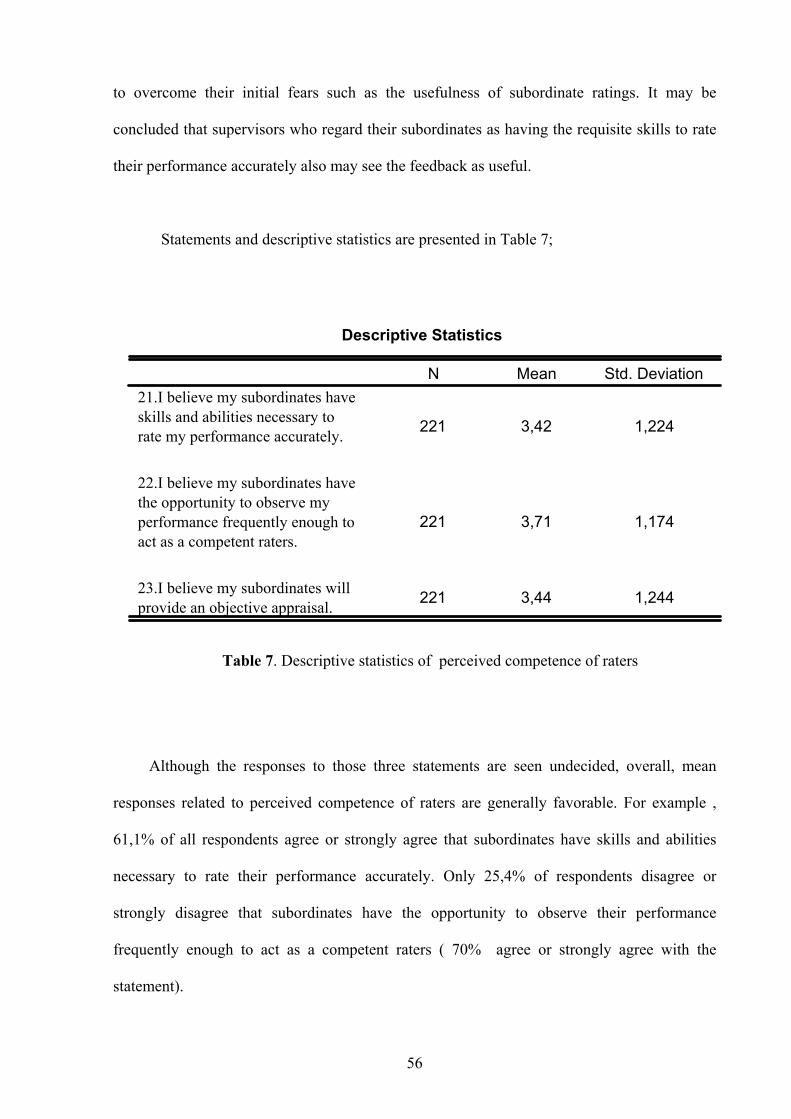
56
to overcome their initial fears such as the usefulness of subordinate ratings. It may be
concluded that supervisors who regard their subordinates as having the requisite skills to rate
their performance accurately also may see the feedback as useful.
Statements and descriptive statistics are presented in Table 7;
Descriptive Statistics
221 3,42 1,224
221 3,71 1,174
221 3,44 1,244
21.I believe my subordinates haveskills and abilities necessary torate my performance accurately.
22.I believe my subordinates havethe opportunity to observe myperformance frequently enough toact as a competent raters.
23.I believe my subordinates willprovide an objective appraisal.
N Mean Std. Deviation
Although the responses to those three statements are seen undecided, overall, mean
responses related to perceived competence of raters are generally favorable. For example ,
61,1% of all respondents agree or strongly agree that subordinates have skills and abilities
necessary to rate their performance accurately. Only 25,4% of respondents disagree or
strongly disagree that subordinates have the opportunity to observe their performance
frequently enough to act as a competent raters ( 70% agree or strongly agree with the
statement).
Table 7. Descriptive statistics of perceived competence of raters
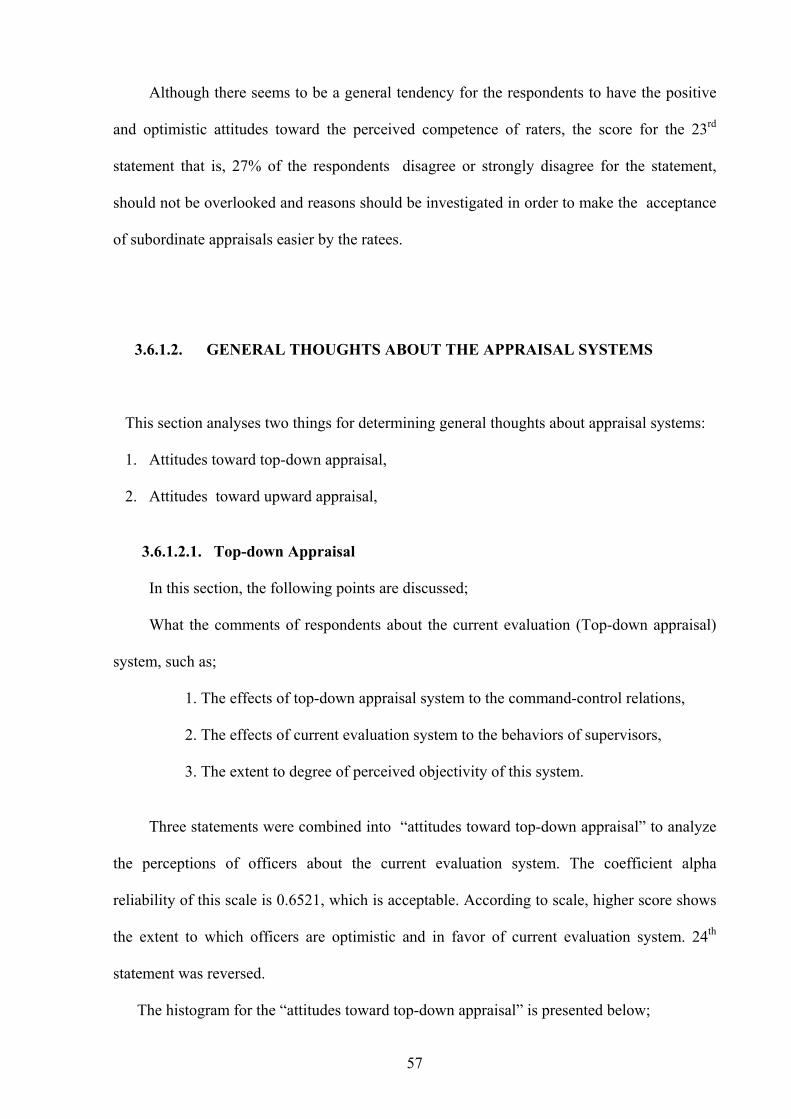
57
Although there seems to be a general tendency for the respondents to have the positive
and optimistic attitudes toward the perceived competence of raters, the score for the 23rd
statement that is, 27% of the respondents disagree or strongly disagree for the statement,
should not be overlooked and reasons should be investigated in order to make the acceptance
of subordinate appraisals easier by the ratees.
3.6.1.2. GENERAL THOUGHTS ABOUT THE APPRAISAL SYSTEMS
This section analyses two things for determining general thoughts about appraisal systems:
1. Attitudes toward top-down appraisal,
2. Attitudes toward upward appraisal,
3.6.1.2.1. Top-down Appraisal
In this section, the following points are discussed;
What the comments of respondents about the current evaluation (Top-down appraisal)
system, such as;
1. The effects of top-down appraisal system to the command-control relations,
2. The effects of current evaluation system to the behaviors of supervisors,
3. The extent to degree of perceived objectivity of this system.
Three statements were combined into “attitudes toward top-down appraisal” to analyze
the perceptions of officers about the current evaluation system. The coefficient alpha
reliability of this scale is 0.6521, which is acceptable. According to scale, higher score shows
the extent to which officers are optimistic and in favor of current evaluation system. 24th
statement was reversed.
The histogram for the “attitudes toward top-down appraisal” is presented below;
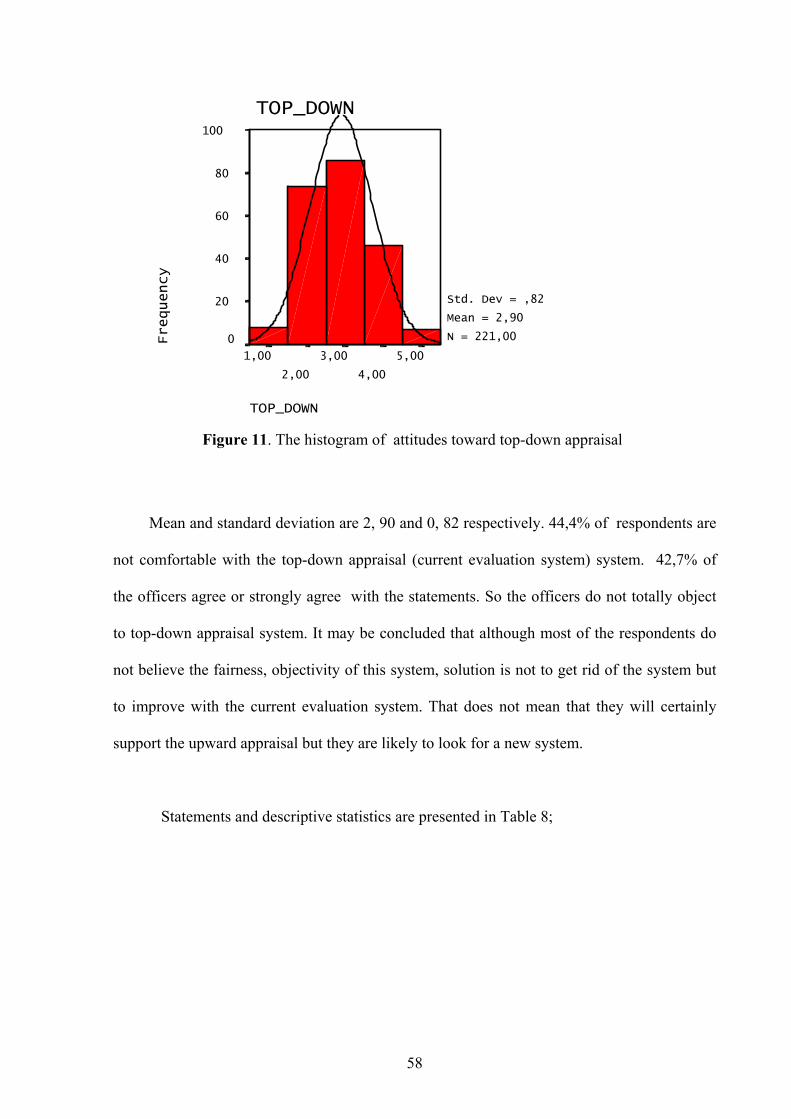
58
TOP_DOWN
5,00
4,00
3,00
2,00
1,00
TOP_DOWN
Frequency
100
80
60
40
20
0
Std. Dev = ,82
Mean = 2,90
N = 221,00
Mean and standard deviation are 2, 90 and 0, 82 respectively. 44,4% of respondents are
not comfortable with the top-down appraisal (current evaluation system) system. 42,7% of
the officers agree or strongly agree with the statements. So the officers do not totally object
to top-down appraisal system. It may be concluded that although most of the respondents do
not believe the fairness, objectivity of this system, solution is not to get rid of the system but
to improve with the current evaluation system. That does not mean that they will certainly
support the upward appraisal but they are likely to look for a new system.
Statements and descriptive statistics are presented in Table 8;
Figure 11. The histogram of attitudes toward top-down appraisal
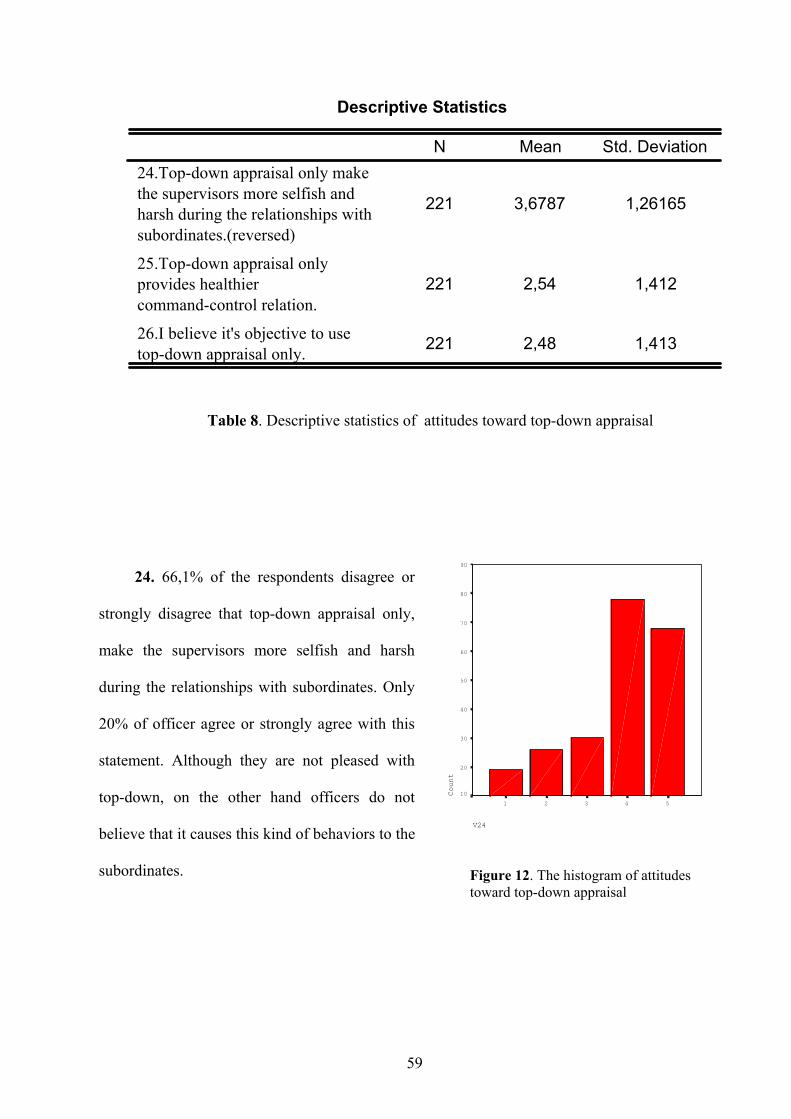
59
Descriptive Statistics
221 3,6787 1,26165
221 2,54 1,412
221 2,48 1,413
24.Top-down appraisal only makethe supervisors more selfish andharsh during the relationships withsubordinates.(reversed)
25.Top-down appraisal onlyprovides healthiercommand-control relation.
26.I believe it's objective to usetop-down appraisal only.
N Mean Std. Deviation
V24
54321
Count
90
80
70
60
50
40
30
20
10
24. 66,1% of the respondents disagree or
strongly disagree that top-down appraisal only,
make the supervisors more selfish and harsh
during the relationships with subordinates. Only
20% of officer agree or strongly agree with this
statement. Although they are not pleased with
top-down, on the other hand officers do not
believe that it causes this kind of behaviors to the
subordinates.
Table 8. Descriptive statistics of attitudes toward top-down appraisal
Figure 12. The histogram of attitudestoward top-down appraisal
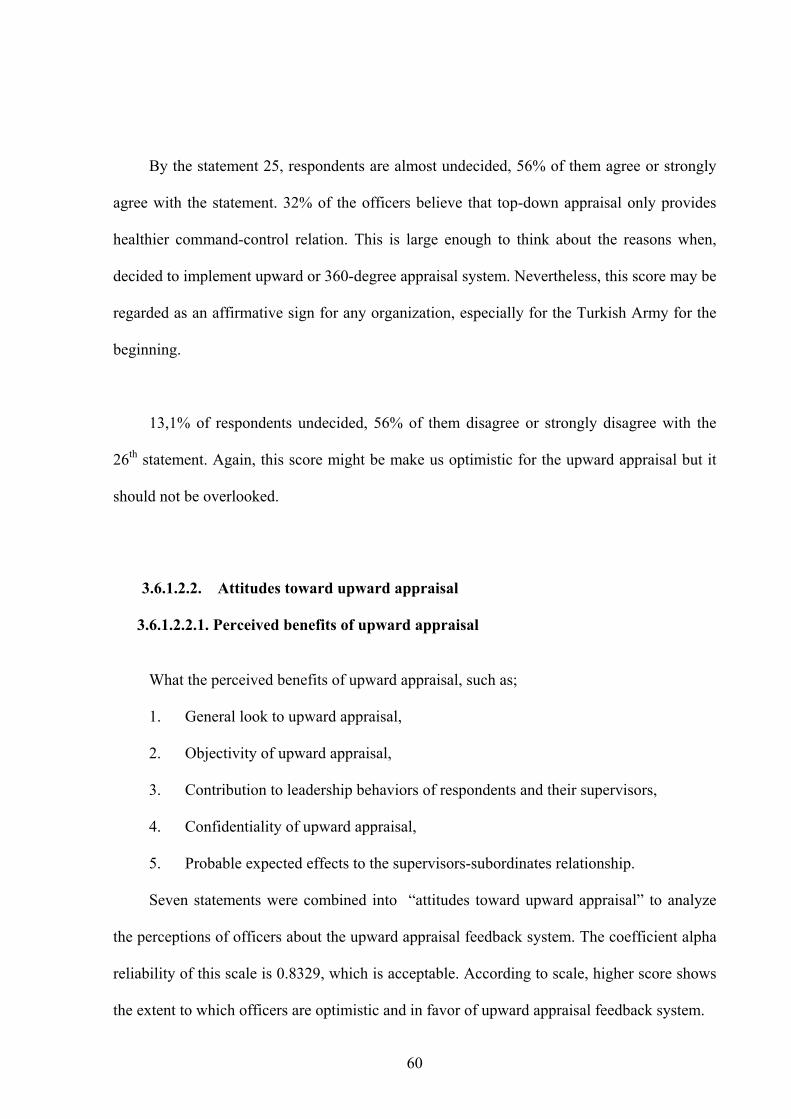
60
By the statement 25, respondents are almost undecided, 56% of them agree or strongly
agree with the statement. 32% of the officers believe that top-down appraisal only provides
healthier command-control relation. This is large enough to think about the reasons when,
decided to implement upward or 360-degree appraisal system. Nevertheless, this score may be
regarded as an affirmative sign for any organization, especially for the Turkish Army for the
beginning.
13,1% of respondents undecided, 56% of them disagree or strongly disagree with the
26th statement. Again, this score might be make us optimistic for the upward appraisal but it
should not be overlooked.
3.6.1.2.2. Attitudes toward upward appraisal
3.6.1.2.2.1. Perceived benefits of upward appraisal
What the perceived benefits of upward appraisal, such as;
1. General look to upward appraisal,
2. Objectivity of upward appraisal,
3. Contribution to leadership behaviors of respondents and their supervisors,
4. Confidentiality of upward appraisal,
5. Probable expected effects to the supervisors-subordinates relationship.
Seven statements were combined into “attitudes toward upward appraisal” to analyze
the perceptions of officers about the upward appraisal feedback system. The coefficient alpha
reliability of this scale is 0.8329, which is acceptable. According to scale, higher score shows
the extent to which officers are optimistic and in favor of upward appraisal feedback system.
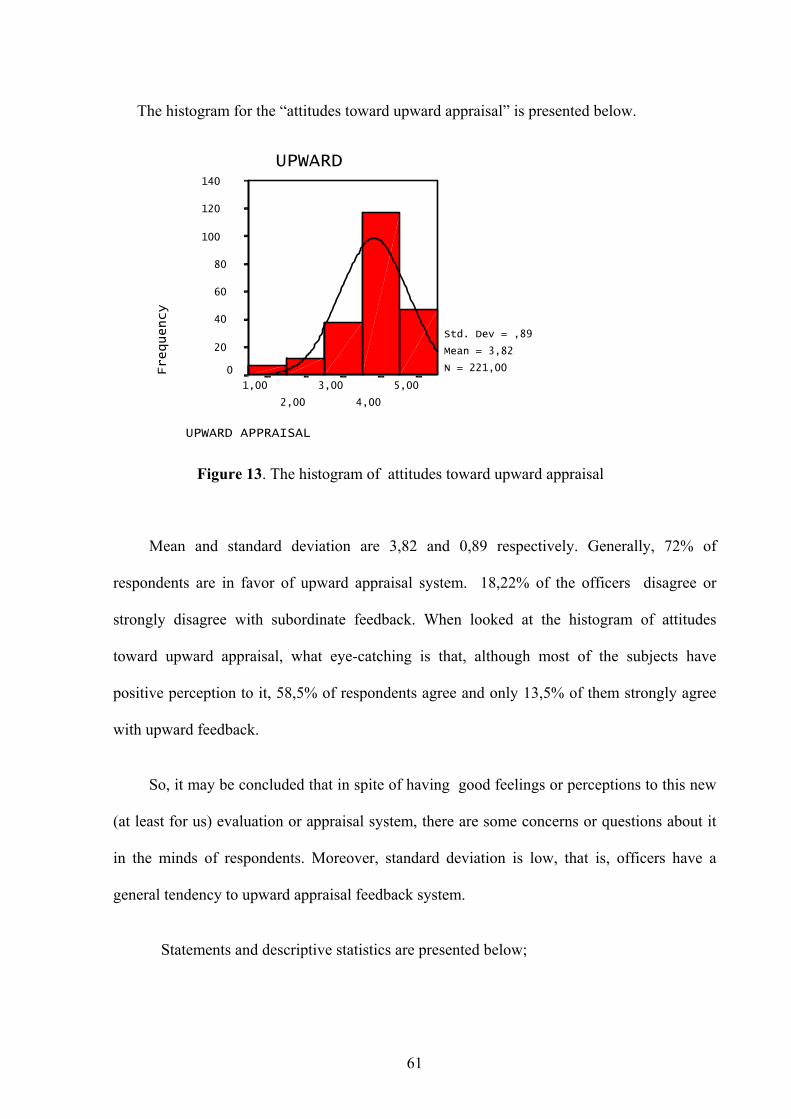
61
The histogram for the “attitudes toward upward appraisal” is presented below.
UPWARD APPRAISAL
5,00
4,00
3,00
2,00
1,00
UPWARDFrequency
140
120
100
80
60
40
20
0
Std. Dev = ,89
Mean = 3,82
N = 221,00
Mean and standard deviation are 3,82 and 0,89 respectively. Generally, 72% of
respondents are in favor of upward appraisal system. 18,22% of the officers disagree or
strongly disagree with subordinate feedback. When looked at the histogram of attitudes
toward upward appraisal, what eye-catching is that, although most of the subjects have
positive perception to it, 58,5% of respondents agree and only 13,5% of them strongly agree
with upward feedback.
So, it may be concluded that in spite of having good feelings or perceptions to this new
(at least for us) evaluation or appraisal system, there are some concerns or questions about it
in the minds of respondents. Moreover, standard deviation is low, that is, officers have a
general tendency to upward appraisal feedback system.
Statements and descriptive statistics are presented below;
Figure 13. The histogram of attitudes toward upward appraisal
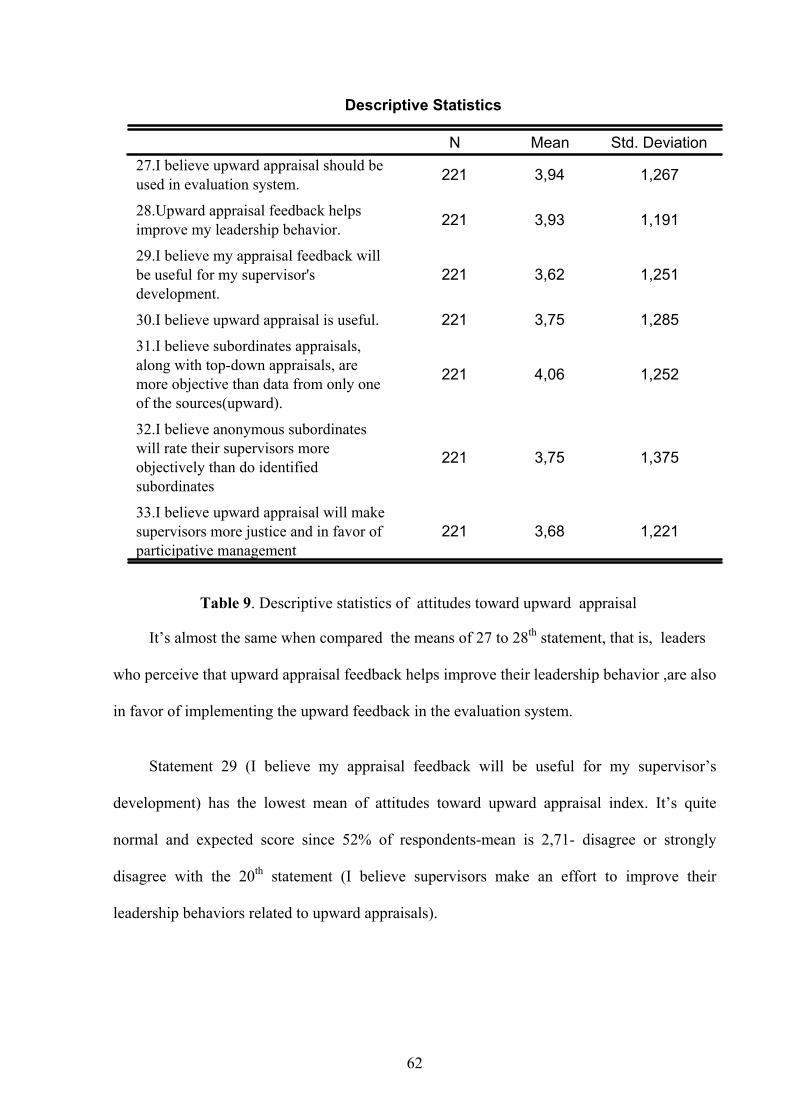
62
Descriptive Statistics
221 3,94 1,267
221 3,93 1,191
221 3,62 1,251
221 3,75 1,285
221 4,06 1,252
221 3,75 1,375
221 3,68 1,221
27.I believe upward appraisal should beused in evaluation system.
28.Upward appraisal feedback helpsimprove my leadership behavior.
29.I believe my appraisal feedback willbe useful for my supervisor'sdevelopment.
30.I believe upward appraisal is useful.
31.I believe subordinates appraisals,along with top-down appraisals, aremore objective than data from only oneof the sources(upward).
32.I believe anonymous subordinateswill rate their supervisors moreobjectively than do identifiedsubordinates
33.I believe upward appraisal will makesupervisors more justice and in favor of participative management
N Mean Std. Deviation
It’s almost the same when compared the means of 27 to 28th statement, that is, leaders
who perceive that upward appraisal feedback helps improve their leadership behavior ,are also
in favor of implementing the upward feedback in the evaluation system.
Statement 29 (I believe my appraisal feedback will be useful for my supervisor’s
development) has the lowest mean of attitudes toward upward appraisal index. It’s quite
normal and expected score since 52% of respondents-mean is 2,71- disagree or strongly
disagree with the 20th statement (I believe supervisors make an effort to improve their
leadership behaviors related to upward appraisals).
Table 9. Descriptive statistics of attitudes toward upward appraisal
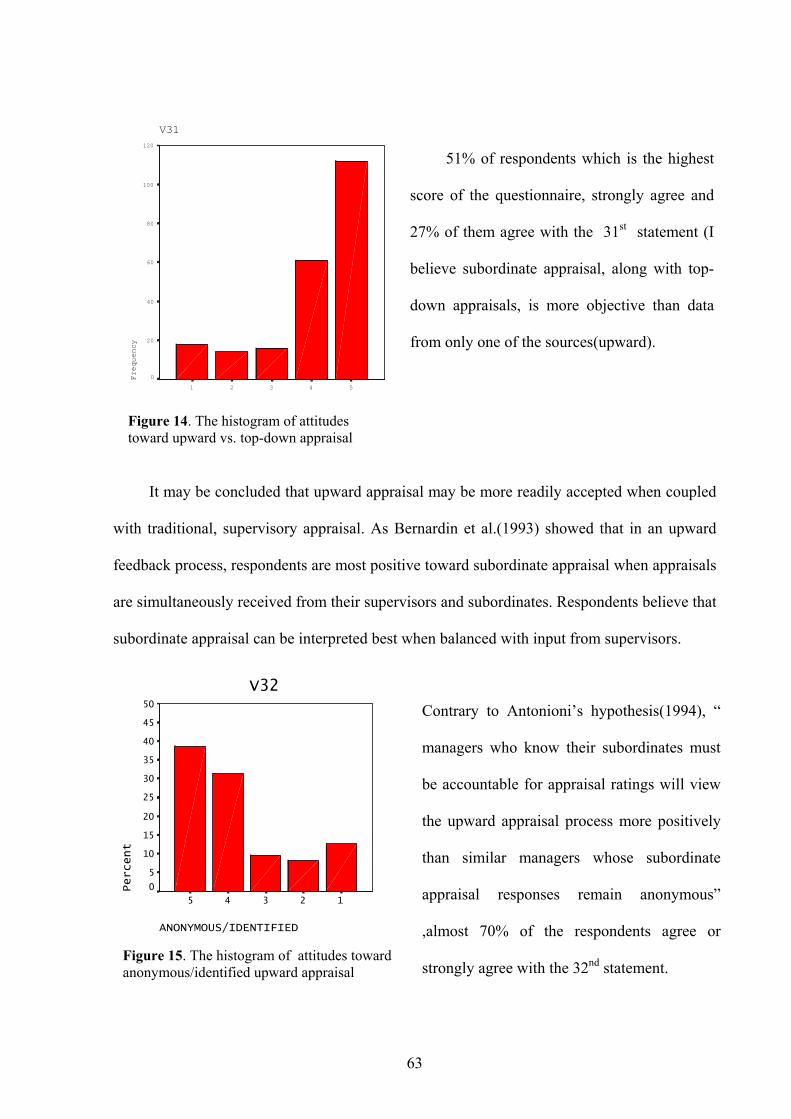
63
V31
54321
Frequency
120
100
80
60
40
20
0
It may be concluded that upward appraisal may be more readily accepted when coupled
with traditional, supervisory appraisal. As Bernardin et al.(1993) showed that in an upward
feedback process, respondents are most positive toward subordinate appraisal when appraisals
are simultaneously received from their supervisors and subordinates. Respondents believe that
subordinate appraisal can be interpreted best when balanced with input from supervisors.
V32
ANONYMOUS/IDENTIFIED
12345
Percent
50
45
40
35
30
25
20
15
10
5
0
51% of respondents which is the highest
score of the questionnaire, strongly agree and
27% of them agree with the 31st statement (I
believe subordinate appraisal, along with top-
down appraisals, is more objective than data
from only one of the sources(upward).
Contrary to Antonioni’s hypothesis(1994), “
managers who know their subordinates must
be accountable for appraisal ratings will view
the upward appraisal process more positively
than similar managers whose subordinate
appraisal responses remain anonymous”
,almost 70% of the respondents agree or
strongly agree with the 32nd statement.Figure 15. The histogram of attitudes towardanonymous/identified upward appraisal
Figure 14. The histogram of attitudestoward upward vs. top-down appraisal
64
The result is very interesting and positive since although the findings which support the
hypothesis, Antonioni (1994) suggested that organizations thinking of implementing upward
appraisal ensure complete response anonymity and confidentiality. It’s understandable that a
subordinate may want their appraisal or feedback to remain anonymous. Because supervisors
have more power in the working relationship than subordinates ,therefore, any reprisal can be
costly.
The mean of statement 33 which is 3, 68 is almost the same with the mean of 24th
statement which is 3, 67 (Top-down appraisal only make the supervisors more selfish and
harsh during the relationships with subordinates-no reversed). So the respondents who believe
the negative effect of top-down appraisal on the behaviors’ of supervisors, also tend to agree
with the 33rd statement (I believe upward appraisal will make supervisors more justice and in
favor of participative management).
3.6.1.2.2.2. Concerns about Upward Appraisal
In this section, the following points are discussed;
What the worries of respondents about upward appraisal may be;
1. Perceived probability of upward appraisal considered as a chance to punish the
supervisors by the raters (subordinates),
2. Supervisors’ expected behavior change,
3. The effects of negative feedback results.
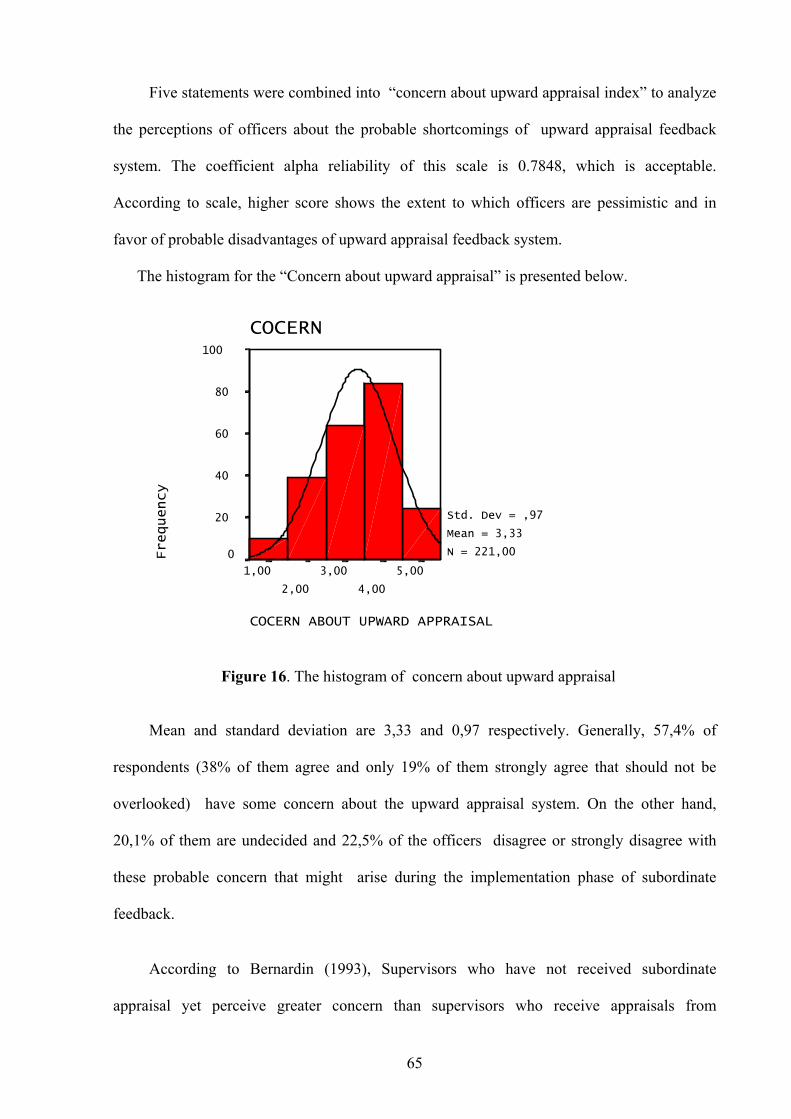
65
Five statements were combined into “concern about upward appraisal index” to analyze
the perceptions of officers about the probable shortcomings of upward appraisal feedback
system. The coefficient alpha reliability of this scale is 0.7848, which is acceptable.
According to scale, higher score shows the extent to which officers are pessimistic and in
favor of probable disadvantages of upward appraisal feedback system.
The histogram for the “Concern about upward appraisal” is presented below.
COCERN ABOUT UPWARD APPRAISAL
5,00
4,00
3,00
2,00
1,00
COCERN
Frequency
100
80
60
40
20
0
Std. Dev = ,97
Mean = 3,33
N = 221,00
Mean and standard deviation are 3,33 and 0,97 respectively. Generally, 57,4% of
respondents (38% of them agree and only 19% of them strongly agree that should not be
overlooked) have some concern about the upward appraisal system. On the other hand,
20,1% of them are undecided and 22,5% of the officers disagree or strongly disagree with
these probable concern that might arise during the implementation phase of subordinate
feedback.
According to Bernardin (1993), Supervisors who have not received subordinate
appraisal yet perceive greater concern than supervisors who receive appraisals from
Figure 16. The histogram of concern about upward appraisal
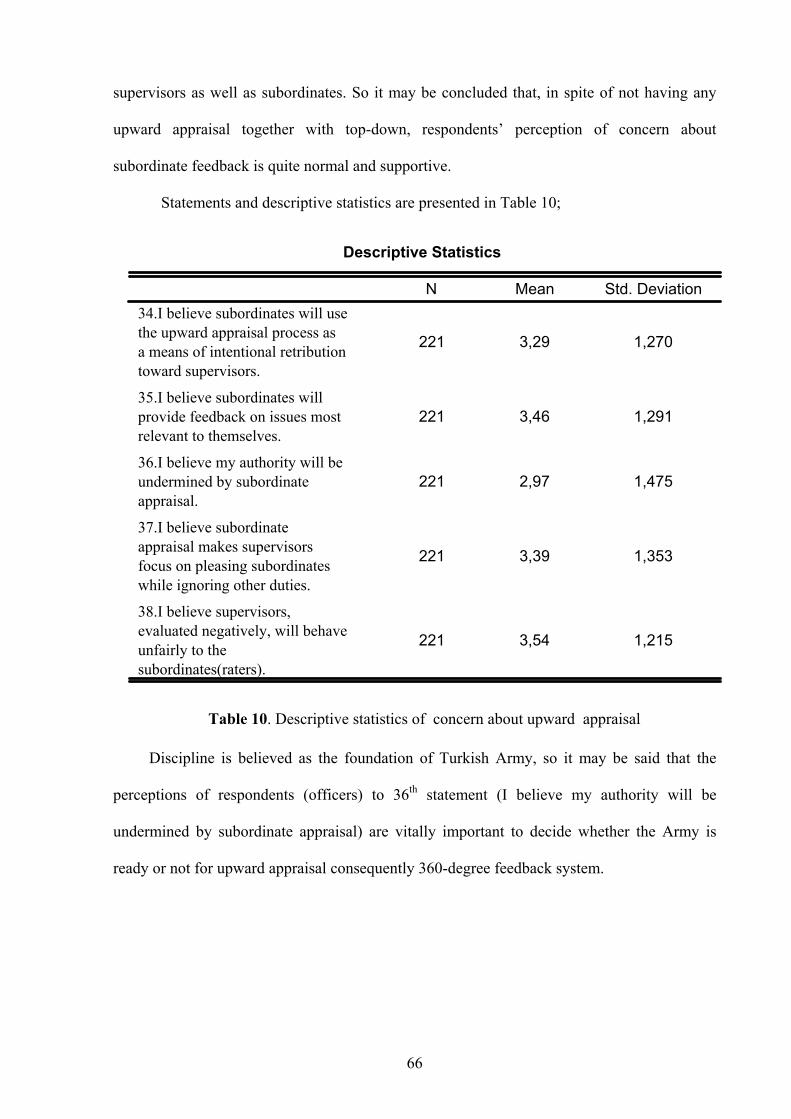
66
supervisors as well as subordinates. So it may be concluded that, in spite of not having any
upward appraisal together with top-down, respondents’ perception of concern about
subordinate feedback is quite normal and supportive.
Statements and descriptive statistics are presented in Table 10;
Descriptive Statistics
221 3,29 1,270
221 3,46 1,291
221 2,97 1,475
221 3,39 1,353
221 3,54 1,215
34.I believe subordinates will usethe upward appraisal process asa means of intentional retributiontoward supervisors.
35.I believe subordinates willprovide feedback on issues mostrelevant to themselves.
36.I believe my authority will beundermined by subordinateappraisal.
37.I believe subordinateappraisal makes supervisorsfocus on pleasing subordinateswhile ignoring other duties.
38.I believe supervisors,evaluated negatively, will behaveunfairly to thesubordinates(raters).
N Mean Std. Deviation
Discipline is believed as the foundation of Turkish Army, so it may be said that the
perceptions of respondents (officers) to 36th statement (I believe my authority will be
undermined by subordinate appraisal) are vitally important to decide whether the Army is
ready or not for upward appraisal consequently 360-degree feedback system.
Table 10. Descriptive statistics of concern about upward appraisal
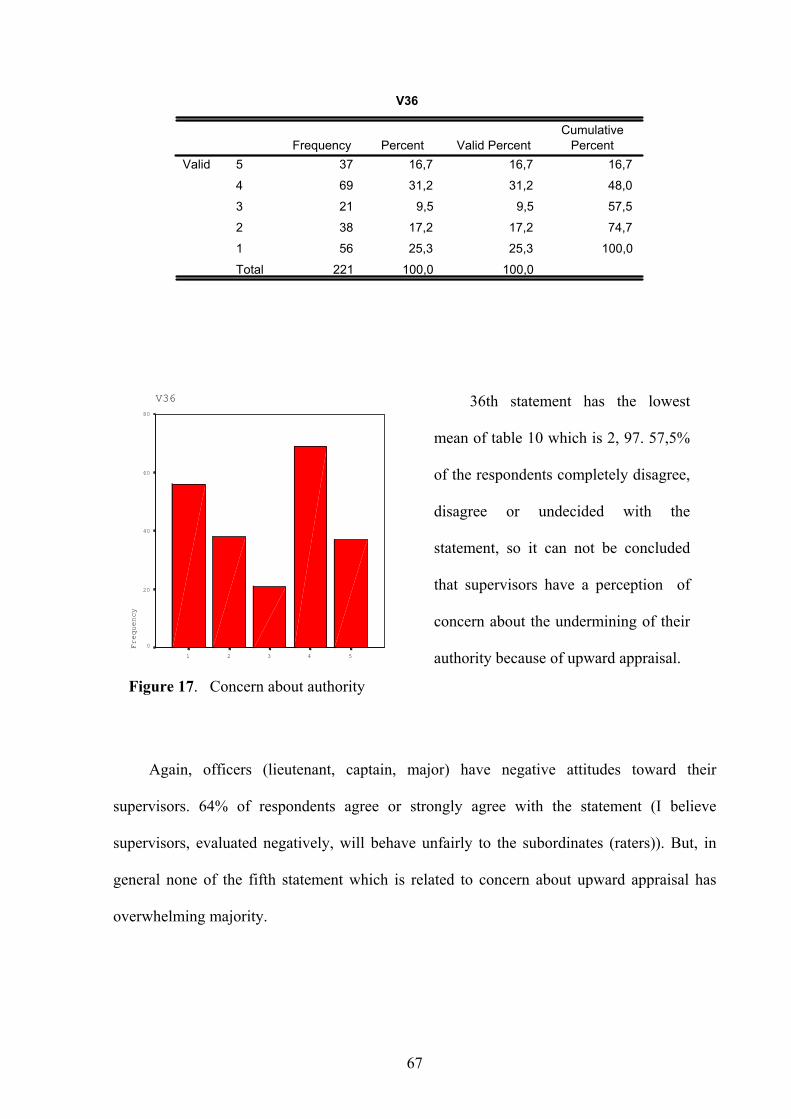
67
V36
37 16,7 16,7 16,769 31,2 31,2 48,021 9,5 9,5 57,538 17,2 17,2 74,756 25,3 25,3 100,0
221 100,0 100,0
54321Total
ValidFrequency Percent Valid Percent
CumulativePercent
V36
54321
Frequency
80
60
40
20
0
Again, officers (lieutenant, captain, major) have negative attitudes toward their
supervisors. 64% of respondents agree or strongly agree with the statement (I believe
supervisors, evaluated negatively, will behave unfairly to the subordinates (raters)). But, in
general none of the fifth statement which is related to concern about upward appraisal has
overwhelming majority.
36th statement has the lowest
mean of table 10 which is 2, 97. 57,5%
of the respondents completely disagree,
disagree or undecided with the
statement, so it can not be concluded
that supervisors have a perception of
concern about the undermining of their
authority because of upward appraisal.
Figure 17. Concern about authority
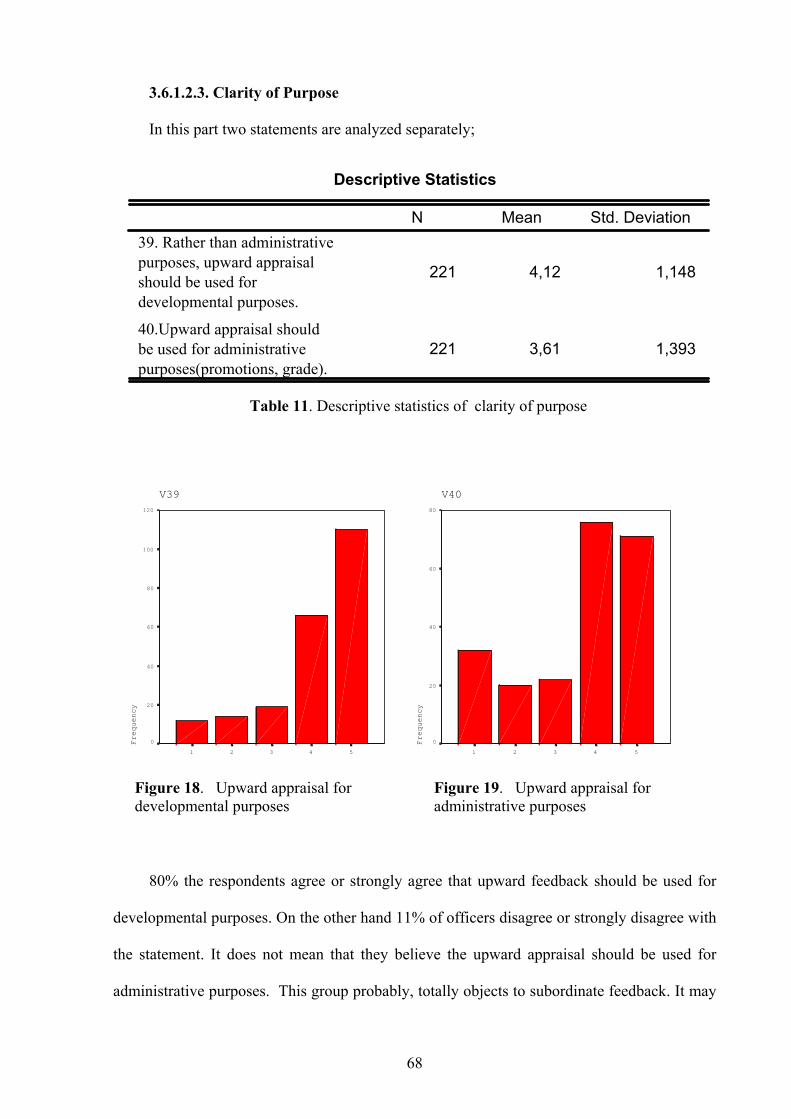
68
3.6.1.2.3. Clarity of Purpose
In this part two statements are analyzed separately;
Descriptive Statistics
221 4,12 1,148
221 3,61 1,393
39. Rather than administrativepurposes, upward appraisalshould be used fordevelopmental purposes.
40.Upward appraisal shouldbe used for administrativepurposes(promotions, grade).
N Mean Std. Deviation
V39
54321
Frequency
120
100
80
60
40
20
0
V40
54321
Frequency
80
60
40
20
0
80% the respondents agree or strongly agree that upward feedback should be used for
developmental purposes. On the other hand 11% of officers disagree or strongly disagree with
the statement. It does not mean that they believe the upward appraisal should be used for
administrative purposes. This group probably, totally objects to subordinate feedback. It may
Table 11. Descriptive statistics of clarity of purpose
Figure 18. Upward appraisal fordevelopmental purposes
Figure 19. Upward appraisal foradministrative purposes
69
be concluded that officers fınd upward feedback more credible, more valuable and easier to
accept and provide when used for developmentally rather than for administrative purposes.
But according to statement 40, mean is 3, 61, to use upward appraisals for
administrative purposes is also acceptable. 66,5% of respondents agree or completely agree
with the 41st statement (Upward appraisal should be used for administrative
purposes(promotion, grade)). So it may be concluded that 14% of respondents who are
supportive of upward appraisal system, believe that subordinate feedback should be used for
only developmental purposes, the remains (66%) are in favor of both of the purposes of
upward appraisal.
It may be advisable for upward appraisals to have a developmental purposes when first
implemented. The objective should be only to provide supervisors with feedback that may
help them improve their leadership behaviors.
3.6.2. NON COMMISSIONED OFFICERS’ RESPONSES
3.6.2.1. THE PERCEPTION OF ORGANIZATIONAL CULTURE
The following points are analyzed in this section;
1. The attitudes, expressed by noncommissioned officers, toward the organization and
units;
2. The perceptions of noncommissioned officers toward supervisors’ leadership style
and power distribution;
3. Perceived competence of raters (subordinates).
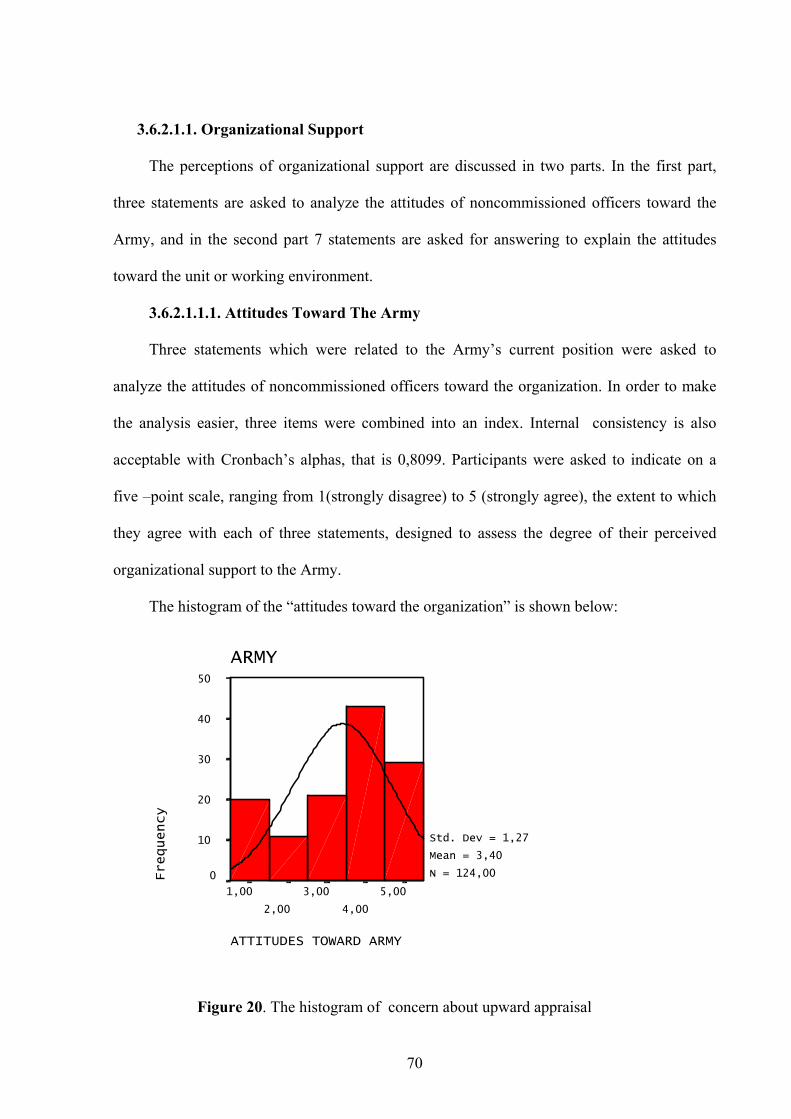
70
3.6.2.1.1. Organizational Support
The perceptions of organizational support are discussed in two parts. In the first part,
three statements are asked to analyze the attitudes of noncommissioned officers toward the
Army, and in the second part 7 statements are asked for answering to explain the attitudes
toward the unit or working environment.
3.6.2.1.1.1. Attitudes Toward The Army
Three statements which were related to the Army’s current position were asked to
analyze the attitudes of noncommissioned officers toward the organization. In order to make
the analysis easier, three items were combined into an index. Internal consistency is also
acceptable with Cronbach’s alphas, that is 0,8099. Participants were asked to indicate on a
five –point scale, ranging from 1(strongly disagree) to 5 (strongly agree), the extent to which
they agree with each of three statements, designed to assess the degree of their perceived
organizational support to the Army.
The histogram of the “attitudes toward the organization” is shown below:
ATTITUDES TOWARD ARMY
5,00
4,00
3,00
2,00
1,00
ARMY
Frequency
50
40
30
20
10
0
Std. Dev = 1,27
Mean = 3,40
N = 124,00
Figure 20. The histogram of concern about upward appraisal
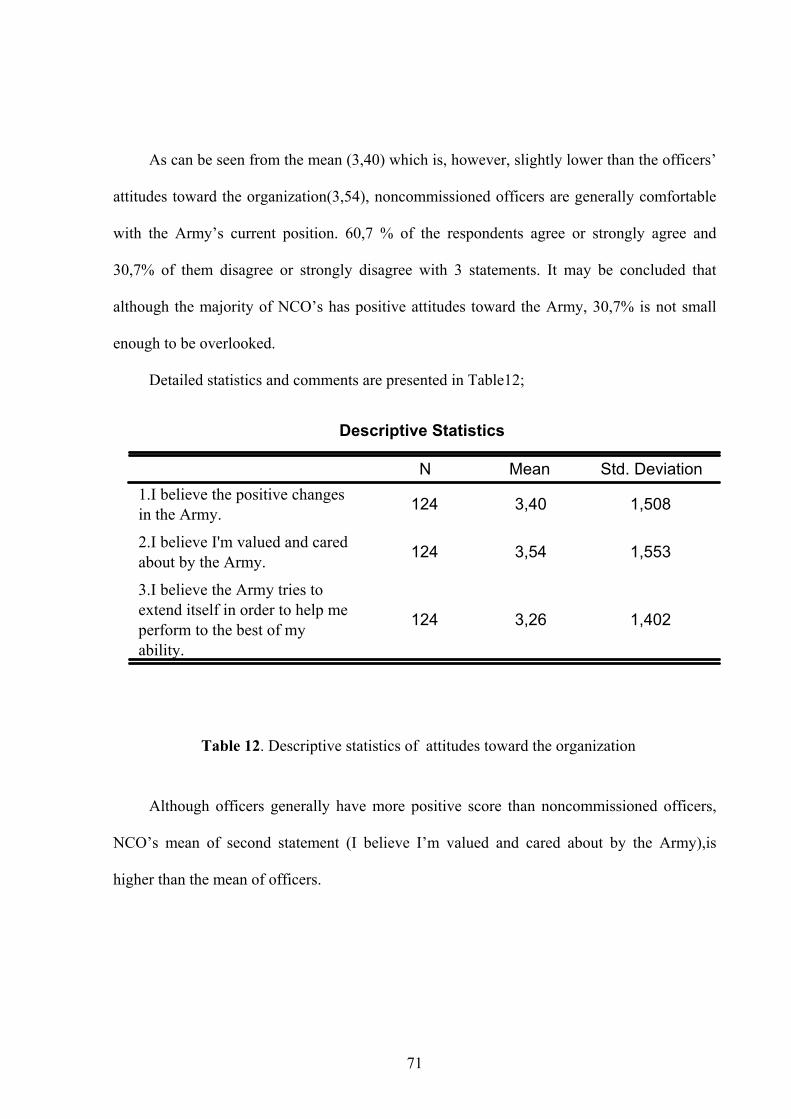
71
As can be seen from the mean (3,40) which is, however, slightly lower than the officers’
attitudes toward the organization(3,54), noncommissioned officers are generally comfortable
with the Army’s current position. 60,7 % of the respondents agree or strongly agree and
30,7% of them disagree or strongly disagree with 3 statements. It may be concluded that
although the majority of NCO’s has positive attitudes toward the Army, 30,7% is not small
enough to be overlooked.
Detailed statistics and comments are presented in Table12;
Descriptive Statistics
124 3,40 1,508
124 3,54 1,553
124 3,26 1,402
1.I believe the positive changesin the Army.
2.I believe I'm valued and caredabout by the Army.
3.I believe the Army tries toextend itself in order to help meperform to the best of myability.
N Mean Std. Deviation
Although officers generally have more positive score than noncommissioned officers,
NCO’s mean of second statement (I believe I’m valued and cared about by the Army),is
higher than the mean of officers.
Table 12. Descriptive statistics of attitudes toward the organization
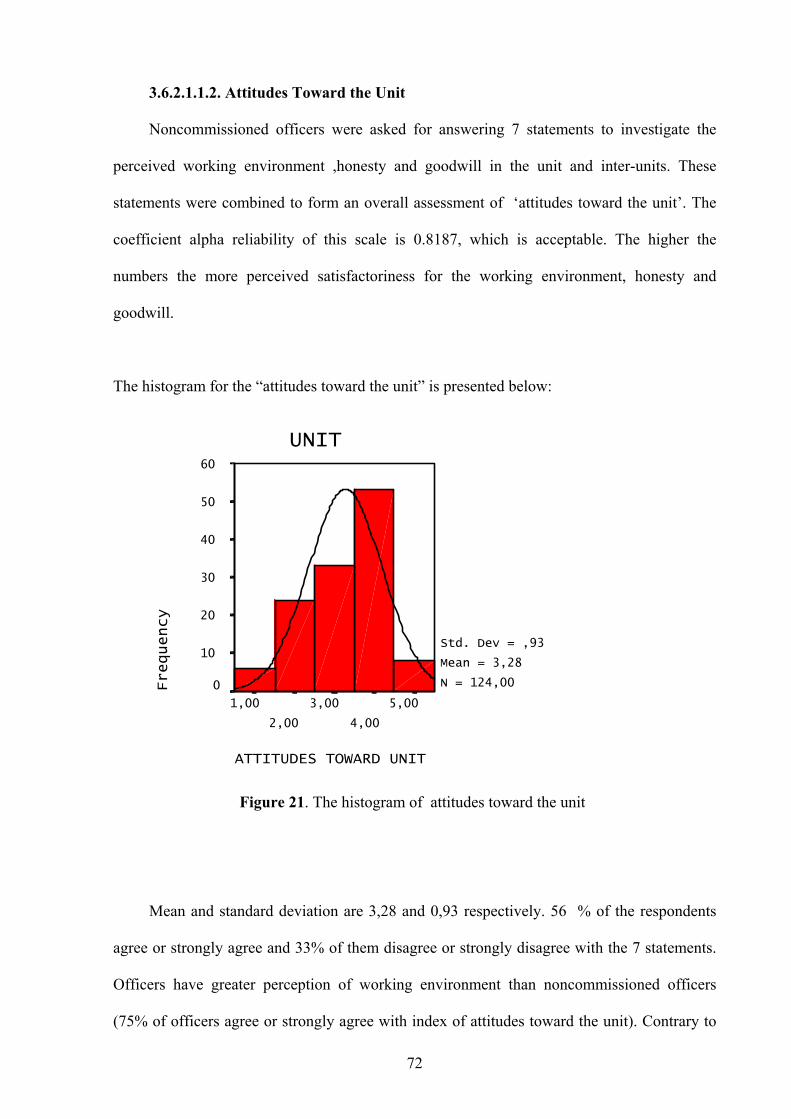
72
3.6.2.1.1.2. Attitudes Toward the Unit
Noncommissioned officers were asked for answering 7 statements to investigate the
perceived working environment ,honesty and goodwill in the unit and inter-units. These
statements were combined to form an overall assessment of ‘attitudes toward the unit’. The
coefficient alpha reliability of this scale is 0.8187, which is acceptable. The higher the
numbers the more perceived satisfactoriness for the working environment, honesty and
goodwill.
The histogram for the “attitudes toward the unit” is presented below:
ATTITUDES TOWARD UNIT
5,00
4,00
3,00
2,00
1,00
UNIT
Frequency
60
50
40
30
20
10
0
Std. Dev = ,93
Mean = 3,28
N = 124,00
Mean and standard deviation are 3,28 and 0,93 respectively. 56 % of the respondents
agree or strongly agree and 33% of them disagree or strongly disagree with the 7 statements.
Officers have greater perception of working environment than noncommissioned officers
(75% of officers agree or strongly agree with index of attitudes toward the unit). Contrary to
Figure 21. The histogram of attitudes toward the unit
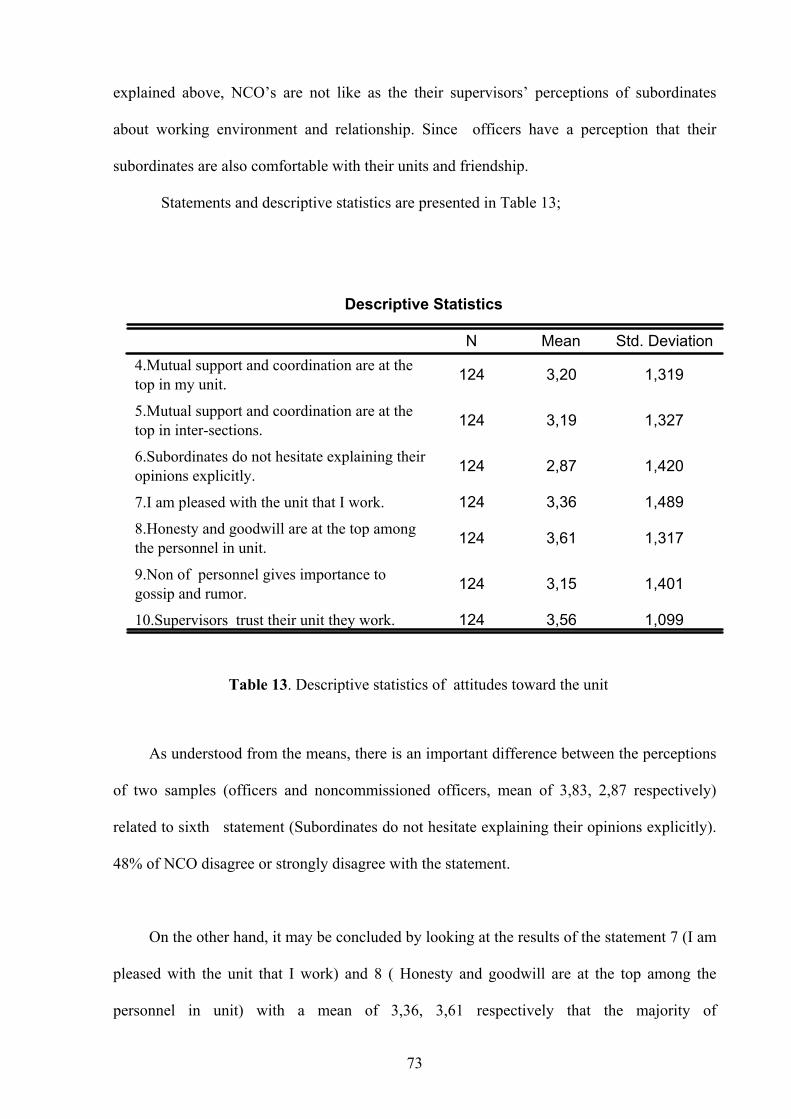
73
explained above, NCO’s are not like as the their supervisors’ perceptions of subordinates
about working environment and relationship. Since officers have a perception that their
subordinates are also comfortable with their units and friendship.
Statements and descriptive statistics are presented in Table 13;
Descriptive Statistics
124 3,20 1,319
124 3,19 1,327
124 2,87 1,420
124 3,36 1,489
124 3,61 1,317
124 3,15 1,401
124 3,56 1,099
4.Mutual support and coordination are at thetop in my unit.
5.Mutual support and coordination are at thetop in inter-sections.
6.Subordinates do not hesitate explaining theiropinions explicitly.
7.I am pleased with the unit that I work.
8.Honesty and goodwill are at the top amongthe personnel in unit.
9.Non of personnel gives importance togossip and rumor.
10.Supervisors trust their unit they work.
N Mean Std. Deviation
As understood from the means, there is an important difference between the perceptions
of two samples (officers and noncommissioned officers, mean of 3,83, 2,87 respectively)
related to sixth statement (Subordinates do not hesitate explaining their opinions explicitly).
48% of NCO disagree or strongly disagree with the statement.
On the other hand, it may be concluded by looking at the results of the statement 7 (I am
pleased with the unit that I work) and 8 ( Honesty and goodwill are at the top among the
personnel in unit) with a mean of 3,36, 3,61 respectively that the majority of
Table 13. Descriptive statistics of attitudes toward the unit

74
noncommissioned officers have affirmative perceptions to working environment and
relationships. Also NCO’s have affirmative attitudes toward their supervisors perceived trust
to their units (Related item number 10).
3.6.2.1.2. The Perception of Trust
In this section the following points are discussed to analyze the attitudes toward
supervisors;
1. Perceived management style,
2. The level of trust to supervisors,
3. Respondents’ perceptions to their supervisors’ attitudes,
4. Perceived expected reactions of supervisors to upward appraisal,
5. Perceived trust of supervisors,
6. General perceptions of supervisors,
Eight statements were asked to analyze the attitudes of noncommissioned officers
toward their supervisors. In order to make all these analysis easier, these eight statements
were combined into an index of ‘attitudes toward supervisors’. The coefficient alpha
reliability of this scale is 0.8940, which is acceptable. According to scale, higher score shows
the extent to which noncommissioned officers are optimistic about their supervisor’s
behaviors and management style.
The histogram for the “attitudes toward supervisors” is presented below;
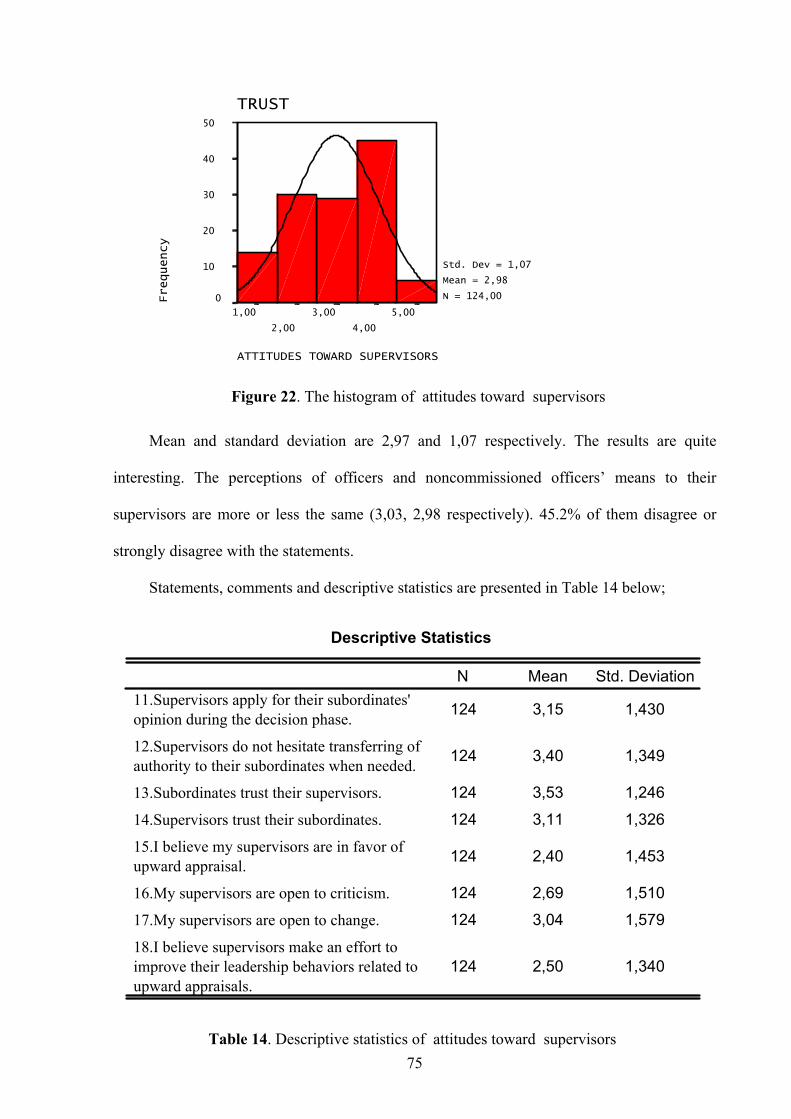
75
ATTITUDES TOWARD SUPERVISORS
5,00
4,00
3,00
2,00
1,00
TRUST
Frequency
50
40
30
20
10
0
Std. Dev = 1,07
Mean = 2,98
N = 124,00
Mean and standard deviation are 2,97 and 1,07 respectively. The results are quite
interesting. The perceptions of officers and noncommissioned officers’ means to their
supervisors are more or less the same (3,03, 2,98 respectively). 45.2% of them disagree or
strongly disagree with the statements.
Statements, comments and descriptive statistics are presented in Table 14 below;
Descriptive Statistics
124 3,15 1,430
124 3,40 1,349
124 3,53 1,246124 3,11 1,326
124 2,40 1,453
124 2,69 1,510124 3,04 1,579
124 2,50 1,340
11.Supervisors apply for their subordinates'opinion during the decision phase.
12.Supervisors do not hesitate transferring ofauthority to their subordinates when needed.
13.Subordinates trust their supervisors.
14.Supervisors trust their subordinates.
15.I believe my supervisors are in favor ofupward appraisal.
16.My supervisors are open to criticism.
17.My supervisors are open to change.
18.I believe supervisors make an effort toimprove their leadership behaviors related toupward appraisals.
N Mean Std. Deviation
Figure 22. The histogram of attitudes toward supervisors
Table 14. Descriptive statistics of attitudes toward supervisors
76
When looked only at the mean of attitudes toward supervisors, or the result of 15th
statement (56,4 of respondents disagree or strongly disagree), there seems to be a negative
perceptions to the supervisors, but some statements which are directly related to the sense of
trust and management style , explicitly show that, it is not the case in real.
For example, 64,5% of respondents agree or strongly agree with the 14th statement
(Subordinates trust their supervisors), or %62,1 of them agree or strongly agree with the 12th
statement (Supervisors do not hesitate transferring of authority to their subordinates when
needed). Also officers’ answers to 17th statement (mean is 3,99) support the NCO’s results
that, although there are some negative attitudes toward supervisors, sense of trust and
management style might be a supportive sign for the organizations thinking of implementing
upward feedback system.
3.6.2.1.3. Perceived Competence of Raters
In this section the following points are discussed;
1. The noncommissioned officers belief about whether or not they have the ability to
rate their performance,
2. Assessment of raters’ perceptions that they have requisite skills to provide accurate
ratings,
3. Whether or not, there is a perceived lack of opportunity of subordinates about
observing ratees’ performance.
Three statements were combined into a “perceived competence of raters index” to
analyze the perceptions of noncommissioned officers about the raters (subordinates) or
themselves. The coefficient alpha reliability of this scale is 0.89433, which is acceptable.
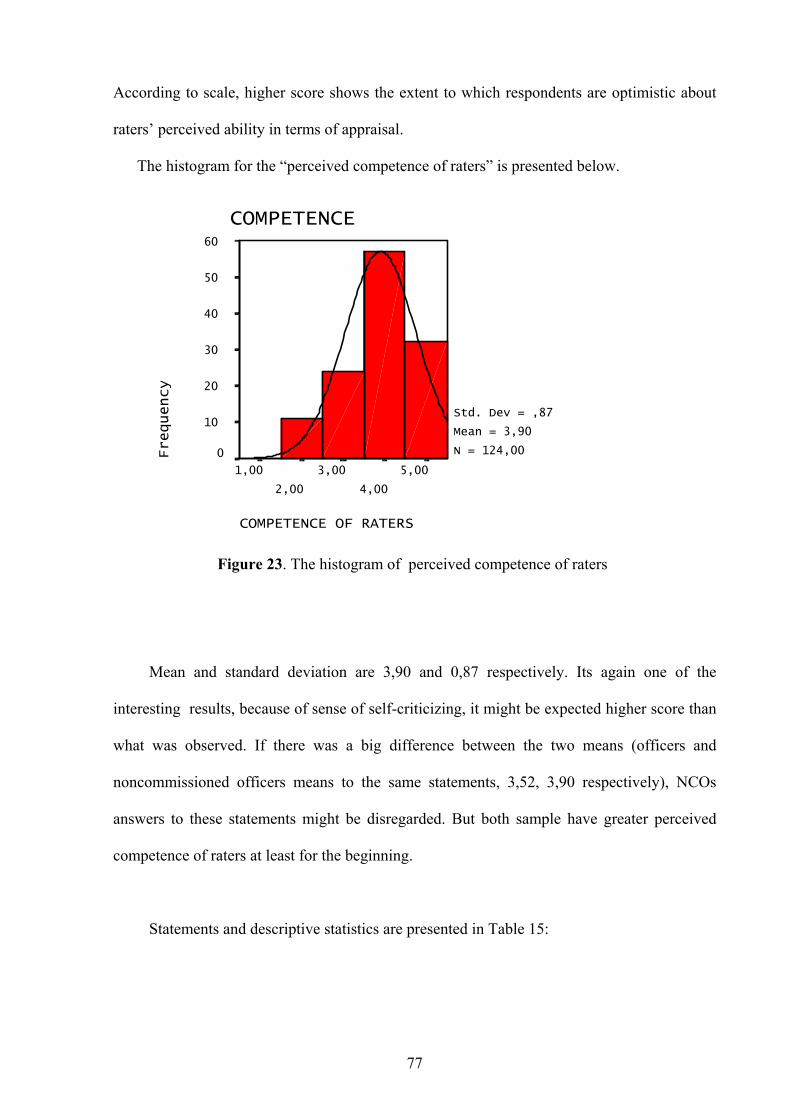
77
According to scale, higher score shows the extent to which respondents are optimistic about
raters’ perceived ability in terms of appraisal.
The histogram for the “perceived competence of raters” is presented below.
COMPETENCE OF RATERS
5,00
4,00
3,00
2,00
1,00
COMPETENCE
Frequency
60
50
40
30
20
10
0
Std. Dev = ,87
Mean = 3,90
N = 124,00
Mean and standard deviation are 3,90 and 0,87 respectively. Its again one of the
interesting results, because of sense of self-criticizing, it might be expected higher score than
what was observed. If there was a big difference between the two means (officers and
noncommissioned officers means to the same statements, 3,52, 3,90 respectively), NCOs
answers to these statements might be disregarded. But both sample have greater perceived
competence of raters at least for the beginning.
Statements and descriptive statistics are presented in Table 15:
Figure 23. The histogram of perceived competence of raters
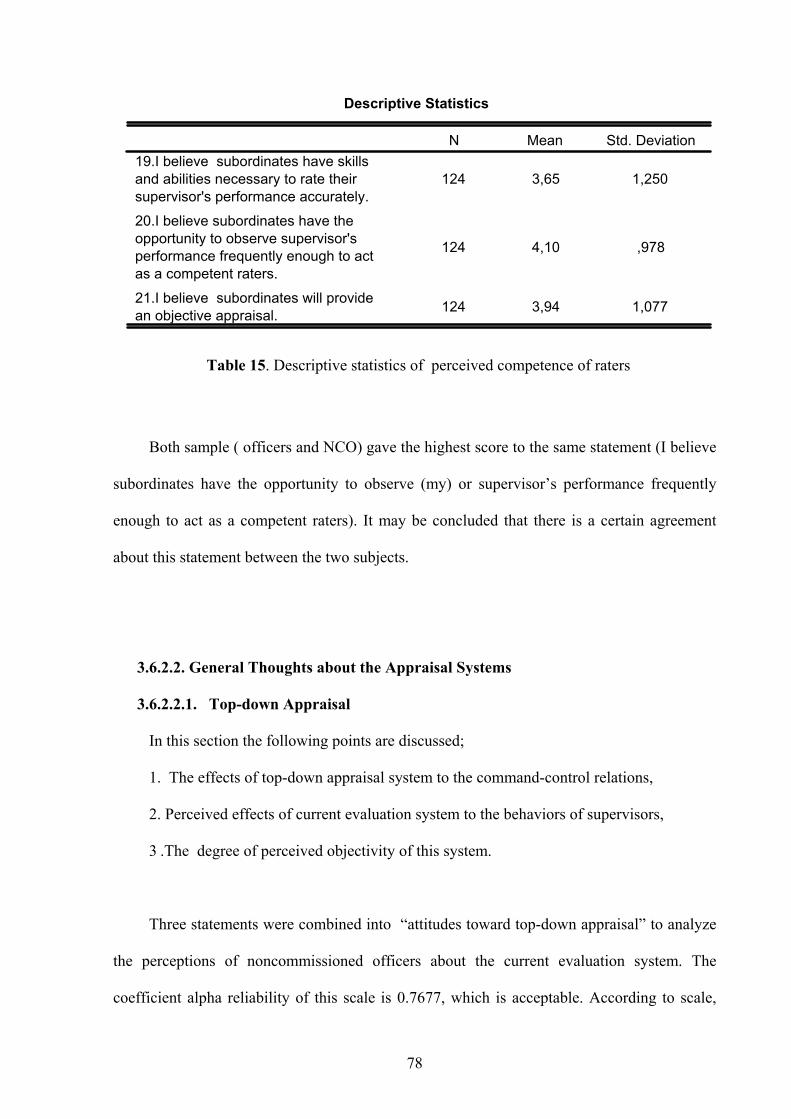
78
Descriptive Statistics
124 3,65 1,250
124 4,10 ,978
124 3,94 1,077
19.I believe subordinates have skillsand abilities necessary to rate theirsupervisor's performance accurately.20.I believe subordinates have theopportunity to observe supervisor'sperformance frequently enough to actas a competent raters.21.I believe subordinates will providean objective appraisal.
N Mean Std. Deviation
Both sample ( officers and NCO) gave the highest score to the same statement (I believe
subordinates have the opportunity to observe (my) or supervisor’s performance frequently
enough to act as a competent raters). It may be concluded that there is a certain agreement
about this statement between the two subjects.
3.6.2.2. General Thoughts about the Appraisal Systems
3.6.2.2.1. Top-down Appraisal
In this section the following points are discussed;
1. The effects of top-down appraisal system to the command-control relations,
2. Perceived effects of current evaluation system to the behaviors of supervisors,
3 .The degree of perceived objectivity of this system.
Three statements were combined into “attitudes toward top-down appraisal” to analyze
the perceptions of noncommissioned officers about the current evaluation system. The
coefficient alpha reliability of this scale is 0.7677, which is acceptable. According to scale,
Table 15. Descriptive statistics of perceived competence of raters

79
higher score shows the extent to which NCO’s are optimistic and in favor of current
evaluation(downward feedback) system. 22nd statement was reversed.
The histogram for the “attitudes toward top-down appraisal” is presented below.
ATTITUDES TOWARD TOP_DOWN
5,00
4,00
3,00
2,00
1,00
TOP_DOWN
Frequency
60
50
40
30
20
10
0
Std. Dev = 1,21
Mean = 2,32
N = 124,00
Mean and standard deviation are 2,32 and 1,21 respectively. 62,9% of respondents are
not comfortable with the top-down appraisal (current evaluation system) system. Its higher
when compared to officers’ score (mean of officers is 2,90). Its quite normal since
noncommissioned officers do not have any authority on current evaluation system.
Statements and descriptive statistics are presented in Table 16;
Figure 24. The histogram of attitudes toward top-down appraisal
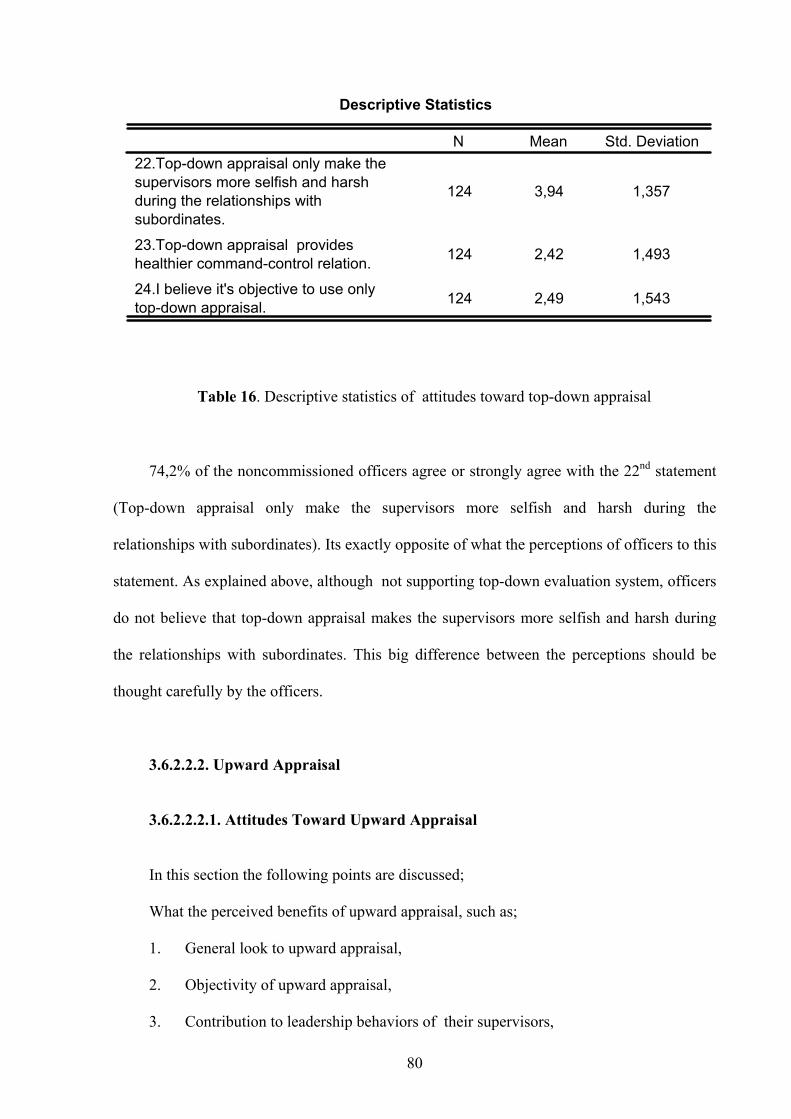
80
Descriptive Statistics
124 3,94 1,357
124 2,42 1,493
124 2,49 1,543
22.Top-down appraisal only make thesupervisors more selfish and harshduring the relationships withsubordinates.23.Top-down appraisal provideshealthier command-control relation.24.I believe it's objective to use onlytop-down appraisal.
N Mean Std. Deviation
74,2% of the noncommissioned officers agree or strongly agree with the 22nd statement
(Top-down appraisal only make the supervisors more selfish and harsh during the
relationships with subordinates). Its exactly opposite of what the perceptions of officers to this
statement. As explained above, although not supporting top-down evaluation system, officers
do not believe that top-down appraisal makes the supervisors more selfish and harsh during
the relationships with subordinates. This big difference between the perceptions should be
thought carefully by the officers.
3.6.2.2.2. Upward Appraisal
3.6.2.2.2.1. Attitudes Toward Upward Appraisal
In this section the following points are discussed;
What the perceived benefits of upward appraisal, such as;
1. General look to upward appraisal,
2. Objectivity of upward appraisal,
3. Contribution to leadership behaviors of their supervisors,
Table 16. Descriptive statistics of attitudes toward top-down appraisal
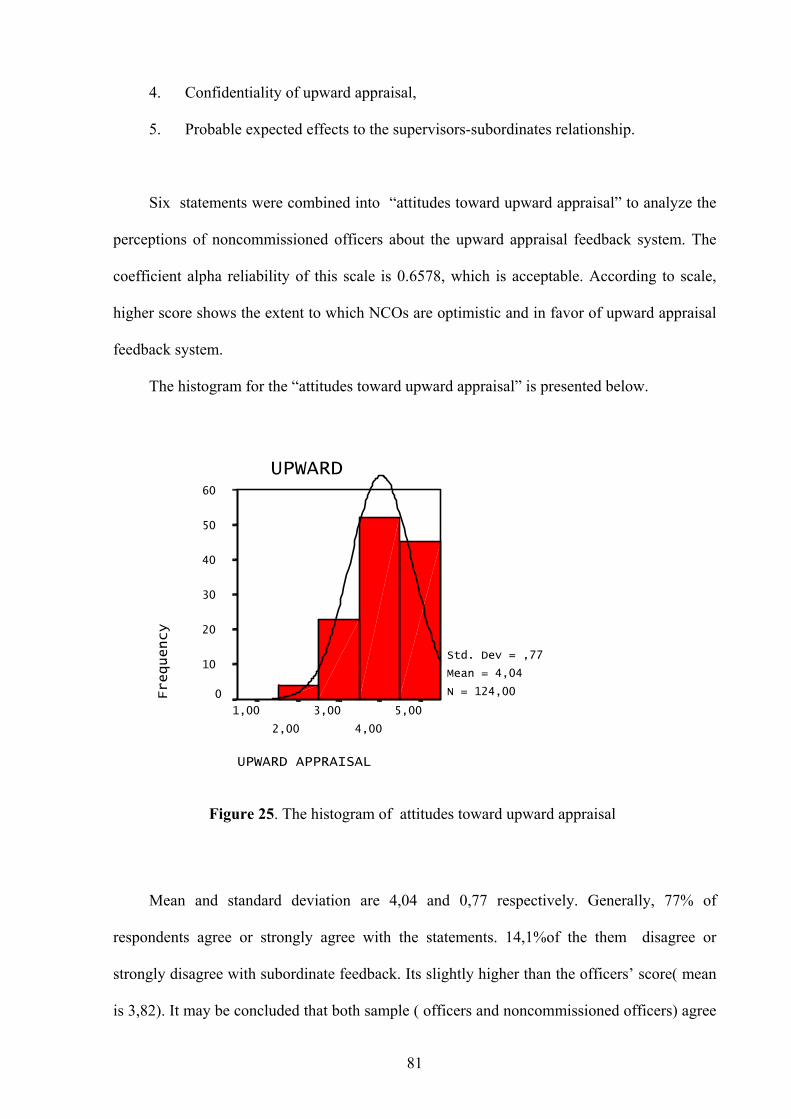
81
4. Confidentiality of upward appraisal,
5. Probable expected effects to the supervisors-subordinates relationship.
Six statements were combined into “attitudes toward upward appraisal” to analyze the
perceptions of noncommissioned officers about the upward appraisal feedback system. The
coefficient alpha reliability of this scale is 0.6578, which is acceptable. According to scale,
higher score shows the extent to which NCOs are optimistic and in favor of upward appraisal
feedback system.
The histogram for the “attitudes toward upward appraisal” is presented below.
UPWARD APPRAISAL
5,00
4,00
3,00
2,00
1,00
UPWARD
Frequency
60
50
40
30
20
10
0
Std. Dev = ,77
Mean = 4,04
N = 124,00
Mean and standard deviation are 4,04 and 0,77 respectively. Generally, 77% of
respondents agree or strongly agree with the statements. 14,1%of the them disagree or
strongly disagree with subordinate feedback. Its slightly higher than the officers’ score( mean
is 3,82). It may be concluded that both sample ( officers and noncommissioned officers) agree
Figure 25. The histogram of attitudes toward upward appraisal
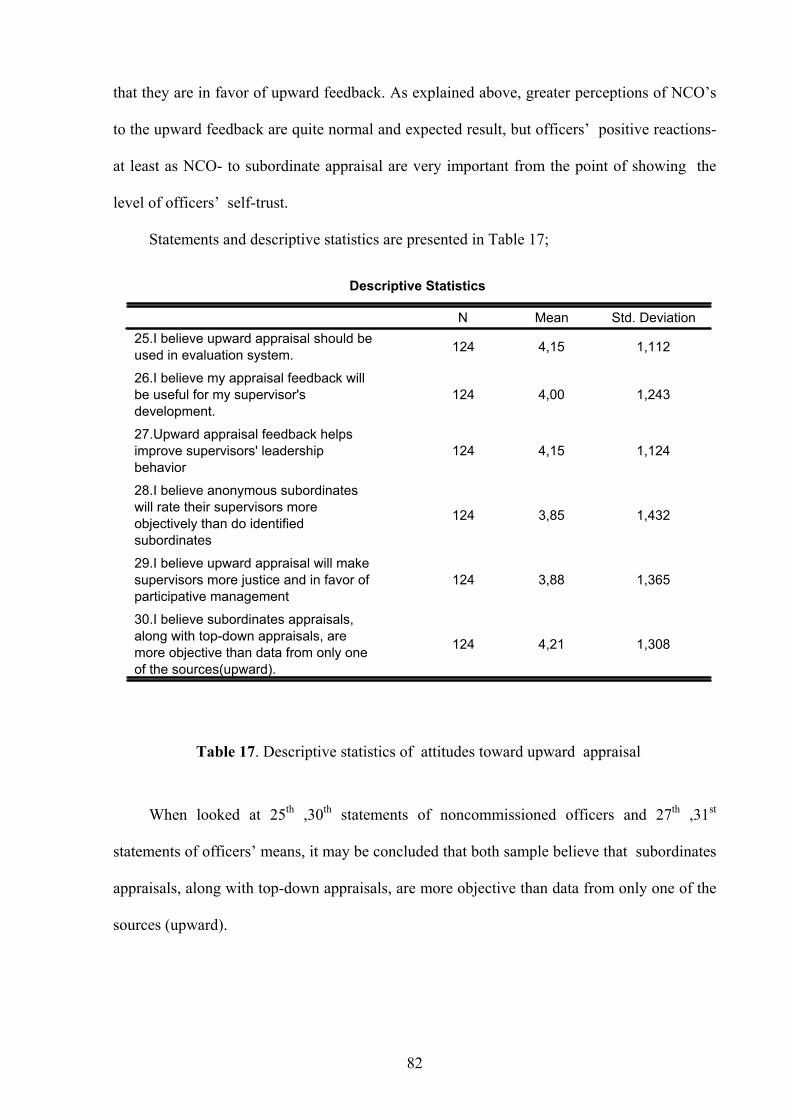
82
that they are in favor of upward feedback. As explained above, greater perceptions of NCO’s
to the upward feedback are quite normal and expected result, but officers’ positive reactions-
at least as NCO- to subordinate appraisal are very important from the point of showing the
level of officers’ self-trust.
Statements and descriptive statistics are presented in Table 17;
Descriptive Statistics
124 4,15 1,112
124 4,00 1,243
124 4,15 1,124
124 3,85 1,432
124 3,88 1,365
124 4,21 1,308
25.I believe upward appraisal should beused in evaluation system.26.I believe my appraisal feedback willbe useful for my supervisor'sdevelopment.27.Upward appraisal feedback helpsimprove supervisors' leadershipbehavior28.I believe anonymous subordinateswill rate their supervisors moreobjectively than do identifiedsubordinates29.I believe upward appraisal will makesupervisors more justice and in favor of participative management30.I believe subordinates appraisals,along with top-down appraisals, aremore objective than data from only oneof the sources(upward).
N Mean Std. Deviation
When looked at 25th ,30th statements of noncommissioned officers and 27th ,31st
statements of officers’ means, it may be concluded that both sample believe that subordinates
appraisals, along with top-down appraisals, are more objective than data from only one of the
sources (upward).
Table 17. Descriptive statistics of attitudes toward upward appraisal
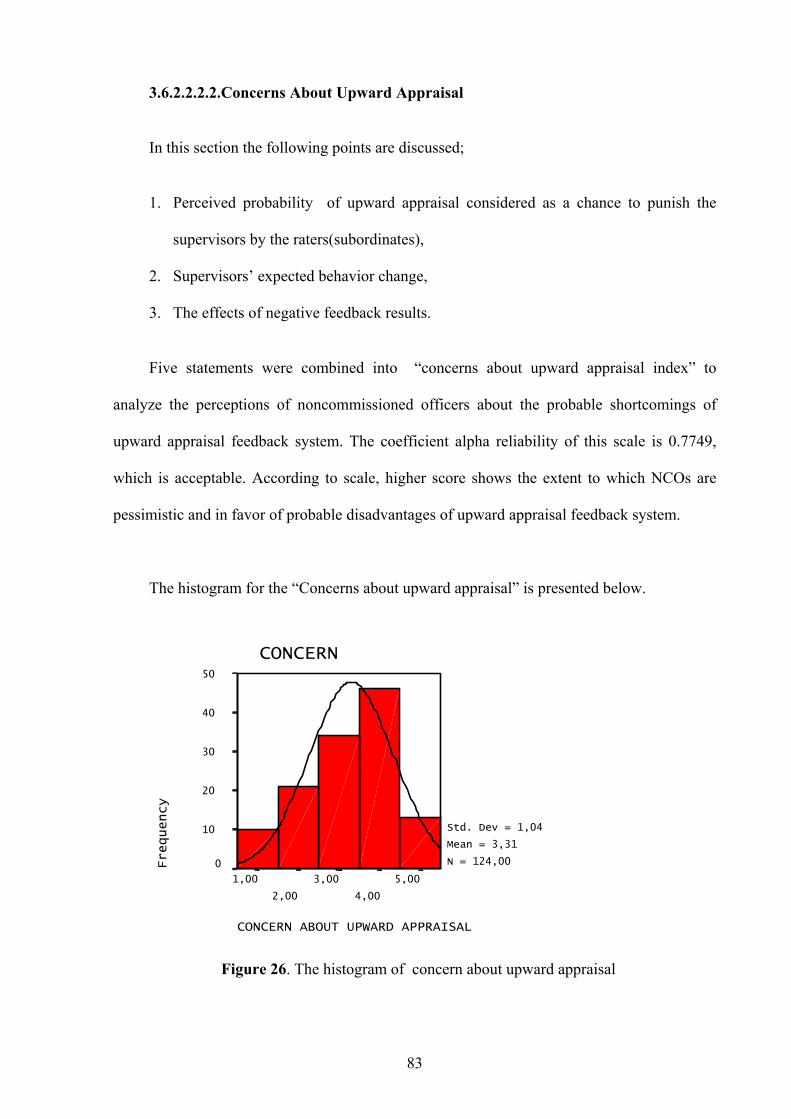
83
3.6.2.2.2.2. Concerns About Upward Appraisal
In this section the following points are discussed;
1. Perceived probability of upward appraisal considered as a chance to punish the
supervisors by the raters(subordinates),
2. Supervisors’ expected behavior change,
3. The effects of negative feedback results.
Five statements were combined into “concerns about upward appraisal index” to
analyze the perceptions of noncommissioned officers about the probable shortcomings of
upward appraisal feedback system. The coefficient alpha reliability of this scale is 0.7749,
which is acceptable. According to scale, higher score shows the extent to which NCOs are
pessimistic and in favor of probable disadvantages of upward appraisal feedback system.
The histogram for the “Concerns about upward appraisal” is presented below.
CONCERN ABOUT UPWARD APPRAISAL
5,00
4,00
3,00
2,00
1,00
CONCERN
Frequency
50
40
30
20
10
0
Std. Dev = 1,04
Mean = 3,31
N = 124,00
Figure 26. The histogram of concern about upward appraisal
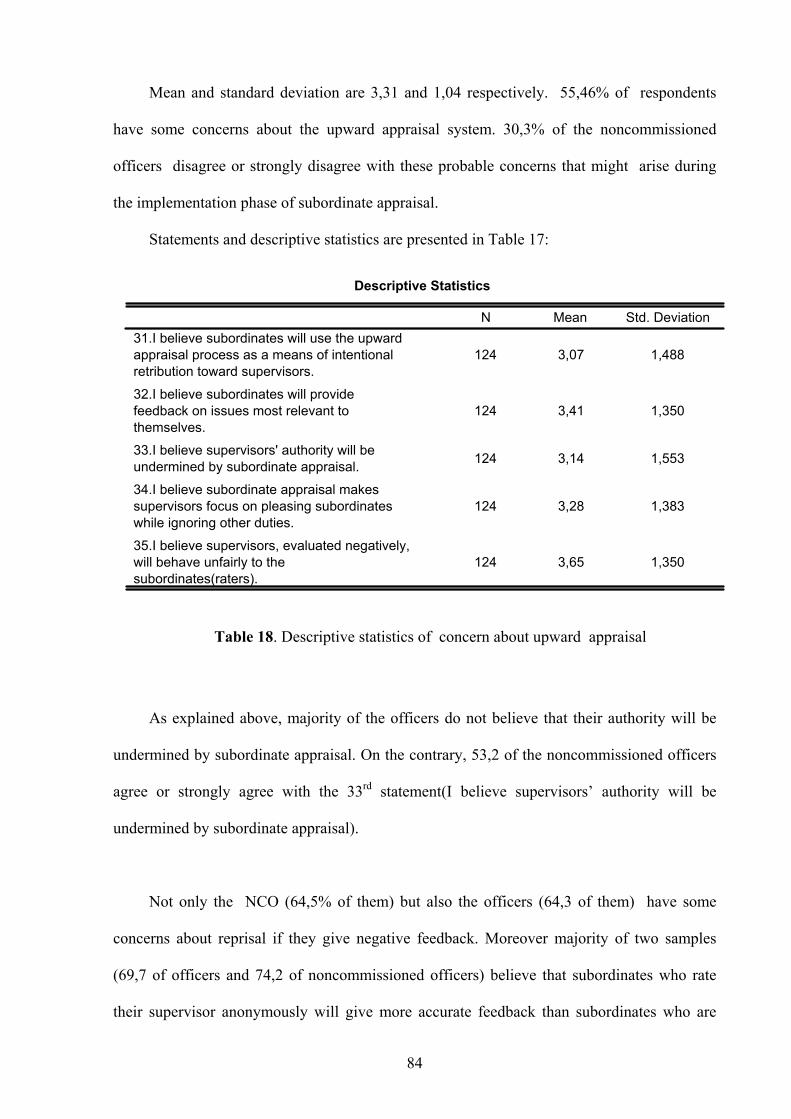
84
Mean and standard deviation are 3,31 and 1,04 respectively. 55,46% of respondents
have some concerns about the upward appraisal system. 30,3% of the noncommissioned
officers disagree or strongly disagree with these probable concerns that might arise during
the implementation phase of subordinate appraisal.
Statements and descriptive statistics are presented in Table 17:
Descriptive Statistics
124 3,07 1,488
124 3,41 1,350
124 3,14 1,553
124 3,28 1,383
124 3,65 1,350
31.I believe subordinates will use the upwardappraisal process as a means of intentionalretribution toward supervisors.32.I believe subordinates will providefeedback on issues most relevant tothemselves.33.I believe supervisors' authority will beundermined by subordinate appraisal.34.I believe subordinate appraisal makessupervisors focus on pleasing subordinateswhile ignoring other duties.35.I believe supervisors, evaluated negatively,will behave unfairly to thesubordinates(raters).
N Mean Std. Deviation
As explained above, majority of the officers do not believe that their authority will be
undermined by subordinate appraisal. On the contrary, 53,2 of the noncommissioned officers
agree or strongly agree with the 33rd statement(I believe supervisors’ authority will be
undermined by subordinate appraisal).
Not only the NCO (64,5% of them) but also the officers (64,3 of them) have some
concerns about reprisal if they give negative feedback. Moreover majority of two samples
(69,7 of officers and 74,2 of noncommissioned officers) believe that subordinates who rate
their supervisor anonymously will give more accurate feedback than subordinates who are
Table 18. Descriptive statistics of concern about upward appraisal
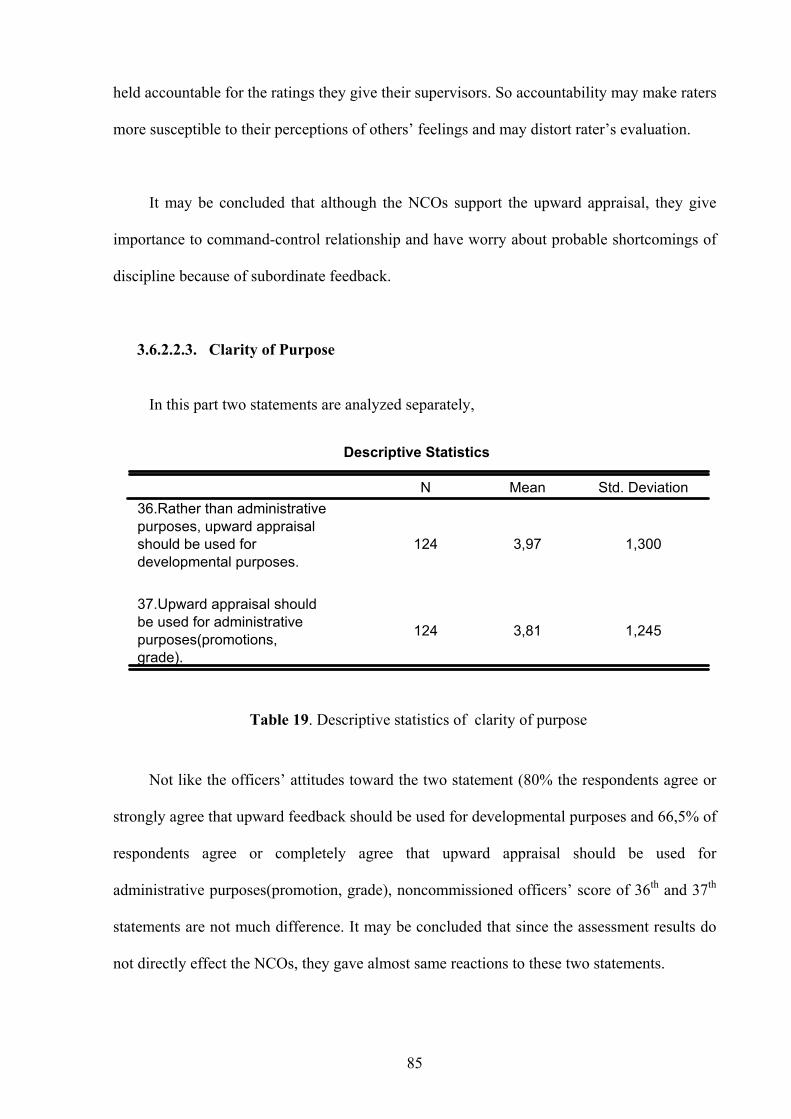
85
held accountable for the ratings they give their supervisors. So accountability may make raters
more susceptible to their perceptions of others’ feelings and may distort rater’s evaluation.
It may be concluded that although the NCOs support the upward appraisal, they give
importance to command-control relationship and have worry about probable shortcomings of
discipline because of subordinate feedback.
3.6.2.2.3. Clarity of Purpose
In this part two statements are analyzed separately,
Descriptive Statistics
124 3,97 1,300
124 3,81 1,245
36.Rather than administrativepurposes, upward appraisalshould be used fordevelopmental purposes.
37.Upward appraisal shouldbe used for administrativepurposes(promotions,grade).
N Mean Std. Deviation
Not like the officers’ attitudes toward the two statement (80% the respondents agree or
strongly agree that upward feedback should be used for developmental purposes and 66,5% of
respondents agree or completely agree that upward appraisal should be used for
administrative purposes(promotion, grade), noncommissioned officers’ score of 36th and 37th
statements are not much difference. It may be concluded that since the assessment results do
not directly effect the NCOs, they gave almost same reactions to these two statements.
Table 19. Descriptive statistics of clarity of purpose
86
3.7. RESULTS OF HYPOTHESIS
Correlational analyses were used to test the hypotheses. Attitudes toward upward
appraisal system are the main focus of this study. Appendices B present the intercorrelations
among the variables.
3.7.1. ORGANIZATIONAL SUPPORT
Hypothesis 1a, 1b examines the relationship between perceived organizational support
(for the Army and the unit) and upward appraisal system attitudes. It was hypothesized that
Supervisors' and NCO’s perceptions of organizational support would be positively related to
their acceptance of feedback and belief that upward appraisal is useful. Respondents who
believe that the organization ( Army & unit ) shows concern for them and their development
(high perceived organizational support) will be more likely to believe the organization has
positive intentions and motivations toward them and will therefore be more likely to trust the
intentions of implementing upward appraisal system. Thus, supervisors who have higher
perceptions of organizational support may be more likely to view the feedback as accurate
because they are more likely to trust the intentions and therefore credibility of the process. In
addition to this, NCO’s who have higher perceptions of organizational support may be more
likely to provide feedback as accurate because they are more likely to trust the intentions and
therefore credibility of the process. Moreover, if respondents perceive that the organization is
concerned about their development and is taking into account their best interests (high
perceived organizational support), they may be more likely to see the upward feedback as
useful because they believe the organization will provide them with resources to support their
development.
Results support partially this contention (Paul E. Levy, 1997). Perceived organizational
support, in terms of units is significantly correlated with attitudes toward the upward appraisal
87
system ( r=0.363, p<0.01). Hypothesis 1a is supported. On the other hand, perceived
organizational support, in terms of the Army, is not significantly related to upward feedback
system attitudes (r= 0.093). Hypothesis 1a is not supported.
Hypothesis 1b is not supported. However much lower, perceived organizational support
both for the Army and for the unit is negatively correlated with attitudes toward the upward
appraisal system ( r=-0.79, r=-0,069 respectively p<0.01).
3.7.2. PERCEIVED COMPETENCE OF RATERS
Hypothesis 2 examines the relationship between perceived rater ability and attitudes
toward upward appraisal system. It was hypothesized that Supervisors' and NCO’s
perceptions of rater’s ability would be positively related to their acceptance of feedback and
belief that upward appraisal is useful.
Based on previous research Barclay and Harland (1995), establishing source credibility
as an important predictor of feedback reactions, it was predicted that supervisors who believe
that a rating source has the ability to rate their performance accurately would be more likely
to accept the feedback and find the feedback is useful.
Results provide evidence to support this condition. Officers’ and NCO’s perceived
competence of raters is significantly related to upward appraisal feedback system attitudes
(r=0.425, r=0.375 respectively p=0.01). Thus, Hypothesis 2a and 2b are supported.
88
3.7.3. PERCEPTIONS OF TRUST
Hypothesis 3a and 3b suggested that respondents’ perceptions of trust toward their
supervisors and subordinates would be positively related to appraisees’ and appraisers’
attitudes toward upward appraisal system. Results support the Hypothesis 3a. Officers’
perceptions of trust toward their supervisors and subordinates are significantly related to
attitudes toward upward appraisal system(r=0.363 –between subordinates-, r=0.308—
supervisors-). Hypothesis 3a is supported. Thus the more the organizational culture or
environment encourages perception of trust, the more favorable officers’ attitudes toward
upward appraisal system.
On the other hand results do not support the Hypothesis 3b. Noncommissioned officers’
perceptions of trust toward their supervisors are not correlated with the attitudes toward
upward appraisal system (r=0.021, p=0.01).
3.7.4. APPRAISAL SYSTEM SATISFACTION
Hypothesis 4 analyzes the relationship between current evaluation system satisfaction
level and attitudes toward upward appraisal. It was hypothesized that a high degree of
satisfaction with one’s current, traditional appraisal system would be negatively related to
attitudes toward upward appraisal system.
Result supports that appraisal system satisfaction is negatively correlated with
preferences for upward feedback system. On the other hand, tendency of officers and NCO’s
who are not pleased with current evaluation system ,to have positive attitudes toward upward
appraisal is not significantly related to subordinate feedback system attitudes (r= -0.185, r=-
0.197 respectively).

89
It is interesting that noncommissioned officers’ very positive attitudes toward upward
appraisal system are not significantly correlated with any of the 4 factors. So it may be
included that subjects only in the role of appraiser are more likely to favor upward appraisal
to a great extent than personnel in the role of appraisee.
90
CHAPTER IV
4. CONCLUSIONS AND RECOMMENDATIONS
4.1. CONCLUSIONS AND IMPLICATIONS The acceptability factors should not be overlooked before deciding to implement 360-
degree feedback or upward appraisal systems. Especially when compared to traditional, top-
down appraisal, acceptability gains more importance for 360 degree appraisals. Acceptability
is desirable but not absolutely important for implementing traditional appraisal-top-down
system. This system is considered the norm, and so supervisors and subordinates tend to go
through the motions, even if the system is not viewed very favorably.
On the other hand, 360 degree appraisal system or upward appraisal is still relatively
new and potentially threatening, and an understanding of acceptability takes on even more
importance since resistance to change is likely to be strong (David A. Waldman & David E.
Bowen 1998) Since if the supervisors or subordinates do not accept the process, there simply
will be no 360-degree appraisals. Because of this, managers should consider success factors
carefully as they decide to implement 360-degree appraisal or upward appraisal if they hope
to realize the many positive returns that can come from these new appraisal systems.
91
This thesis tries to investigate the general attitudes toward cultural environment, upward
and top-down appraisals and how various factors might effect perceptions of officers and
NCOs toward upward feedback system. The most important practical implications of this
study are presented below:
a. Generally, both officers and noncommissioned officers support the use of upward
appraisal as one source of feedback for supervisors. Officers are in favor of upward
feedback as a useful source of data, especially when used for developmental purposes.
b. Officers and NCOs are uncomfortable with current evaluation (top-down) system. As
analyzed in hypothesis 4, relationship between current evaluation system satisfaction
level and attitudes toward upward appraisal is negatively correlated. More or less
individuals who are supportive of upward appraisal are against the traditional appraisal
system. But these relationship is not significantly correlated.
c. Organizations should assess the degree of cynicism or organizational support before
implementing upward appraisal or 360-degree feedback system, especially in the units.
Since results show that there is a strong relationship between perception of working
environment (unit) and attitudes toward upward appraisal. That is if cynicism is high,
upward appraisal may not be practical until cynicism is reduced.
Results support that, officers’ perceptions of trust toward their supervisors and
subordinates are significantly correlated with attitudes toward upward appraisal system.
Thus the more the organizational culture or environment encourages perception of trust,
the more favorable officers’ attitudes toward upward appraisal system. On the other
hand, the Noncommissioned officers’ perceptions of trust toward their supervisors are
not correlated with the attitudes toward upward appraisal system. This result is quite
92
normal since NCOs are more likely to perceive upward appraisal as an opportunity to
identify themselves and to participate in the decision phase indirectly. So the attitudes
toward upward appraisal may be independent from the perception of trust.
d. Supervisors who believe that a rating source has the ability to rate their performance
accurately are more likely to accept the feedback and find the feedback is useful.
Officers’ and NCOs’ perceived competence of raters is significantly related to upward
appraisal feedback system attitudes.
e. However much officers are in favor of upward appraisal, they have some concerns that
should be taken into account. Moreover officers have an important concern such that
they believe that negatively evaluated supervisors will behave unfairly to them. Because
of this concern, subordinates may give an inflated rating which may not help supervisors
improve their leadership behaviors. The anonymity procedure may decrease
subordinates’ potential to inflate ratings of their supervisors.
4.2. RECOMMENDATIONS
Ilgen, (1979) suggests that these reactions or attitudes should ultimately be related to
behavioral outcomes. However; the circumstances which cause this relationship to occur may
be complex and are beyond the focus of this study. Behavioral intentions and external
constraints may all be involved (Ilgen, 1979). Therefore, future research should explore how
these affective reactions influence other 360-degree feedback outcomes such as
developmental activities pursued, behavior change, and performance improvement.
This study provides evidence that supervisors' and subordinates' reactions to 360-degree
feedback may be determined by multiple factors. The variables which are related to reactions
93
to subordinate feedback may differ. Therefore, organizations who want to implement
successful 360-degree feedback or upward appraisal systems will need to consider a lot of
variables.
In addition, further studies are needed to understand better how individual
characteristics such as personality effect how individuals deal with or perceive feedback.
Perhaps some individuals has more inclination to accept and use feedback than others.
Feedback processes seem to cause to behavior change and increased self-awareness for
some individuals. Further researches should continue to investigate the individual and
organizational characteristics that increase or prevent the change process. Future work should
also examine 360-degree feedback other sources in addition to subordinates, including peers
and self feedback. By increasing the understanding of how and why officers and
noncommissioned officers respond to 360-degree feedback, organizations will be able to
better design and implement systems which ultimately achieve their intended objectives.
Finally, quite a few organizations use 360-degree feedback or one particular source-
upward appraisal- as a strategy to improve supervisor or manager performance. But, so far, no
studies have explicitly compared whether 360-degree feedback really works better than
traditional top-down appraisal (Waldman& Atwater, 2002). Researches need to compare
traditional appraisal with upward or multi-rater feedback, in terms of these outcomes and
performance.
94
REFERENCES
Antonioni, D. (1994). The effects of feedback accountability on upward appraisal ratings.Personnel Psychology, 47, 349-356.
Ashford, S.F, 1989). Self-assessments in organizations: A literature review and integrativemodel. Research in Organizational Behavior, 11, 133-174.Atwater, L. E., Roush, P., & Fischthal, A. (1995). The influence of upward feedback on self-and follower ratings of leadership. Personnel Psychology, 48(1), 35-60.Atwater , L. E., & Yammarino, F.J. (1992). Does self-other agreement on leadershipperceptions moderate the validity of leadership and performance predictions? PersonnelPsychology, 45,141-164
Auteri, E. (1994, June). Upward feedback leads toculture change. HR Magazine, 78-80, 82, 84.
Barclay, J.H., & Harland, L.K. (1995). Peer performance appraisals: The impact of ratercompetence, rater location, and rating correctability on fairness perceptions. Group &Organization Management, 20, 39-60.
Bernardin, H.J., Dahmus, S.A., & Redmon, G. (1993). Attitudes of first-line supervisorstoward subordinate appraisals. Human Resource Management, 32, 315-324.
Bettenhausen , K.L. Fedor, (1997). Peer and Upward Appraisals. Grouo & OrganizationManagement,22(2)Blackburn, R., & Rosen, B. (1993). Total quality and human resources management: Lessonslearned from Baldrige Award-winning companies. Academy of Management Executive, 7(3),Brotherton, P. (1996, May). Candid feedback spurs changes in culture.HR Magazine, 47-50, 52.
Bracken, D. (1994, September). Straight Talk about Multi-Rater Feedback.Training and Development.Budman, M., & Rice, B. (1994). The rating game. Across the Board, 31(2), 34-38.Chappelow, C. (1998). 360-Degree Feedback in Individual Development. In C.D.Cotton, J. L. ( 1993). Employee involvement. Newbury Park, CA: Sage.David A. Waldman and David E. Bowen (1998), ‘The acceptabılıty of 360 degree Appraısals:a customer-supplıer Relatıonshıp perspectıve’, Human Resource Management, 37(2): 117-129.David.A.Waldman,(1998). The power of 360-degree feedback.
David A. Waldman, Leanne E . Atwater (2002). Understanding and optimizing multisourcefeedback. Human Resource Management, 41(2), 193-208
Dawid W. Bracken (2001). 360-degree from another angle. Human ResourceManagement,40,1
95
Daw, R. W., & Gage, N. L. (1967). Effect of feedback from teachers to principals. Journal ofEducational Psychology, 58(3), 181-188.
Denisi, Randolph,& Blencoe,( 1982). Level and source of feedback as determinants offeedback effectiveness. Academy of Management Proceedings (pp. 175-180)Edwards, M.R. and Ewen, A.J. (1996) 360-degree Feedback: The Powerful New Model forEmployee Assessment & Performance Improvement. New York: American ManagementAssociation .
Ellen Van Velsor, Sylvester Taylor, Jean B. Leslie,( 1993).’An Examination of theRelationships among Self-Perception Accuracy, Self-awareness, Gender, and LeaderEffectiveness’. Human Resource Management, Summer/Fall 1993,32(2&3) 249-263.
Farh, J., Cannella, A.A., Jr., & Bedeian, A.G. (1991). Peer ratings: The impact of purpose onrating quality and user acceptance. Group & Organization Studies, 16, 367-386.
Fedor, D.B. and Bettenhausen, K.L. (1989) `The Impact of Purpose, ParticipantPreconceptions , and Rating Level on the Acceptance of Peer Evaluations ’ , Group andOrganization Studies, 14(2): 182-97.
Ghorpade, J. (2000, February). Managing Five Paradoxes of 360-DegreeFeedback. Academy of Management Executive, 140-150.
Hart, C.W.L., Heskett, J.L., & Sasser, W.E. (1990). The profitable art of service recovery.Harvard Business Review, 90, 148-156.Jai Ghorpade (2000) Managing Five Paradoxes of 360-Degree Feedback 02/01/2000,Academy of Management Executive, Page 140-150Lepsinger, R., & Lucia, A.D. (1998, February). Creating Champions for 360-Degree Feedback. Training and Development.
Lepsinger, R., & Lucia, A.D. (1997). The Art and Science of 360-DegreeFeedback. San Francisco: Jossey-Bass.
Lind, E.A., MacCoun, R.J., Ebener, P.A., Felstiner, W.L.F., Hensler, D.R., Resnik, J., &Tyler, T.R.(1990). In the eye of the beholder: Tort litigants’ evaluations of their experiencesin the civil justice system. Law & Society Review, 24, 423-447.
London, M. and Beatty, R.W. (1993) `360-Degree Feedback as a Competitive Advantage’ ,Human Resource Management, 32: 353-72.
London, M., & Smither, J.W. (1995). Can multi-source feedback change perceptions of goalaccomplishment, self-evaluations, and performance-related outcomes? Theory-basedapplications and directions for research. Personnel Psychology, 48, 803-839.
London M., & Wohlers, A.J. (1991). Agreement between subordinate and self-ratings inupward feedback. Personnel Psychology, 44, 375-390.
McEvoy, G.M., & Buller, P. (1987). User acceptance of peer appraisals in an industrialsetting. Personnel Psychology, 40, 785-797.
McCauley, R. Moxley, & E. Van Velsor (Eds.), The Center for Creative
96
Leadership’s Handbook of Leadership Development. San Francisco:Josey-Bass.McGarvey, R., & Smith, S. (1993). When workers rate the boss. Training, 30(3), 31-34.
McCauley ,C.D & Moxley,R.S. 1996). How feedback can make managers more effective.Career Development International, 1(3), 15-19.
Mohrman, A.M., Jr., Resnick-West, S. M., & Lawler, E. E. III. (1989). Designingperformance appraisal systems: Aligning appraisals and organizational realities. SanFrancisco: Jossey-Bass.Murphy, K.R. and Cleveland, J.N. (1995) Performance Appraisal: An OrganizationalPerspectiv e. Boston, MA: Allyn & Bacon.
Nunnally, J.C., (1978), ”Psychometric theory”, New York: McGraw-Hill.
Paul E. Levy, (1997) The influence of contextual variables on 360-degree feedback systemsattitudes,22
Richard Rubin (1995) , Upward Appraisal, School of Library and Informatıon Science KentState UniversityRomano, C. (March, 1994). Conquering the fear of feedback. HR Focus, 71(3), 9-19.Roebuck, D. (1996). Constructive Feedback: Key to Higher Performance andCommitment. Long Range Planning, 29, 328-336.
Smither, J., London, M., Vasilopoulos, N., Reilly, R., Millsap, R., & Salvemini, N. (1995).An examination of the effects of an upward feedback program over time. PersonnelPsychology, 48, 1-34.
Tornow, W.W. (1993) `Perceptions or Reality: Is Multi-perspective Measurement a Means oran End?’ , Human Resource Management, 32: 221±9.
Tornow, W., London, M., & CCl Associates. (1998). Maximizing the Value of 360-Degree Feedback. Greensboro, NC: Center for Creative Leadership.
Waldman, Atwater, & Antonioni, (1998). Has 360-degree feedback gone amok?Academy of Management Executives,12,86-94.
Waldman, D.A. (1993). A theoretical consideration of leadership and total qualitymanagement. Leadership Quarterly, 4, 65-79.
Wimer, S. & Nowack, K. (1998, May). 13 Common Mistakes Using 360-DegreeFeedback. Training and Development.Wohlers, A. J., & London, M. (1989). Ratings of managerial characteristics: Evaluationdifficulty, co-worker agreement, and self-awareness. Personnel Psychology, 42, 235-261.
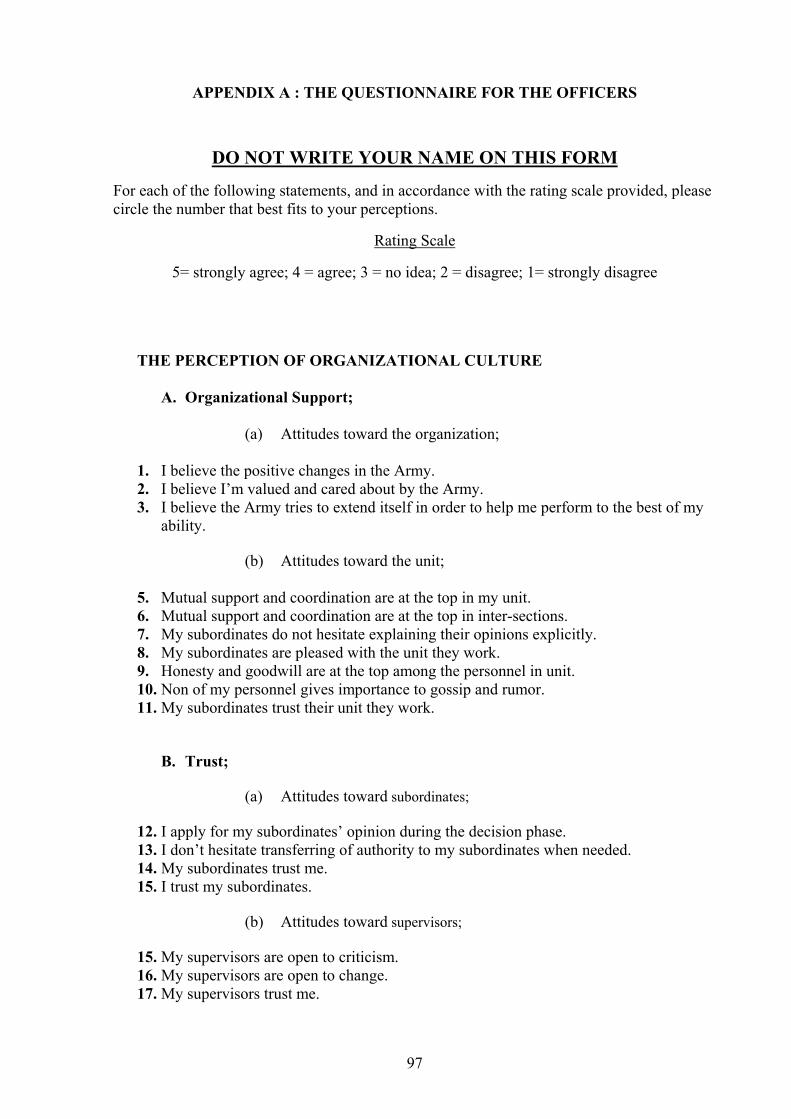
97
APPENDIX A : THE QUESTIONNAIRE FOR THE OFFICERS
DO NOT WRITE YOUR NAME ON THIS FORM
For each of the following statements, and in accordance with the rating scale provided, pleasecircle the number that best fits to your perceptions.
Rating Scale
5= strongly agree; 4 = agree; 3 = no idea; 2 = disagree; 1= strongly disagree
THE PERCEPTION OF ORGANIZATIONAL CULTURE
A. Organizational Support;
(a) Attitudes toward the organization;
1. I believe the positive changes in the Army.2. I believe I’m valued and cared about by the Army.3. I believe the Army tries to extend itself in order to help me perform to the best of my
ability.
(b) Attitudes toward the unit;
5. Mutual support and coordination are at the top in my unit.6. Mutual support and coordination are at the top in inter-sections.7. My subordinates do not hesitate explaining their opinions explicitly.8. My subordinates are pleased with the unit they work.9. Honesty and goodwill are at the top among the personnel in unit.10. Non of my personnel gives importance to gossip and rumor.11. My subordinates trust their unit they work.
B. Trust;
(a) Attitudes toward subordinates;
12. I apply for my subordinates’ opinion during the decision phase.13. I don’t hesitate transferring of authority to my subordinates when needed.14. My subordinates trust me.15. I trust my subordinates.
(b) Attitudes toward supervisors;
15. My supervisors are open to criticism.16. My supervisors are open to change.17. My supervisors trust me.
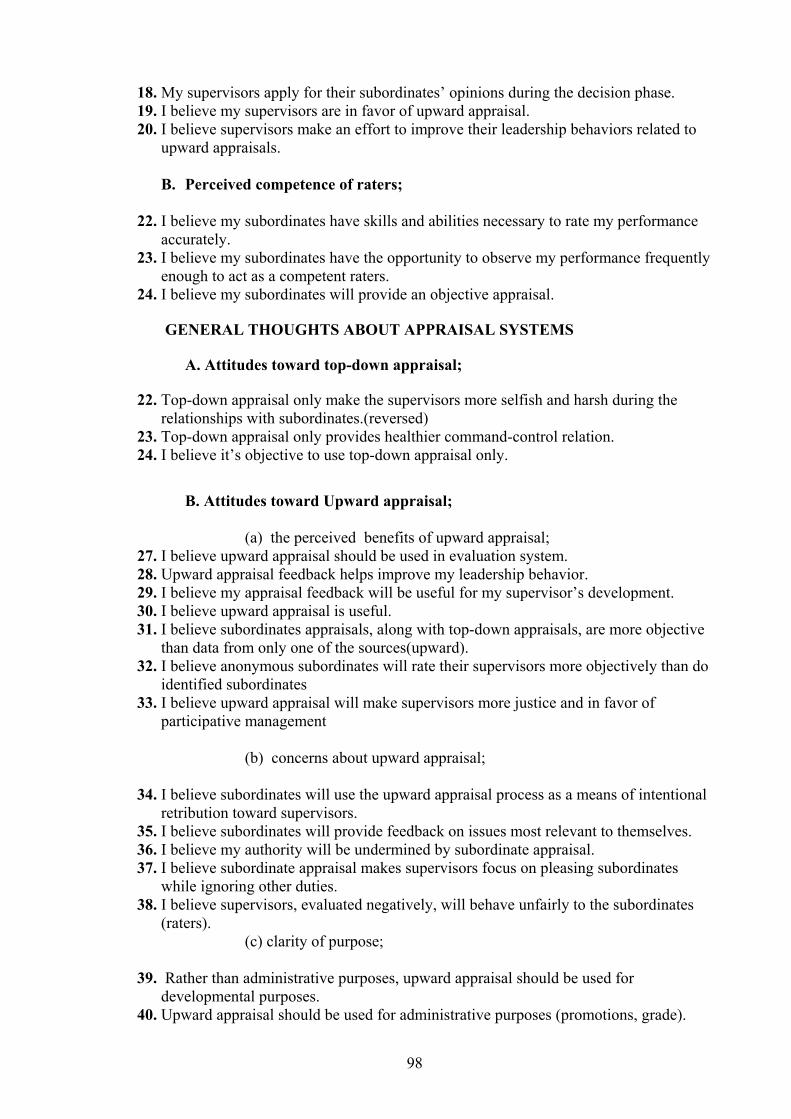
98
18. My supervisors apply for their subordinates’ opinions during the decision phase.19. I believe my supervisors are in favor of upward appraisal.20. I believe supervisors make an effort to improve their leadership behaviors related to
upward appraisals.
B. Perceived competence of raters;
22. I believe my subordinates have skills and abilities necessary to rate my performanceaccurately.
23. I believe my subordinates have the opportunity to observe my performance frequentlyenough to act as a competent raters.
24. I believe my subordinates will provide an objective appraisal.
GENERAL THOUGHTS ABOUT APPRAISAL SYSTEMS
A. Attitudes toward top-down appraisal;
22. Top-down appraisal only make the supervisors more selfish and harsh during therelationships with subordinates.(reversed)
23. Top-down appraisal only provides healthier command-control relation.24. I believe it’s objective to use top-down appraisal only.
B. Attitudes toward Upward appraisal;
(a) the perceived benefits of upward appraisal;27. I believe upward appraisal should be used in evaluation system.28. Upward appraisal feedback helps improve my leadership behavior.29. I believe my appraisal feedback will be useful for my supervisor’s development.30. I believe upward appraisal is useful.31. I believe subordinates appraisals, along with top-down appraisals, are more objective
than data from only one of the sources(upward).32. I believe anonymous subordinates will rate their supervisors more objectively than do
identified subordinates33. I believe upward appraisal will make supervisors more justice and in favor of
participative management
(b) concerns about upward appraisal;
34. I believe subordinates will use the upward appraisal process as a means of intentionalretribution toward supervisors.
35. I believe subordinates will provide feedback on issues most relevant to themselves.36. I believe my authority will be undermined by subordinate appraisal.37. I believe subordinate appraisal makes supervisors focus on pleasing subordinates
while ignoring other duties.38. I believe supervisors, evaluated negatively, will behave unfairly to the subordinates
(raters).(c) clarity of purpose;
39. Rather than administrative purposes, upward appraisal should be used fordevelopmental purposes.
40. Upward appraisal should be used for administrative purposes (promotions, grade).
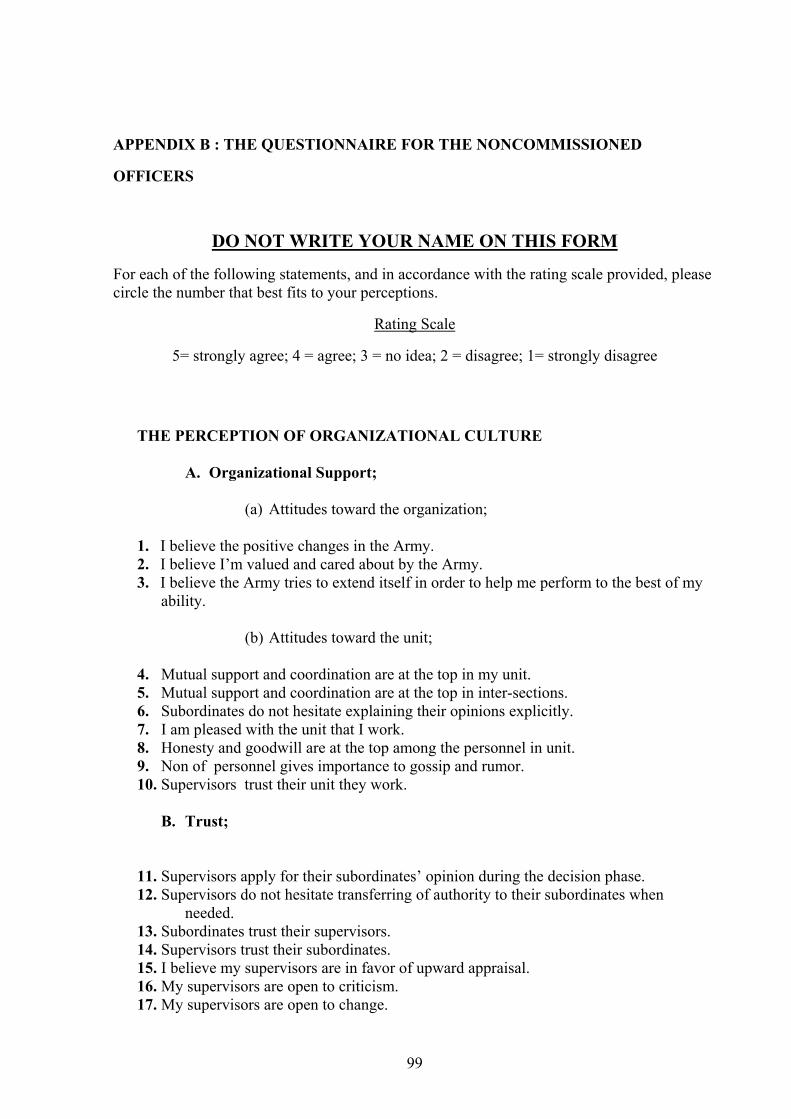
99
APPENDIX B : THE QUESTIONNAIRE FOR THE NONCOMMISSIONED
OFFICERS
DO NOT WRITE YOUR NAME ON THIS FORM
For each of the following statements, and in accordance with the rating scale provided, pleasecircle the number that best fits to your perceptions.
Rating Scale
5= strongly agree; 4 = agree; 3 = no idea; 2 = disagree; 1= strongly disagree
THE PERCEPTION OF ORGANIZATIONAL CULTURE
A. Organizational Support;
(a) Attitudes toward the organization;
1. I believe the positive changes in the Army.2. I believe I’m valued and cared about by the Army.3. I believe the Army tries to extend itself in order to help me perform to the best of my
ability.
(b) Attitudes toward the unit;
4. Mutual support and coordination are at the top in my unit.5. Mutual support and coordination are at the top in inter-sections.6. Subordinates do not hesitate explaining their opinions explicitly.7. I am pleased with the unit that I work.8. Honesty and goodwill are at the top among the personnel in unit.9. Non of personnel gives importance to gossip and rumor.10. Supervisors trust their unit they work.
B. Trust;
11. Supervisors apply for their subordinates’ opinion during the decision phase.12. Supervisors do not hesitate transferring of authority to their subordinates when
needed.13. Subordinates trust their supervisors.14. Supervisors trust their subordinates.15. I believe my supervisors are in favor of upward appraisal.16. My supervisors are open to criticism.17. My supervisors are open to change.
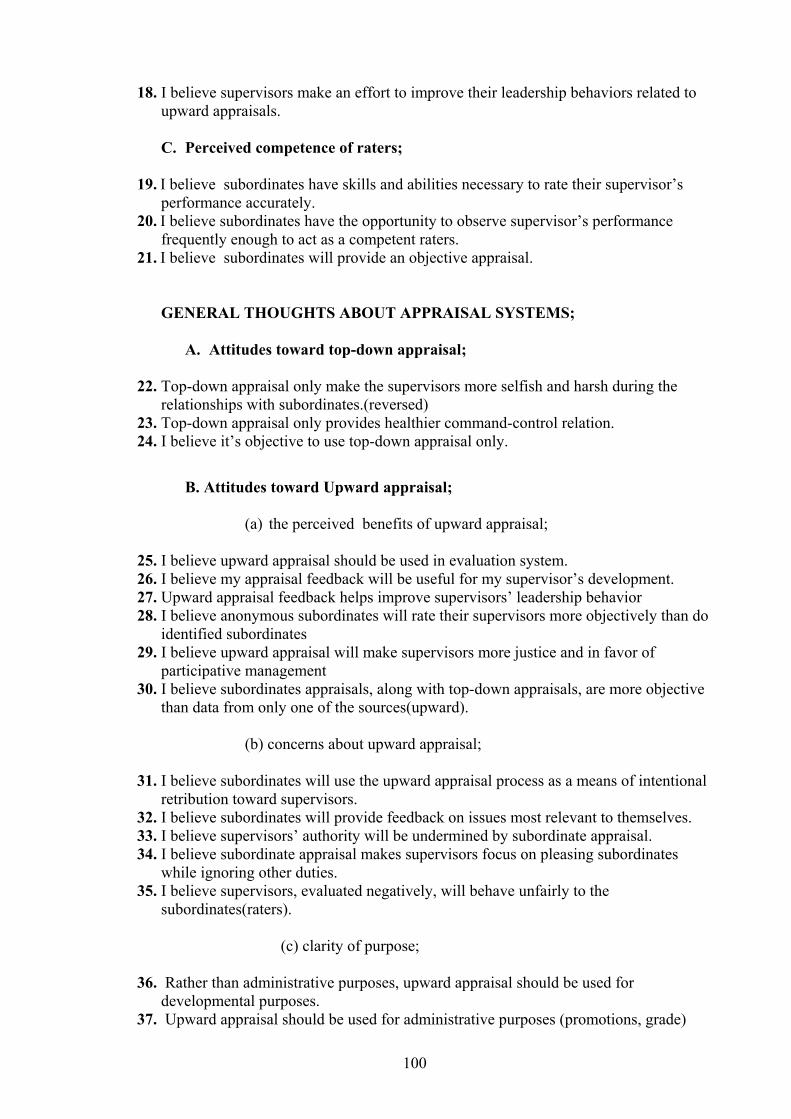
100
18. I believe supervisors make an effort to improve their leadership behaviors related toupward appraisals.
C. Perceived competence of raters;
19. I believe subordinates have skills and abilities necessary to rate their supervisor’sperformance accurately.
20. I believe subordinates have the opportunity to observe supervisor’s performancefrequently enough to act as a competent raters.
21. I believe subordinates will provide an objective appraisal.
GENERAL THOUGHTS ABOUT APPRAISAL SYSTEMS;
A. Attitudes toward top-down appraisal;
22. Top-down appraisal only make the supervisors more selfish and harsh during therelationships with subordinates.(reversed)
23. Top-down appraisal only provides healthier command-control relation.24. I believe it’s objective to use top-down appraisal only.
B. Attitudes toward Upward appraisal;
(a) the perceived benefits of upward appraisal;
25. I believe upward appraisal should be used in evaluation system.26. I believe my appraisal feedback will be useful for my supervisor’s development.27. Upward appraisal feedback helps improve supervisors’ leadership behavior28. I believe anonymous subordinates will rate their supervisors more objectively than do
identified subordinates29. I believe upward appraisal will make supervisors more justice and in favor of
participative management30. I believe subordinates appraisals, along with top-down appraisals, are more objective
than data from only one of the sources(upward).
(b) concerns about upward appraisal;
31. I believe subordinates will use the upward appraisal process as a means of intentionalretribution toward supervisors.
32. I believe subordinates will provide feedback on issues most relevant to themselves.33. I believe supervisors’ authority will be undermined by subordinate appraisal.34. I believe subordinate appraisal makes supervisors focus on pleasing subordinates
while ignoring other duties.35. I believe supervisors, evaluated negatively, will behave unfairly to the
subordinates(raters).
(c) clarity of purpose;
36. Rather than administrative purposes, upward appraisal should be used fordevelopmental purposes.
37. Upward appraisal should be used for administrative purposes (promotions, grade)
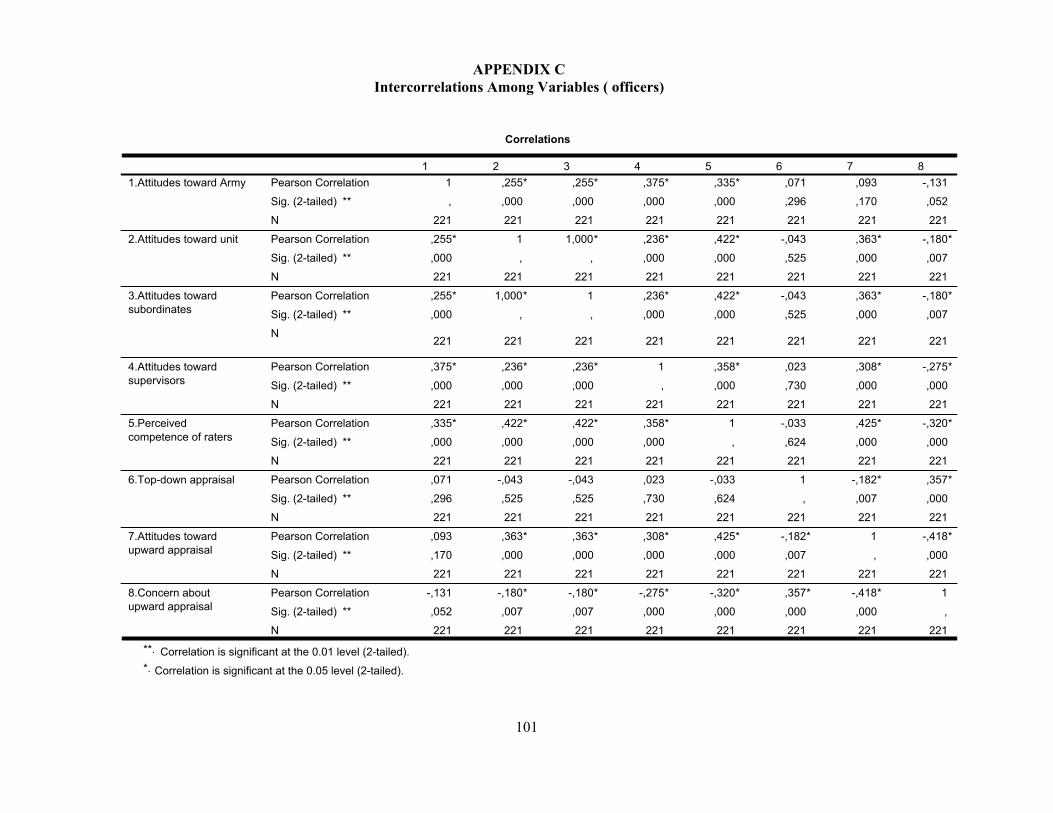
101
Correlations
1 ,255* ,255* ,375* ,335* ,071 ,093 -,131, ,000 ,000 ,000 ,000 ,296 ,170 ,052
221 221 221 221 221 221 221 221,255* 1 1,000* ,236* ,422* -,043 ,363* -,180*,000 , , ,000 ,000 ,525 ,000 ,007221 221 221 221 221 221 221 221
,255* 1,000* 1 ,236* ,422* -,043 ,363* -,180*,000 , , ,000 ,000 ,525 ,000 ,007
221 221 221 221 221 221 221 221
,375* ,236* ,236* 1 ,358* ,023 ,308* -,275*,000 ,000 ,000 , ,000 ,730 ,000 ,000221 221 221 221 221 221 221 221,335* ,422* ,422* ,358* 1 -,033 ,425* -,320*,000 ,000 ,000 ,000 , ,624 ,000 ,000221 221 221 221 221 221 221 221,071 -,043 -,043 ,023 -,033 1 -,182* ,357*,296 ,525 ,525 ,730 ,624 , ,007 ,000221 221 221 221 221 221 221 221
,093 ,363* ,363* ,308* ,425* -,182* 1 -,418*,170 ,000 ,000 ,000 ,000 ,007 , ,000221 221 221 221 221 221 221 221
-,131 -,180* -,180* -,275* -,320* ,357* -,418* 1,052 ,007 ,007 ,000 ,000 ,000 ,000 ,221 221 221 221 221 221 221 221
Pearson CorrelationSig. (2-tailed) **NPearson CorrelationSig. (2-tailed) **N
Pearson CorrelationSig. (2-tailed) **N
Pearson CorrelationSig. (2-tailed) **NPearson CorrelationSig. (2-tailed) **NPearson CorrelationSig. (2-tailed) **N
Pearson CorrelationSig. (2-tailed) **NPearson CorrelationSig. (2-tailed) **N
1.Attitudes toward Army
2.Attitudes toward unit
3.Attitudes towardsubordinates
4.Attitudes towardsupervisors
5.Perceivedcompetence of raters
6.Top-down appraisal
7.Attitudes towardupward appraisal
8.Concern aboutupward appraisal
1 2 3 4 5 6 7 8
Correlation is significant at the 0.01 level (2-tailed).**.
Correlation is significant at the 0.05 level (2-tailed).*.
APPENDIX C Intercorrelations Among Variables ( officers)
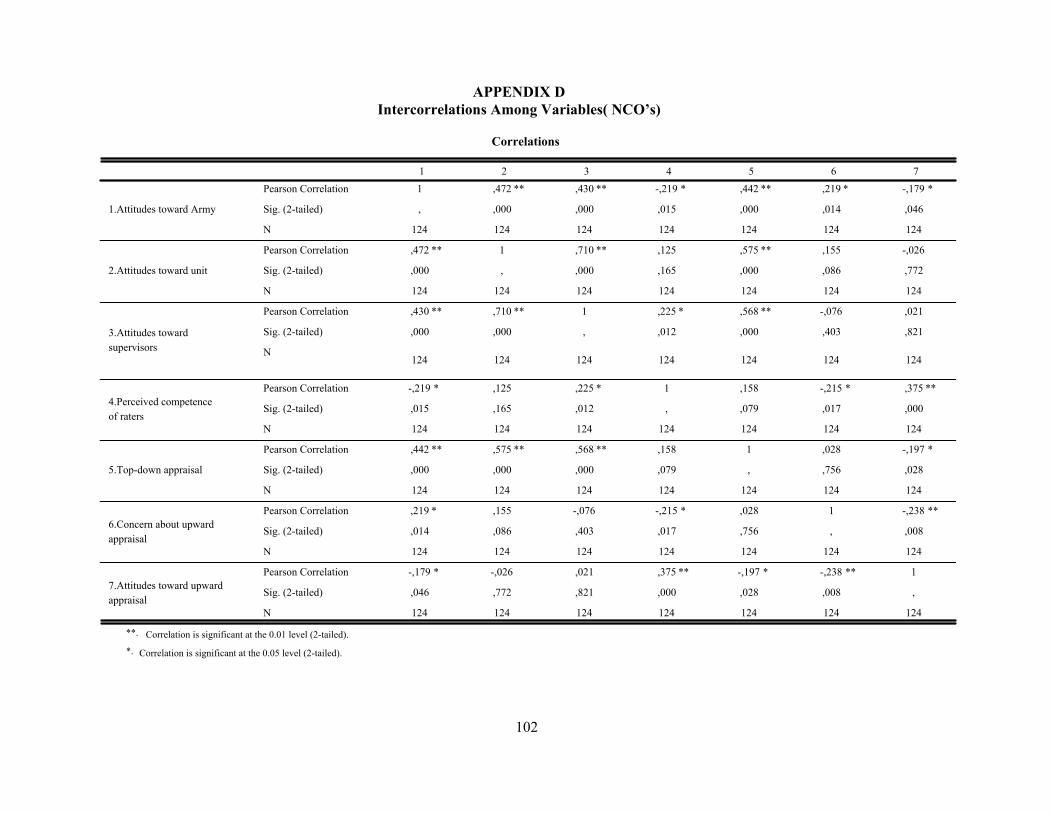
102
Correlations
1 ,472 ** ,430 ** -,219 * ,442 ** ,219 * -,179 *
, ,000 ,000 ,015 ,000 ,014 ,046
124 124 124 124 124 124 124
,472 ** 1 ,710 ** ,125 ,575 ** ,155 -,026
,000 , ,000 ,165 ,000 ,086 ,772
124 124 124 124 124 124 124
,430 ** ,710 ** 1 ,225 * ,568 ** -,076 ,021
,000 ,000 , ,012 ,000 ,403 ,821
124 124 124 124 124 124 124
-,219 * ,125 ,225 * 1 ,158 -,215 * ,375 **
,015 ,165 ,012 , ,079 ,017 ,000
124 124 124 124 124 124 124
,442 ** ,575 ** ,568 ** ,158 1 ,028 -,197 *
,000 ,000 ,000 ,079 , ,756 ,028
124 124 124 124 124 124 124
,219 * ,155 -,076 -,215 * ,028 1 -,238 **
,014 ,086 ,403 ,017 ,756 , ,008
124 124 124 124 124 124 124
-,179 * -,026 ,021 ,375 ** -,197 * -,238 ** 1
,046 ,772 ,821 ,000 ,028 ,008 ,
124 124 124 124 124 124 124
Pearson Correlation
Sig. (2-tailed)
N
Pearson Correlation
Sig. (2-tailed)
N
Pearson Correlation
Sig. (2-tailed)
N
Pearson Correlation
Sig. (2-tailed)
N
Pearson Correlation
Sig. (2-tailed)
N
Pearson Correlation
Sig. (2-tailed)
N
Pearson Correlation
Sig. (2-tailed)
N
1.Attitudes toward Army
2.Attitudes toward unit
3.Attitudes towardsupervisors
4.Perceived competenceof raters
5.Top-down appraisal
6.Concern about upwardappraisal
7.Attitudes toward upwardappraisal
1 2 3 4 5 6 7
Correlation is significant at the 0.01 level (2-tailed).**.
Correlation is significant at the 0.05 level (2-tailed).*.
APPENDIX D Intercorrelations Among Variables( NCO’s)