369 p. 017-037 new ii - unirioja.es · liliana madalena gramani universidade federal do paraná,...
TRANSCRIPT
INDEPENDENT JOURNAL OF MANAGEMENT & PRODUCTION (IJM&P)http://www.ijmp.jor.br v. 7, n. 1, January - March 2016 ISSN: 2236-269X DOI: 10.14807/ijmp.v7i1.369
[http://creativecommons.org/licenses/by/3.0/us/] Licensed under a Creative Commons Attribution 3.0 United States License
17
PRINCIPAL COMPONENTS IN MULTIVARIATE CONTROL CHARTS APPLIED TO DATA INSTRUMENTATION OF DAMS
Emerson Lazzarotto
Universidade Estadual do Oeste do Paraná - UNIOESTE, Brazil E-mail: [email protected]
Liliana Madalena Gramani
Universidade Federal do Paraná, Brazil E-mail: [email protected]
Anselmo Chaves Neto
Universidade Federal do Paraná, Brazil E-mail: [email protected]
Luiz Albino Teixeira Junior
Universidade Federal da Integração Latino Americana - UNILA, Brazil E-mail: [email protected]
Submission: 11/09/2015
Accept: 26/09/2015 ABSTRACT
A high number of instruments that assess various quality
characteristics of interest that have an inherent variability monitors
hydroelectric plants. The readings of these instruments generate time
series of data on many occasions have correlation. Each project of a
dam plant has characteristics that make it unique. Faced with the
need to establish statistical control limits for the instrumentation data,
this article makes an approach to multivariate statistical analysis and
proposes a model that uses principal components control charts and
statistical T2 and to explain variability and establish a method of
monitoring to control future observations. An application for section E
of the Itaipu hydroelectric plant is performed to validate the model.
The results show that the method used is appropriate and can help
identify the type of outliers, reducing false alarms and reveal
instruments that have higher contribution to the variability.
Keywords: Statistical quality control; multivariate control charts;
principal component analysis; dam safety.
[http://creativecommons.org/licenses/by/3.0/us/] Licensed under a Creative Commons Attribution 3.0 United States License
18
INDEPENDENT JOURNAL OF MANAGEMENT & PRODUCTION (IJM&P) http://www.ijmp.jor.br v. 7, n. 1, January - March 2016 ISSN: 2236-269X DOI: 10.14807/ijmp.v7i1.369
1. INTRODUCTION
The control chart is one of statistical quality control techniques most used and
can be very useful in controlling the instrumentation of a dam. The facility of online
supplying of data with high frequency provides a huge mass of data that generates a
series of control charts. However, it is necessary to interpret these data to produce
additional knowledge beyond simple time series data.
Hotelling (1947) introduced multivariate control charts at the time of the
Second World War and, from the development of computers that enabled its
implementation, had great development. Its use has spread because of the need for
quality control of several variables not is adequately treated with univariate tools such
as Shewhart control charts, especially when there is correlation between variables.
Once the variables do not behave independently of one another, they should be
considered together and not separately (MASON; YOUNG, 2002).
A typical control chart plots the averages of measurements of a quality
characteristic as a function of time. The chart has a center line that represents the
target of the quality characteristic value if there were no variability and the other two
lines, the upper and lower control limits that are determined statistically. Such control
charts are called Shewhart control charts (MONTGOMERY, 2013).
There are several techniques to address the multivariate control type
Shewhart charts, among them the charts, cumulative sums (CUSUM),
exponentially weighted moving average (EWMA), principal component analysis
(PCA), partial least squares (PLS), and non-parametric or distribution free techniques
(BERSIMIS; PSARAKIS; PANARETOS, 2007). The PCA can be extremely useful in
quality control applications, transforming a set of correlated variables into a new set
of uncorrelated variables that can be easier to be monitored via control charts
(JACKSON, 1991).
The monitoring of structural behavior of hydroelectric dams because the
economic, social and environmental importance of plants requires that dams are
monitored by means of tools for assessing the safety and ensure the operation of
power generation. Usually a large dam has hundreds or even thousands of
instruments that measure various quality characteristics of the dam. Evaluate the
results of measurements instrumentation of a large number of instruments
[http://creativecommons.org/licenses/by/3.0/us/] Licensed under a Creative Commons Attribution 3.0 United States License
19
INDEPENDENT JOURNAL OF MANAGEMENT & PRODUCTION (IJM&P) http://www.ijmp.jor.br v. 7, n. 1, January - March 2016 ISSN: 2236-269X DOI: 10.14807/ijmp.v7i1.369
individually may be impractical or even lead to high false alarms and discredit the
monitoring system.
It should be given continuous attention to operation and maintenance of the
safety of a dam power plant. The tool for this is the instrumentation of the dam. Due
to the particularities of each hydropower plant, there are no universal procedures
applicable to all dams in respect to the evaluation of the instrumentation. The
evaluation and judgment of information available for an experienced engineering
team is the best way to contribute to a decision and choose the best action to be
implemented (USACE, United States Army Corps of Engineers, 1995).
The main sources of variability of the readings of instruments for monitoring
dams are attributed to temperature, reservoir level and aging (ROSSO et al., 1995),
(ITAIPU BINACIONAL, 1999; CHENG; ZHENG, 2013; NEDUSHAN, 2002).Two
models were created to relate the effects of instrument readings and environmental
variables in a dam of China. The methods showed ability to reduce the rate of false
alarms and detect defective instruments (CHENG; ZHENG, 2013).
Diagnosed singular values in monitoring dam safety, with a case study on the
hydroelectric plant in China, via multivariate analysis of principal components and
graphic control Hotelling (GU et al., 2011). In a hydroelectric power in China it was
applied a model that extracts principal components of data instrumentation and
establish a seasonal hydrostatic in time model between the variables reservoir level,
temperature and time effects and principal components (YU et al., 2010).
Techniques for detection of structural damage are proposed using nonlinear
principal component analysis and auto-associative neural network method to data
monitoring in an arch dam caused by varying environmental conditions through the
statistical analysis threshold level for early warning on dam static deformation can be
determined (LOH; CHEN; HSU, 2011). The PCA, and statistics are used to
detect and distinguish damages in steel plates and turbine blades plane where
vibrations caused are measured by sensors attached to the surface (MUJICA et al.,
2011).
In the dam instrumentation, control values are those closer to the physical
reality, considering the thermal environmental influences that act on structures and
more realistic rheological models of concrete and foundation. Control values are

[http://creativecommons.org/licenses/by/3.0/us/] Licensed under a Creative Commons Attribution 3.0 United States License
20
INDEPENDENT JOURNAL OF MANAGEMENT & PRODUCTION (IJM&P) http://www.ijmp.jor.br v. 7, n. 1, January - March 2016 ISSN: 2236-269X DOI: 10.14807/ijmp.v7i1.369
used to monitor the performance of the structures by means of readings taken and
are warning signs for abnormal situations of structural behavior. Values that were
determined earlier in the design phase and the filling of the reservoir are not, in many
cases, more applicable during the operation phase (ITAIPU BINACIONAL, 1999). It is
necessary to establish operational control values for the instrumentation of
hydroelectric plants.
This article aims to propose a multivariate statistical model for monitoring
instruments for monitoring dams via control charts and principal components analysis
and seeks to separate the effect of environmental variables on the reading of
instruments from other sources of variability by use of statistics and and
establish control values for monitoring future observations. The method is evaluated
in a case study applied to real data from monitoring a dam hydroelectric plant.
The article presents in section 2 the theoretical basis of knowledge of control
charts and statistics to be used in this work and the place where the case study was
applied and its significance. The section 3 describes the data and methods used in
the developed model. Section 4 presents and discusses the results of a case study.
In the section 5 some conclusions and considerations are presented.
2. MULTIVARIATE CONTROL CHARTS
2.1. control charts
The field of multivariate analysis consists of statistical techniques that consider
two or more random variables related to a single entity in an attempt to produce an
overall result that takes into account the relationship between the variables
(JACKSON, 1991).The multivariate process control is a methodology based on
control charts used to monitor the stability of a multivariate process. Stability is
achieved when one or more parameters of interest remain stable on samples
(MASON; YOUNG, 2002).
One of the first studies to examine correlated variables from the perspective of
statistical control using multivariate procedures for military purposes was given by
Hotelling (HOTELLING, 1947). This control procedure was based on a statistic that
generalizes the Student statistic which later received the name of Hotelling .
The application of univariate control charts can lead to erroneous and
misleading interpretations and that multivariate methods are a good alternative
[http://creativecommons.org/licenses/by/3.0/us/] Licensed under a Creative Commons Attribution 3.0 United States License
21
INDEPENDENT JOURNAL OF MANAGEMENT & PRODUCTION (IJM&P) http://www.ijmp.jor.br v. 7, n. 1, January - March 2016 ISSN: 2236-269X DOI: 10.14807/ijmp.v7i1.369
(MONTGOMERY, 2013; JOHNSON; WICHERN, 2007). If the variables are
correlated increases the probability of emission of false alarms and not to receive an
alert when the multivariate process is out of control (RYAN, 2011).
Let be samples of variables, extracted for evaluation, of a process under
control, of size , represented by , where ,
with , taken from a -variate normal distribution, with mean and
covariance matrix (MASON; YOUNG, 2002; MONTGOMERY, 2013). At almost
always and are unknown and in the practice are estimated, respectively, by
unbiased estimators , the sample mean and the positive definite matrix ,
where
(1)
(2)
and is the covariance between variables and . Multivariate statistical
generalization of is the statistic called the Hotteling or, only, , measuring the
distance from an observation vector to the mean vector weighted by the
covariance matrix and is given by
. (3)
It is pointed to the existence of two phases in statistical quality control process.
In the phase I (retrospective), the control limits are established and tested to the data
available. It should be under levels considered statically under control. In the second
phase (perspective) control limits are established from the same preliminary data and
are used to monitor future data (MONTGOMERY, 2013; RYAN, 2011).
In the case of reading instrumentation monitoring of dams, which will be of
interest in this work, the value of the statistic evaluated in in the phase I by
(Montgomery, 2013), (JOHNSON; WICHERN, 2007; RYAN, 2011), where a vector
observation is not independent of the estimators and , is given by equation (3).
The upper control limit in the case of , is recommended to be calculated
based on a beta distribution (MASON; YOUNG, 2002), in this case
(4)
[http://creativecommons.org/licenses/by/3.0/us/] Licensed under a Creative Commons Attribution 3.0 United States License
22
INDEPENDENT JOURNAL OF MANAGEMENT & PRODUCTION (IJM&P) http://www.ijmp.jor.br v. 7, n. 1, January - March 2016 ISSN: 2236-269X DOI: 10.14807/ijmp.v7i1.369
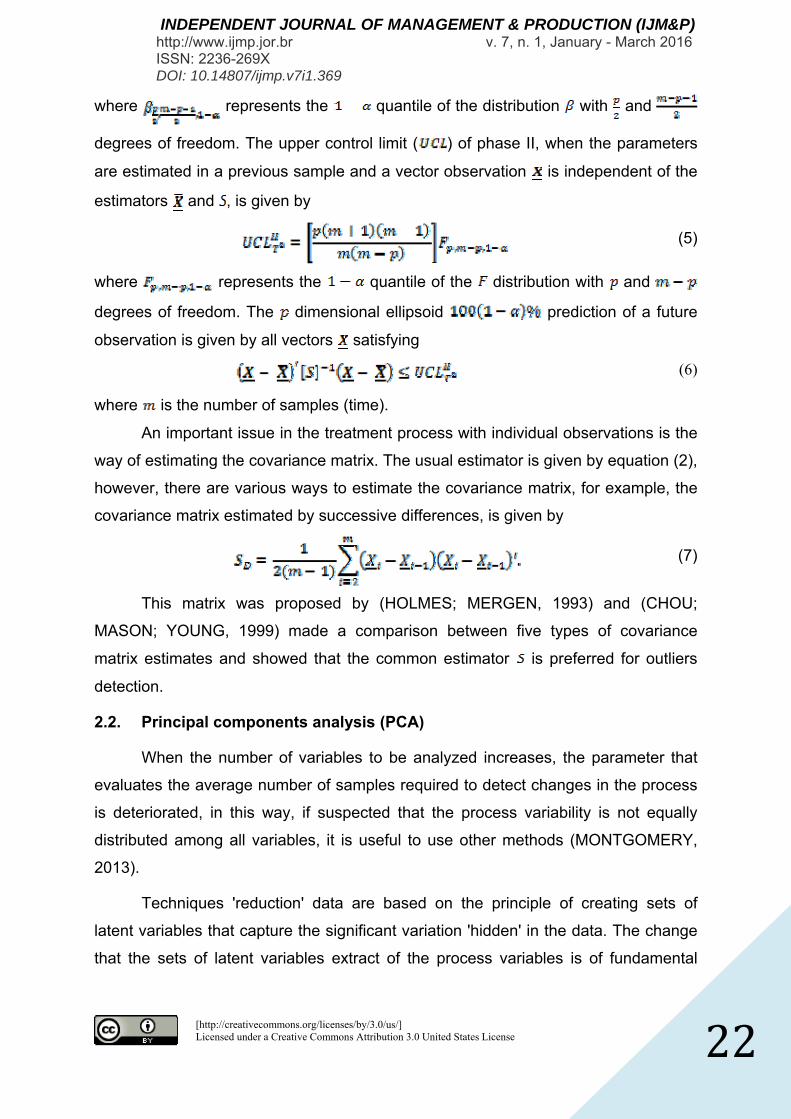
where represents the quantile of the distribution with and
degrees of freedom. The upper control limit ( ) of phase II, when the parameters
are estimated in a previous sample and a vector observation is independent of the
estimators and , is given by
(5)
where represents the quantile of the distribution with and
degrees of freedom. The dimensional ellipsoid prediction of a future
observation is given by all vectors satisfying
(6)
where is the number of samples (time).
An important issue in the treatment process with individual observations is the
way of estimating the covariance matrix. The usual estimator is given by equation (2),
however, there are various ways to estimate the covariance matrix, for example, the
covariance matrix estimated by successive differences, is given by
(7)
This matrix was proposed by (HOLMES; MERGEN, 1993) and (CHOU;
MASON; YOUNG, 1999) made a comparison between five types of covariance
matrix estimates and showed that the common estimator is preferred for outliers
detection.
2.2. Principal components analysis (PCA)
When the number of variables to be analyzed increases, the parameter that
evaluates the average number of samples required to detect changes in the process
is deteriorated, in this way, if suspected that the process variability is not equally
distributed among all variables, it is useful to use other methods (MONTGOMERY,
2013).
Techniques 'reduction' data are based on the principle of creating sets of
latent variables that capture the significant variation 'hidden' in the data. The change
that the sets of latent variables extract of the process variables is of fundamental
[http://creativecommons.org/licenses/by/3.0/us/] Licensed under a Creative Commons Attribution 3.0 United States License
23
INDEPENDENT JOURNAL OF MANAGEMENT & PRODUCTION (IJM&P) http://www.ijmp.jor.br v. 7, n. 1, January - March 2016 ISSN: 2236-269X DOI: 10.14807/ijmp.v7i1.369
importance for the evaluation of product quality, process security and, more
generally, if the process is in statistical control (KRUGER; XIE, 2012).
A method which can extract features in the data can be useful in dam safety
study. As the instrumentation readings are a result of the combination of several
factors, methods of multivariate data analysis can provide the following advantages:
1) more profitable by reducing the number of individual analysis, 2) greater ability to
explain and separate the variability due to one because of random variability
attributable since the random variabilities are, by definition, uncorrelated from one
instrument to another and 3) to identify patterns of behavior (NEDUSHAN, 2002).
The PCA is a multivariate data analytical technique in which a number of
related variables are transformed into a set of uncorrelated variables that are linear
combinations of the original variables, where it is expected to explain the variability
between variables with a smaller number of variables (JACKSON, 1991).
Its industrial application has contributed to the multivariate statistical process
control, since only a few of multivariate control charts can serve as an index of
process performance. PCA improves the early detection of failures in relation to the
univariate graphs (KOURTI, 2005).
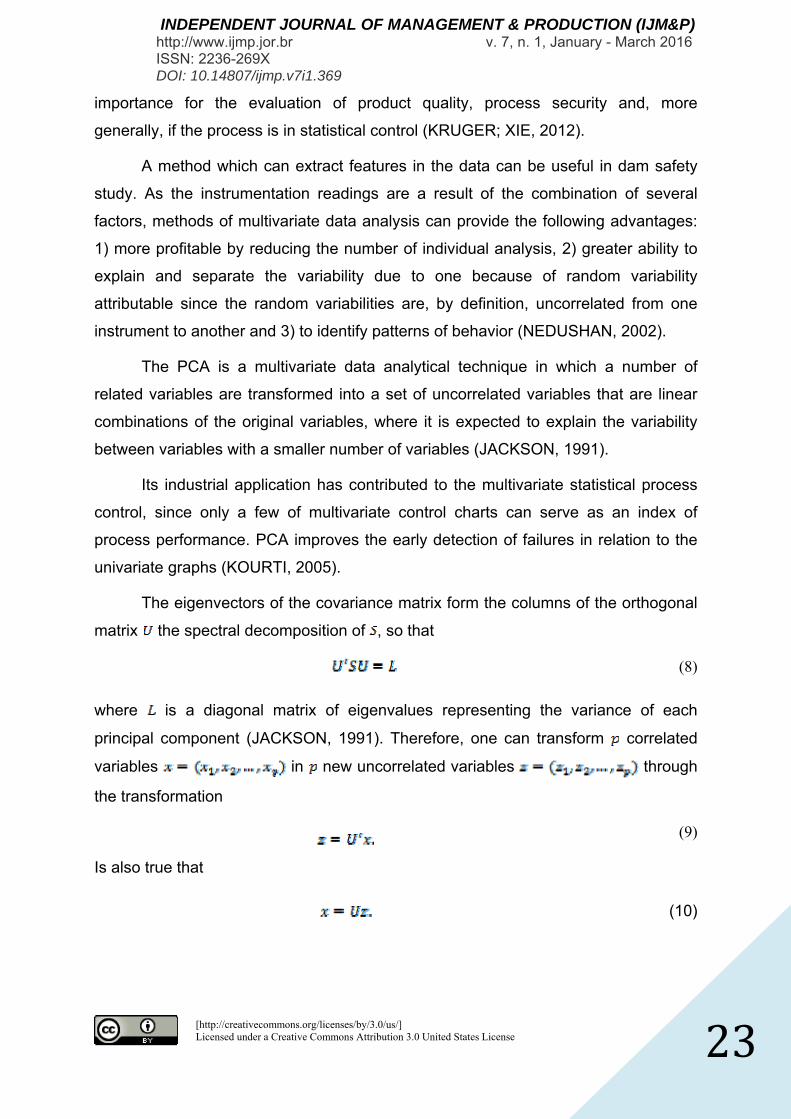
The eigenvectors of the covariance matrix form the columns of the orthogonal
matrix the spectral decomposition of , so that
(8)
where is a diagonal matrix of eigenvalues representing the variance of each
principal component (JACKSON, 1991). Therefore, one can transform correlated
variables in new uncorrelated variables through
the transformation
(9)
Is also true that
(10)
[http://creativecommons.org/licenses/by/3.0/us/] Licensed under a Creative Commons Attribution 3.0 United States License
24
INDEPENDENT JOURNAL OF MANAGEMENT & PRODUCTION (IJM&P) http://www.ijmp.jor.br v. 7, n. 1, January - March 2016 ISSN: 2236-269X DOI: 10.14807/ijmp.v7i1.369
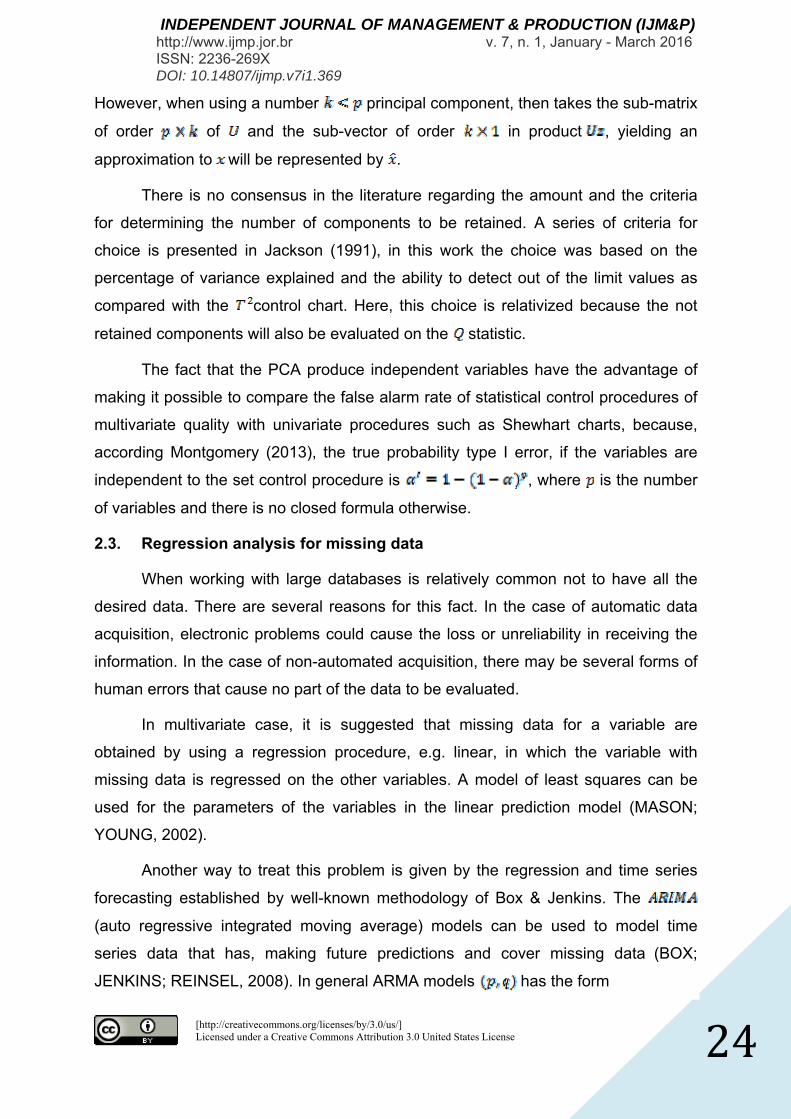
However, when using a number principal component, then takes the sub-matrix
of order of and the sub-vector of order in product , yielding an
approximation to will be represented by .
There is no consensus in the literature regarding the amount and the criteria
for determining the number of components to be retained. A series of criteria for
choice is presented in Jackson (1991), in this work the choice was based on the
percentage of variance explained and the ability to detect out of the limit values as
compared with the control chart. Here, this choice is relativized because the not
retained components will also be evaluated on the statistic.
The fact that the PCA produce independent variables have the advantage of
making it possible to compare the false alarm rate of statistical control procedures of
multivariate quality with univariate procedures such as Shewhart charts, because,
according Montgomery (2013), the true probability type I error, if the variables are
independent to the set control procedure is , where is the number
of variables and there is no closed formula otherwise.
2.3. Regression analysis for missing data
When working with large databases is relatively common not to have all the
desired data. There are several reasons for this fact. In the case of automatic data
acquisition, electronic problems could cause the loss or unreliability in receiving the
information. In the case of non-automated acquisition, there may be several forms of
human errors that cause no part of the data to be evaluated.
In multivariate case, it is suggested that missing data for a variable are
obtained by using a regression procedure, e.g. linear, in which the variable with
missing data is regressed on the other variables. A model of least squares can be
used for the parameters of the variables in the linear prediction model (MASON;
YOUNG, 2002).
Another way to treat this problem is given by the regression and time series
forecasting established by well-known methodology of Box & Jenkins. The
(auto regressive integrated moving average) models can be used to model time
series data that has, making future predictions and cover missing data (BOX;
JENKINS; REINSEL, 2008). In general ARMA models has the form
[http://creativecommons.org/licenses/by/3.0/us/] Licensed under a Creative Commons Attribution 3.0 United States License
25
INDEPENDENT JOURNAL OF MANAGEMENT & PRODUCTION (IJM&P) http://www.ijmp.jor.br v. 7, n. 1, January - March 2016 ISSN: 2236-269X DOI: 10.14807/ijmp.v7i1.369
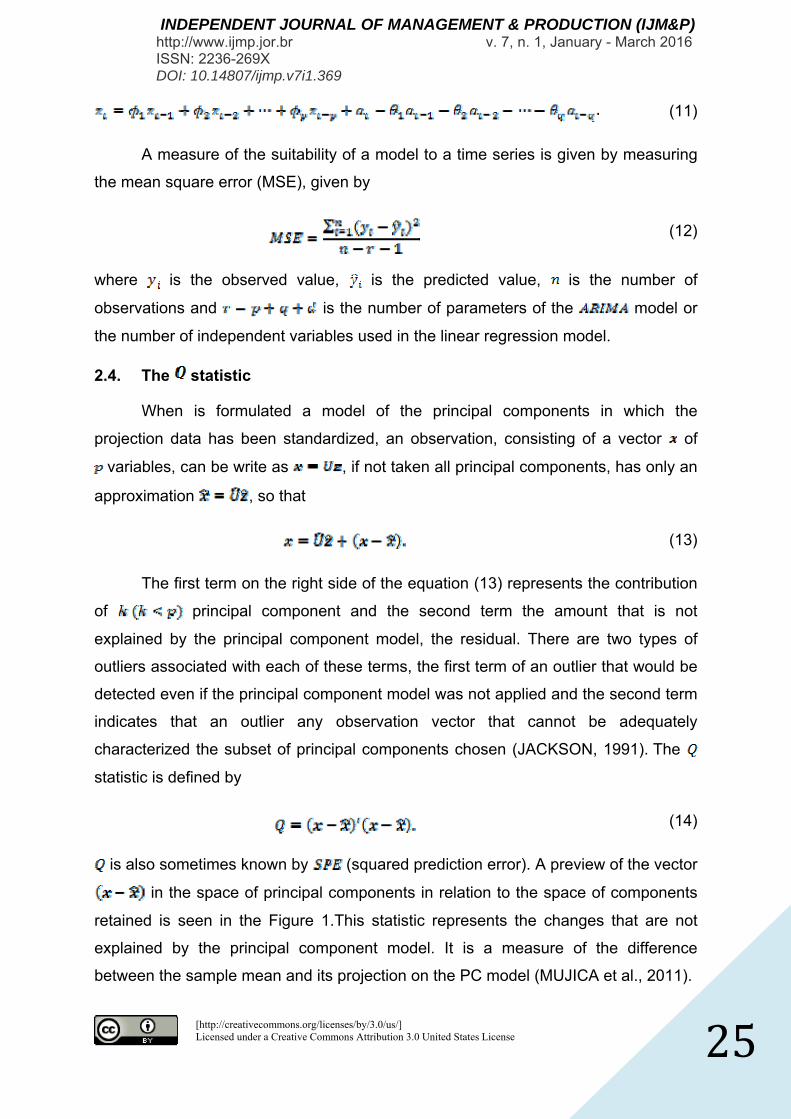
(11)
A measure of the suitability of a model to a time series is given by measuring
the mean square error (MSE), given by
(12)
where is the observed value, is the predicted value, is the number of
observations and is the number of parameters of the model or
the number of independent variables used in the linear regression model.
2.4. The statistic
When is formulated a model of the principal components in which the
projection data has been standardized, an observation, consisting of a vector of
variables, can be write as , if not taken all principal components, has only an
approximation , so that
(13)
The first term on the right side of the equation (13) represents the contribution
of principal component and the second term the amount that is not
explained by the principal component model, the residual. There are two types of
outliers associated with each of these terms, the first term of an outlier that would be
detected even if the principal component model was not applied and the second term
indicates that an outlier any observation vector that cannot be adequately
characterized the subset of principal components chosen (JACKSON, 1991). The
statistic is defined by
(14)
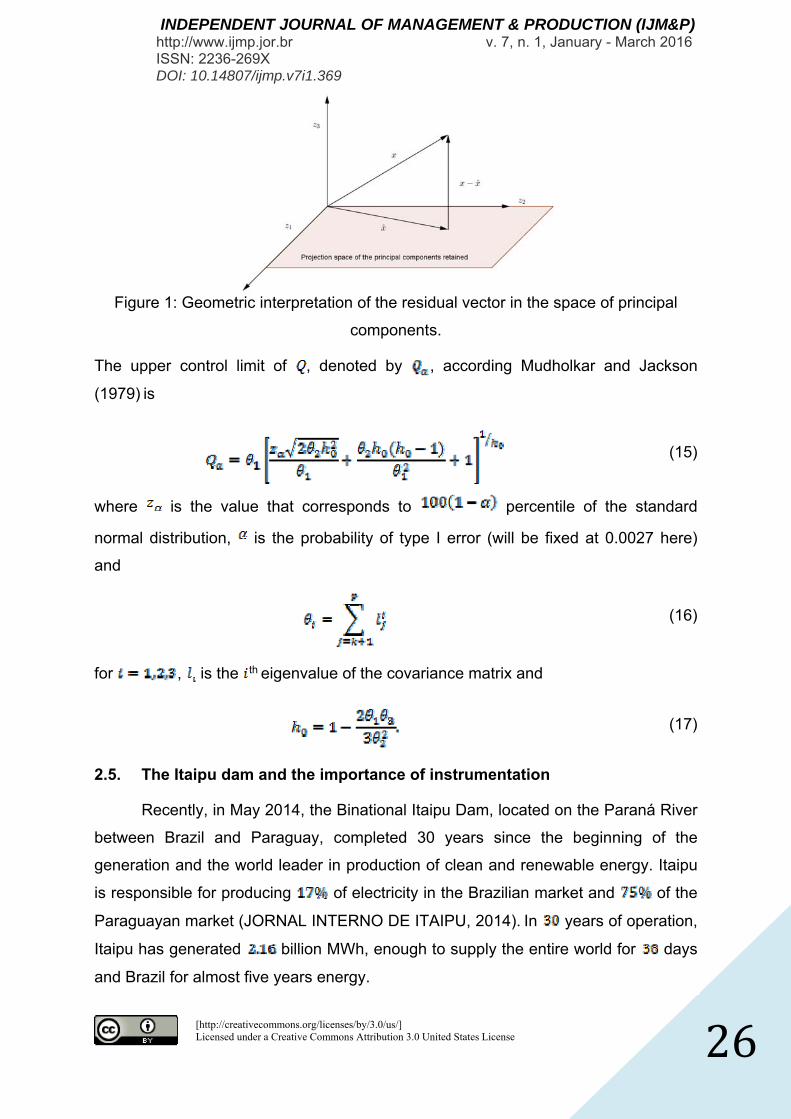
is also sometimes known by (squared prediction error). A preview of the vector
in the space of principal components in relation to the space of components
retained is seen in the Figure 1.This statistic represents the changes that are not
explained by the principal component model. It is a measure of the difference
between the sample mean and its projection on the PC model (MUJICA et al., 2011).
[http://creativecommons.org/licenses/by/3.0/us/] Licensed under a Creative Commons Attribution 3.0 United States License
26
INDEPENDENT JOURNAL OF MANAGEMENT & PRODUCTION (IJM&P) http://www.ijmp.jor.br v. 7, n. 1, January - March 2016 ISSN: 2236-269X DOI: 10.14807/ijmp.v7i1.369
Figure 1: Geometric interpretation of the residual vector in the space of principal
components.
The upper control limit of , denoted by , according Mudholkar and Jackson
(1979) is
(15)
where is the value that corresponds to percentile of the standard
normal distribution, is the probability of type I error (will be fixed at 0.0027 here)
and
(16)
for , is the th eigenvalue of the covariance matrix and
(17)
2.5. The Itaipu dam and the importance of instrumentation
Recently, in May 2014, the Binational Itaipu Dam, located on the Paraná River
between Brazil and Paraguay, completed 30 years since the beginning of the
generation and the world leader in production of clean and renewable energy. Itaipu
is responsible for producing of electricity in the Brazilian market and of the
Paraguayan market (JORNAL INTERNO DE ITAIPU, 2014). In years of operation,
Itaipu has generated billion MWh, enough to supply the entire world for days
and Brazil for almost five years energy.
[http://creativecommons.org/licenses/by/3.0/us/] Licensed under a Creative Commons Attribution 3.0 United States License
27
INDEPENDENT JOURNAL OF MANAGEMENT & PRODUCTION (IJM&P) http://www.ijmp.jor.br v. 7, n. 1, January - March 2016 ISSN: 2236-269X DOI: 10.14807/ijmp.v7i1.369
Itaipu is currently the second largest dam in the world in installed capacity,
MW in generating units, overcome by Three Gorges Dam in China which
has installed capacity of MW. Nevertheless, Itaipu still exceeded Three
Gorges in annual energy production until 2013 (JORNAL INTERNO DE ITAIPU,
2014; GAZETA DO POVO, 2014; GLOBO, 2014).
To maintain these important economic numbers from the point view of
environmental issues and the impact on the entire community that is close not only to
the dam, but also to the entire area of the reservoir, it is necessary to ensure that the
behavior of the structures is under control.
In countries where hydropower potential has been exploited extensively, this
development started over years ago and many dams are aging and it is necessary
to maintain the security conditions which may prevent costly repairs and that are
often conflicting with the production of energy (XXIII INTERNATIONAL COMITEE OF
LARGE DAMS, 2009). The improvement of dams not only ensures the safe operation
and performance, but also improves its efficiency (XXIII INTERNATIONAL COMITEE
OF LARGE DAMS, 2009).
The dams should have adequate instrumentation for monitoring their
performance. The goal is to control the operation of the dam safely under any
condition. The instrumentation shall allow the measurement of the structural behavior
and the physical condition of the dam (USACE, UNITED STATES ARMY CORPS OF
ENGINEERS, 1995).
3. DATA AND METHODS
This work was developed with real data from the instrumentation section E the
Itaipu hydroelectric plant, shown in Figure 2. Faced with various instruments present,
the piezometers were chosen because of the amount and the importance of their role
in measuring uplift pressures in the dam.
The E section has seven piezometers. As the frequency of readings from the
period of reservoir filling in varied, was chosen to analyze the period from
until when the readings were approximately biweekly for all piezometers. This
period generated readings for each instrument from now on called
piezometers .

[http://creativecommons.org/licenses/by/3.0/us/] Licensed under a Creative Commons Attribution 3.0 United States License
28
INDEPENDENT JOURNAL OF MANAGEMENT & PRODUCTION (IJM&P) http://www.ijmp.jor.br v. 7, n. 1, January - March 2016 ISSN: 2236-269X DOI: 10.14807/ijmp.v7i1.369
The reading of each piezometer is an independent and identically distributed
random variable. For phase I, the adjustment test (retrospective) of the model, were
selected readings and for Phase II validation (perspective) of the model, we
selected the remaining readings. It is important to mention that in this phase I data
are considered under the control of a statistical point of view. The instrument had
some missing data during the phase I. In this way, the linear and by time series
regressions were applied and the equation (12) was used to choose the best
model for filling the missing data.
Figure 2: Dam of Itaipu and section E featured.
Variables that are in very different scales and domain variation should be
standardized (JOHNSON; WICHERN, 2007). The reason for this procedure is that
the original variables can have scales and domain quite distinct giving false
interpretation of its real magnitude variability, which is avoided by standardizing
(MONTGOMERY, 2013).
The steps of the method consist of:
Gathering and data standardization;
Prediction of missing values;
Test the multivariate normality;
Choosing the Type I error probability and the estimate of the covariance
matrix;
Construct the graphic for the full set of variables;
[http://creativecommons.org/licenses/by/3.0/us/] Licensed under a Creative Commons Attribution 3.0 United States License
29
INDEPENDENT JOURNAL OF MANAGEMENT & PRODUCTION (IJM&P) http://www.ijmp.jor.br v. 7, n. 1, January - March 2016 ISSN: 2236-269X DOI: 10.14807/ijmp.v7i1.369
Extraction and selection of the number of principal components and normality
test;
Construction of the graph and the ellipse control of the principal
components in phases I and II;
Calculation of residual and statistics;
Construction of -chart;
Interpretation of results.
4. RESULTS
Among the forecast models for missing data to was chosen a model
with , the lowest compared to other regression
models and linear regression on the other variables to adjust missing data
between observations adjusted under the preceding. To evaluate the
hypothesis of multivariate normality was used a test of adjustment described in
Mingoti (2005) and Johnson and Wichern (2007). For each vector
containing the standard readings of piezometers was calculated
(18)
where corresponds to the percentile of the distribution . Once exactly
of the first phase of the sample satisfied the condition, we can accept the
hypothesis that the data come from a multivariate normal distribution at
confidence level.
For comparison, univariate charts Shewhart control of the sample mean
were built for phase I, , e is, according Montgomery
(2013) an unbiased estimator for σ, given by , where is the average
amplitude and , so that the false alarm rate is . The Table 1
shows the number of observations outside the control limits (OCL) to univariate
Shewhart charts respective of to instruments to 300 data of phase I. Note the
impossibility of univariate treatment with the high number of observations OCL.
To select the estimator covariance matrix to be used in chart for the data
on the seven standard piezometers were tested usual covariance matrix (2) and the
[http://creativecommons.org/licenses/by/3.0/us/] Licensed under a Creative Commons Attribution 3.0 United States License
30
INDEPENDENT JOURNAL OF MANAGEMENT & PRODUCTION (IJM&P) http://www.ijmp.jor.br v. 7, n. 1, January - March 2016 ISSN: 2236-269X DOI: 10.14807/ijmp.v7i1.369
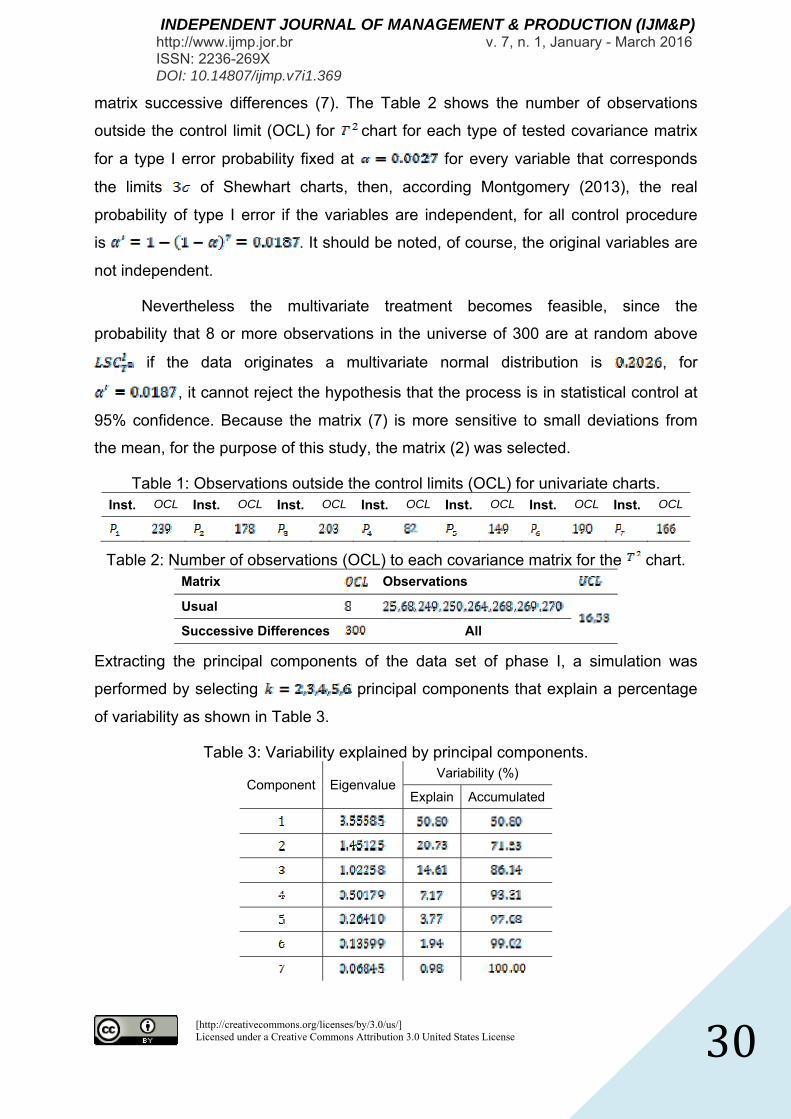
matrix successive differences (7). The Table 2 shows the number of observations
outside the control limit (OCL) for chart for each type of tested covariance matrix
for a type I error probability fixed at for every variable that corresponds
the limits of Shewhart charts, then, according Montgomery (2013), the real
probability of type I error if the variables are independent, for all control procedure
is . It should be noted, of course, the original variables are
not independent.
Nevertheless the multivariate treatment becomes feasible, since the
probability that 8 or more observations in the universe of 300 are at random above
if the data originates a multivariate normal distribution is , for
, it cannot reject the hypothesis that the process is in statistical control at
95% confidence. Because the matrix (7) is more sensitive to small deviations from
the mean, for the purpose of this study, the matrix (2) was selected.
Table 1: Observations outside the control limits (OCL) for univariate charts. Inst. OCL Inst. OCL Inst. OCL Inst. OCL Inst. OCL Inst. OCL Inst. OCL
Table 2: Number of observations (OCL) to each covariance matrix for the chart. Matrix
Observations
Usual
Successive Differences
All
Extracting the principal components of the data set of phase I, a simulation was
performed by selecting principal components that explain a percentage
of variability as shown in Table 3.
Table 3: Variability explained by principal components.
Component EigenvalueVariability (%)
Explain Accumulated
[http://creativecommons.org/licenses/by/3.0/us/] Licensed under a Creative Commons Attribution 3.0 United States License
31
INDEPENDENT JOURNAL OF MANAGEMENT & PRODUCTION (IJM&P) http://www.ijmp.jor.br v. 7, n. 1, January - March 2016 ISSN: 2236-269X DOI: 10.14807/ijmp.v7i1.369
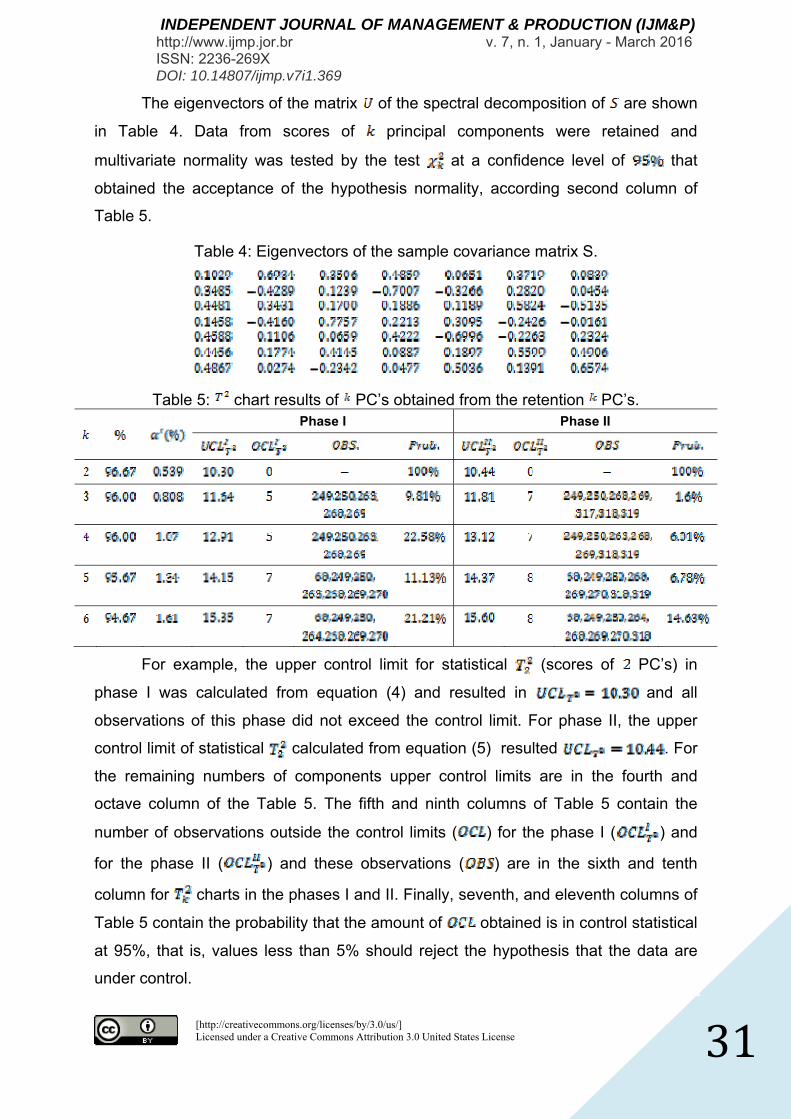
The eigenvectors of the matrix of the spectral decomposition of are shown
in Table 4. Data from scores of principal components were retained and
multivariate normality was tested by the test at a confidence level of that
obtained the acceptance of the hypothesis normality, according second column of
Table 5.
Table 4: Eigenvectors of the sample covariance matrix S.
Table 5: chart results of PC’s obtained from the retention PC’s.
Phase I Phase II
For example, the upper control limit for statistical (scores of PC’s) in
phase I was calculated from equation (4) and resulted in and all
observations of this phase did not exceed the control limit. For phase II, the upper
control limit of statistical calculated from equation (5) resulted . For
the remaining numbers of components upper control limits are in the fourth and
octave column of the Table 5. The fifth and ninth columns of Table 5 contain the
number of observations outside the control limits ( ) for the phase I ( ) and
for the phase II ( ) and these observations ( ) are in the sixth and tenth
column for charts in the phases I and II. Finally, seventh, and eleventh columns of
Table 5 contain the probability that the amount of obtained is in control statistical
at 95%, that is, values less than 5% should reject the hypothesis that the data are
under control.
[http://creativecommons.org/licenses/by/3.0/us/] Licensed under a Creative Commons Attribution 3.0 United States License
32
INDEPENDENT JOURNAL OF MANAGEMENT & PRODUCTION (IJM&P) http://www.ijmp.jor.br v. 7, n. 1, January - March 2016 ISSN: 2236-269X DOI: 10.14807/ijmp.v7i1.369
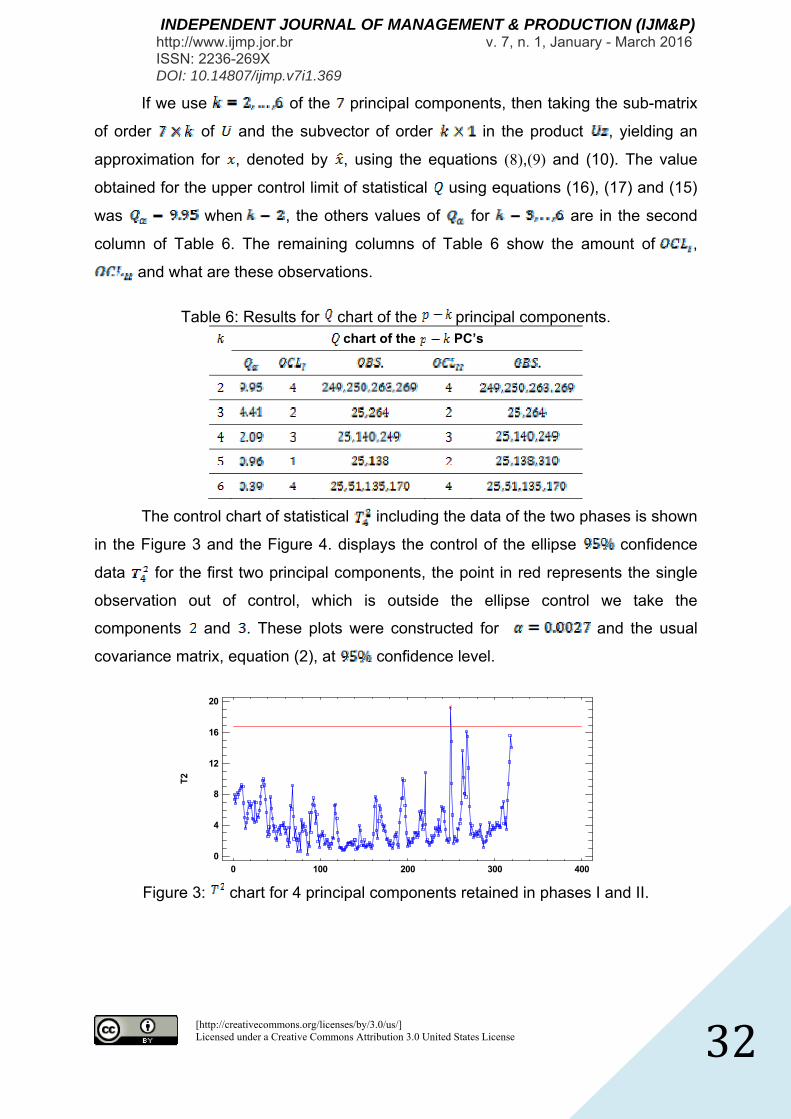
If we use of the principal components, then taking the sub-matrix
of order of and the subvector of order in the product , yielding an
approximation for , denoted by , using the equations (8),(9) and (10). The value
obtained for the upper control limit of statistical using equations (16), (17) and (15)
was when , the others values of for are in the second
column of Table 6. The remaining columns of Table 6 show the amount of ,
and what are these observations.
Table 6: Results for chart of the principal components.
chart of the PC’s
.
.
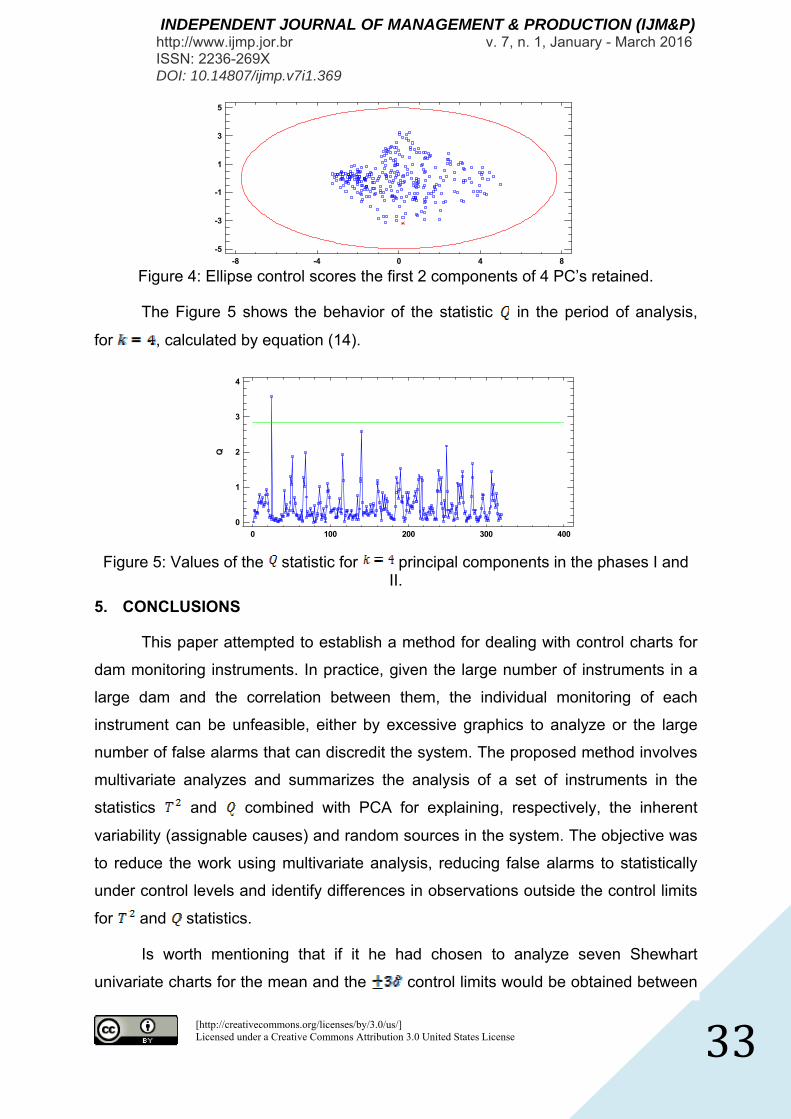
The control chart of statistical including the data of the two phases is shown
in the Figure 3 and the Figure 4. displays the control of the ellipse confidence
data for the first two principal components, the point in red represents the single
observation out of control, which is outside the ellipse control we take the
components and . These plots were constructed for and the usual
covariance matrix, equation (2), at confidence level.
T2
0 100 200 300 4000
4
8
12
16
20
Figure 3: chart for 4 principal components retained in phases I and II.
[http://creativecommons.org/licenses/by/3.0/us/] Licensed under a Creative Commons Attribution 3.0 United States License
33
INDEPENDENT JOURNAL OF MANAGEMENT & PRODUCTION (IJM&P) http://www.ijmp.jor.br v. 7, n. 1, January - March 2016 ISSN: 2236-269X DOI: 10.14807/ijmp.v7i1.369
-8 -4 0 4 8
-5
-3
-1
1
3
5
Figure 4: Ellipse control scores the first 2 components of 4 PC’s retained.
The Figure 5 shows the behavior of the statistic in the period of analysis,
for , calculated by equation (14).
0 100 200 300 400
0
1
2
3
4
Q
Figure 5: Values of the statistic for principal components in the phases I and II.
5. CONCLUSIONS
This paper attempted to establish a method for dealing with control charts for
dam monitoring instruments. In practice, given the large number of instruments in a
large dam and the correlation between them, the individual monitoring of each
instrument can be unfeasible, either by excessive graphics to analyze or the large
number of false alarms that can discredit the system. The proposed method involves
multivariate analyzes and summarizes the analysis of a set of instruments in the
statistics and combined with PCA for explaining, respectively, the inherent
variability (assignable causes) and random sources in the system. The objective was
to reduce the work using multivariate analysis, reducing false alarms to statistically
under control levels and identify differences in observations outside the control limits
for and statistics.
Is worth mentioning that if it he had chosen to analyze seven Shewhart
univariate charts for the mean and the control limits would be obtained between
[http://creativecommons.org/licenses/by/3.0/us/] Licensed under a Creative Commons Attribution 3.0 United States License
34
INDEPENDENT JOURNAL OF MANAGEMENT & PRODUCTION (IJM&P) http://www.ijmp.jor.br v. 7, n. 1, January - March 2016 ISSN: 2236-269X DOI: 10.14807/ijmp.v7i1.369
82 and 239 values out of control (see Table 1) and the problem of establishing the
limit values for instruments cannot be treated by this technique.
The results show that the principal components model combined with the
statistic best fit data of phase I when are taken, at least, four principal components,
because in this case the observations listed as out of control to the chart
appearing as out of control to the chart of principal components or chart
(compare Table 2, Table 5 and Table 6) and showed that, in the case study applied
the multivariate monitoring of piezometers, located in section E of the Itaipu
hydroelectric plant, system is in statistical control at confidence, independently
of the contracted model, i.e., chart or principal components combined with
statistic.
Another benefit of the combined use of these statistics with 4 principal
components was that the observations identified as out of control, one can make a
distinction between them. Among the observations given as out of control for the
statistic for 4 PC's (see Table 6), observation 25 is related to the maximum global
value of the instrument , observation 140 is associated with the local maximum
value in the instrument (both outliers are apparent) and observation 249 is
associated with the global maximum of which is the instrument with smaller
variance.
The adopted model enables an interpretation of the PC’s as a consequent
variability of environmental factors (inherent) to the model. It is essential to
understand that the variability of the principal components is originated from these
factors and also control the random variability that may be linked to outliers
( statistic).
The use of principal components has another advantage which is to overcome
the problem of singularities. In this case study, for example, the determinant of the
covariance of all the original variables matrix was . The singularities are
associated with the existence of eigenvalues near zero that can generate
computational problems in the inversion of the covariance matrix and the consequent
calculation of statistical.
The first four principal components explain more than 90% of the variability. It
was observed that the first principal component has an interpretation in terms of an

[http://creativecommons.org/licenses/by/3.0/us/] Licensed under a Creative Commons Attribution 3.0 United States License
35
INDEPENDENT JOURNAL OF MANAGEMENT & PRODUCTION (IJM&P) http://www.ijmp.jor.br v. 7, n. 1, January - March 2016 ISSN: 2236-269X DOI: 10.14807/ijmp.v7i1.369
average contribution of each instrument for the overall variability and that this
depends on the elevation layer and in which they are. According to the first column of
Table 4, it can be seen that the instrument is has the greatest contribution to this
principal component and its location is before a concrete injection curtain and at a
lower elevation, i.e., the local theoretically more susceptible to uplift pressures. The
second instrument with greater contribution in this principal component is located
in a joint with lower elevation, as shown in Figure 6. Since the instrument that has
almost no effect on this component is and its location is after injection curtain at
the top elevation of instruments study. This confirms the efficiency of concrete
injecting curtain at the dam.
Figure 6: Piezometers in section E of Itaipu Dam
Source: adapted from Itaipu Binational.
Suggestions for future work involving this type of approach may be the use of
non-parametric statistics, the variation of the rate of false alarms and the analysis
of other instruments can also enable the discovery of new knowledge, as well as
seek interpretation for other principal components.
Acknowledgements. The team CEASB - Advanced Center for Studies on Dam
Safety, in the accord between Itaipu Binational and the Itaipu Technological Park, for
the collaboration and reliance.
REFERENCES
BERSIMIS, S.; PSARAKIS, S.; PANARETOS, J. (2007) 'Multivariate statistical process control charts: an overview', Quality and Reliability engineering international, v. 23, p. 517-543, doi:10.1002/qre.829.
BOX, G. E. P.; JENKINS, G. M.; REINSEL, G. C. (2008) Time-series analysis -
[http://creativecommons.org/licenses/by/3.0/us/] Licensed under a Creative Commons Attribution 3.0 United States License
36
INDEPENDENT JOURNAL OF MANAGEMENT & PRODUCTION (IJM&P) http://www.ijmp.jor.br v. 7, n. 1, January - March 2016 ISSN: 2236-269X DOI: 10.14807/ijmp.v7i1.369
forecasting and control, 4ª ed., Hoboken, New Jersey: John Wiley & Sons, Inc.
CHENG, L.; ZHENG, D. (2013) 'Two online dam safety monitoring models based on the process of extracting environmental effect', Advances in Engineering Software, v. 57,pp. 48-56, doi:10.1016/j.advengsoft.2012.11.015.
CHOU, Y. M.; MASON, R. L.; YOUNG, J. C. (1999) 'Power comparisons for a Hotelling's T2 statistic', Commun. Statist. Simulation Comput., v. 28, p. 1031-1050, doi:10.1080/03610919908813591.
GAZETA DO POVO (2014) Gazeta do Povo, 08 Maio, [Online], Available: HYPERLINK www.gazetadopovo.com.br/economia/especial-itaipu-30-anos/conteudo.phtml?tl=1&id=1466225&tit=Gigante-pela-propria-natureza [08 Maio 2014].
GLOBO (2014) G1 Globo, [Online], Available: HYPERLINK www.g1.globo.com/pr/oeste-sudoeste/noticia/2014/05/seria-inimaginavel-o-paraguai-e-o-brasil-sem-itaipu-diz-diretor-geral.html [08 maio 2014].
GU, C. S.; ZHAO, E. F.; JIN, Y.; SU, H. Z. (2011) Singular value diagnosis in dam safety monitoring effect values, Sciencie China Technological Sciences, v. 54, n. 5, May, p. 1169-1176, doi 10.1007/s11431-011-4339-7.
HOLMES, D. S.; MERGEN, A. E. (1993) Improving the performance of the T2 control chart, Quality Engineering, v. 5, n. 4, March, p. 619-625, DOI:10.1080/08982119308919004.
HOTELLING, H. (1947) Multivariate quality control, Techniques of statistical analysis, p. 111-184.
ITAIPU BINACIONAL (1999) Estudos para a reavaliação dos valores de controle para a instrumentação civil das estruturas e fundações (2660.50.15402.P), Foz do Iguaçu.
ITAIPU BINACIONAL (1999) Estudos para a reavaliação dos valores limites para a instrumentação civil das estruturas e fundações (2662.50.15401-P), Foz do Iguaçu.
JACKSON, J. E. (1991) A user's guide to principal components, New York: John Wiley & Sons, Inc.
JOHNSON, R. A.; WICHERN, D. W. (2007) Applied Multivariate Statistical Analysis, 6th. ed., Upper Saddle River - NJ: Pearson Prentice Hall.
JORNAL INTERNO DE ITAIPU (2014) JIE, 08 maio, [Online], Available: HYPERLINK jie.itaipu.gov.br/index.php?secao=noticias_itaipu&q=node/6&pagina=4 [08 maio 2014].
KOURTI, T. (2005) Application of latent variable methods to process control and multivariate statistical process control in industry, International Journal of adaptive control and signal processing, v. 19, p. 213-246, doi: 10.1002/acs.859.
KRUGER, U.; XIE, L. (2012) Statistical monitoring of complex multivariate process with applications in industrial process control, Chichester: John Wiley & Sons.
LOH, C. H.; CHEN, C. H.; HSU, T. Y. (2011) Application of advanced statistical methods for extracting long-term trends in static monitoring data from an arch dam,
[http://creativecommons.org/licenses/by/3.0/us/] Licensed under a Creative Commons Attribution 3.0 United States License
37
INDEPENDENT JOURNAL OF MANAGEMENT & PRODUCTION (IJM&P) http://www.ijmp.jor.br v. 7, n. 1, January - March 2016 ISSN: 2236-269X DOI: 10.14807/ijmp.v7i1.369
Structural Health Monitoring, v. 10, n. 6, November, p. 587-601, doi: 10.1177/1475921710395807.
MASON, R. L.; YOUNG, J. C. (2002) Multivariate statistical process control with industrial applications, Philadelphia - Pennsylvania: ASA SIAM - American statistical Association - Society for industrial and applied mathematics.
MINGOTI, S. A. (2005) Análise de dados através de métodos de estatística multivariada: uma abordagem aplicada, Belo Horizonte: UFMG.
MONTGOMERY, D. C. (2013) Introdução ao Controle Estatístico de Qualidade, 4th edition, Rio de Janeiro: LTC.
MUDHOLKAR, G. S.; JACKSON, J. E. (1979) Control procedures for residual associated with principal components analysis., Technometrics, v. 21, n.3, August, p. 341-349.
MUJICA, L. E.; RODELLAR, J.; FERNÁNDEZ, A.; GUEMES, A. (2011) Q-statistic and T2 statistic PCA-based measures for damage assessment in structures, Structural Health Monitoring, v. 10, n. 5, September, p. 539-553, doi: 10.1177/1475921710388972.
NEDUSHAN, B. A. (2002) Multivariate statistical analysis of monitoring data for concrete dams, Montreal: PhD Thesis, McGill University - Department of Civil Engineering and Apllied Mechanics.
ROSSO, J. A.; FIORINI, A. S.; PORTO, E. C.; SILVEIRA, J. F. (1995) Barragem de Itaipu - Lições aprendidas com o comportamento térmico das estruturas tipo gravidade aliviada e contraforte, XXII Seminário Nacional de Grandes Barragens, São Paulo.
RYAN, T. P. (2011) Statistical Methods for Quality Improvement, John Wiley & Sons.
USACE, UNITED STATES ARMY CORPS OF ENGINEERS (1995) Enginnering and Design - Instrumentation of Embankment Dams and Levees, Washington, DC.
XXIII INTERNATIONAL COMITEE OF LARGE DAMS (2009) Hydropower current developments - Question 88, Dams and Hydropower, Brasília, 6-8.
XXIII INTERNATIONAL COMITEE OF LARGE DAMS (2009) Question 90, Upgrading of existing dam, Brasília, 7.
YU, H.; WU, Z. R.; BAO, T. F.;ZHANG, L. (2010) Multivariate analysis in dam monitoring data with PCA, Sciencie China Technological Sciences, v. 53, n. 4, April, p. 1088-1097, doi: 10.1007/s11431-010-0060-1.