38 cool materials in the urban built environment to ... · were obtained from the brazilian...
TRANSCRIPT
38th AIVC International Conference, 13-14 Sep 2017, Nottingham, UK
Cool materials in the urban built environment to mitigate
heat islands: potential consequences for building
ventilation
Carolina de Rezende Maciel*1, Maria Kolokotroni2,
1 School of Architecture and City Planning
Mackenzie Presbyterian University
São Paulo, Brazil
*Corresponding author:
2 Institute for Energy Futures,
Brunel University London,
Uxbridge, Middlesex, UB8 3PH, UK
ABSTRACT
Urban warming, commonly referred to as the ‘Urban Heat Island’ phenomenon (UHI), is a well-established effect
that affects cities all over the world. This occurs due to urban physical characteristics such as urban canyon
geometry and vegetation, but mainly to its typical materials. The thermal properties of the materials used for the
external walls and roofs of buildings, as well as pavements, can have a major influence on the surface temperature.
As a consequence of increased temperature, the UHI has an effect on energy consumption for heating and cooling
urban buildings. Cool materials are a cost effective, environmentally friendly and passive technique that uses a
coating with high thermal emissivity and solar reflectance properties. At building scale, this technique is
recognized for decreasing the amount of heat conducted through the surface and the solar thermal load of the
building, reducing its energy requirements for cooling. At urban scale, this strategy contributes to improving the
urban microclimate by lowering surface and air temperatures which, in turn, increases the potential for ventilative
cooling in the buildings. The goal of this paper is to evaluate the impact of the use of cool materials on the thermal
environment of urban spaces and how this can affect ventilative cooling for buildings. The cool materials were
evaluated considering the application on roofs and pavements, and the Federal University of Mato Grosso campus,
located in Cuiabá, Brazil was used as case study. The study was performed through computer simulations where
the 3 scenarios (cool roof, cool pavement and reference scenario) were simulated for the climate of Cuiabá (Aw2
Köppen classification – Tropical wet and dry), considering winter and summer conditions. The methodology
consists of three steps: a. preparatory stage (acquisition and compilation of climatic data and physical
characteristics of the study area), b. numerical simulation and c. validation of the model and data calibration, for
further comparative analysis. As a result, in the scenarios where cool materials were applied, significant differences
were found both in the surface temperature and air temperature (height of the pedestrians), up to 7.02°C. The
difference was more evident when used as cool pavement than when used as cool roof and this tendency varies in
amplitude, considering the locality within the study area and the season analysed. These results allow us to infer
that cool materials can increase the potential of the ventilation as strategy for cooling indoor environments,
especially by means of stack ventilation which is benefited from greater temperature differences. Thus, it is
believed that the wide use of such materials can significantly contribute not only to the mitigation of the heat island
effect, but also to reduce overheating risk in buildings by increasing the effectiveness of ventilative cooling and
thus reduce the need for air conditioning.
KEYWORDS
Cool materials; urban heat island effect; cooling ventilation; building ventilation.
1 INTRODUCTION
The objective of this paper is to evaluate the impact of the use of cool materials on the thermal
environment of urban spaces and their potential consequences for cooling ventilation for
buildings. The study was conducted through computational simulations with the ENVI-met
software investigating the case study of the Federal University of Mato Grosso campus, located
in Cuiabá, Brazil.
2 METHODOLOGY
The method of this work is divided into three main stages, described in the following sections.
2.1 Preparatory Stage: acquiring data
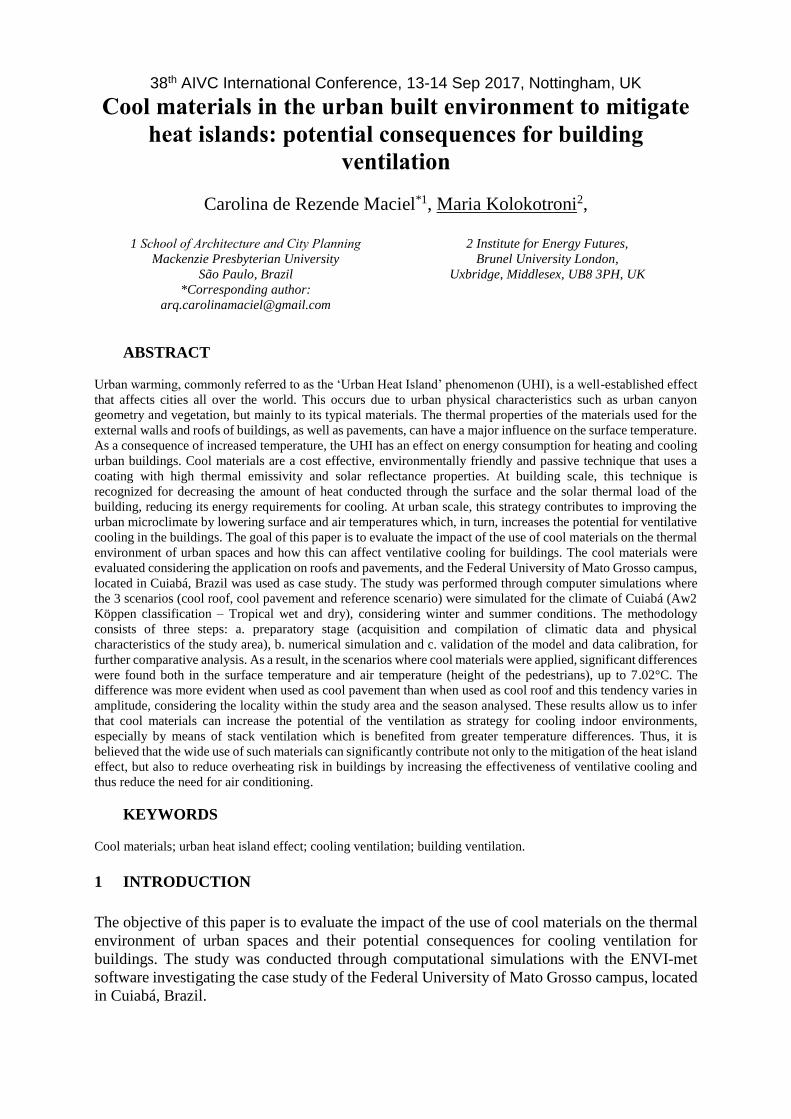
The study was conducted in the city of Cuiabá (Figure 1a), capital of the state of Mato Grosso,
known as one of the hottest cities in Brazil. According to Koppën classification, its climate is
Aw2 type, i.e., Tropical wet and dry or savanna climate, characterized by high temperatures
throughout the year, alternating between two well defined seasons, one dry (autumn-winter)
and one rainy (spring-summer). For the 10-year period prior to the research (2002-2012),
average annual maximum temperature ranges from 28 °C to 38 °C while average annual
minimum temperature from 15 to 24 ° C. The average relative humidity varied between 52%
(August) and 84% (February). (BDMEP/INMET, 2017).
2.1.1 Definition of the study area:
The area to be investigated was partly chosen considering the requirements of the ENVI-met
software which needs (a) low topographic variation, (b) dimensions compatible with the
software’s limits (both surface area and time processing) and (c) to include elements
(pavements and roofs) in which cool materials can be applied.
The area chosen is essentially flat (ranging from 165m to 185m). In relation to the size of the
area, the version of the software used in this study (v3.1 Beta 5) allows the composition of a
horizontal grid up to 250x250 squares. A scale of 2.5x2.5m was used for each grid, which
allowed to cover a total area of 600mx600m. Greater grid values (5x5m, for example), would
simplify the features and smaller grid values (1x1m, for example) would greatly limit the
dimensions of the total area to be simulated.
The Eastern portion of the campus was chosen, since it includes most of the campus buildings
as well as large areas of paved surfaces. Thus, considering the three conditions described, the
final area selected for the simulation of the scenarios is the Eastern part of the campus,
comprising a total of 36ha (figure 1b).
(a)
(b)
Figure 1: (a) Location of Cuiabá on the map of Brazil; (b) Study area – Federal University of Mato Grosso;
Source: Adapted from Wikipedia (2015) and Google Earth (2014)
2.1.2 Microclimatic data acquisition
To configure the Input files of the computational model, we use data from the reference station
(83362) - Marechal Rondon Airport, in Várzea Grande, MT, located 6.5 km from the study
area. Air temperature data was collected from the Weather Underground
(http://www.wunderground.com) and the University of Wyoming website
(http://weather.uwyo.edu/uppeair). The reference station at Marechal Rondon Airport provided
data (frequency 1h in 1h) of direction and wind speed at 10m height (m/s), atmosphere
temperature (K), mixing ratio at 2500m (g/kg) and relative humidity (%) at 2m height.
For the validation of the simulation results, data collected directly in the study area were used,
through the Outdoor Weather Station (Onset model U30 Wi-Fi) fixed above the roof to an
approximate height of 7.00 m inserted at the Eastern side of the campus. This station provided
data, at a frequency of 5 minutes, of the air temperature (°C) used in the data calibration stage.
Three months during each season were used, i.e. summer (hot-humid) February, March and
April of 2012 and winter (hot-dry), July, August and September of 2012.
2.1.3 Spatial characterization of the area
To perform the simulations it is necessary to build an area file that contains the characteristics
of the study area. The acquisition of these data was informed by previous work (Maciel, 2011,
Silva, 2009), and included the collection of high resolution images of the study area (figure 1b)
from Google Earth of dates close to the period in which micrometeorological data were
collected. Data such as height of buildings, were identified through on-site visits while
definition of albedo values was based on the work of Sailor and Fan (Sailor & Fan, 2002) and
Oke (Oke, 1987).
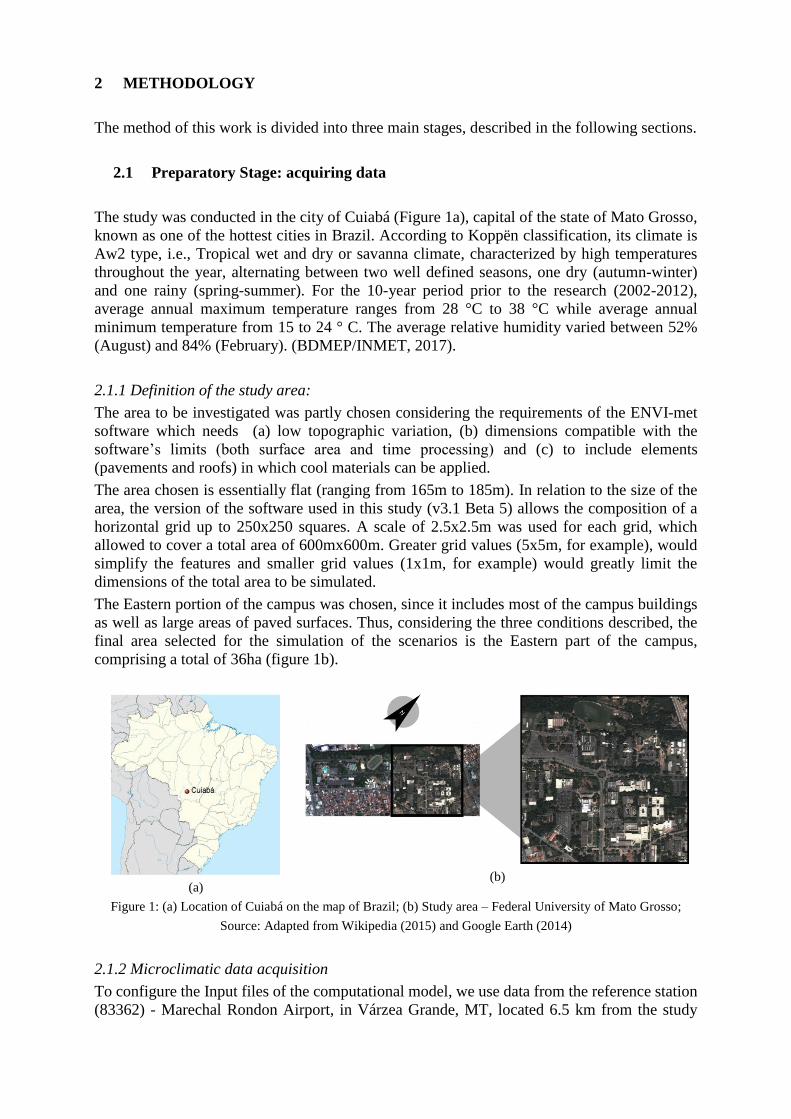
The high-resolution image is inserted into Computer Aided Design (CAD) software in a scale
appropriate for the study, allowing detail recognition. Thus, a grid with the defined dimension
is drawn (2.5mx2.5m in this case), and the characteristics of the area are identified, such as
different ground cover materials, areas occupied by buildings and other elements, resulting in
the map of figure 2a. The final step is to insert the categorized information (figure 2a) in the
ENVI-met software, shown in figure 2b.
(a)
(b)
Figure 2: (a) Area attributes categorization in CAD software; (b) Study area inside ENVI-met software;
Table 1 presents information of the characterized areas.
Table 1: Surface areas of the attributes in study area – UFMT campus
Attribute category Relative area (%) Absolute area (m2)
Water bodies 2,7% 10,068.75
Uncovered soil 3,7% 13,650.02
Sidewalk (concrete) 9,9% 35,645.59
Vegetation - trees 17% 61,355.23
Buildings 18,8% 67,731.25
Vegetation – grass 22,6% 81,364.77
Asphalt 25% 90,184.385
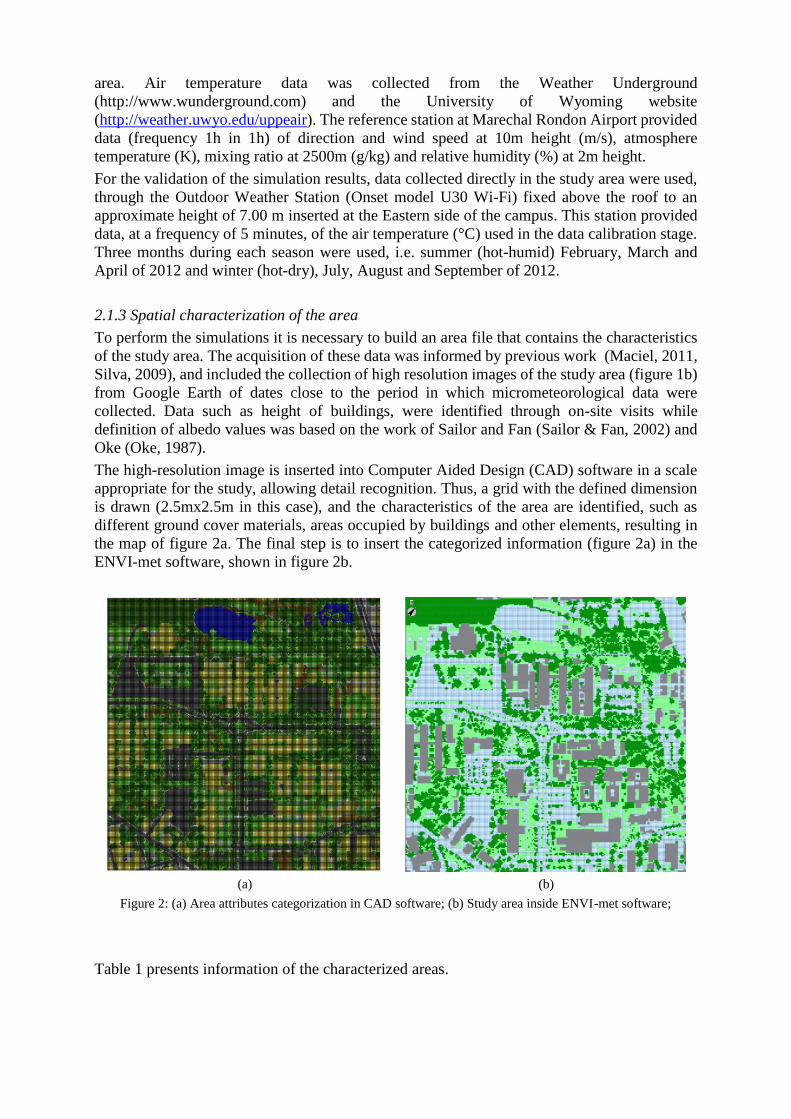
For the specific tree characterization the Scion Image© software as described in (Watkins &
Kolokotroni, 2012). The method allows the interpretation of the gray shades of the image
(figure 3a and figure 3b). In addition, the concept of the Green Plot Ratio proposed by Ong
(Ong, 2003) was considered for the characterization of tree species.
(a)
(b)
Figure 3: (a) Portion of the study area (with trees); (b) Analysis of gray shades in the Scion Image©;
2.2 Numerical Simulation
Three different scenarios were created: Scenario 1 - Cool roof; Scenario 2 – Cool Pavement;
and Scenario 3 - Reference (current situation). Each scenario was simulated for summer and
winter, totalling 6 simulations.
2.2.1 Input files settings
The simulation day and time are defined according to the season of the year to be simulated. It
is recommended that the simulations begin at night, minimizing the possibility of convergence
errors due to the existence of short-wave radiation in the first few hours of the simulation,
(Francisco, 2012). The total simulation time must be at least 48 hours, from which the first 24
hours are the pre-conditioning period. For the present study the simulation was defined the start
time at 20h with duration of 48 hours.
The surface roughness value at the reference point was defined according to Oke (1996) and
weather data was sourced from Marechal Rondon Airport reference station. Soil temperature
and humidity, were sourced from (Rosseti, 2013), both for summer and winter seasons (adjusted
for vegetation-irrigated). The values for thermal transmittance (U-value) of walls and roofs
were obtained from the Brazilian Standard NBR-15220 (ABNT, 2005).
2.2.2 Scenario modelling
The reference scenario was simulated first and then the two hypothetical scenarios according
to values usually found for cool roof and cool pavement, described by Gartland (Gartland,
2010). The impact is calculated, therefore, by the temperature difference between the reference
scenario and each hypothetical scenario.
a) Scenario 1 – Cool Roof: For this strategy, the attribute responsible for the modifications in
the microclimate is the area of roofs, defined by the projection of the buildings contained in the
study area, totalling 67,731m2 or 18.8% of the total surface area. Inside the ENVI-met
environment, this strategy is implemented by modifying the albedo values of this element, from
0.15 (reference configuration, described by Oke, 1987), to 0.85 (cool roof configuration).
b) Scenario 2 – Cool Pavement: For this strategy, the attribute responsible for the modifications
in the microclimate is the entire area of impervious materials, that is, the sum of the surfaces of
pavements and asphalt surfaces, totalling 125,830m2, or 34.9% of the total surface area. Inside
the ENVI-met environment, this strategy is implemented by modifying the albedo values of the
sidewalks, from 0.1 (reference configuration, described by Oke, 1987), to 0.60 (cool surface
configuration) and the albedo values for asphalt, from 0.05 (reference configuration, described
by Oke, 1987), to 0.80 (cool surface configuration).
2.3 Validation of the model and data calibration
To validate the area model, it was necessary to compare the data recorded in loco with the data
generated by the ENVI-met model for each of the seasons studied winter (hot-dry) and summer
(hot-humid).
The data recorded in loco were collected by the weather station located inside the study area,
while the data generated by the software were registered through 5 sensors arranged in the
vicinity of weather station spot, within ENVI-met virtual environment. The average hourly air
temperature (°C) of these 5 sensors was calculated for the height of 7m (same as weather
station).
Table 2: Data period used for validation and calibration
Season (simulated day) Validation Calibration
Summer (26/03/2012) February + April /2012 March/2012
Winter (25/08/2012) July + September /2012 August/2012
The indicators presented in Table 3 (R2 – coefficient of determination, RMSE - Root Mean
Square Error, MAE – Mean Absolute Error and, MBE – Mean Bias Error) indicate very good
agreement between measurements and predictions
Table 3: Model indicator for validation and calibration steps
Season (step) R2 RMSE MAE MBE
Summer (validation) 0,95125 2,3881 2,0022 1,2923
Winter (validation) 0,95252 2,2088 1,9477 0,3315
Summer (calibration) 0,96002 1,3017 1,1312 0,3701
Winter (calibration) 0,96786 3,3615 3,0531 -0,0050
3 RESULTS AND DISCUSSION
The results are displayed using chromatic maps, highlighting the impact of each strategy (cool
roof and cool pavement), i.e. the values presented are the difference between the reference
scenario and the scenario with strategy. The periods of times are those that characterize the
phenomenon of heat island, recommended by World Meteorological Organization (WMO): 6h
for morning, 13h for afternoon and 20h for night.
The results were commented as Area average value and Point value, already adjusted through
the calibration equations, for both periods. The value of the Area average represents the mean
value of all the grids present in the study area, at a height of 1.10m from the ground, being
therefore a measure of the effect of the strategy on the space as a whole. The Point value
represents the value from a single grid, which represents the maximum effect that the strategy
reached in a localized way. The colored arrows in blue and red, next to the symbol of the north
orientation, represent the predominant direction of the wind for each of the stations, summer
(330°) and winter (170°), respectively, counted clockwise from the North.
3.1 Scenario 1 – Cool Roof
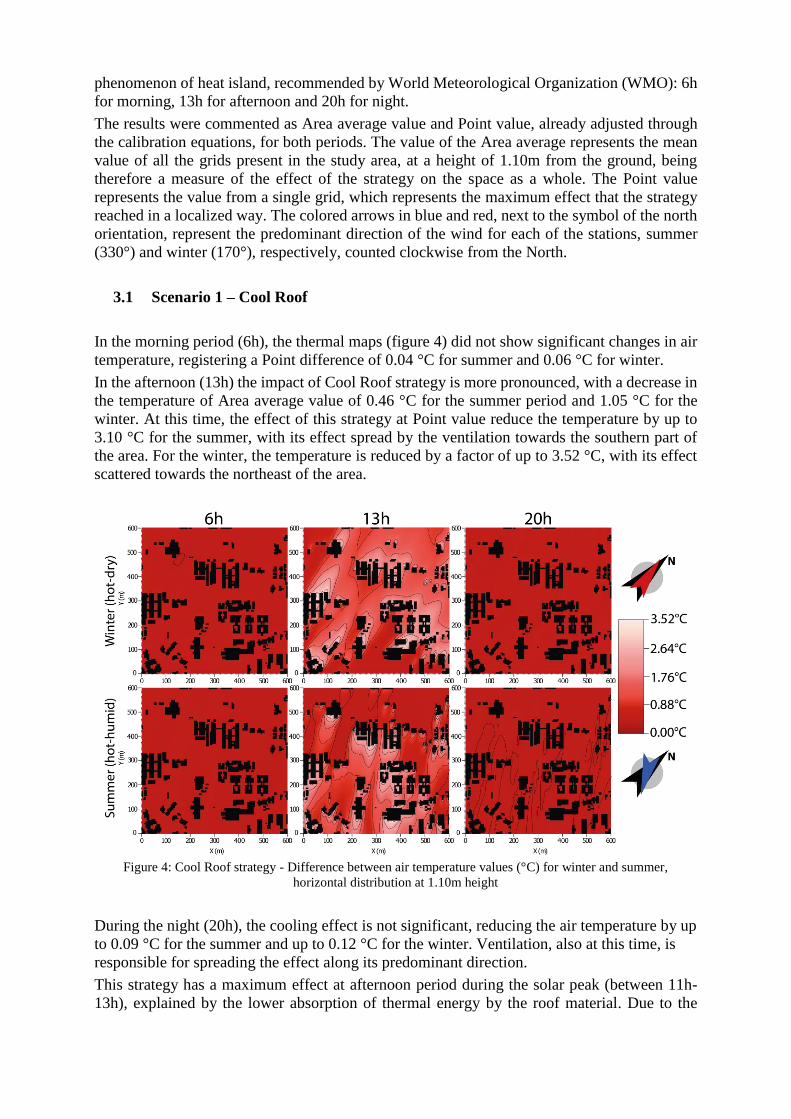
In the morning period (6h), the thermal maps (figure 4) did not show significant changes in air
temperature, registering a Point difference of 0.04 °C for summer and 0.06 °C for winter.
In the afternoon (13h) the impact of Cool Roof strategy is more pronounced, with a decrease in
the temperature of Area average value of 0.46 °C for the summer period and 1.05 °C for the
winter. At this time, the effect of this strategy at Point value reduce the temperature by up to
3.10 °C for the summer, with its effect spread by the ventilation towards the southern part of
the area. For the winter, the temperature is reduced by a factor of up to 3.52 °C, with its effect
scattered towards the northeast of the area.
Figure 4: Cool Roof strategy - Difference between air temperature values (°C) for winter and summer,
horizontal distribution at 1.10m height
During the night (20h), the cooling effect is not significant, reducing the air temperature by up
to 0.09 °C for the summer and up to 0.12 °C for the winter. Ventilation, also at this time, is
responsible for spreading the effect along its predominant direction.
This strategy has a maximum effect at afternoon period during the solar peak (between 11h-
13h), explained by the lower absorption of thermal energy by the roof material. Due to the
albedo, therefore, is expected to have a greater effect at times with higher solar radiation value,
in comparison with the reference scenario.
Considering only the interval with solar radiation (7h-17h), the strategy of cool roof resulted in
a decrease of 2.02 °C and 2.22 °C in Area average value for the summer and winter periods,
respectively. These values are in line with recent numerical studies in temperate climates that
have evaluated the impact of applying cool materials on roofs. Virk et al (2014) predicted
average daily air temperature differences of 0.44 °C at a height of 1.5m above the roof on clear
summer days in London with maximum difference of 1.37 °C occurring during the morning
with solar radiation of 285W/m2. Li et al (2014) also predict reduction of near surface air
temperature during the daytime of 0.6 °C for a temperate climate.
3.2 Scenario 2 – Cool Pavement
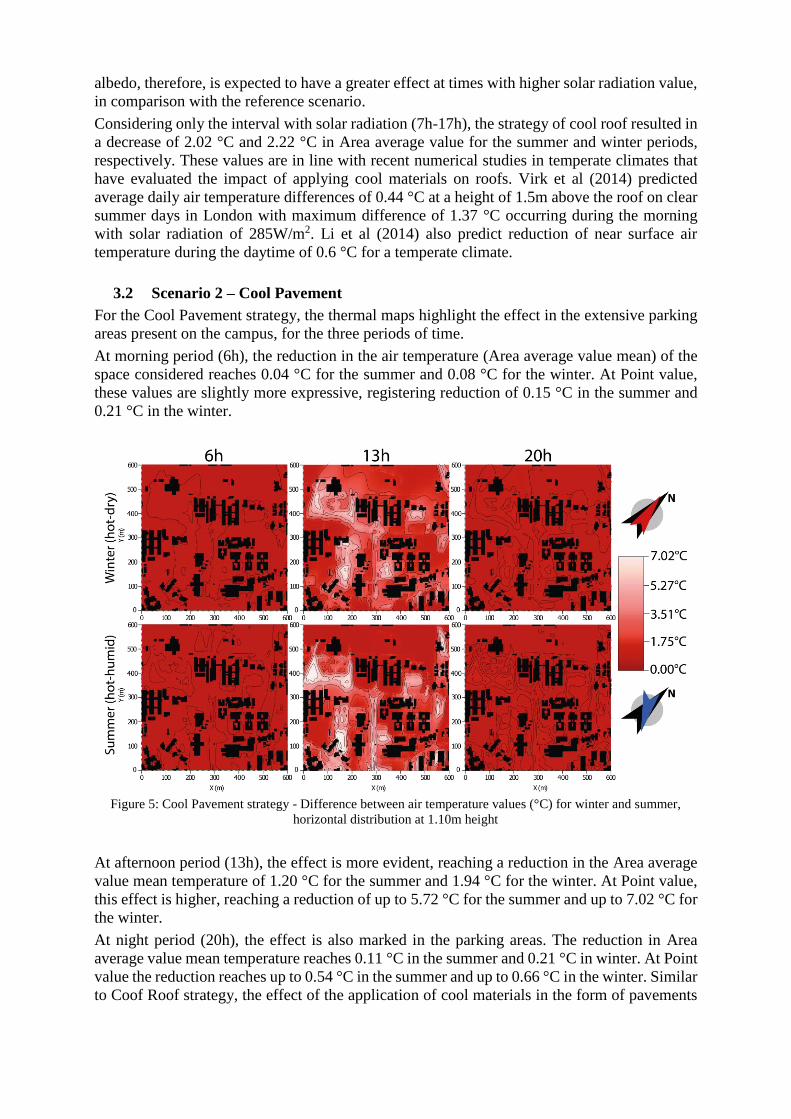
For the Cool Pavement strategy, the thermal maps highlight the effect in the extensive parking
areas present on the campus, for the three periods of time.
At morning period (6h), the reduction in the air temperature (Area average value mean) of the
space considered reaches 0.04 °C for the summer and 0.08 °C for the winter. At Point value,
these values are slightly more expressive, registering reduction of 0.15 °C in the summer and
0.21 °C in the winter.
Figure 5: Cool Pavement strategy - Difference between air temperature values (°C) for winter and summer,
horizontal distribution at 1.10m height
At afternoon period (13h), the effect is more evident, reaching a reduction in the Area average
value mean temperature of 1.20 °C for the summer and 1.94 °C for the winter. At Point value,
this effect is higher, reaching a reduction of up to 5.72 °C for the summer and up to 7.02 °C for
the winter.
At night period (20h), the effect is also marked in the parking areas. The reduction in Area
average value mean temperature reaches 0.11 °C in the summer and 0.21 °C in winter. At Point
value the reduction reaches up to 0.54 °C in the summer and up to 0.66 °C in the winter. Similar
to Coof Roof strategy, the effect of the application of cool materials in the form of pavements
also has a more evident effect during sun peak times, in response to the variation in the albedo
value, which results in greater reflection of the amount of thermal energy.
Shahidan (2012), in a similar study, conducted in Persiaran, Malaysia, found reduction of 2.7
°C in Area average value temperature, using cool pavements (albedo 0.8). Synnefa (2006 and
2011) describes reduction values, during the summer, of up to 4 °C for the daytime period and
up to 2 °C for the night period, using reflective material with albedo 0.75. Higher reductions
are predicted using CFD modelling by applying a colored thin layer asphalt on pavement with
air temperature reduction of 10 °C at 1.5m above the pavement.
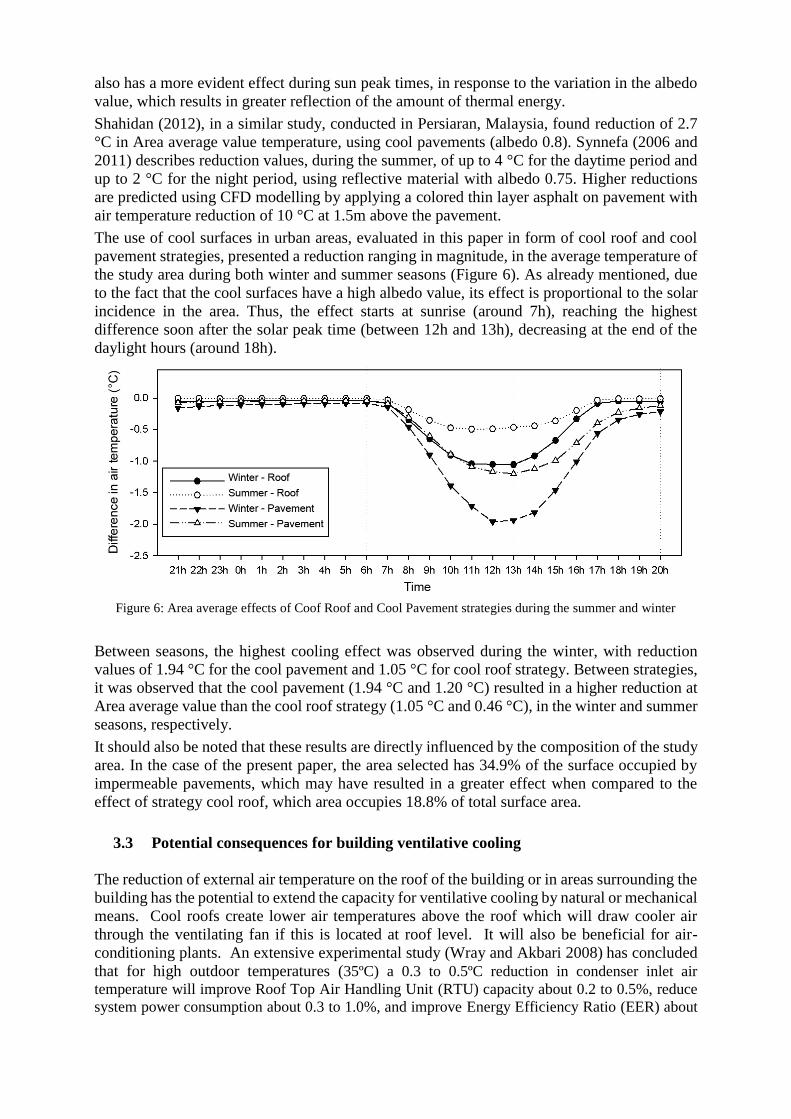
The use of cool surfaces in urban areas, evaluated in this paper in form of cool roof and cool
pavement strategies, presented a reduction ranging in magnitude, in the average temperature of
the study area during both winter and summer seasons (Figure 6). As already mentioned, due
to the fact that the cool surfaces have a high albedo value, its effect is proportional to the solar
incidence in the area. Thus, the effect starts at sunrise (around 7h), reaching the highest
difference soon after the solar peak time (between 12h and 13h), decreasing at the end of the
daylight hours (around 18h).
Figure 6: Area average effects of Coof Roof and Cool Pavement strategies during the summer and winter
Between seasons, the highest cooling effect was observed during the winter, with reduction
values of 1.94 °C for the cool pavement and 1.05 °C for cool roof strategy. Between strategies,
it was observed that the cool pavement (1.94 °C and 1.20 °C) resulted in a higher reduction at
Area average value than the cool roof strategy (1.05 °C and 0.46 °C), in the winter and summer
seasons, respectively.
It should also be noted that these results are directly influenced by the composition of the study
area. In the case of the present paper, the area selected has 34.9% of the surface occupied by
impermeable pavements, which may have resulted in a greater effect when compared to the
effect of strategy cool roof, which area occupies 18.8% of total surface area.
3.3 Potential consequences for building ventilative cooling
The reduction of external air temperature on the roof of the building or in areas surrounding the
building has the potential to extend the capacity for ventilative cooling by natural or mechanical
means. Cool roofs create lower air temperatures above the roof which will draw cooler air
through the ventilating fan if this is located at roof level. It will also be beneficial for air-
conditioning plants. An extensive experimental study (Wray and Akbari 2008) has concluded
that for high outdoor temperatures (35ºC) a 0.3 to 0.5ºC reduction in condenser inlet air
temperature will improve Roof Top Air Handling Unit (RTU) capacity about 0.2 to 0.5%, reduce
system power consumption about 0.3 to 1.0%, and improve Energy Efficiency Ratio (EER) about
0.6 to 1.1%. The increased capacity also means that the RTU would need to run 0.2 to 0.4% less
time to meet a given cooling load. With the run time and power consumption decreases combined,
the RTU energy consumption would decrease about 0.3 to 1.0%.
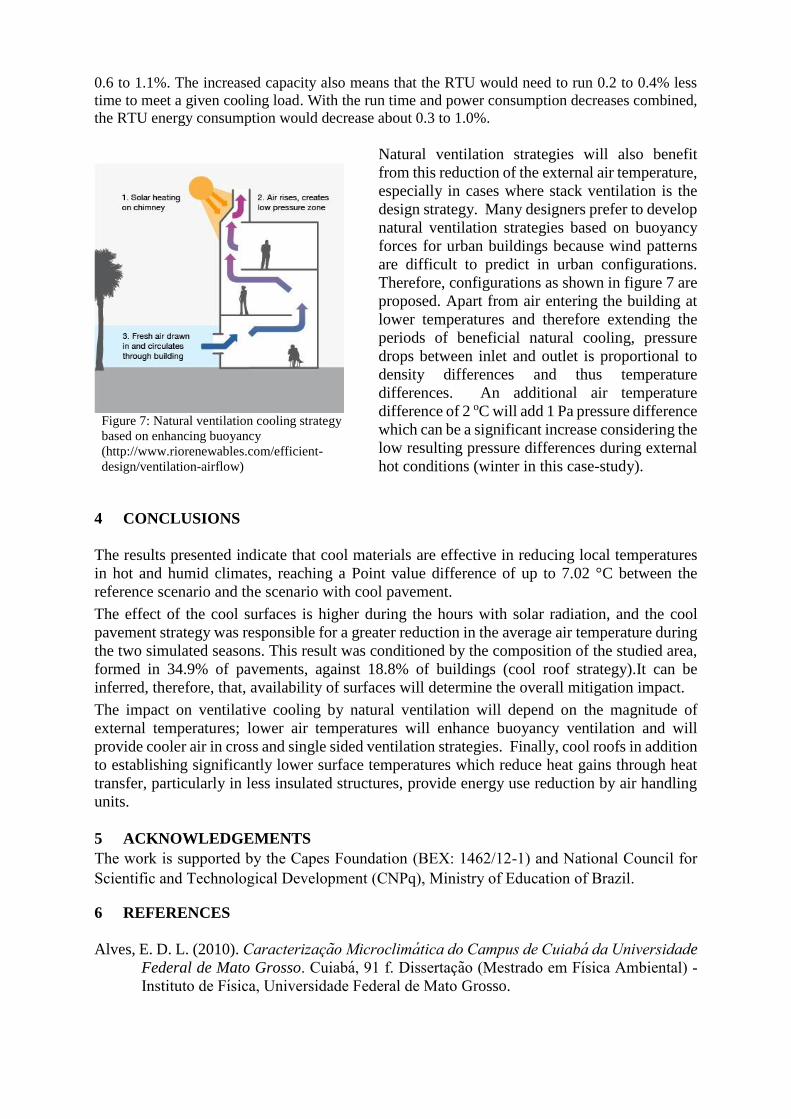
Natural ventilation strategies will also benefit
from this reduction of the external air temperature,
especially in cases where stack ventilation is the
design strategy. Many designers prefer to develop
natural ventilation strategies based on buoyancy
forces for urban buildings because wind patterns
are difficult to predict in urban configurations.
Therefore, configurations as shown in figure 7 are
proposed. Apart from air entering the building at
lower temperatures and therefore extending the
periods of beneficial natural cooling, pressure
drops between inlet and outlet is proportional to
density differences and thus temperature
differences. An additional air temperature
difference of 2 oC will add 1 Pa pressure difference
which can be a significant increase considering the
low resulting pressure differences during external
hot conditions (winter in this case-study).
4 CONCLUSIONS
The results presented indicate that cool materials are effective in reducing local temperatures
in hot and humid climates, reaching a Point value difference of up to 7.02 °C between the
reference scenario and the scenario with cool pavement.
The effect of the cool surfaces is higher during the hours with solar radiation, and the cool
pavement strategy was responsible for a greater reduction in the average air temperature during
the two simulated seasons. This result was conditioned by the composition of the studied area,
formed in 34.9% of pavements, against 18.8% of buildings (cool roof strategy).It can be
inferred, therefore, that, availability of surfaces will determine the overall mitigation impact.
The impact on ventilative cooling by natural ventilation will depend on the magnitude of
external temperatures; lower air temperatures will enhance buoyancy ventilation and will
provide cooler air in cross and single sided ventilation strategies. Finally, cool roofs in addition
to establishing significantly lower surface temperatures which reduce heat gains through heat
transfer, particularly in less insulated structures, provide energy use reduction by air handling
units.
5 ACKNOWLEDGEMENTS
The work is supported by the Capes Foundation (BEX: 1462/12-1) and National Council for
Scientific and Technological Development (CNPq), Ministry of Education of Brazil.
6 REFERENCES
Alves, E. D. L. (2010). Caracterizacao Microclimatica do Campus de Cuiaba da Universidade
Federal de Mato Grosso. Cuiaba, 91 f. Dissertacao (Mestrado em Fisica Ambiental) -
Instituto de Fisica, Universidade Federal de Mato Grosso.
Figure 7: Natural ventilation cooling strategy
based on enhancing buoyancy
(http://www.riorenewables.com/efficient-
design/ventilation-airflow)
Associacao Brasileira de Normas Tecnicas (ABNT). (2005) NBR 15220- 3: Zoneamento
bioclimatico brasileiro e diretrizes construtivas para habitacoes unifamiliares de
interesse social. Rio de Janeiro.
Banco de Dados Meteorológicos para Ensino e Pesquisa. Instituto Nacional de Meteorologia
(BDMET/INMET). Temperatura máxima média, temperatura mínima média e
Umidade relativa média 2002/2012 - Cuiabá, MT. Available at:
<http:/www.inmet.gov.br/projetos/rede/pesquisa/>.
Francisco, R.C.A. (2012) Clima urbano: um estudo aplicado a Belo Horizonte, MG.
Dissertação (Mestrado em Arquitetura e Urbanismo), Escola de Arquitetura da UFMG.
Gartland, L. (2010) Ilhas de calor: como mitigar zonas de calor em areas urbanas. Sao Paulo:
Oficina de textos.
Li D; Bou-Zeid E; Oppenheimer M (2014). The effectiveness of cool and green roofs as urban
heat island mitigation strategies, Environ. Res. Lett. 9 (2014) 055002 (16pp).
Maciel, C. R. (2011) Análise da relação entre características do ambiente urbano e
comportamento de variáveis microclimáticas: Estudo de caso em Cuiabá-MT. 127f.
Dissertação (Mestrado em Física Ambiental), UFMT, Cuiabá.
Oke, T. R. (1978) Boundary Layer Climates. Londres: Metheum.
Oke, T.R. (1996) Boundary layer climates. 2.ed. New York: Routledge.
Oke, T. R. (2006) Initial Guidance to Obtain Representative Meteorological Observations at
Urban Sites. IOM Report No.81, WMO/TD. No. 1250. World Meteorological
Organization, Geneva, 51p.
Ong, B. L. (2003) Green plot ratio: an ecological measure for architecture and urban planning.
Landscape and Urban Planning, v. 63, n. 4, p197-211.
Rosseti, K.A.C. (2013) Efeitos do uso de telhados vegetados em ilhas de calor urbanas com
simulacao pelo software ENVI-Met. 2013. 273f. Tese (Doutorado em Fisica Ambiental),
Instituto de Fisica, Universidade Federal de Mato Grosso, Cuiaba.
Sailor, D.J.; Fan, H. (2002) Modeling the diurnal variability of effective albedo for cities.
Atmos. Envion., v.36, p.713-725.
Silva, C. F. (2009) Caminhos bioclimaticos - Desempenho ambiental de vias publicas na cidade
de Teresina - PI. Dissertação (Mestrado em Arquitetura), UnB.
Shahidan, M.F; Jones P.J.; Gwilliam, J.; Salleh, E. (2012) An evaluation of outdoor and
building environment cooling achieved through combination modification of ground
materials. Building and Environment, 58 (0) (2012), pp. 245–257.
Synnefa, A.; Santamouris, M.; Apostolakis, K. (2006) On the development, optical properties
and thermal performance of cool colored coatings for the urban environment. Solar
Energy, v81, p488-497.
Synnefa A, Karlessi T, Gaitani Na, Santamouris M, Assimakopoulos D.N. and Papakatsikas C
(2011), Experimental testing of cool colored thin layer asphalt and estimation of its
potential to improve the urban microclimate, Building and Environment 46, pp38-44.
Virk G, Jansz A, Mavrogianni A, Mylona A, Stocker J and Davies M (2014). The effectiveness
of retrofitted green and cool roofs at reducing overheating in a naturally ventilated office
in London: Direct and indirect effects in current and future climates, Indoor and Built
Environment, Vol. 23(3) 504–520
Watkins R; Kolokotroni M (2012). The London Urban Heat Island – upwind vegetation effects
on local temperatures, PLEA2012 - 28th Conference, Opportunities, Limits & Needs
Towards an environmentally responsible architecture Lima, Perú 7-9 November 2012.
Wray C; Akbari H, (2008). The effects of roof reflectance on air temperatures surrounding a
rooftop condensing unit, Energy and Buildings, 40 pp11–28.