3d building modelling with digital map, lidar data … · 3d building modelling with digital map,...
TRANSCRIPT
3D BUILDING MODELLING WITH DIGITAL MAP, LIDARDATA AND VIDEO IMAGE SEQUENCES
Yongjun Zhang ([email protected])
Zuxun Zhang ([email protected])
Jianqing Zhang ([email protected])
Wuhan University, China
Jun Wu ([email protected])
Shandong University of Science and Technology, China
Abstract
Three-dimensional (3D) reconstruction and texture mapping of buildings orother man-made objects are key aspects for 3D city landscapes. An effective coarse-to-fine approach for 3D building model generation and texture mapping based ondigital photogrammetric techniques is proposed. Three video image sequences, twooblique views of building walls and one vertical view of building roofs, acquired by adigital video camera mounted on a helicopter, are used as input images. Lidar dataand a coarse two-dimensional (2D) digital vector map used for car navigation arealso used as information sources. Automatic aerial triangulation (AAT) suitable for ahigh overlap image sequence is used to give initial values of camera parameters ofeach image. To obtain accurate image lines, the correspondence between outlines ofthe building and their line features in the image sequences is determined with acoarse-to-fine strategy. A hybrid point/line bundle adjustment is used to ensure thestability and accuracy of reconstruction. Reconstructed buildings with fine texturessuperimposed on a digital elevation model (DEM) and ortho-image are realisticallyvisualised. Experimental results show that the proposed approach of 3D city modelgeneration has a promising future in many applications.
Keywords: 3D city models, coarse-to-fine building modelling, hybrid point/linebundle adjustment, texture mapping, video image sequences
Introduction
Three-dimensional (3D) interactive environments offer intuitive and user-friendly ways toview location-based information, such as 3D city models. A 3D city model is usuallycomposed of descriptions of terrain, streets, buildings, other man-made objects and vegetation.People are becoming increasingly conscious of the applications of 3D city models, such as carnavigation and service browsing, tourism and marketing, architecture and town planning, cityclimate and environmental research. Interest in 3D city model generation and in frequent
The Photogrammetric Record 20(111): 285–302 (September 2005)
� 2005 The Remote Sensing and Photogrammetry Society and Blackwell Publishing Ltd.
Blackwell Publishing Ltd. 9600 Garsington Road, Oxford OX4 2DQ, UK and 350 Main Street Malden, MA 02148, USA.

update has greatly increased over recent years (see, for example, Collins et al., 1998; Gruen,1998; Brenner et al., 2001; Wang and Hanson, 2001).
However, current digital photogrammetric workstations (DPWs) are not the most efficientsolution for creating city models, since they are made to measure points from vertical aerialphotographs rather than structured objects mainly composed of line segments. Researchershave developed approaches to modelling buildings using a small number of constructive solidgeometry (CSG) models (for example, Debevec et al., 1996; van den Heuvel, 2000).Nevertheless, many interactions make the modelling process less efficient.
The main workload of 3D city model generation is still building modelling, althoughtremendous progress has been made (Gruen and Wang, 1998; Haala and Brenner, 1998;Baillard and Zisserman, 1999; Stilla et al., 2000; Brenner et al., 2001; Gruen et al., 2003).Combining digital elevation model (DEM) or lidar data with existing two-dimensional (2D)vector digital map data for building reconstruction has shown promising results (Brenner,1999; Stilla and Jurkiewicz, 1999; Fruh and Zakhor, 2001; Nakagawa and Shibasaki, 2001;Rottensteiner and Briese, 2003; Sohn and Dowman, 2003; Wu et al., 2003). Brenner (2003)gives a good review of some proposed automatic and semi-automatic building reconstructionsystems from laser scanning and images.
Nowadays, 2D vector data for buildings and other man-made objects is usually availablein many cities in North America, Europe and Asia. However, car navigation system companiesusually cannot use the 2D vector data free of charge; it can be very expensive, especially inJapan. So they produce their own 2D vector data with low geometric precision for carnavigation. The development of science and technology is also leading to more demands for3D visual navigation, which inevitably requires a 3D city model. In order to reduce interactionsper building, semi-automatic capture systems are desirable. Moreover, the aim is to have asystem reconstructing a considerable number of buildings without any operator intervention atall.
In this paper, several important techniques for 3D building model generation making useof a ‘‘coarse-to-fine’’ strategy are discussed. The general strategy of how to generate 3D citymodels with low-accuracy 2D vector data, lidar data and video image sequences is presented inthe next section. A semi-automatic coarse-to-fine algorithm for building modelling is thenaddressed. To generate realistic textures of buildings, texture rectification and improvementsolutions are next described. This is followed by discussion of the experimental results andperformance of the developed system. Discussion and outlook for future developmentsconclude the paper.
General Strategy
The overall goal is the generation of 3D city models using available 2D vector datawith non-negligible geometric errors (usually larger than 3 m in horizontal accuracy), thisnormally being acceptable for 2D car navigation. Complex superstructures on the roofsof buildings are not of interest in this paper, because they are not important for carnavigation.
Although the 2D vector data may have geometric errors of the order of 5 m, it can be usedto provide initial values of building outlines for 3D reconstruction. Such data contains noinformation about building heights, so data obtained from laser scanning (lidar) with 1 mresolution is treated as a necessary source of height information. Usually, building walls areinvisible in vertical aerial images. Therefore, three video image sequences (one vertical view ofbuilding roofs and two oblique views of building walls) acquired by a helicopter-mounteddigital video camera are also used as input data.
Zhang et al. 3D building modelling with digital map, lidar data and video image sequences
286 � 2005 The Remote Sensing and Photogrammetry Society and Blackwell Publishing Ltd.
First, automatic aerial triangulation (AAT) of the three image sequences has to be carriedout to give initial values of camera parameters for each image. Then, an iterative coarse-to-fineprocess, composed of feature projection, image matching and bundle adjustment, is adopted toreconstruct buildings, as described in more detail later in this paper. Initial building models areobtained from 2D vector data and lidar data. To ensure the stability and accuracy ofreconstruction, a hybrid point/line bundle adjustment (van den Heuvel, 2000; Zhang et al.,2004) making use of the image points of ground features and image lines of buildings asobservations with collinearity and coplanarity equations, respectively, is adopted for accuratereconstruction. After that, building textures are rectified and improved semi-automatically togenerate realistic visualisations.
The aim of this research is to reconstruct 3D city models especially for car navigationapplications. To generate DEMs, buildings and other man-made objects have to be removedfrom the lidar data, so a data filtering technique is used to produce the DEM of the area ofinterest. For visualisation of the ground, an ortho-image of the region of interest is alsoessential. To this end, the DEM, camera parameters and the ‘‘level’’ image sequence (namely,the vertically viewed images) are used to generate the ortho-image by digital orthorectification.Reconstructed buildings with fine textures are merged into the textured ground, which isgenerated from the DEM and the ortho-image. Finally, the generated 3D city model can bebrowsed at any viewpoint or even walked along the street.
Coarse-to-Fine Building Reconstruction
Automatic Aerial Triangulation
Traditional aerial photographs usually have 60% forward overlap between adjacentphotographs within a strip. So there is at most 20% overlap among three images, which meansone ground feature point appears at most in three images within a strip. However, imagesequences taken with a video camera have a high percentage of overlap (usually higher than95%) between adjacent images and therefore more image correspondences for each groundfeature, and there is only a slight difference between neighbouring conjugate images of thesame ground feature. These advantages make the image matching more reliable and moreprecise than traditional photogrammetry and thus have good potential for 3D reconstruction.
It is known that the vector data available for car navigation is not accurate. Therefore, bothcamera parameters and building models must be determined in order to obtain fine textures.Automatic aerial triangulation (AAT) is adopted to acquire initial values of camera parameters.Different from traditional analytical aerial triangulation, the image sequence has high overlapand thus a very short baseline between adjacent images. In an image sequence with 90%overlap, one ground feature may appear in 10 images at most. All the image featurescorresponding to the same ground feature should be matched, so as to enlarge the intersectionangle and thus overcome the problems caused by short baselines. Multi-view image matchingand forward intersection algorithms have to be developed to overcome these shortcomings.
The three image sequences are processed separately as single strips. A multi-view imagematching algorithm is used to determine the conjugate image features. The output of AAT is afree network taking the first image as the reference coordinate system, which is different fromthe real-world coordinate system. So the camera parameters of the free network need to betransformed into the world coordinate system to give reliable initial values of the image poses.Two images near the beginning and the end of the image sequences are chosen, followed bymanual selection of some control points from the 2D vector data overlaid with lidar data. Theircorresponding image points are given interactively in the selected images. Thus camera
The Photogrammetric Record
� 2005 The Remote Sensing and Photogrammetry Society and Blackwell Publishing Ltd. 287

parameters of the two selected images can be obtained by a space resection process. Then allthe camera parameters covering the strip can be transformed into the world coordinate system.All image points will be used in the hybrid point/line bundle adjustment to ensure the stabilityof adjustment.
Initial Geometric Model of Building
The initial geometric model of the building can be determined by 2D vector data and lidardata. Initial values of ground plans of buildings can be extracted from the 2D vector data, whilethe height of buildings cannot be obtained directly from lidar data due to noise. Furthermore,most building roofs are not flat. When the lidar data is transformed into a pseudo image withheight information as the grey value (Fig. 1), it is clear that there are many small complexstructures on the rooftop. Considering the aforementioned problems, all shapes of buildingrooftops are restricted to being flat, corresponding to 2D vector data. To obtain heightinformation for building rooftops, noise and complex shapes have to be removed. An imagesmoothing technique with Gaussian filter is applied to the pseudo image data. The result isshown in Fig. 2, where the building height can be taken as the average height of the roofoutline in the filtered lidar data. The precision of building heights obtained as above is about1Æ5 m, which is satisfactory for their use as initial values.
To acquire initial values of building outlines in the image, the low-accuracy buildingmodel is back-projected onto the level (vertical) images in accordance with the AAT results.For each building, all images in which the building of interest is fully included are retrievedautomatically from the whole image sequence, by comparing the building location with everyimage range on the ground, which is calculated from image pose parameters. The best image,in which the building of interest is closest to the centre of the image, is auto-selected as well.
After the initial geometric model of the building is projected back onto the relevantimages, an initial wire-frame model of the building is displayed in the image, as shown inFig. 3. As can be seen in the left part of Fig. 3, there are not only offsets but also scaledifferences between the projected wire-frame and corresponding image lines of the building.
Fig. 1. Lidar data before filtering.
Zhang et al. 3D building modelling with digital map, lidar data and video image sequences
288 � 2005 The Remote Sensing and Photogrammetry Society and Blackwell Publishing Ltd.

The offset and scale factor are partly caused by imprecision of camera parameters because noprecise control points were available in AAT. Furthermore, the geometric shape of the buildingis significantly different from the image because of imprecision of 2D vector data, althoughoffset and scale factor are removed manually, as shown in Fig. 4.
Fig. 2. Lidar data after filtering.
Fig. 3. Initial projection of two buildings.This figure appears in colour in the electronic version of the article and in the plate section at the front of the printed
journal.
The Photogrammetric Record
� 2005 The Remote Sensing and Photogrammetry Society and Blackwell Publishing Ltd. 289

Coarse-to-Fine Reconstruction by Bundle Adjustment
When the initial buildingmodel is ready, image lines corresponding to the projected buildingoutlines will be extracted. The extraction of lines on an image is only performed in theneighbourhood of the projected initial wire-frame of the building. At the beginning, a rectangularimage patchwith the same length as the projected line and 60 pixels width centred at the projectedposition of each line is used as target region for possible search areas of image lines. The mainpurpose is to obtain the strongest line feature to improve the geometric building model. The linesextracted from the image are good enough to improve the geometric model, as shown in Fig. 5.Then, all the lines extracted from the ‘‘best’’ image will be automatically matched from theremaining images by least squares template matching (LSTM) (Gruen, 1985).
However, in some complex situations such as dense buildings and buildings with similardouble edges (see rooftop of Fig. 9), the LSTM approach may produce a large number ofmismatched lines. To overcome this problem, homologous line matching based on LSTM andtrifocal tensors (Hartley and Zisserman, 2000) is applied to obtain more reliable homologouslines in all target images. By the combination of LSTM and trifocal tensors, mostcorresponding image lines of building outlines can be automatically determined.
After image lines are determined, they can be used for 3D reconstruction. Duringreconstruction, the flat roof constraint Zi)Zj¼ DZi,j¼ 0 (Zi and Zj are any of the heights of twocorners of the same building) is used to restrict the building roofs to being flat. Furthermore,the intersection line of two walls such as L1 at the upper-right corner of Fig. 5 is alwaysvertical. This information is advantageous to get precise camera orientation angles (/,x, j) ofeach image (Zhang et al., 2003). Constraints of perpendicularity between adjacent lines, for
Fig. 4. Imprecision of 2D vector data.This figure appears in colour in the electronic version of the article and in the plate section at the front of the printed
journal.
Zhang et al. 3D building modelling with digital map, lidar data and video image sequences
290 � 2005 The Remote Sensing and Photogrammetry Society and Blackwell Publishing Ltd.

example, the line segments P1P2 and P2P3 of Fig. 5, which are composed of building cornersP1, P2 and P3, are also applied in the bundle adjustment. Matched conjugate image points,saved in the process of AAT, are also used to improve the accuracy of camera orientationparameters. Once all the homologous lines for building edges are found across images in onestrip, the geometric building model is improved with hybrid point/line bundle adjustment,which is presented by Zhang et al. (2004). The general principle of hybrid point/line bundleadjustment is to use both image points and image lines for 3D reconstruction, with collinearityand coplanarity equations, respectively. This approach is quite effective especially in 3Dreconstruction of urban scenes and industrial objects.
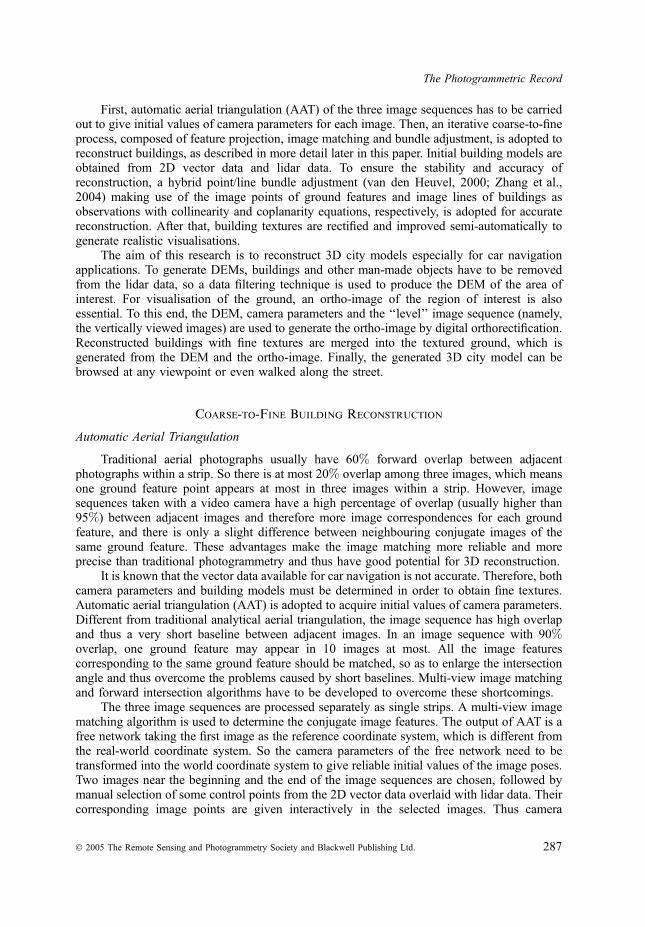
More accurate geometric building models will be achieved as they are projected ontooblique images. Using the same methods mentioned above, a number of building lines areextracted and their homologous lines are found. Once more precise image lines are availablefrom line matching, the bundle adjustment will be repeated, and camera parameters of theimage sequences are also updated according to the results of bundle adjustment. As a result alarge part of the errors inherent in vector data can be considerably corrected, as shown in theleft part of Fig. 6. Furthermore, the nearby building is also much closer to its correspondingimage feature after bundle adjustment, as shown in the right part of Fig. 6 (compared with theright part of Fig. 3).
If the initial building model is not good enough because of a very large offset (more than50 pixels, say) between projected and real image lines, the user should intervene by draggingthe projected model approximately over its image. Then, the bundle adjustment process will berepeated until the manually dragged building models are well enough fitted to thecorresponding images. After several buildings are reconstructed, user intervention quickly
P1
P2
P3
L1
Fig. 5. Matched image lines of a building.This figure appears in colour in the electronic version of the article and in the plate section at the front of the printed
journal.
The Photogrammetric Record
� 2005 The Remote Sensing and Photogrammetry Society and Blackwell Publishing Ltd. 291
decreases. Finally, a large number of buildings can be reconstructed automatically and precisecamera parameters can be generated.
Texture Rectification and Improvement
Since one of the most important applications of 3D city models is the generation ofrealistic visualisations, proper representation of the geometry and texture of buildings isrequired. When all buildings are successfully reconstructed, the precise camera parameters ofeach image can also be acquired. With this information, the reconstructed 3D building can beback-projected onto the image and thus textures of building walls can be retrieved. Where awall appears in multiple images, an image with maximum projected area is finally selected forproviding the corresponding texture. Texture for building rooftops is mapped from the levelimages. It is usually taken from the middle image among all the target images in which it isvisible. The geometric resolution of image patches of walls from level images is often lowerthan that in the oblique ones, so the best texture of the visible wall is auto-selected and mappedfrom the oblique images with the same strategy as rooftops. Fig. 7 shows a result before andafter texture rectification.
Although the aforementioned texture rectification leads to satisfactory results, the methodis only applicable to views without occlusions. Unfortunately, there are usually many texturesof building walls that are occluded either by other buildings as shown in Fig. 8, or by tall treesin the street. These textures have to be refined to generate realistic 3D city models. To this end,the texture improvement process is done semi-automatically under the control and supervision
Fig. 6. Intermediate result of coarse-to-fine strategy.This figure appears in colour in the electronic version of the article and in the plate section at the front of the printed
journal.
Zhang et al. 3D building modelling with digital map, lidar data and video image sequences
292 � 2005 The Remote Sensing and Photogrammetry Society and Blackwell Publishing Ltd.

of the operator (see Fig. 8). At first, textures are automatically processed by computer. Humaninteraction is needed only when the visual effects are unsatisfactory. The wall textures to beprocessed can be selected by the operator without specifying the method. Occlusion restorationand blur removal are applied to textures of the first and third wall. Occlusion restoration is
Fig. 8. Textures of walls occluded by other buildings.This figure appears in colour in the electronic version of the article and in the plate section at the front of the printed
journal.
Fig. 7. Texture of a wall before and after rectification.This figure appears in colour in the electronic version of the article and in the plate section at the front of the printed
journal.
The Photogrammetric Record
� 2005 The Remote Sensing and Photogrammetry Society and Blackwell Publishing Ltd. 293

applied to the texture of the fourth wall. The texture of the second wall is duplicated from thatof the fourth wall. As can be seen from Fig. 9, the improved textures of walls are much betterthan the raw ones in Fig. 8.
Experimental results
A 3D city modelling system has been developed in accordance with the algorithmsdescribed above. The essential input data sources are three video image sequences, groundcontrol points, internal camera parameters, lidar data and 2D vector data. The system iscomposed of several kernel modules, such as AAT (including interior orientation, relativeorientation, model linking, absolute orientation and bundle adjustment), initial building modelgeneration, multi-view image matching, coarse-to-fine reconstruction by bundle adjustment,texture mapping and improvement, 3D visualisation and so on. The flow chart of the developedsystem is shown in Fig. 10. Firstly, the AAT module is called to obtain the external cameraparameters of the three image sequences. Initial building models are generated by processingthe lidar and 2D vector data simultaneously. Then images of interest for each building areautomatically selected followed by line extraction and multi-view image matching. Afterwards,3D building models are reconstructed by the coarse-to-fine strategy with bundle adjustment.When the best textures of buildings are automatically selected from the image sequences, thetexture improvement process is done semi-automatically under the control and supervision ofthe operator. The 3D models with refined textures can then be visualised realistically.
The developed system has been tested using data for several city blocks taken by a pre-calibrated video camera. All experimental results are very promising. A typical experimentalresult for a street in Japan, 1Æ7 km long with about 200 buildings, will be discussed in thefollowing.
Image sequences were taken by a digital video camera with resolution of 1920 · 1200pixels mounted on a helicopter. The ground resolution of images is about 0Æ2 m, which meansthat buildings smaller than 380 m · 240 m can be fully included within a video frame. Thecamera is fixed in a stabilising mount, which can keep the camera orientation more stable thanthe helicopter itself while flying. There is almost no vibration of the camera rotation angles.There are in total three image sequences acquired by three flying routes as shown in Fig. 11,two sequences (image sequences 1 and 2 obtained by flying routes 1 and 2, respectively) withoblique view-angles of about 45� to acquire the images of building walls, the other one (image
Fig. 9. The improved textures of walls.This figure appears in colour in the electronic version of the article and in the plate section at the front of the printed
journal.
Zhang et al. 3D building modelling with digital map, lidar data and video image sequences
294 � 2005 The Remote Sensing and Photogrammetry Society and Blackwell Publishing Ltd.

3D visualisation of building models
Line extraction and matching
Coarse-to-fine building reconstruction
Texture rectification and improvement
Auto-selection of images of interest for each building
Internal cameraparameters
Initial building models
Lidardata
2D vector data
Three video image sequences
Control points
Automatic aerial triangulation
External camera parameters
Fig. 10. Outline of 3D building modelling and texture mapping.
Flying route 2
Flying route 3
Flying route 1
Road
Image sequence 2
Image sequence 1
Image sequence 3
Fig. 11. Three flying routes of the helicopter.This figure appears in colour in the electronic version of the article and in the plate section at the front of the printed
journal.
The Photogrammetric Record
� 2005 The Remote Sensing and Photogrammetry Society and Blackwell Publishing Ltd. 295

sequence 3 obtained by flying route 3) with optical axes looking vertically downwards toobtain the images of roofs and roads. So images of the first and second sequences are oblique(called oblique images in the following), while images of the third sequence (vertical view) are
Fig. 12. Part of the first oblique image sequence.This figure appears in colour in the electronic version of the article and in the plate section at the front of the printed
journal.
Fig. 13. Part of the second oblique image sequence.This figure appears in colour in the electronic version of the article and in the plate section at the front of the printed
journal.
Zhang et al. 3D building modelling with digital map, lidar data and video image sequences
296 � 2005 The Remote Sensing and Photogrammetry Society and Blackwell Publishing Ltd.
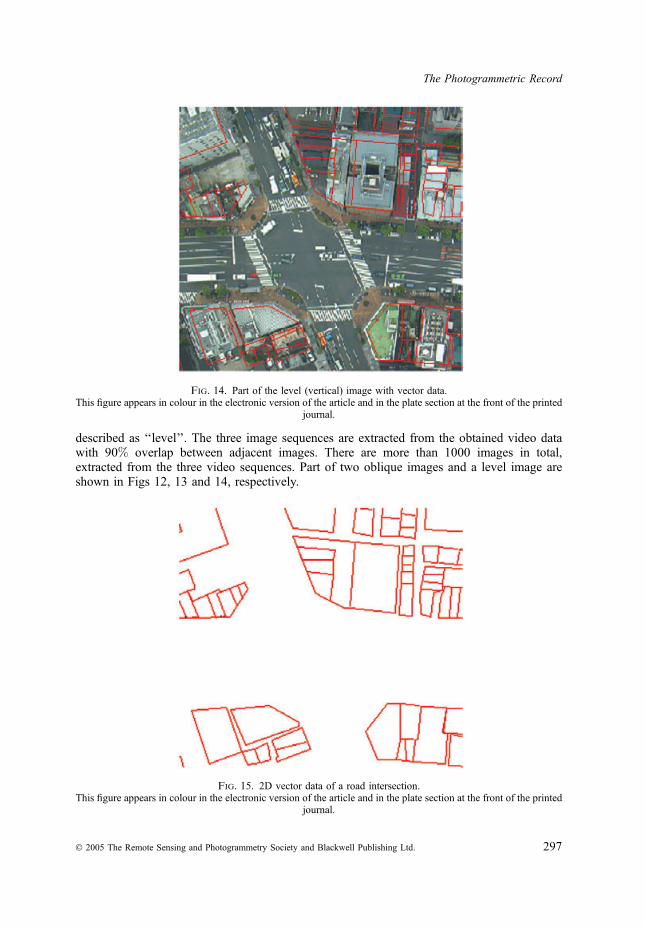
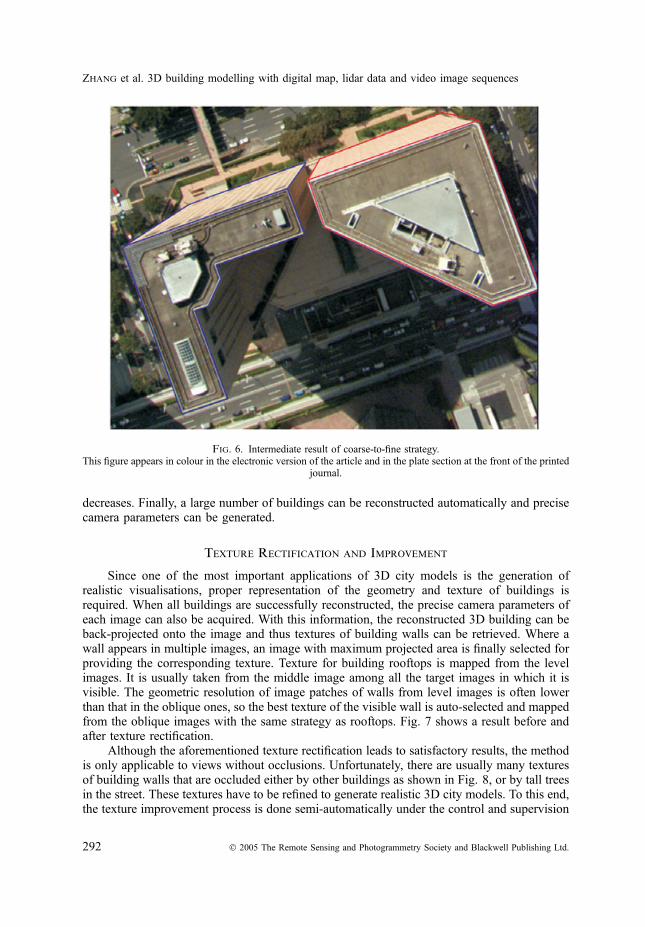
described as ‘‘level’’. The three image sequences are extracted from the obtained video datawith 90% overlap between adjacent images. There are more than 1000 images in total,extracted from the three video sequences. Part of two oblique images and a level image areshown in Figs 12, 13 and 14, respectively.
Fig. 15. 2D vector data of a road intersection.This figure appears in colour in the electronic version of the article and in the plate section at the front of the printed
journal.
Fig. 14. Part of the level (vertical) image with vector data.This figure appears in colour in the electronic version of the article and in the plate section at the front of the printed
journal.
The Photogrammetric Record
� 2005 The Remote Sensing and Photogrammetry Society and Blackwell Publishing Ltd. 297
As mentioned in the second section, the lidar data with ground resolution of 1 m isacquired by a helicopter-mounted laser scanner. A similar example showing the quality of thelidar data used is shown in Fig. 1. It is also used to produce a DEM by removing man-madeobjects and vegetation with data filtering techniques similar to image filtering with a Gaussiankernel.
The available 2D digital vector data, which is only used for car navigation, is obtained bydetailed survey. Precision of the 2D vector data is about 5 m, which is definitely not good enoughto present precise 3D building models, as can be seen from Fig. 14. Part of the 2D digital vectordata of a road intersection is shown in Fig. 15. In the 2D vector data used, some buildings aremissing, some building footprints are not enclosed and some are seriously distorted. About 30buildings are excluded from building reconstruction and only 170 buildings of the total of 200are considered in this study. These buildings are visible in 660 images.
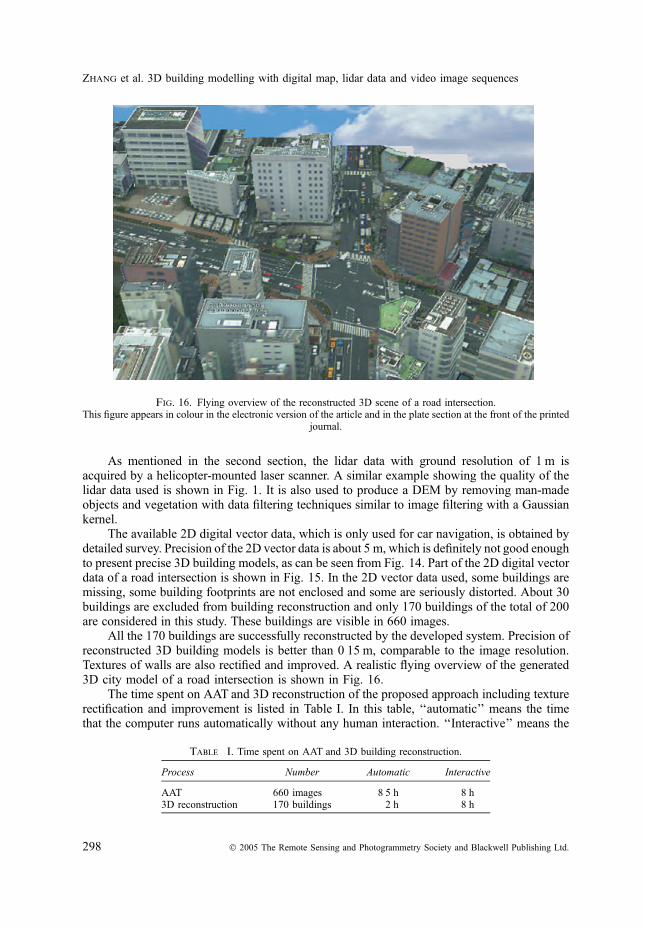
All the 170 buildings are successfully reconstructed by the developed system. Precision ofreconstructed 3D building models is better than 0Æ15 m, comparable to the image resolution.Textures of walls are also rectified and improved. A realistic flying overview of the generated3D city model of a road intersection is shown in Fig. 16.
The time spent on AAT and 3D reconstruction of the proposed approach including texturerectification and improvement is listed in Table I. In this table, ‘‘automatic’’ means the timethat the computer runs automatically without any human interaction. ‘‘Interactive’’ means the
Fig. 16. Flying overview of the reconstructed 3D scene of a road intersection.This figure appears in colour in the electronic version of the article and in the plate section at the front of the printed
journal.
Table I. Time spent on AAT and 3D building reconstruction.
Process Number Automatic Interactive
AAT 660 images 8Æ5 h 8 h3D reconstruction 170 buildings 2 h 8 h
Zhang et al. 3D building modelling with digital map, lidar data and video image sequences
298 � 2005 The Remote Sensing and Photogrammetry Society and Blackwell Publishing Ltd.

time spent by an operator for interactively performing the AAT and 3D reconstruction process.As can be seen, 170 buildings are successfully reconstructed within 8 h after AAT. The averagetime spent to reconstruct one building is less than 3 min. That means 20 buildings can bereconstructed within 1 h if camera parameters are available. Considering the time spent forAAT, data conversion, DEM and ortho-image generation, it takes 17 h to reconstruct the 3Dcity model of the test area (that means 10 buildings per hour). It may be concluded that about80 buildings can be reconstructed per person every working day (8 h).
A project is in progress to generate a 3D model of a city in China manually with humanlabour. The complexity of buildings is similar to that of the test area in Japan. Ten people spent600 working days to reconstruct 6000 buildings, which means only 10 buildings werereconstructed every working day per person. Clearly, the efficiency of the automated system iseight times higher, as shown in Table II.
Discussion
In this paper, an effective approach to generate 3D building models and hence 3D citymodels using a coarse-to-fine strategy is proposed. Three video image sequences, coarse 2Dvector data of buildings and lidar data are used as information sources. Efficiency of 3D buildingreconstruction has been shown to be eight times higher than traditional manual methods fullyrelying on human labour. If precise 2D vector data is available, the reconstruction process will bemuch easier and quicker. Experiments in 3D city model generation show that the proposedapproach has a promising future in many practical applications.
However, the proposed system still requires further improvement in order to achieve moreefficient generation of 3D city models. There are often trees on both sides of roads, which needto be reconstructed for realistic visualisation. In addition, tree occlusions and cars on the roadsmust be removed, while road markings should be retained. For a true 3D city model, complexsuperstructures on the building roofs also need to be reconstructed, although there is noinformation available in the 2D digital vector data. One possible solution for superstructures issemi-automatic reconstruction from lidar data and image sequences. How to combineconventional large format aerial survey image data with the video camera sequences also needsfurther investigation.
Acknowledgements
This work is supported by National Natural Science Foundation of China (NSFC) underproject No. 40301041. The authors would like to thank MapMaster (Japan) for providing thetest data. Heartfelt thanks are also given for the comments and contributions of anonymousreviewers and members of the Editorial team.
references
Baillard, C. and Zisserman, A., 1999. Automatic reconstruction of piecewise planar models from multipleviews. Proceedings of the IEEE Conference on Computer Vision and Pattern Recognition, 559–565.
Table II. Comparison of efficiencies between pure manual human labour and the semi-automatic system.
Testing area Reconstruction method Number of buildings Total time spent Efficiency
A city in China Human (manual) labour 6000 600 working days 10 buildings/dayA street in Japan Semi-automatic system 170 17 h 80 buildings/day
The Photogrammetric Record
� 2005 The Remote Sensing and Photogrammetry Society and Blackwell Publishing Ltd. 299

Brenner, C., 1999. Interactive modelling tools for 3D building reconstruction. Photogrammetric Week ’99(Eds. D. Fritsch and R. Spiller). Wichmann, Heidelberg. 380 pages: 23–34.
Brenner, C., 2003. Building reconstruction from laser scanning and images. Proceedings of the ITC Workshop onData Quality in Earth Observation Techniques, Enschede, the Netherlands. 8 pages (on CD-ROM).
Brenner, C., Haala, N. and Fritsch, D., 2001. Towards fully automated 3D city model generation. AutomaticExtraction of Man-Made Objects from Aerial and Space Images III (Eds. E. P. Baltsavias, A. Gruen and vanGool ). A. A. Balkema, Lisse, the Netherlands. 415, 47–57.
Collins, R., Jaynes, C., Cheng, Y.,Wang, X., Stolle, F., Schultz, H., Riseman, E. andHanson, A., 1998.The ascender system: automated site modelling from multiple aerial images. Computer Vision and ImageUnderstanding, 72(2): 143–162.
Debevec, P. E., Taylor, C. J. and Malik, J., 1996. Modelling and rendering architecture from photographs: ahybrid geometry- and image-based approach. Proceedings of the 23rd Annual Conference on ComputerGraphics and Interactive Techniques, 11–20.
Fruh, C. and Zakhor, A., 2001. 3D model generation for cities using aerial photographs and ground level laserscans. Computer Vision and Pattern Recognition, 2: 31–38.
Gruen, A., 1985. Adaptive least square correlation: a powerful image matching technique. South Africa Journal ofPhotogrammetry and Remote Sensing, 14(3): 175–187.
Gruen, A., 1998. TOBAGO—a semi-automatic approach for the generation of 3-D building models. ISPRSJournal of Photogrammetry and Remote Sensing, 53(2): 108–118.
Gruen, A. andWang, X., 1998. CC-Modeler: a topology generator for 3-D city models. International Archives ofPhotogrammetry and Remote Sensing, 32(4): 188–196.
Gruen, A., Zhang, L. and Wang, X., 2003. Generation of 3D city models with linear array CCD-sensors.Optical 3D Measurement Techniques VI (Eds. A. Gruen and H. Kahmen), 2: 21–31.
Haala, N. and Brenner, C., 1998. Interpretation of urban surface models using 2D building information.Computer Vision and Image Understanding, 72(2): 204–214.
Hartley, R. and Zisserman, A., 2000. Multiple View Geometry in Computer Vision. Cambridge UniversityPress, Cambridge. 607 pages.
Heuvel, F. A. van den, 2000. Trends in CAD-based photogrammetric measurement. International Archives ofPhotogrammetry and Remote Sensing, 33(5/2): 852–863.
Nakagawa, M. and Shibasaki, R., 2001. Study on making city model with image and laser range data. 22ndAsian Conference on Remote Sensing, Singapore, 2: 1108–1112.
Rottensteiner, F. and Briese, C., 2003. Automatic generation of building models from lidar data and theintegration of aerial images. International Archives of the Photogrammetry, Remote Sensing and SpatialInformation Sciences, 34(3/W13): 174–180.
Sohn, G. andDowman, I., 2003. Building extraction using lidar DEMs and Ikonos images. International Archivesof the Photogrammetry, Remote Sensing and Spatial Information Sciences, 34(3/W13): 167–173.
Stilla, U. and Jurkiewicz, K., 1999. Reconstruction of building models from maps and laser altimeter data.Selected papers from the International Workshop on Integrated Spatial Databases, Digital Images and GIS.Lecture Notes on Computer Science, 1737: 34–46.
Stilla, U., Soergel, U. and Jaeger, K., 2000. Generation of 3D-city models and their utilisation in imagesequences. International Archives of Photogrammetry and Remote Sensing, 33(B2): 518–524.
Wang, X. and Hanson, A. R., 2001. Surface texture and microstructure extraction from multiple aerial images.Computer Vision and Image Understanding, 83(1): 1–37.
Wu, J., Zhang, Z. and Zhang, J., 2003. City modelling by videogrammetry based on three video image sequencestrips taken from a helicopter. SPIE, 5286: 1003–1008.
Zhang, Y., Zhang, Z. and Zhang, J., 2004. Deformation visual inspection of industrial parts with imagesequence. Machine Vision and Applications, 15(3): 115–120.
Zhang, Z., Wu, J. and Zhang, J., 2003. A method for determining orientation parameters in image basedreconstruction of architectural scenes. Geomatics and Information Science of Wuhan University, 28(3): 265–271 (in Chinese).
Resume
La reconstitution tri-dimensionnelle (3D) et la figuration de la texture desbatiments ou d’autres constructions humaines sont les elements cles des paysagesurbains 3D. On propose de traiter la realisation de modeles 3D des batimentsintegrant la texture, par des techniques de photogrammetrie numerique, par unedemarche efficace allant de l’approche au tres fin. Pour cela on a utilise en entree
Zhang et al. 3D building modelling with digital map, lidar data and video image sequences
300 � 2005 The Remote Sensing and Photogrammetry Society and Blackwell Publishing Ltd.

trois sequences d’images saisies en helicoptere avec une camera numerique video,comprenant deux vues obliques des murs des batiments et une vue verticale de leurstoits. On a egalement utilise comme source d’informations des donnees lidar et unecartographie approchee 2D numerique en format vecteur servant a la navigationautomobile. Pour obtenir des valeurs initiales sur les parametres de la camera achaque image, on a effectue une aerotriangulation automatique (AAT) specialementadaptee a une sequence d’images a fort recouvrement. Pour extraire avec precisiontous les segments des images, on utilise une strategie allant de l’approche au fin quipermet d’etablir les correspondances entre les silhouettes des batiments et les detailslineaires qui leur appartiennent, tout au long des sequences d’images. On s’assure dela stabilite et de la precision de la reconstitution en se servant d’une compensationhybride par faisceaux, melant points et segments. On visualise une reconstitutionrealiste des batiments avec superposition de toute la finesse de leur texture, sousforme de modeles numeriques des elevations (DEM) et d’ortho-images. Les resultatsdes essais effectues ont montre que la solution proposee pour la realisation desmodeles urbains 3D avait un avenir prometteur pour de nombreuses applications.
Zusammenfassung
Zentrale Bestandteile von dreidimensionalen Stadtlandschaften sind die dreidi-mensionale geometrische Rekonstruktion von Gebauden und anderen kunstlichenObjekten, und eine realitatsnahe Texturierung der Oberflachen. In diesem Beitragwird ein effektiver Ansatz zur Generierung von 3D-Gebaudemodellen mit einerTexturierung auf der Basis von Techniken der Digitalen Photogrammetrie vorgestellt.Als Eingabedaten stehen drei Bildsequenzen aus einer digitalen Videokamera zurVerfugung, die in einem Helikopter montiert ist. Damit stehen zwei geneigteAnsichten von vertikalen Wanden von Gebauden und eine Senkrechtaufnahme derDachflachen zur Auswertung zur Verfugung. Als weitere Informationsquellen dienenLidardaten und eine stark generalisierte zweidimensionale digitale Vektorkarte ausder Fahrzeugnavigation. Eine automatische Aerotriangulation (AAT), die fur dieBearbeitung von stark uberlappenden Bildsequenzen geeignet ist, wird zur Bestim-mung der genaherten Kameraparameter eines jeden Bildes eingesetzt. Um genaueLinien in den Bildern zu erhalten, wird der Bezug zwischen den Umrissen einesGebaudes und den zugehorigen Linien in den Bildsequenzen in einer Strategie vongrob nach fein ermittelt. Die Stabilitat und Genauigkeit der Rekonstruktion stutzt sichauf eine hybride Bundelausgleichung auf der Basis von Punkten und Linien. Dierekonstruierten Gebaude werden mit einer hochauflosenden Textur versehenund zusammen mit einem Digitalen Hohenmodell (DEM) und einem Orthobildrealitatsnah visualisiert. Experimentelle Ergebnisse zeigen, dass dieser Ansatz zurGenerierung von 3D-Stadtmodellen eine vielversprechende Zukunft in vielenAnwendungen haben wird.
Resumen
La reconstruccion tridimensional (3D) y la texturizacion de edificios y de otroselementos construidos son procesos fundamentales en la visualizacion 3D de lospaisajes urbanos. Se propone un procedimiento ‘‘grosero-a-fino’’ para generar unmodelo tridimensional texturizado basado en tecnicas de fotogrametrıa digital. Comoinformacion de entrada se utilizan tres secuencias de imagenes de vıdeo, de las
The Photogrammetric Record
� 2005 The Remote Sensing and Photogrammetry Society and Blackwell Publishing Ltd. 301

cuales dos son las perspectivas oblicuas de las paredes de los edificios y una laperspectiva vertical de los tejados de los edificios, obtenidas con una camara digitalde vıdeo montada en un helicoptero. Tambien se utilizan datos lıdar y un mapavectorial digital plano de los usados en los sistemas de navegacion de vehıculos.Para obtener los valores iniciales de los parametros de la camara de cada imagen serealiza una triangulacion aerea automatica, adecuada para secuencias de imagenescon mucho solape. A continuacion, y para obtener lıneas exactas, se determina lacorrespondencia entre los contornos de los edificios y los elementos lineales de lasimagenes mediante una estrategia‘‘grosero-a-fino’’. Para asegurar la estabilidad yexactitud de la reconstruccion se usa un ajuste por haces hıbrido punto/lınea. Losedificios ası reconstruidos se visualizan con realismo superponiendo texturas finas aun modelo digital de elevaciones (MDE) y a una ortofoto. Los resultadosexperimentales muestran que el enfoque propuesto para la generacion de un modelourbano tridimensional tiene un futuro prometedor en muchas aplicaciones.
Zhang et al. 3D building modelling with digital map, lidar data and video image sequences
302 � 2005 The Remote Sensing and Photogrammetry Society and Blackwell Publishing Ltd.