3d graphical modeling of vegetable seedlings based on a stereo machine vision system ta-te lin,...
TRANSCRIPT

3D GRAPHICAL MODELING OF VEGETABLE SEEDLINGS3D GRAPHICAL MODELING OF VEGETABLE SEEDLINGSBASED ON A STEREO MACHINE VISION SYSTEMBASED ON A STEREO MACHINE VISION SYSTEM
Ta-Te Lin, Wen-Chi Liao, Chung-Fan ChienTa-Te Lin, Wen-Chi Liao, Chung-Fan Chien
Department of Bio-Industrial Mechatronics Engineering,Department of Bio-Industrial Mechatronics Engineering,National Taiwan University,National Taiwan University,
Taipei, Taiwan, ROCTaipei, Taiwan, ROC

INTRODUCTIONINTRODUCTION
Plant modelsPlant models Visualization of plant modelsVisualization of plant models Digitizing methodsDigitizing methods L-system for plant structure modelingL-system for plant structure modeling Model-based growth measurementModel-based growth measurement

MATERIALS & METHODSMATERIALS & METHODS
Stereo Machine Vision SystemStereo Machine Vision System L-System FormulationL-System Formulation Graphical ModulesGraphical Modules Test of Method AccuracyTest of Method Accuracy Model-based growth measurementModel-based growth measurement

FLOW CHARTFLOW CHART
3D GRAPHICAL SIMULATION 3D GRAPHICAL SIMULATION
Initialization and Calibration of
the System
Start
Stereo Image Acquisition and
Image Registration
Image Segmentation
Automatic Search for Positions
and Orientation of Leaves
Manual Correction and
Supplement of Searched Results
Conversion of Parameters and
Creation of L-System Strings
Computer Graphical Simulation
and Calculation of Plant Features
End

Rotary stageImage processing board
RS-232 interface
STEREO MACHINE VISION SYSTEMSTEREO MACHINE VISION SYSTEM
RotaryRotary stagestage
Stepper Stepper motormotorcontrollercontroller
Color CCD cameraColor CCD camera

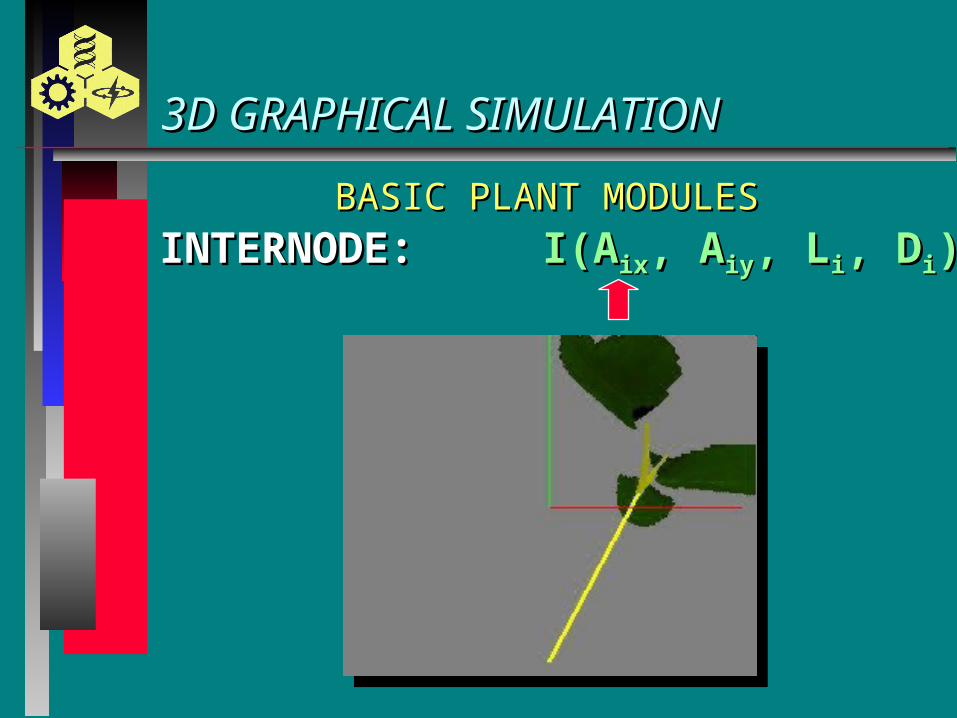
BASIC PLANT MODULESBASIC PLANT MODULES
3D GRAPHICAL SIMULATION 3D GRAPHICAL SIMULATION
ROOT: ROOT: R(XR(Xrr, Y, Yrr, Z, Zrr))
INTERNODE: INTERNODE: I(AI(Aixix, A, Aiyiy, L, Lii, D, Dii))
LEAF: LEAF: L(AL(Apxpx, A, Apypy, L, Lpp, A, Alxlx, A, Alyly, W, Wll, L, Lll, N, Nll))

BASIC PLANT MODULESBASIC PLANT MODULES
3D GRAPHICAL SIMULATION 3D GRAPHICAL SIMULATION
ROOT: ROOT: R(XR(Xrr, Y, Yrr, Z, Zrr))
BASIC PLANT MODULESBASIC PLANT MODULES
3D GRAPHICAL SIMULATION 3D GRAPHICAL SIMULATION
INTERNODE: INTERNODE: I(AI(Aixix, A, Aiyiy, L, Lii, D, Dii))

BASIC PLANT MODULESBASIC PLANT MODULES
3D GRAPHICAL SIMULATION 3D GRAPHICAL SIMULATION
INTERNODE: INTERNODE: I(AI(Aixix, A, Aiyiy, L, Lii, D, Dii))

BASIC PLANT MODULESBASIC PLANT MODULES
3D GRAPHICAL SIMULATION 3D GRAPHICAL SIMULATION
INTERNODE: INTERNODE: I(AI(Aixix, A, Aiyiy, L, Lii, D, Dii))

BASIC PLANT MODULESBASIC PLANT MODULES
3D GRAPHICAL SIMULATION 3D GRAPHICAL SIMULATION
INTERNODE: INTERNODE: I(AI(Aixix, A, Aiyiy, L, Lii, D, Dii))
BASIC PLANT MODULESBASIC PLANT MODULES
3D GRAPHICAL SIMULATION 3D GRAPHICAL SIMULATION
LEAF: LEAF: L(AL(Apxpx, A, Apypy, L, Lpp, A, Alxlx, A, Alyly, W, Wll, L, Lll, N, Nll))
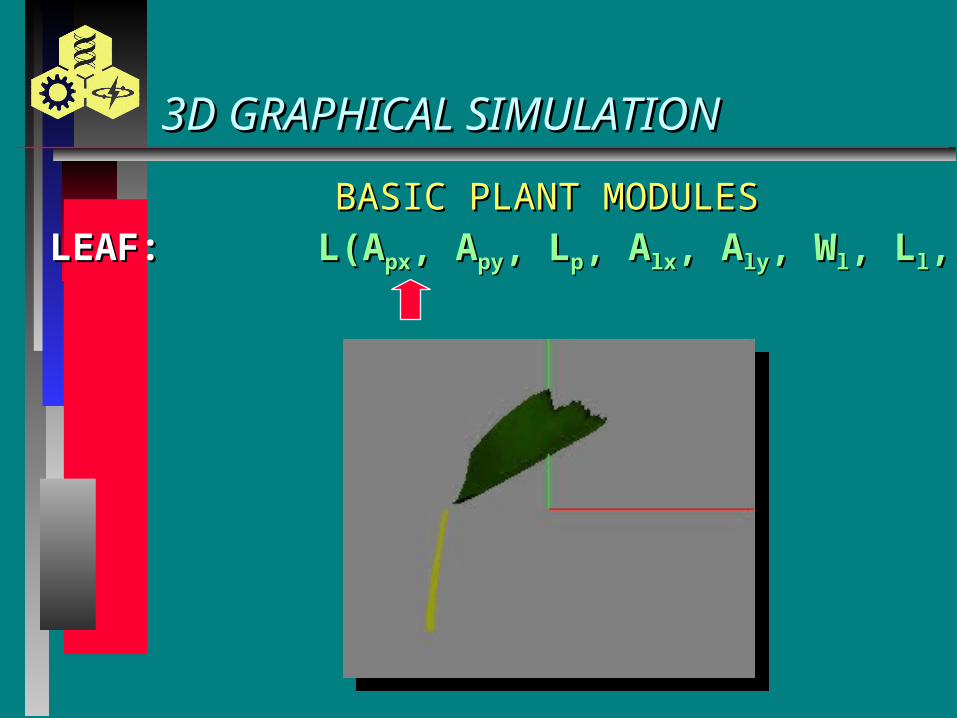
BASIC PLANT MODULESBASIC PLANT MODULES
3D GRAPHICAL SIMULATION 3D GRAPHICAL SIMULATION
LEAF: LEAF: L(AL(Apxpx, A, Apypy, L, Lpp, A, Alxlx, A, Alyly, W, Wll, L, Lll, N, Nll))

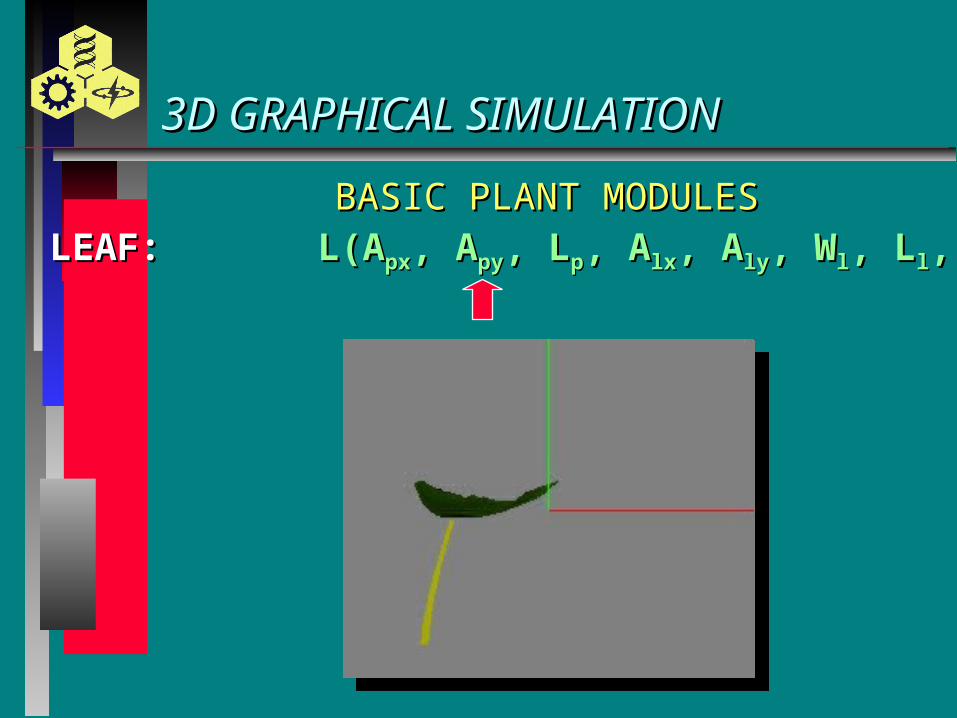
BASIC PLANT MODULESBASIC PLANT MODULES
3D GRAPHICAL SIMULATION 3D GRAPHICAL SIMULATION
LEAF: LEAF: L(AL(Apxpx, A, Apypy, L, Lpp, A, Alxlx, A, Alyly, W, Wll, L, Lll, N, Nll))

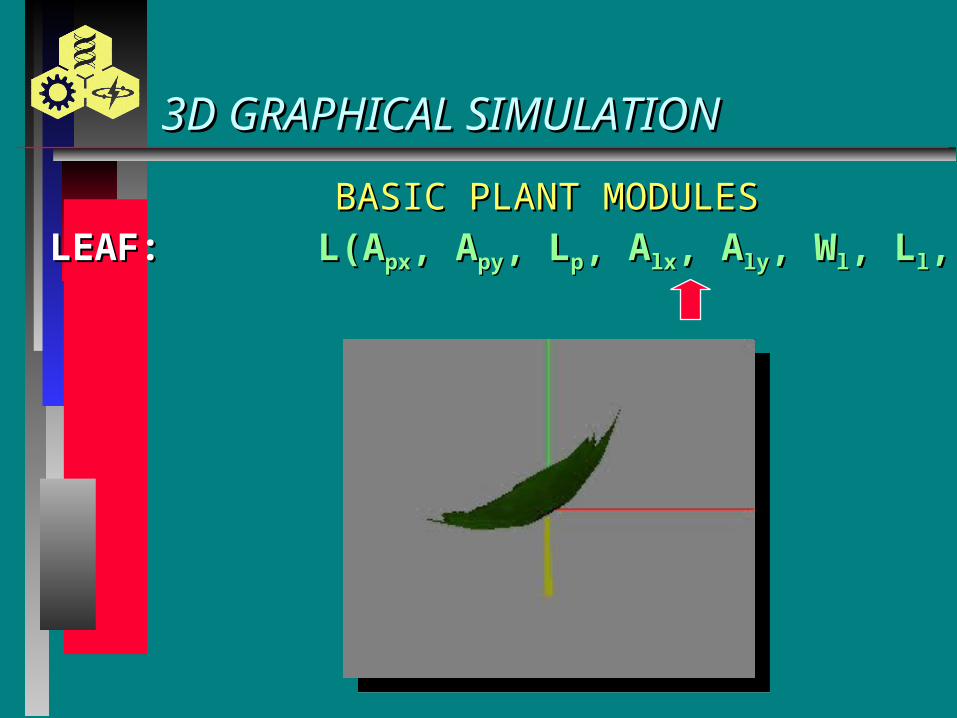
BASIC PLANT MODULESBASIC PLANT MODULES
3D GRAPHICAL SIMULATION 3D GRAPHICAL SIMULATION
LEAF: LEAF: L(AL(Apxpx, A, Apypy, L, Lpp, A, Alxlx, A, Alyly, W, Wll, L, Lll, N, Nll))
BASIC PLANT MODULESBASIC PLANT MODULES
3D GRAPHICAL SIMULATION 3D GRAPHICAL SIMULATION
LEAF: LEAF: L(AL(Apxpx, A, Apypy, L, Lpp, A, Alxlx, A, Alyly, W, Wll, L, Lll, N, Nll))

BASIC PLANT MODULESBASIC PLANT MODULES
3D GRAPHICAL SIMULATION 3D GRAPHICAL SIMULATION
LEAF: LEAF: L(AL(Apxpx, A, Apypy, L, Lpp, A, Alxlx, A, Alyly, W, Wll, L, Lll, N, Nll))

BASIC PLANT MODULESBASIC PLANT MODULES
3D GRAPHICAL SIMULATION 3D GRAPHICAL SIMULATION
LEAF: LEAF: L(AL(Apxpx, A, Apypy, L, Lpp, A, Alxlx, A, Alyly, W, Wll, L, Lll, N, Nll))

BASIC PLANT MODULESBASIC PLANT MODULES
3D GRAPHICAL SIMULATION 3D GRAPHICAL SIMULATION
LEAF: LEAF: L(AL(Apxpx, A, Apypy, L, Lpp, A, Alxlx, A, Alyly, W, Wll, L, Lll, N, Nll))

L-SYSTEML-SYSTEMR(260,70,204)I(-11.7,323.1,49.0,3)L(-40.9,284.0,0,50.3,-17.2,53.1,53.1,1)L(-50.5,74.0,0,75.4,-9.7,48.3,48.3,2)L(-38.7,355.2,0,76.9,-35.7,112.2,112.2,3)L(-20.5,194.0,0,70.4,-28.8,107.5,107.5,4)
3D GRAPHICAL SIMULATION 3D GRAPHICAL SIMULATION

L-SYSTEM STRINGSL-SYSTEM STRINGS
3D GRAPHICAL SIMULATION 3D GRAPHICAL SIMULATION
Digitizing ProcessDigitizing Process
Conversion and Calculation of Conversion and Calculation of L-system ParametersL-system Parameters
L-system StringsL-system Strings
TranslationTranslation
Calculation of Dimension and Calculation of Dimension and Spatial Coordinates of Plant ModulesSpatial Coordinates of Plant Modules
InterpretationInterpretation
Creation of Plant Modules andCreation of Plant Modules andGraphical SimulationGraphical Simulation

3D GRAPHICAL SIMULATION 3D GRAPHICAL SIMULATION
MAKING TEXTURAL IMAGE TEMPLATEMAKING TEXTURAL IMAGE TEMPLATE

3D GRAPHICAL SIMULATION 3D GRAPHICAL SIMULATION
LEAF MODULELEAF MODULE
Elliptical Surface ApproachElliptical Surface Approach
Bezier Surface ApproachBezier Surface Approach

3D GRAPHICAL SIMULATION 3D GRAPHICAL SIMULATION
Top ViewTop View
Side ViewSide View
Real ImageReal Image Graphical SimulationGraphical Simulation
PEPPER SEEDLINGPEPPER SEEDLING

3D GRAPHICAL SIMULATION 3D GRAPHICAL SIMULATION
OTHER PLANTSOTHER PLANTS
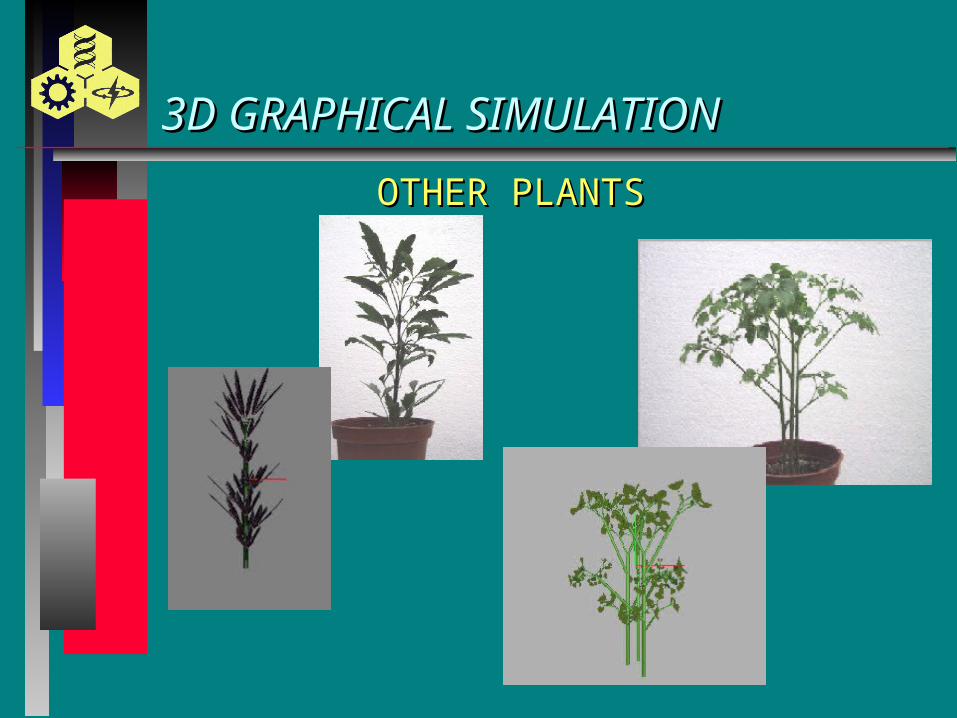
3D GRAPHICAL SIMULATION 3D GRAPHICAL SIMULATION
OTHER PLANTSOTHER PLANTS

MODEL-BASED MEASUREMENTMODEL-BASED MEASUREMENT
Point,Length,Angle,Texture
L-system
Semi-AutomaticMeasurement
AutomaticMeasured
3DComputer
Graphics
SeedlingFeatures
By Model
Computation

Stem lengthStem length HeightHeight SpanSpan Total leaf area and individual leaf areaTotal leaf area and individual leaf area Top fresh weight (Top fresh weight (need calibrationneed calibration)) Top dry weight (Top dry weight (need calibrationneed calibration)) Number of leavesNumber of leaves Leaf area index, LAILeaf area index, LAI Leaf lengthLeaf length Leaf widthLeaf width
SEEDLING FEATURESSEEDLING FEATURES
MODEL-BASED MEASUREMENTMODEL-BASED MEASUREMENT

Comparisons of predicted plant height with manually Comparisons of predicted plant height with manually measured plant height.measured plant height.
y = 0.989x + 0.64
R2 = 0.979
0
5
10
15
20
25
30
35
40
45
0 5 10 15 20 25 30 35 40 45
ACTUAL PLANT HEIGHT (mm)
PRED
ICTE
D P
LAN
T H
EIG
HT
(mm
)
PepperPepper
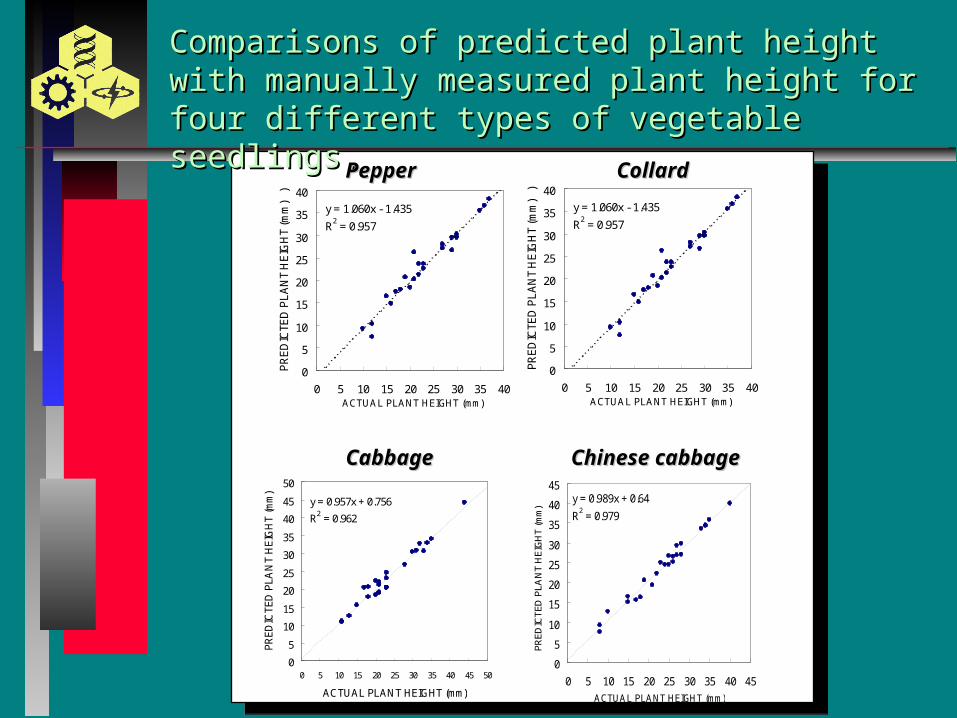
Comparisons of predicted plant height with manually Comparisons of predicted plant height with manually measured plant height for four different types of measured plant height for four different types of vegetable seedlings. vegetable seedlings.
y = 1.060x - 1.435
R2 = 0.957
0
5
10
15
20
25
30
35
40
0 5 10 15 20 25 30 35 40ACTUAL PLANT HEIGHT (mm)
PR
ED
ICTE
D P
LA
NT
HE
IGH
T (m
m)
)
y = 1.060x - 1.435
R2 = 0.957
0
5
10
15
20
25
30
35
40
0 5 10 15 20 25 30 35 40ACTUAL PLANT HEIGHT (mm)
PR
ED
ICTE
D P
LA
NT
HE
IGH
T (m
m)
)
y = 0.957x + 0.756
R2 = 0.962
0
5
10
15
20
25
30
35
40
45
50
0 5 10 15 20 25 30 35 40 45 50
ACTUAL PLANT HEIGHT (mm)
PR
ED
ICT
ED
PL
AN
T H
EIG
HT
(m
m) y = 0.989x + 0.64
R2 = 0.979
0
5
10
15
20
25
30
35
40
45
0 5 10 15 20 25 30 35 40 45
ACTUAL PLANT HEIGHT (mm)
PRED
ICTE
D P
LAN
T H
EIG
HT
(mm
)
PepperPepper CollardCollard
CabbageCabbage Chinese cabbageChinese cabbage

Comparisons of predicted plant total leaf area with Comparisons of predicted plant total leaf area with manually measured plant total leaf area for four manually measured plant total leaf area for four different types of vegetable seedlings. different types of vegetable seedlings.
PepperPepper CollardCollard
CabbageCabbage Chinese cabbageChinese cabbage
y = 1.0214x + 0.6159
R2 = 0.9821
0
5
10
15
20
25
30
35
0 5 10 15 20 25 30 35
ACTUAL TOTAL LEAF AREA (cm2)
PRED
ICT
ED T
OT
AL
LEA
F A
REA
(cm
2 ) y = 0.9821x - 0.139
R2 = 0.9837
0
5
10
15
20
25
30
35
40
0 5 10 15 20 25 30 35 40
ACTUAL TOTAL LEAF AREA (cm2)
PRED
ICT
ED T
OT
AL
LEA
F A
REA
(cm
2 )
y = 1.0214x + 0.6159
R2 = 0.9821
0
5
10
15
20
25
30
35
0 5 10 15 20 25 30 35
ACTUAL TOTAL LEAF AREA (cm2)
PRED
ICT
ED T
OT
AL
LEA
F A
REA
(cm
2 ) y = 0.8478x + 1.9658
R2 = 0.892
0
5
10
15
20
25
30
35
40
45
0 5 10 15 20 25 30 35 40 45
ACTUAL TOTAL LEAF AREA (cm2)
PRED
ICT
ED T
OT
AL
LEA
F A
REA
(cm
2 )

Comparisons of predicted and manually measured Comparisons of predicted and manually measured plant features.plant features.
Slope a Intercept b R2 RMSE RRMSE
First internode 0.98 0.43 0.97 0.61 mm 2.4%
Plant height 0.97 1.2 0.98 1.65 mm 4.3%
Leaf length 1.06 -4.2 0.87 3.96 mm 15.6%
Leaf width 1.01 0.32 0.92 1.49 mm 12.9%
Individual leaf area 1.03 0.05 0.94 0.41 cm2 17.0%
Total leaf area 1.05 -0.05 0.95 1.42 cm2 9.8%
Petiole length 0.96 2.7 0.84 3.61 mm 57.2%
PepperPepper
Slope a Intercept b R2 RMSE RRMSE
First internode 0.90 1.2 0.94 0.91 mm 8.9%
Plant height 1.06 -1.43 0.96 1.73 mm 10.8%
Leaf length 0.85 0.95 0.91 4.84 mm 21.1%
Leaf width 1.12 -2.46 0.92 2.58 mm 16.1%
Individual leaf area 0.99 -0.08 0.96 0.72 cm2 29.5%
Total leaf area 0.98 -0.14 0.98 1.13 cm2 10.2%
Petiole length 0.99 2.7 0.93 4.39 mm 27.1%
CollardCollard

Comparisons of predicted and manually measured Comparisons of predicted and manually measured plant features.plant features.
CabbageCabbage
Chinese cabbageChinese cabbage
Slope a Intercept b R2 RMSE RRMSE
First internode 1.04 -0.47 0.99 0.46 mm 4.1%
Plant height 0.96 0.75 0.96 1.58 mm 7.6%
Leaf length 0.93 -0.77 0.95 3.91 mm 16.6%
Leaf width 0.99 -0.79 0.89 2.98 mm 15.5%
Individual leaf area 0.98 -0.18 0.94 0.95 cm2 23.0%
Total leaf area 1.02 0.62 0.98 1.55 cm2 15.6%
Petiole length 0.97 3.20 0.92 4.78 mm 30.7%
Slope a Intercept b R2 RMSE RRMSE
First internode 0.98 0.20 0.98 0.42 mm 4.6%
Plant height 0.99 0.64 0.98 1.26 mm 8.1%
Leaf length 0.89 0.90 0.94 4.17 mm 18.2%
Leaf width 1.16 -4.00 0.85 3.52 mm 21.4%
Individual leaf area 1.01 -2.20 0.92 1.03 cm2 30.6%
Total leaf area 0.85 1.96 0.89 3.14 cm2 12.7%
Petiole length 0.95 3.80 0.87 5.47 mm 36.3%
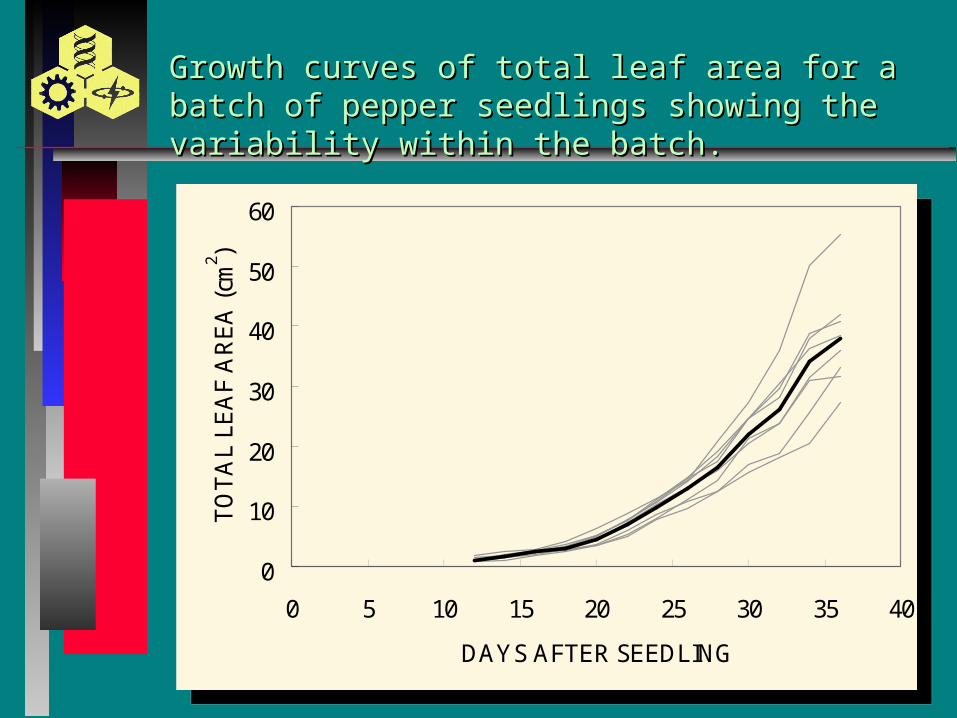
Growth curves of total leaf area for a batch of pepper Growth curves of total leaf area for a batch of pepper seedlings showing the variability within the batch. seedlings showing the variability within the batch.
0
10
20
30
40
50
60
0 5 10 15 20 25 30 35 40
DAYS AFTER SEEDLING
TO
TA
L L
EA
F A
RE
A (
cm2 )
0
10
20
30
40
50
60
0 5 10 15 20 25 30 35 40
DAYS AFTER SEEDLING
TO
TA
L L
EA
F A
RE
A (
cm2 )

Growth curves of total leaf area for pepper seedlings Growth curves of total leaf area for pepper seedlings cultured in pots of different sizes.cultured in pots of different sizes.
0
5
10
15
20
25
30
35
40
45
50
0 5 10 15 20 25 30 35 40
DAYS AFTER SEEDLING
TO
TA
L L
EA
F A
RE
A (
cm2 )
5 ml
20 ml
30 ml
180 ml
750 ml
0
5
10
15
20
25
30
35
40
45
50
0 5 10 15 20 25 30 35 40
DAYS AFTER SEEDLING
TO
TA
L L
EA
F A
RE
A (
cm2 )
5 ml
20 ml
30 ml
180 ml
750 ml

Average growth curves of leaf area for individual Average growth curves of leaf area for individual leaves of pepper seedlings cultured in pots of 180 ml leaves of pepper seedlings cultured in pots of 180 ml volume.volume.
0
5
10
15
20
25
30
35
40
45
0 5 10 15 20 25 30 35 40
DAYS AFTER SEEDING
LEA
F A
RE
A (
cm2 )
1st cotyledon
2nd cotyledon
1st leaf
2nd leaf
3rd leaf
4th leaf
5th leaf
6th leaf
Total leaf area
0
5
10
15
20
25
30
35
40
45
0 5 10 15 20 25 30 35 40
DAYS AFTER SEEDING
LEA
F A
RE
A (
cm2 )
1st cotyledon
2nd cotyledon
1st leaf
2nd leaf
3rd leaf
4th leaf
5th leaf
6th leaf
Total leaf area

Average growth curves of leaf area for the 1st leaf of Average growth curves of leaf area for the 1st leaf of pepper seedlings cultured in pots of different sizes. pepper seedlings cultured in pots of different sizes.
0
2
4
6
8
10
12
0 10 20 30 40
DAYS AFTER SEEDING
LEA
F A
RE
A (
cm2 )
5 ml
20ml
30ml
180ml
750ml
0
2
4
6
8
10
12
0 10 20 30 40
DAYS AFTER SEEDING
LEA
F A
RE
A (
cm2 )
5 ml
20ml
30ml
180ml
750ml
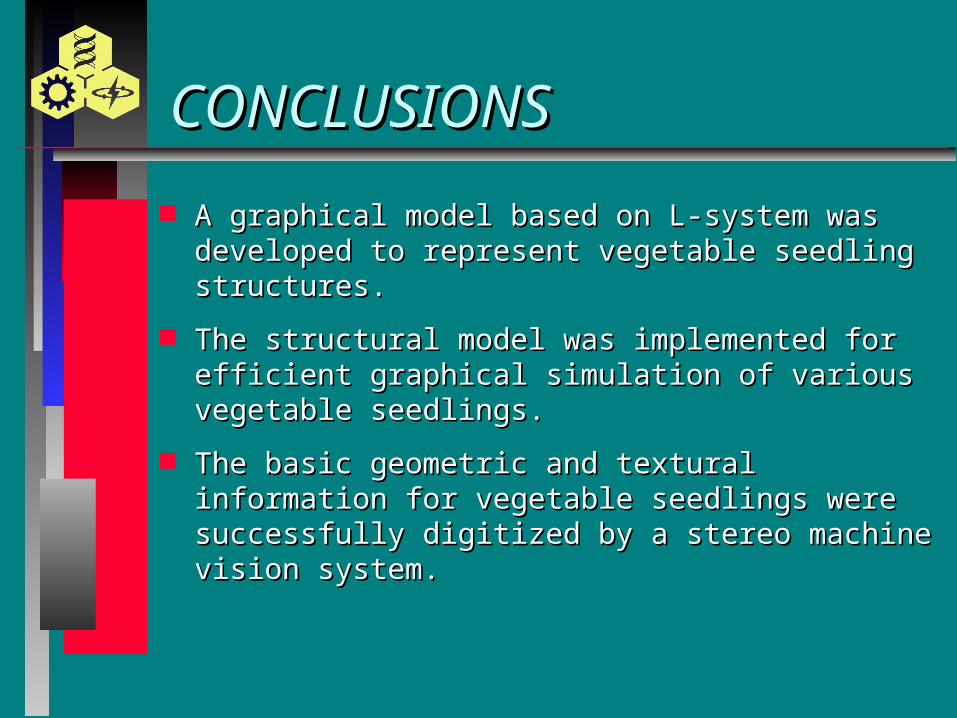
CONCLUSIONSCONCLUSIONS
A graphical model based on L-system was A graphical model based on L-system was developed to represent vegetable seedling developed to represent vegetable seedling structures.structures.
The structural model was implemented for efficient The structural model was implemented for efficient graphical simulation of various vegetable seedlings.graphical simulation of various vegetable seedlings.
The basic geometric and textural information for The basic geometric and textural information for vegetable seedlings were successfully digitized by vegetable seedlings were successfully digitized by a stereo machine vision system.a stereo machine vision system.
CONCLUSIONSCONCLUSIONS
Measurements of four different seedlings were Measurements of four different seedlings were performed to assess the methodology. The system performed to assess the methodology. The system was successfully applied in measuring growth curves was successfully applied in measuring growth curves of pepper seedlings under different culture of pepper seedlings under different culture conditions.conditions.
The model-based measurement of plant features The model-based measurement of plant features offers additional information than what conventional offers additional information than what conventional methods can provide.methods can provide.

THANK YOUTHANK YOU
謝 謝謝 謝