3d line charts - ncss · 3d line charts introduction line charts are used to visually compare...
TRANSCRIPT
NCSS Statistical Software NCSS.com
149-1 © NCSS, LLC. All Rights Reserved.
Chapter 149
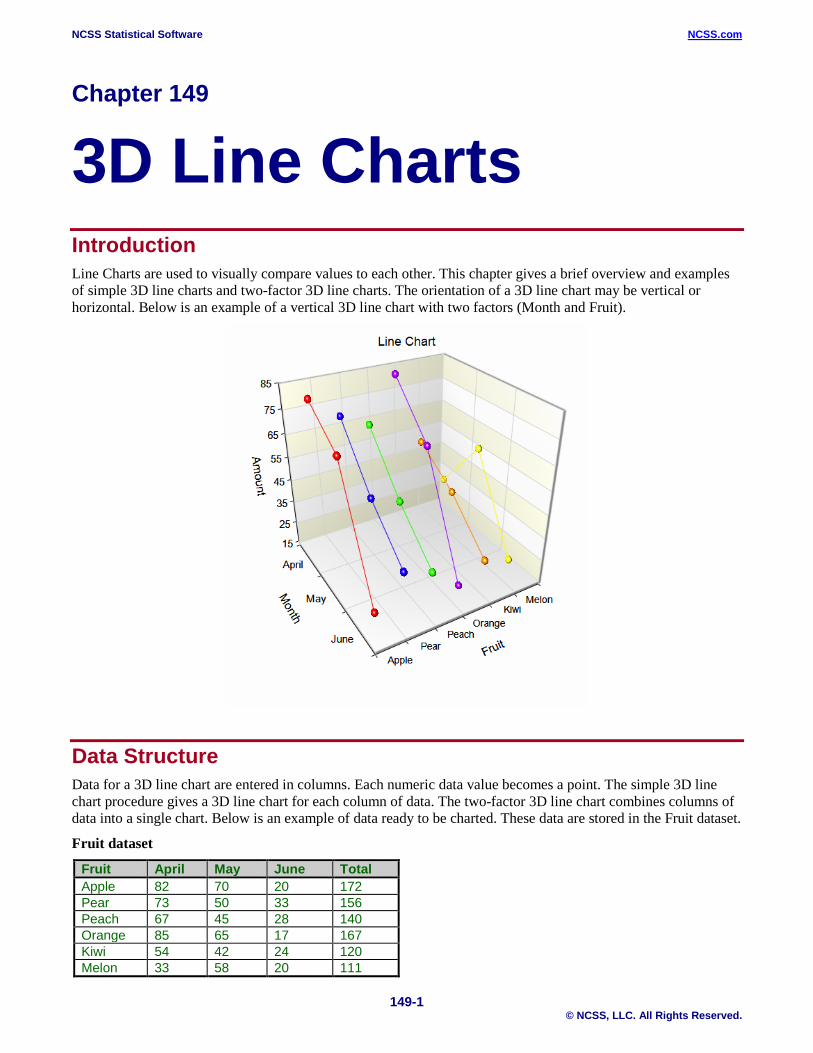
3D Line Charts Introduction Line Charts are used to visually compare values to each other. This chapter gives a brief overview and examples of simple 3D line charts and two-factor 3D line charts. The orientation of a 3D line chart may be vertical or horizontal. Below is an example of a vertical 3D line chart with two factors (Month and Fruit).
Data Structure Data for a 3D line chart are entered in columns. Each numeric data value becomes a point. The simple 3D line chart procedure gives a 3D line chart for each column of data. The two-factor 3D line chart combines columns of data into a single chart. Below is an example of data ready to be charted. These data are stored in the Fruit dataset.
Fruit dataset
Fruit April May June Total Apple 82 70 20 172 Pear 73 50 33 156 Peach 67 45 28 140 Orange 85 65 17 167 Kiwi 54 42 24 120 Melon 33 58 20 111
NCSS Statistical Software NCSS.com 3D Line Charts
149-2 © NCSS, LLC. All Rights Reserved.
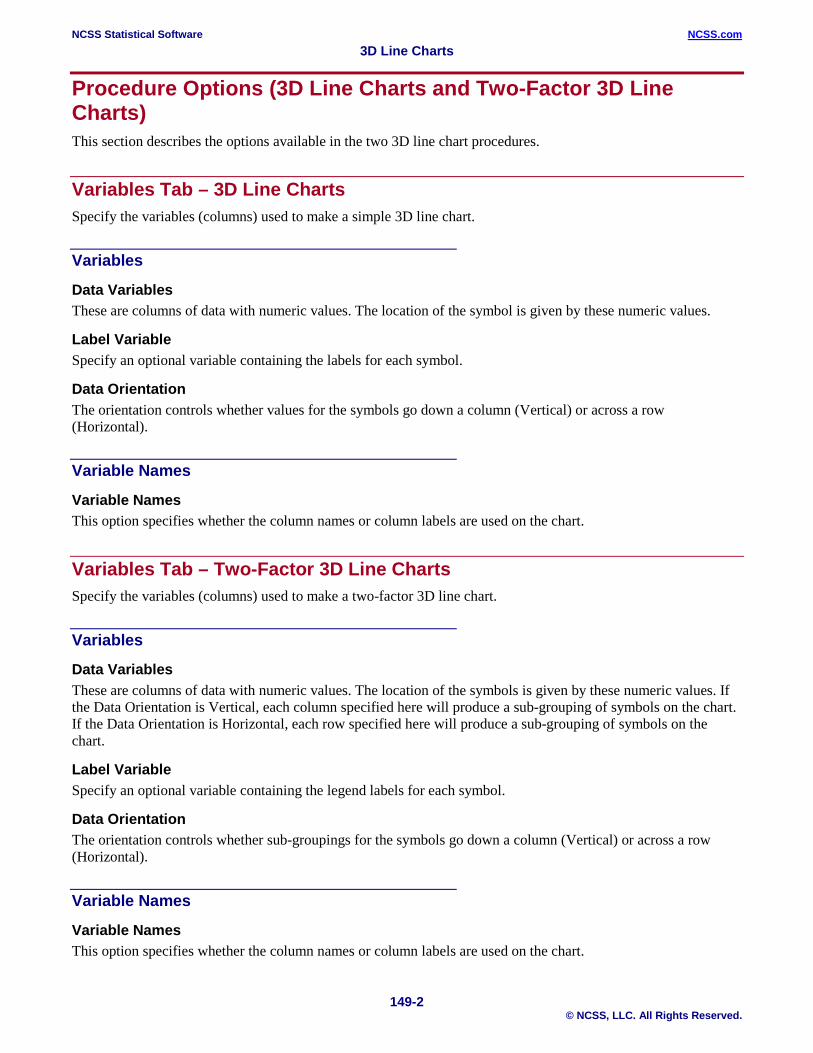
Procedure Options (3D Line Charts and Two-Factor 3D Line Charts) This section describes the options available in the two 3D line chart procedures.
Variables Tab – 3D Line Charts Specify the variables (columns) used to make a simple 3D line chart.
Variables
Data Variables These are columns of data with numeric values. The location of the symbol is given by these numeric values.
Label Variable Specify an optional variable containing the labels for each symbol.
Data Orientation The orientation controls whether values for the symbols go down a column (Vertical) or across a row (Horizontal).
Variable Names
Variable Names This option specifies whether the column names or column labels are used on the chart.
Variables Tab – Two-Factor 3D Line Charts Specify the variables (columns) used to make a two-factor 3D line chart.
Variables
Data Variables These are columns of data with numeric values. The location of the symbols is given by these numeric values. If the Data Orientation is Vertical, each column specified here will produce a sub-grouping of symbols on the chart. If the Data Orientation is Horizontal, each row specified here will produce a sub-grouping of symbols on the chart.
Label Variable Specify an optional variable containing the legend labels for each symbol.
Data Orientation The orientation controls whether sub-groupings for the symbols go down a column (Vertical) or across a row (Horizontal).
Variable Names
Variable Names This option specifies whether the column names or column labels are used on the chart.

NCSS Statistical Software NCSS.com 3D Line Charts
149-3 © NCSS, LLC. All Rights Reserved.
3D Line Chart Format
Format Click the format button to change the plot settings (see 3D Line Chart Window Options below).
Edit During Run Checking this option will cause the line chart format window to appear when the procedure is run. This allows you to modify the format of the graph with the actual data.
3D Line Chart Window Options This section describes the specific options available on the Line Chart window, which is displayed when the 3D Line Chart button is clicked. Common options, such as axes, labels, legends, and titles are documented in the Graphics Components chapter.
3D Line Chart Tab
Plot Type Section You can create a chart that displays either symbols or bars using the options in this section.
One Factor
Two Factors
NCSS Statistical Software NCSS.com 3D Line Charts
149-4 © NCSS, LLC. All Rights Reserved.
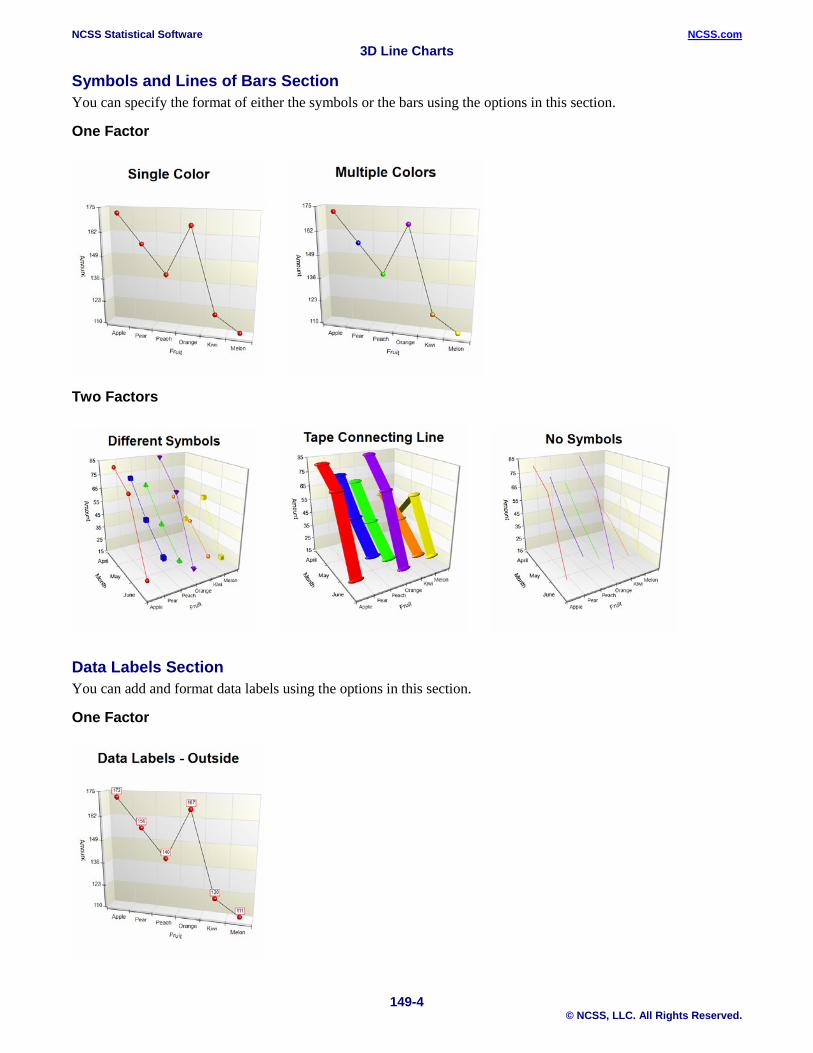
Symbols and Lines of Bars Section You can specify the format of either the symbols or the bars using the options in this section.
One Factor
Two Factors
Data Labels Section You can add and format data labels using the options in this section.
One Factor
NCSS Statistical Software NCSS.com 3D Line Charts
149-5 © NCSS, LLC. All Rights Reserved.
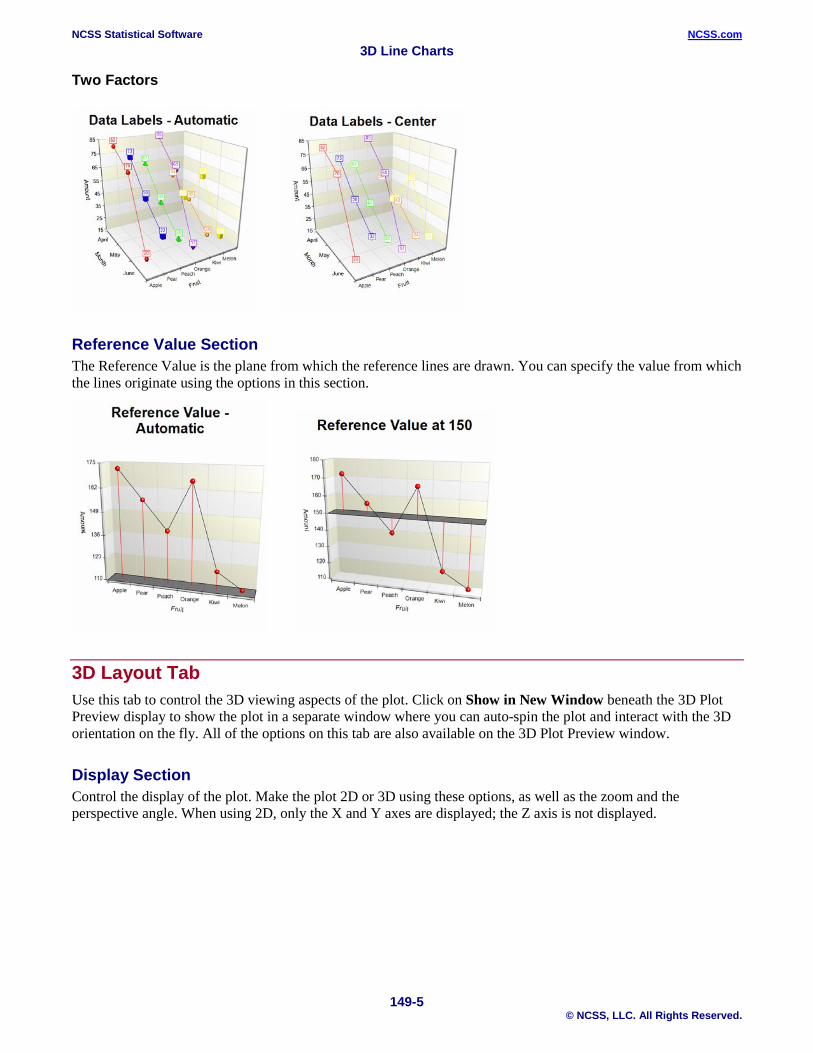
Two Factors
Reference Value Section The Reference Value is the plane from which the reference lines are drawn. You can specify the value from which the lines originate using the options in this section.
3D Layout Tab Use this tab to control the 3D viewing aspects of the plot. Click on Show in New Window beneath the 3D Plot Preview display to show the plot in a separate window where you can auto-spin the plot and interact with the 3D orientation on the fly. All of the options on this tab are also available on the 3D Plot Preview window.
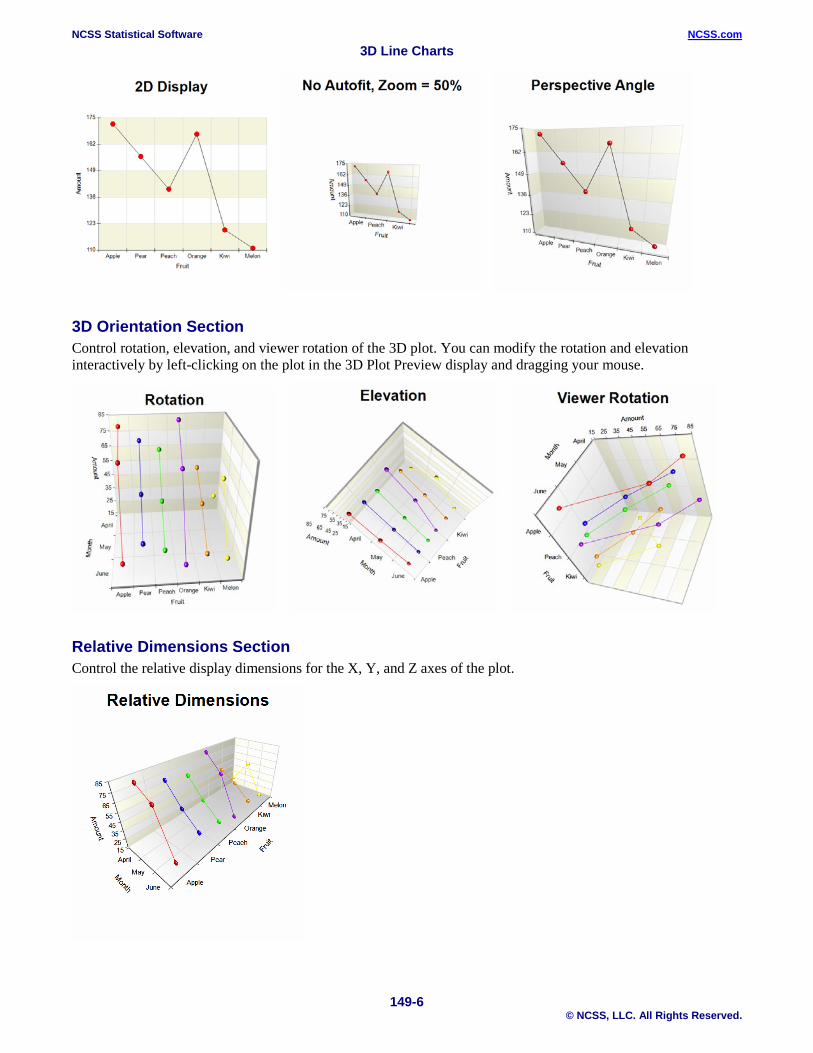
Display Section Control the display of the plot. Make the plot 2D or 3D using these options, as well as the zoom and the perspective angle. When using 2D, only the X and Y axes are displayed; the Z axis is not displayed.
NCSS Statistical Software NCSS.com 3D Line Charts
149-6 © NCSS, LLC. All Rights Reserved.
3D Orientation Section Control rotation, elevation, and viewer rotation of the 3D plot. You can modify the rotation and elevation interactively by left-clicking on the plot in the 3D Plot Preview display and dragging your mouse.
Relative Dimensions Section Control the relative display dimensions for the X, Y, and Z axes of the plot.
NCSS Statistical Software NCSS.com 3D Line Charts
149-7 © NCSS, LLC. All Rights Reserved.
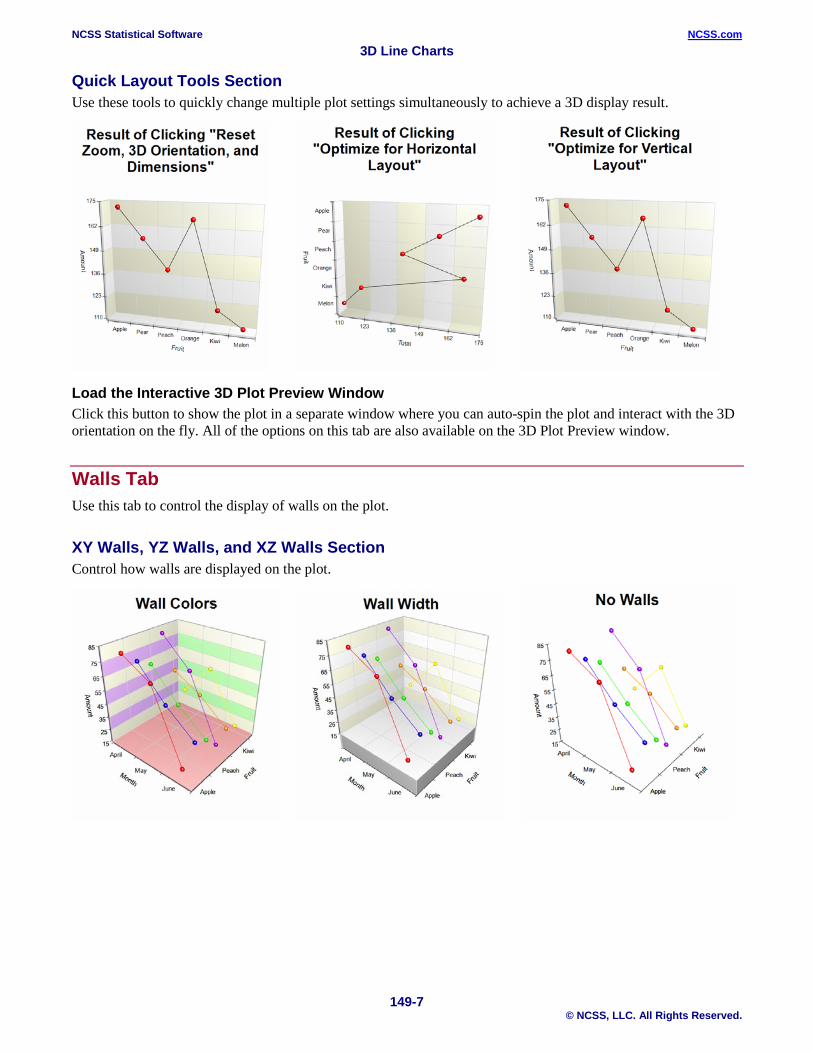
Quick Layout Tools Section Use these tools to quickly change multiple plot settings simultaneously to achieve a 3D display result.
Load the Interactive 3D Plot Preview Window Click this button to show the plot in a separate window where you can auto-spin the plot and interact with the 3D orientation on the fly. All of the options on this tab are also available on the 3D Plot Preview window.
Walls Tab Use this tab to control the display of walls on the plot.
XY Walls, YZ Walls, and XZ Walls Section Control how walls are displayed on the plot.
NCSS Statistical Software NCSS.com 3D Line Charts
149-8 © NCSS, LLC. All Rights Reserved.
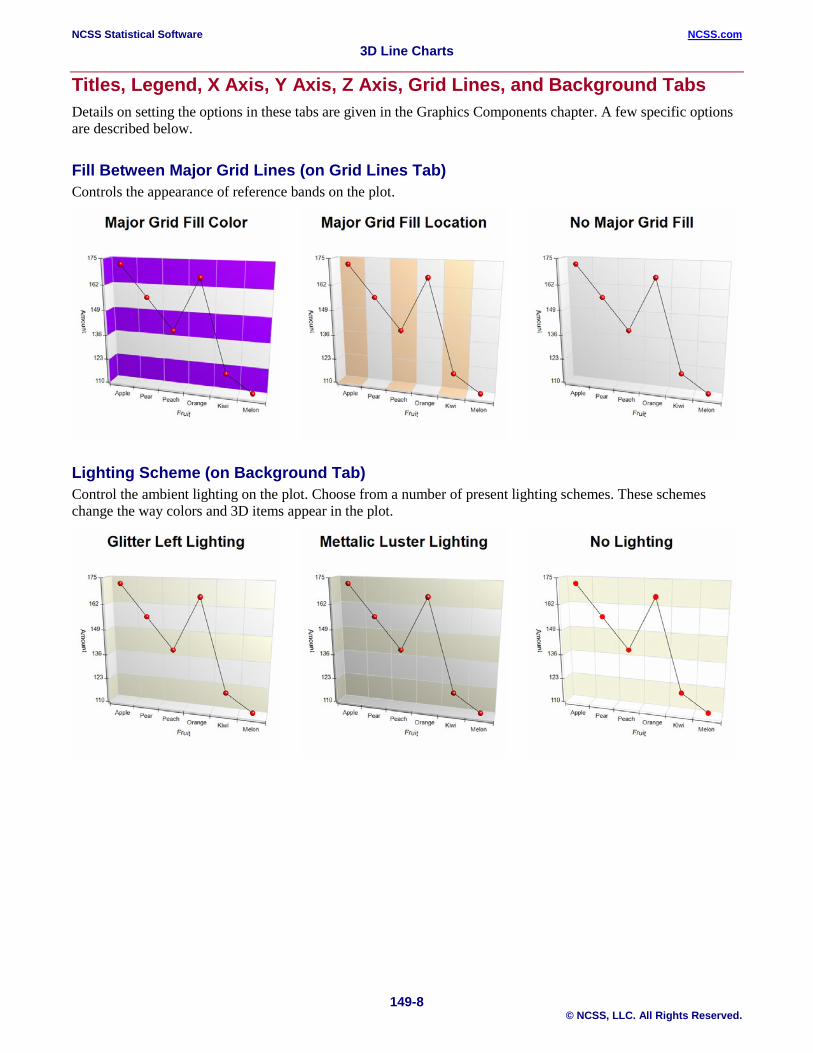
Titles, Legend, X Axis, Y Axis, Z Axis, Grid Lines, and Background Tabs Details on setting the options in these tabs are given in the Graphics Components chapter. A few specific options are described below.
Fill Between Major Grid Lines (on Grid Lines Tab) Controls the appearance of reference bands on the plot.
Lighting Scheme (on Background Tab) Control the ambient lighting on the plot. Choose from a number of present lighting schemes. These schemes change the way colors and 3D items appear in the plot.
NCSS Statistical Software NCSS.com 3D Line Charts
149-9 © NCSS, LLC. All Rights Reserved.
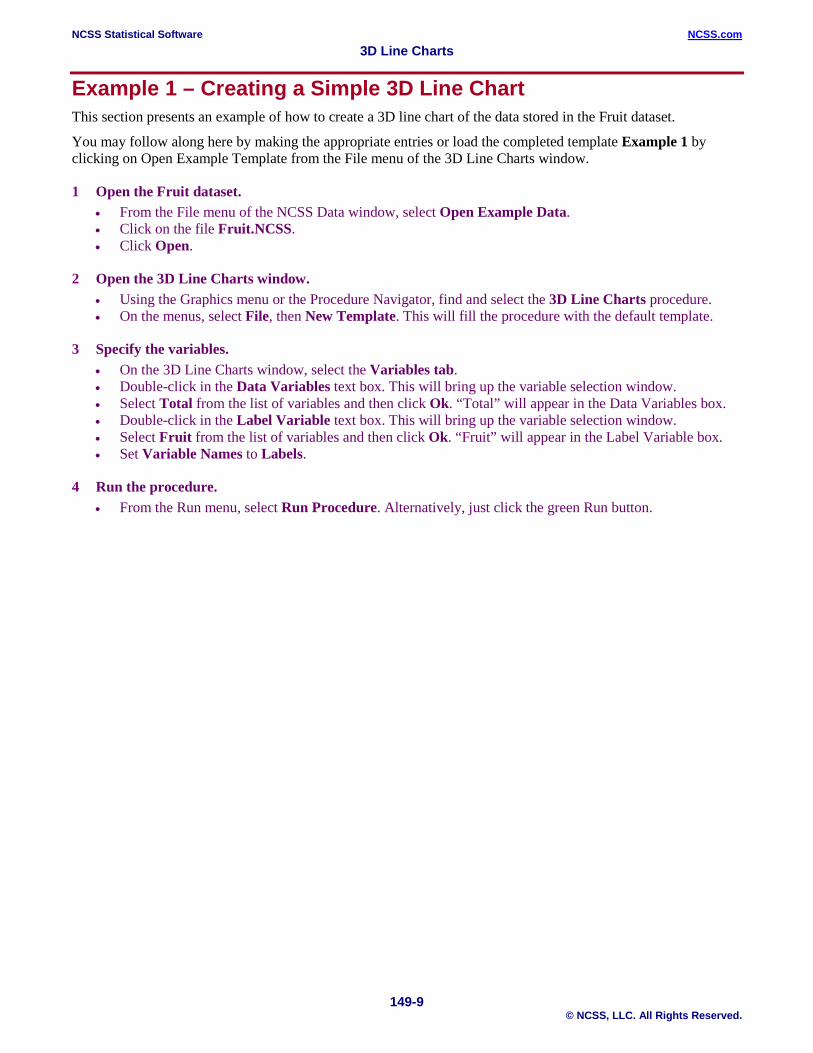
Example 1 – Creating a Simple 3D Line Chart This section presents an example of how to create a 3D line chart of the data stored in the Fruit dataset.
You may follow along here by making the appropriate entries or load the completed template Example 1 by clicking on Open Example Template from the File menu of the 3D Line Charts window.
1 Open the Fruit dataset. • From the File menu of the NCSS Data window, select Open Example Data. • Click on the file Fruit.NCSS. • Click Open.
2 Open the 3D Line Charts window. • Using the Graphics menu or the Procedure Navigator, find and select the 3D Line Charts procedure. • On the menus, select File, then New Template. This will fill the procedure with the default template.
3 Specify the variables. • On the 3D Line Charts window, select the Variables tab. • Double-click in the Data Variables text box. This will bring up the variable selection window. • Select Total from the list of variables and then click Ok. “Total” will appear in the Data Variables box. • Double-click in the Label Variable text box. This will bring up the variable selection window. • Select Fruit from the list of variables and then click Ok. “Fruit” will appear in the Label Variable box. • Set Variable Names to Labels.
4 Run the procedure. • From the Run menu, select Run Procedure. Alternatively, just click the green Run button.
NCSS Statistical Software NCSS.com 3D Line Charts
149-10 © NCSS, LLC. All Rights Reserved.
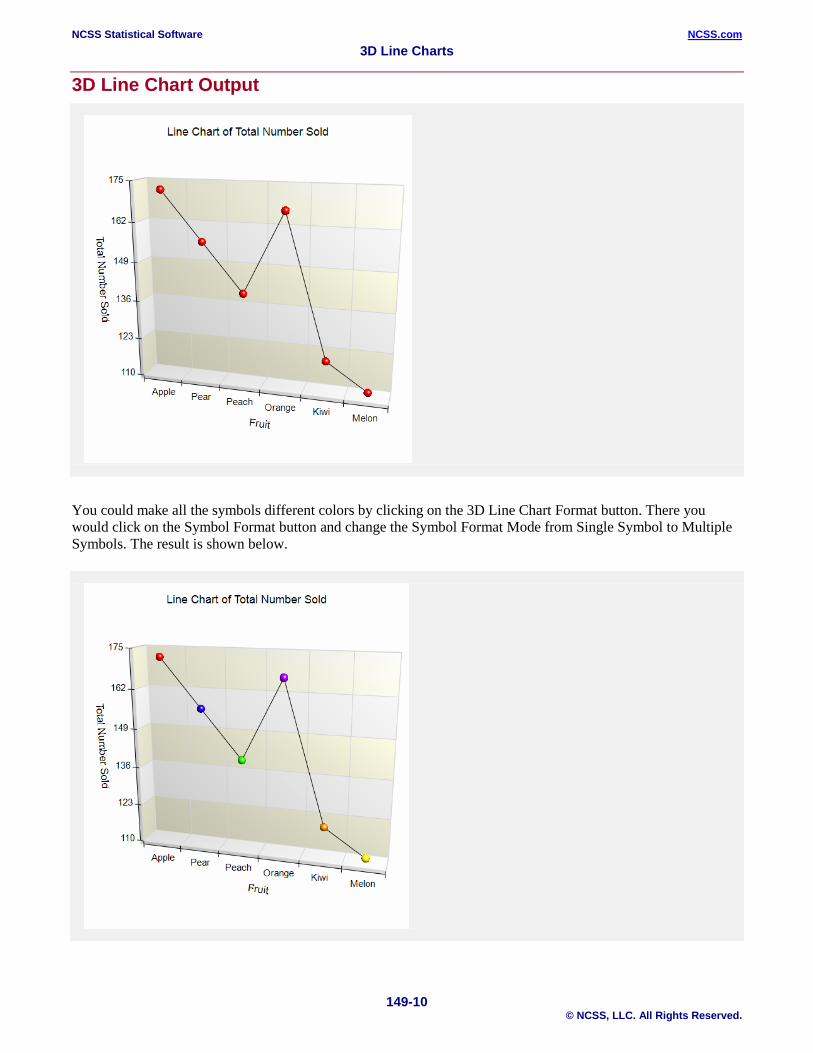
3D Line Chart Output
You could make all the symbols different colors by clicking on the 3D Line Chart Format button. There you would click on the Symbol Format button and change the Symbol Format Mode from Single Symbol to Multiple Symbols. The result is shown below.
NCSS Statistical Software NCSS.com 3D Line Charts
149-11 © NCSS, LLC. All Rights Reserved.
Example 2 – Creating a Two-Factor 3D Line Chart This section presents an example of how to create a two-factor 3D line chart of the data stored in the Fruit dataset.
You may follow along here by making the appropriate entries or load the completed template Example 2 by clicking on Open Example Template from the File menu of the 3D Line Charts (2 Factors) window.
1 Open the Fruit dataset. • From the File menu of the NCSS Data window, select Open Example Data. • Click on the file Fruit.NCSS. • Click Open.
2 Open the 3D Line Charts (2 Factors) window. • Using the Graphics menu or the Procedure Navigator, find and select the 3D Line Charts (2 Factors)
procedure. • On the menus, select File, then New Template. This will fill the procedure with the default template.
3 Specify the variables. • On the 3D Line Charts window, select the Variables tab. • Double-click in the Data Variables text box. This will bring up the variable selection window. • Select April, May, and June from the list of variables and then click Ok. “April-June” will appear in the
Data Variables box. • Double-click in the Label Variable text box. This will bring up the variable selection window. • Select Fruit from the list of variables and then click Ok. “Fruit” will appear in the Label Variable box.
4 Specify the Axis Labels and 3D Layout. • On the 3D Line Charts window, click on the 3D Line Chart Format button. • On the Numeric Axis (Y) tab, change the Front Axis Label to Number Sold. • On the Group 1 Axis (X) tab, change the Front Axis Label to Month. • On the 3D Layout tab, change the Z (Depth) Relative Dimension to 150%. • Click OK.
5 Run the procedure. • From the Run menu, select Run Procedure. Alternatively, just click the green Run button.
NCSS Statistical Software NCSS.com 3D Line Charts
149-12 © NCSS, LLC. All Rights Reserved.
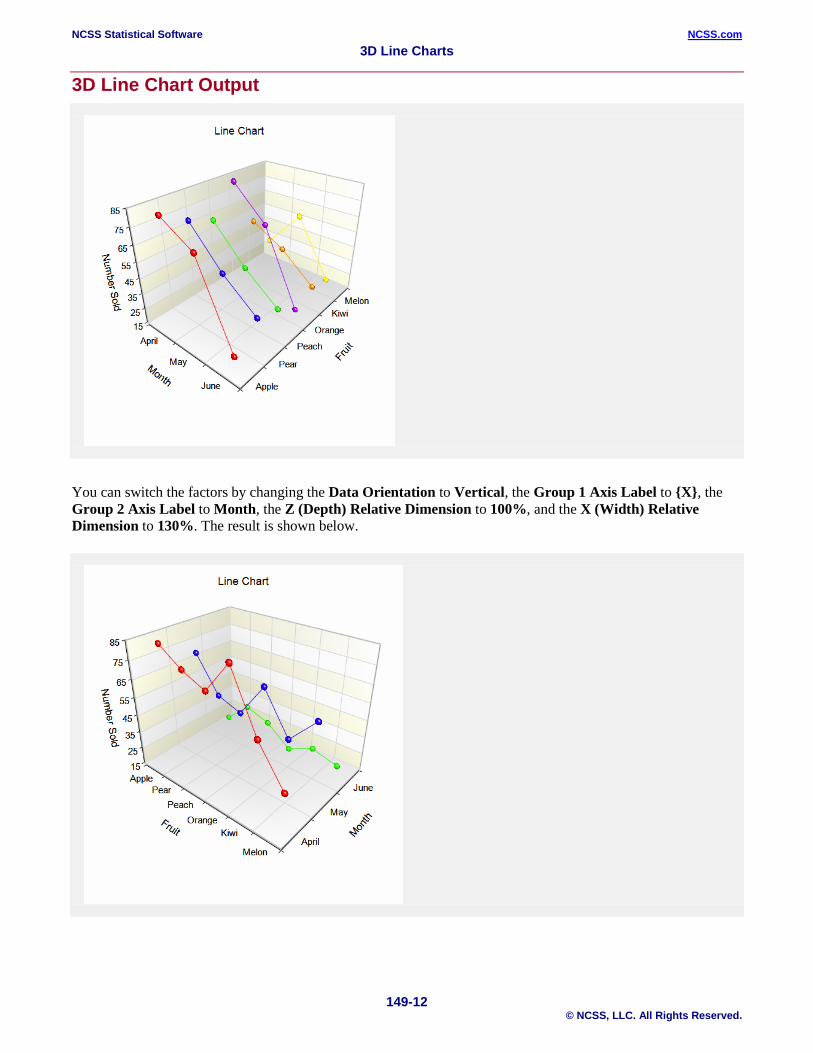
3D Line Chart Output
You can switch the factors by changing the Data Orientation to Vertical, the Group 1 Axis Label to {X}, the Group 2 Axis Label to Month, the Z (Depth) Relative Dimension to 100%, and the X (Width) Relative Dimension to 130%. The result is shown below.