3d-saft ultrasonic inspection equipment … saft ultrasonic inspection equipment...
TRANSCRIPT
Developments in Ultrasonic Phased Array Inspection I
3D-SAFT Ultrasonic Inspection Equipment “MatrixeyeTM
” H. Karasawa, T. Ikeda, S. Matsumoto, Toshiba Corporation, Japan; T. Hamajima,Toshiba Power
System Inspection Service Co., LTD, Japan; H. Isobe, Toshiba Plant System & Services Corporation,
Japan
ABSTRACT
3D ultrasonic inspection equipment “MatrixeyeTM” can visualize defects as 3D image with good
resolution by the 3D SAFT (Synthetic Aperture Focusing Technique) imaging method. High-speed 3D
SAFT imaging process can be achieved by the developed parallel signal process of the ultrasonic echo
data collected by a linear or a matrix-array ultrasonic probe. It has the following features.
•3D image with high resolution can be visualized by the small number of elements.
•Resolution of 3D image is almost constant against a change of depth and a probe frequency.
•Sensitivity of 3D image is good because S/N ratio is improved by SAFT process itself.
In this report, we introduce development of 3D-SAFT technology, its application and the current
development activity.
Keywords: Ultrasonic Inspection, Matrix-array probe, 3D, UT, SAFT, Phased array
INTRODUCTION
In recent years, phased array technology, which can control focus depth and can steer angle of
transmission ultrasonic beam by using array probes, has been applied to NDT (Non Destructive Test)
in various industrial areas world widely.
On the other hand, we had developed and commercialized 3D SAFT (Three-Dimensional
Synthetic Aperture Focusing Technology) ultrasonic inspection equipment “MatrixeyeTM
”, which
enables a large number of acquired echo data to focus on every point within 3D imaging area.
In this report, we introduce principle of 3D SAFT, functions and applications of the portable
3D SAFT ultrasonic inspection equipment “MatrixeyeTM
EX”. In addition, we introduce basic
development results of the advanced 3D SAFT method, which takes phased array technology into 3D
SAFT technology.
3D SAFT TECHNOLOGY AND EQUIPMENT
Principle of 3D-SAFT
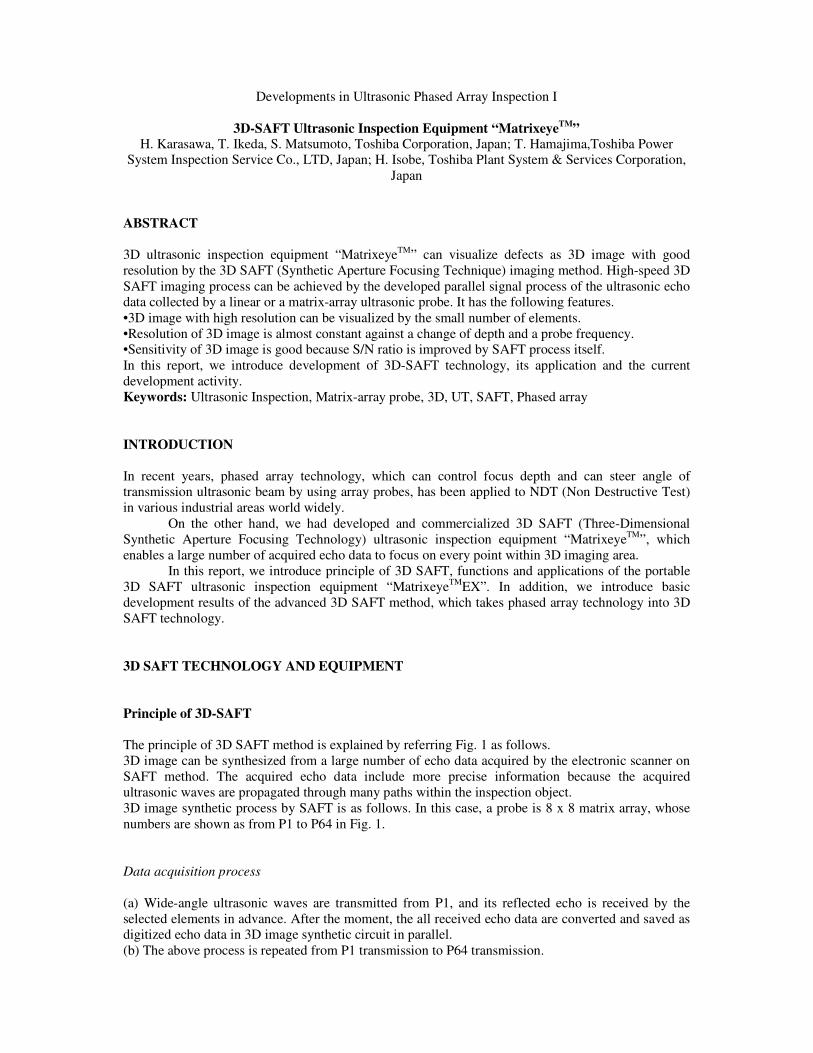
The principle of 3D SAFT method is explained by referring Fig. 1 as follows.
3D image can be synthesized from a large number of echo data acquired by the electronic scanner on
SAFT method. The acquired echo data include more precise information because the acquired
ultrasonic waves are propagated through many paths within the inspection object.
3D image synthetic process by SAFT is as follows. In this case, a probe is 8 x 8 matrix array, whose
numbers are shown as from P1 to P64 in Fig. 1.
Data acquisition process
(a) Wide-angle ultrasonic waves are transmitted from P1, and its reflected echo is received by the
selected elements in advance. After the moment, the all received echo data are converted and saved as
digitized echo data in 3D image synthetic circuit in parallel.
(b) The above process is repeated from P1 transmission to P64 transmission.
(c) The parallel processor within the image synthesis circuit synthesizes 3D image within the 3D
imaging area from the digitized echo data.
3D image synthetic process (A defect is located at position A)
(a) The amplitude data, extracted from P1-P1 wave data according to a P1-A-P1 flight time T11, is
added to the image amplitude value in the mesh A.
(b) After the above process is repeated from a combination of P1-P2 wave data to P64-P64 wave data,
the echo peak data of the defect A are added to the mesh A, and it becomes high value as a result of
the process.
(c) On the contrary, image synthesis of the position without defect shown as the mesh B. The echo
data adding to this position must be a kind of random noise. So, they canceled each other and intensity
level of synthesized image in the mesh B must be small value.
(d) After finishing the above process to all meshes of the 3D imaging area, 3D image with good
resolution and S/N ratio can be synthesized.
Portable equipment “MatrixeyeTM
EX”
System outline
Initially this equipment had been developed as an application of vertical beam inspection for the in-
service inspection of CFRP made aircrafts. We focused to develop user-friendly operation and off-line
analysis using the saved imaging data. Then, we had added the angle beam function to this equipment.
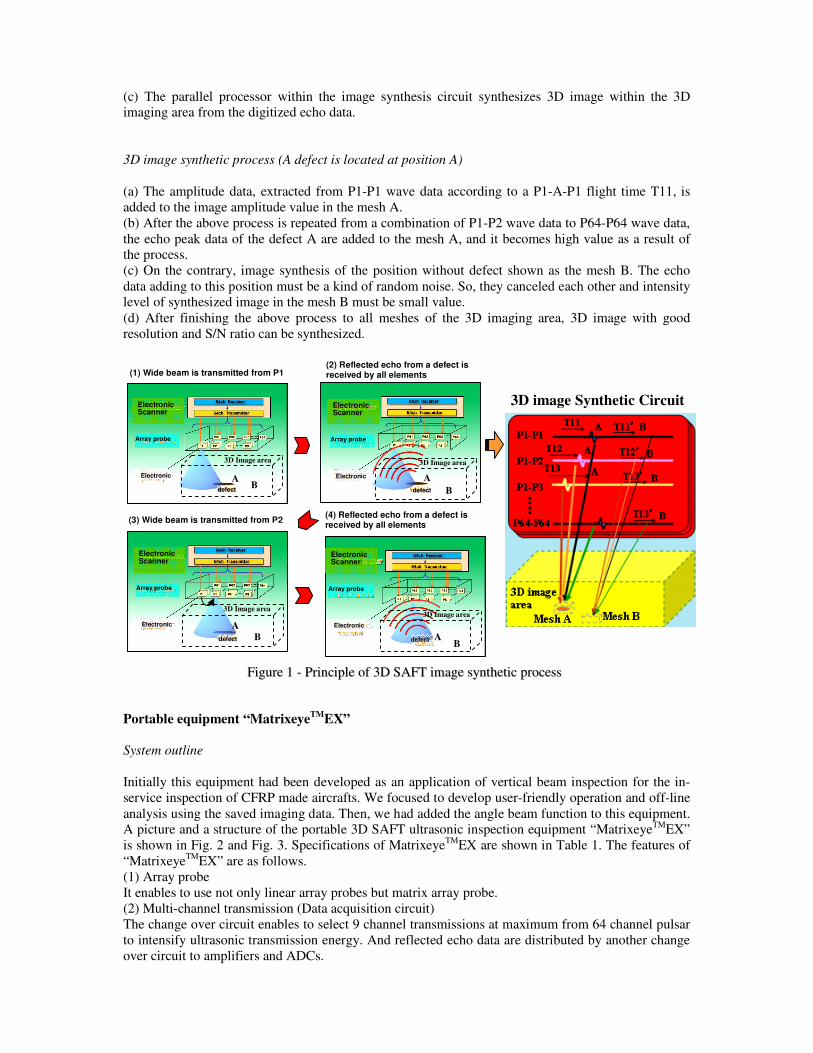
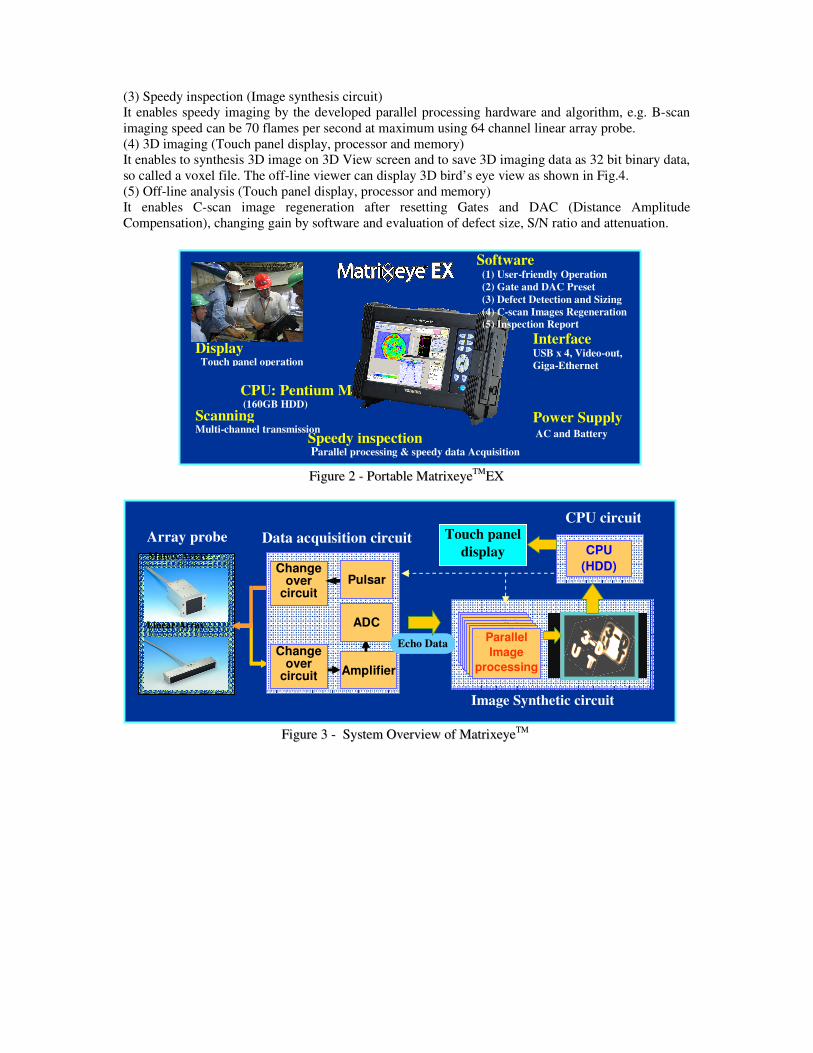
A picture and a structure of the portable 3D SAFT ultrasonic inspection equipment “MatrixeyeTMEX”
is shown in Fig. 2 and Fig. 3. Specifications of MatrixeyeTMEX are shown in Table 1. The features of
“MatrixeyeTM
EX” are as follows.
(1) Array probe
It enables to use not only linear array probes but matrix array probe.
(2) Multi-channel transmission (Data acquisition circuit)
The change over circuit enables to select 9 channel transmissions at maximum from 64 channel pulsar
to intensify ultrasonic transmission energy. And reflected echo data are distributed by another change
over circuit to amplifiers and ADCs.
(1) Wide beam is transmitted from P1 (2) Reflected echo from a defect is received by all elements
defect
Electronic
Array probe
Electronic Scanner
P1-P1 P1-P1 P1-P1
FFiigguurree 11 -- PPrriinncciippllee ooff 33DD SSAAFFTT iimmaaggee ssyynntthheettiicc pprroocceessss
(3) Wide beam is transmitted from P2 (4) Reflected echo from a defect is received by all elements
defect
Electronic
Array probe
Electronic Scanner
defect
Electronic
Array probe
Electronic Scanner
defect
Electronic
Array probe
Electronic Scanner
3D image Synthetic Circuit
A B
A
B
B A
A
B
3D Image area 3D Image area
3D Image area 3D Image area
(3) Speedy inspection (Image synthesis circuit)
It enables speedy imaging by the developed parallel processing hardware and algorithm, e.g. B-scan
imaging speed can be 70 flames per second at maximum using 64 channel linear array probe.
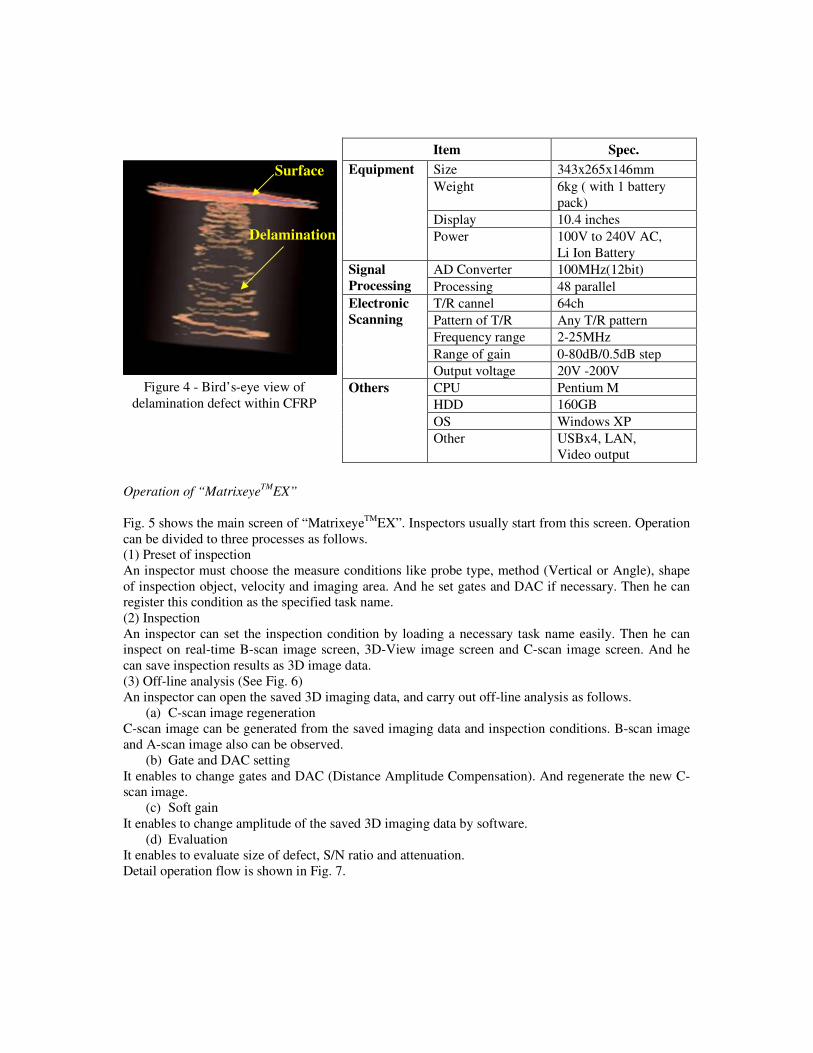
(4) 3D imaging (Touch panel display, processor and memory)
It enables to synthesis 3D image on 3D View screen and to save 3D imaging data as 32 bit binary data,
so called a voxel file. The off-line viewer can display 3D bird’s eye view as shown in Fig.4.
(5) Off-line analysis (Touch panel display, processor and memory)
It enables C-scan image regeneration after resetting Gates and DAC (Distance Amplitude
Compensation), changing gain by software and evaluation of defect size, S/N ratio and attenuation.
FFiigguurree 22 -- PPoorrttaabbllee MMaattrriixxeeyyeeTTMM
EEXX
Array probe
Matrix-Array
Image Synthetic circuit
parallel
processor 32 ⇒ 48
parallel processor 32 ⇒ 48
parallel processor 32 ⇒ 48
parallel processor 32 ⇒ 48
parallel processor 32 ⇒ 48
parallel processor 32 ⇒ 48
Parallel
Image
processing
Data acquisition circuit
Change over
circuit
Pulsar
Amplifier
Change over
circuit
ADC
Echo Data
Touch panel
display
Linear-Array
CPU circuit
CPU
(HDD)
CPU: Pentium M (160GB HDD)
Display Touch panel operation
Scanning Multi-channel transmission
Speedy inspection Parallel processing & speedy data Acquisition
Software (1) User-friendly Operation
(2) Gate and DAC Preset
(3) Defect Detection and Sizing
(4) C-scan Images Regeneration
(5) Inspection Report
Interface USB x 4, Video-out,
Giga-Ethernet
Power Supply AC and Battery
FFiigguurree 33 -- SSyysstteemm OOvveerrvviieeww ooff MMaattrriixxeeyyeeTTMM
Operation of “MatrixeyeTM
EX”
Fig. 5 shows the main screen of “MatrixeyeTMEX”. Inspectors usually start from this screen. Operation
can be divided to three processes as follows.
(1) Preset of inspection
An inspector must choose the measure conditions like probe type, method (Vertical or Angle), shape
of inspection object, velocity and imaging area. And he set gates and DAC if necessary. Then he can
register this condition as the specified task name.
(2) Inspection
An inspector can set the inspection condition by loading a necessary task name easily. Then he can
inspect on real-time B-scan image screen, 3D-View image screen and C-scan image screen. And he
can save inspection results as 3D image data.
(3) Off-line analysis (See Fig. 6)
An inspector can open the saved 3D imaging data, and carry out off-line analysis as follows.
(a) C-scan image regeneration
C-scan image can be generated from the saved imaging data and inspection conditions. B-scan image
and A-scan image also can be observed.
(b) Gate and DAC setting
It enables to change gates and DAC (Distance Amplitude Compensation). And regenerate the new C-
scan image.
(c) Soft gain
It enables to change amplitude of the saved 3D imaging data by software.
(d) Evaluation
It enables to evaluate size of defect, S/N ratio and attenuation.
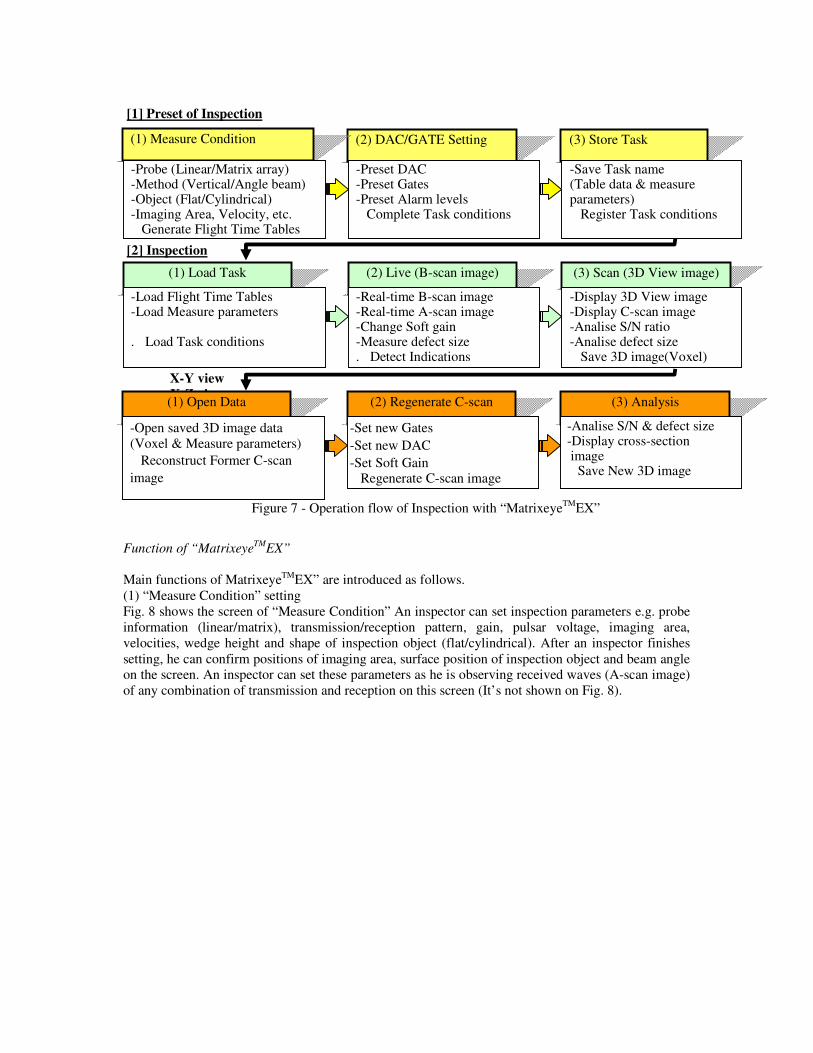
Detail operation flow is shown in Fig. 7.
Item Spec.
Size 343x265x146mm
Weight 6kg ( with 1 battery
pack)
Display 10.4 inches
Equipment
Power 100V to 240V AC,
Li Ion Battery
AD Converter 100MHz(12bit) Signal
Processing Processing 48 parallel
T/R cannel 64ch
Pattern of T/R Any T/R pattern
Frequency range 2-25MHz
Range of gain 0-80dB/0.5dB step
Electronic
Scanning
Output voltage 20V -200V
CPU Pentium M
HDD 160GB
OS Windows XP
Others
Other USBx4, LAN,
Video output
Figure 4 - Bird’s-eye view of
delamination defect within CFRP
Delamination
Surface
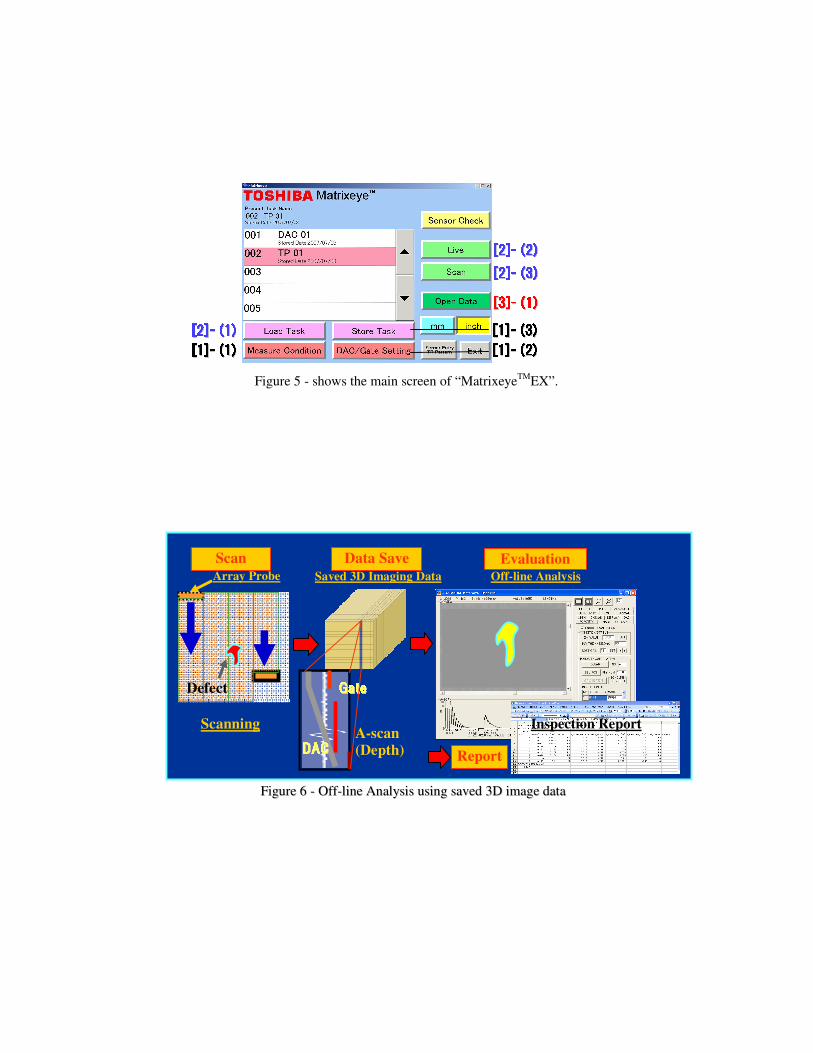
Figure 5 - shows the main screen of “MatrixeyeTM
EX”.
Saved 3D Imaging Data
A-scan
(Depth)
GGGGGGGGaaaaaaaatttttttteeeeeeee Data Save
Scan
Array Probe
Scanning
Defect
Evaluation Off-line Analysis
Report
Inspection Report
FFiigguurree 66 -- OOffff--lliinnee AAnnaallyyssiiss uussiinngg ssaavveedd 33DD iimmaaggee ddaattaa
DDDDDDDDAAAAAAAACCCCCCCC
[[[[[[[[11111111]]]]]]]]-------- ((((((((11111111)))))))) [[[[[[[[22222222]]]]]]]]-------- ((((((((11111111)))))))) [[[[[[[[11111111]]]]]]]]-------- ((((((((33333333)))))))) [[[[[[[[22222222]]]]]]]]-------- ((((((((22222222)))))))) [[[[[[[[22222222]]]]]]]]-------- ((((((((33333333)))))))) [[[[[[[[33333333]]]]]]]]-------- ((((((((11111111)))))))) [[[[[[[[11111111]]]]]]]]-------- ((((((((22222222))))))))
Function of “MatrixeyeTM
EX”
Main functions of MatrixeyeTMEX” are introduced as follows.
(1) “Measure Condition” setting
Fig. 8 shows the screen of “Measure Condition” An inspector can set inspection parameters e.g. probe
information (linear/matrix), transmission/reception pattern, gain, pulsar voltage, imaging area,
velocities, wedge height and shape of inspection object (flat/cylindrical). After an inspector finishes
setting, he can confirm positions of imaging area, surface position of inspection object and beam angle
on the screen. An inspector can set these parameters as he is observing received waves (A-scan image)
of any combination of transmission and reception on this screen (It’s not shown on Fig. 8).
(2) DAC/GATE Setting (1) Measure Condition
Figure 7 - Operation flow of Inspection with “MatrixeyeTM
EX”
[1] Preset of Inspection
-Preset DAC -Preset Gates -Preset Alarm levels �Complete Task conditions
(3) Store Task
-Probe (Linear/Matrix array) -Method (Vertical/Angle beam) -Object (Flat/Cylindrical) -Imaging Area, Velocity, etc. �Generate Flight Time Tables
-Save Task name (Table data & measure parameters) �Register Task conditions
[2] Inspection
(1) Load Task
-Load Flight Time Tables -Load Measure parameters .�Load Task conditions
(2) Live (B-scan image)
-Real-time B-scan image -Real-time A-scan image -Change Soft gain -Measure defect size .�Detect Indications
(3) Scan (3D View image)
-Display 3D View image -Display C-scan image -Analise S/N ratio -Analise defect size �Save 3D image(Voxel)
X-Y view X-Z view (1) Open Data
-Open saved 3D image data
(Voxel & Measure parameters)
�Reconstruct Former C-scan
image
(2) Regenerate C-scan
-Set new Gates
-Set new DAC
-Set Soft Gain �Regenerate C-scan image
(3) Analysis
-Analise S/N & defect size -Display cross-section image �Save New 3D image
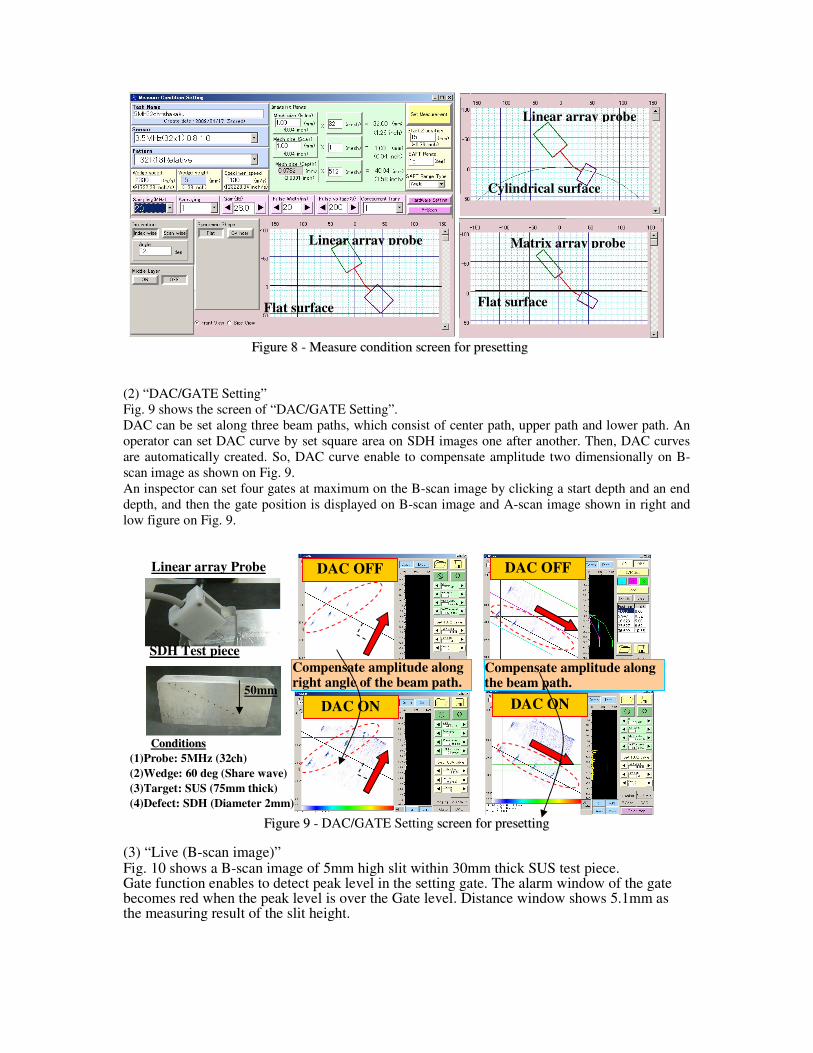
(2) “DAC/GATE Setting”
Fig. 9 shows the screen of “DAC/GATE Setting”.
DAC can be set along three beam paths, which consist of center path, upper path and lower path. An
operator can set DAC curve by set square area on SDH images one after another. Then, DAC curves
are automatically created. So, DAC curve enable to compensate amplitude two dimensionally on B-
scan image as shown on Fig. 9.
An inspector can set four gates at maximum on the B-scan image by clicking a start depth and an end
depth, and then the gate position is displayed on B-scan image and A-scan image shown in right and
low figure on Fig. 9.
(3) “Live (B-scan image)” Fig. 10 shows a B-scan image of 5mm high slit within 30mm thick SUS test piece. Gate function enables to detect peak level in the setting gate. The alarm window of the gate becomes red when the peak level is over the Gate level. Distance window shows 5.1mm as the measuring result of the slit height.
Linear array Probe
FFiigguurree 99 -- DAC/GATE Setting ssccrreeeenn ffoorr pprreesseettttiinngg
Compensate amplitude along right angle of the beam path.
DAC ON DAC ON
DAC OFF DAC OFF
Compensate amplitude along the beam path.
SDH Test piece
50mm
CCoonnddiittiioonnss
(1)Probe: 5MHz (32ch)
(2)Wedge: 60 deg (Share wave)
(3)Target: SUS (75mm thick)
(4)Defect: SDH (Diameter 2mm)
FFiigguurree 88 -- MMeeaassuurree ccoonnddiittiioonn ssccrreeeenn ffoorr pprreesseettttiinngg
Cylindrical surface
Linear array probe
Flat surface
Matrix array probe Linear array probe
Flat surface
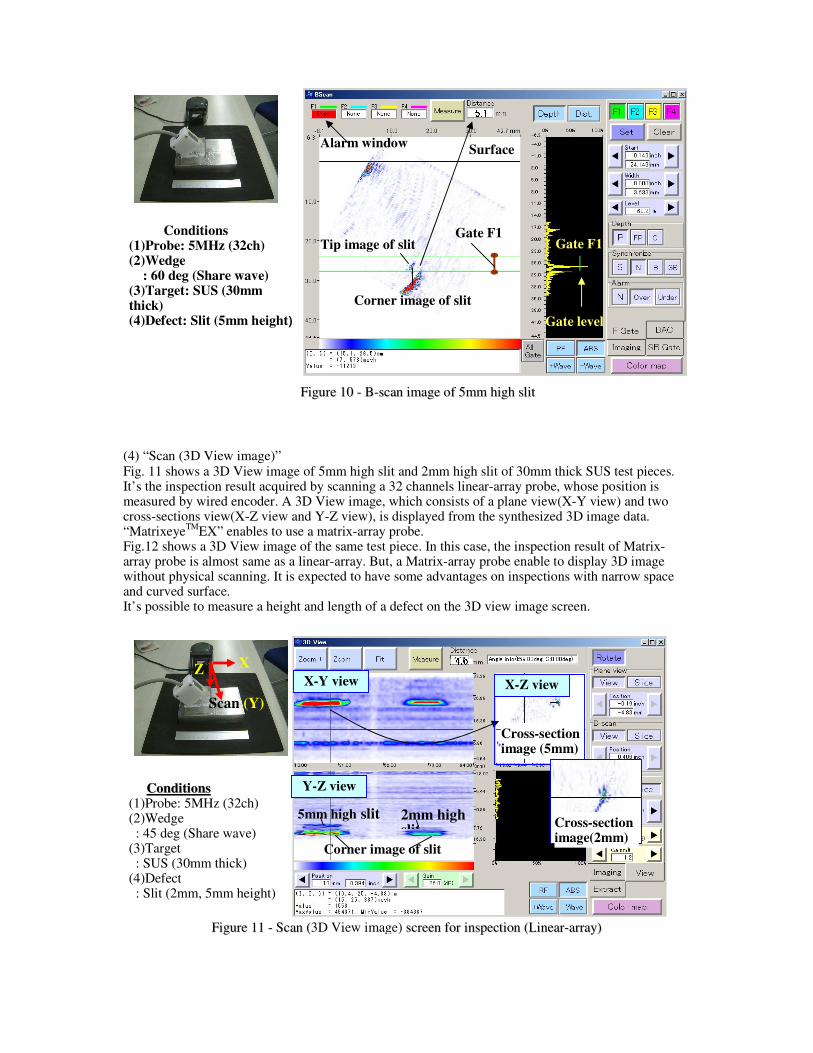
(4) “Scan (3D View image)” Fig. 11 shows a 3D View image of 5mm high slit and 2mm high slit of 30mm thick SUS test pieces. It’s the inspection result acquired by scanning a 32 channels linear-array probe, whose position is measured by wired encoder. A 3D View image, which consists of a plane view(X-Y view) and two cross-sections view(X-Z view and Y-Z view), is displayed from the synthesized 3D image data. “Matrixeye
TMEX” enables to use a matrix-array probe.
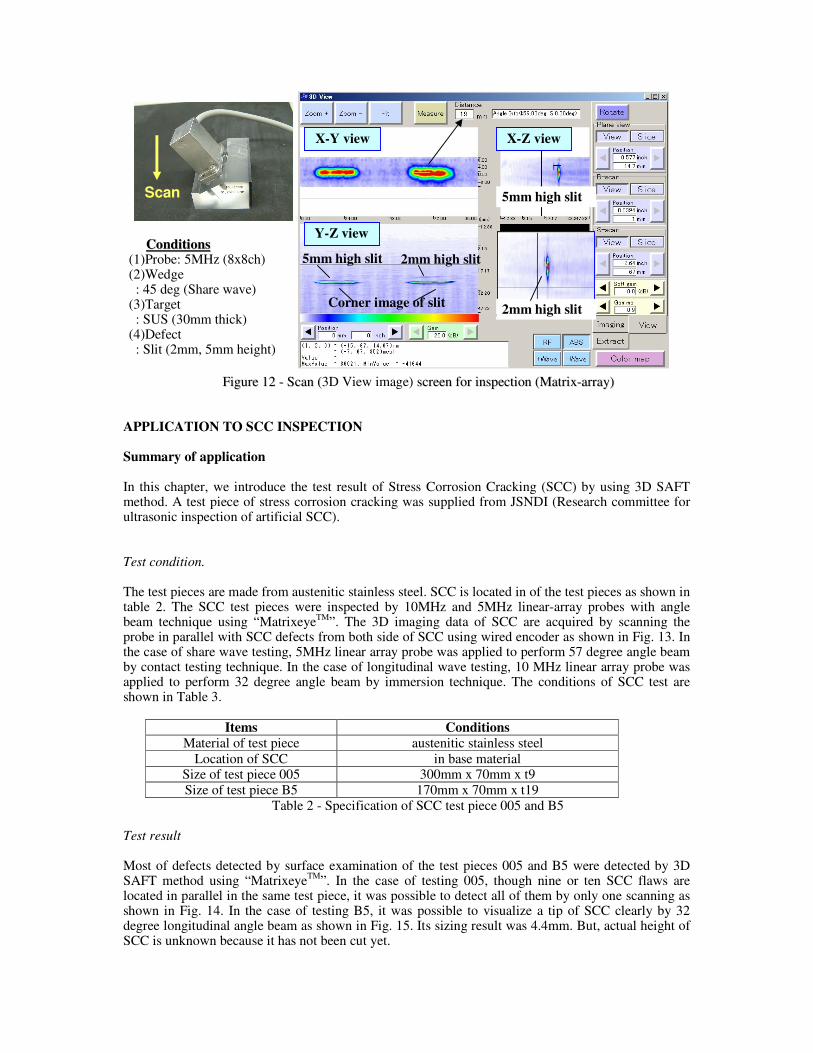
Fig.12 shows a 3D View image of the same test piece. In this case, the inspection result of Matrix-array probe is almost same as a linear-array. But, a Matrix-array probe enable to display 3D image without physical scanning. It is expected to have some advantages on inspections with narrow space and curved surface. It’s possible to measure a height and length of a defect on the 3D view image screen.
Corner image of slit
2mm high slit
Cross-section image (5mm)
5mm high slit Cross-section image(2mm)
FFiigguurree 1111 -- SSccaann ((3D View image) ssccrreeeenn ffoorr iinnssppeeccttiioonn ((LLiinneeaarr--aarrrraayy))
4.6 Scan (Y)
X Z X-Y view X-Z view
Y-Z view CCoonnddiittiioonnss (1)Probe: 5MHz (32ch) (2)Wedge : 45 deg (Share wave)
(3)Target : SUS (30mm thick)
(4)Defect : Slit (2mm, 5mm height)
Conditions (1)Probe: 5MHz (32ch) (2)Wedge : 60 deg (Share wave) (3)Target: SUS (30mm thick) (4)Defect: Slit (5mm height)
FFiigguurree 1100 -- BB--ssccaann iimmaaggee ooff 55mmmm hhiigghh sslliitt
Gate level
Gate F1 Tip image of slit
Corner image of slit
Alarm window Surface
Gate F1
5.1
APPLICATION TO SCC INSPECTION Summary of application In this chapter, we introduce the test result of Stress Corrosion Cracking (SCC) by using 3D SAFT method. A test piece of stress corrosion cracking was supplied from JSNDI (Research committee for ultrasonic inspection of artificial SCC). Test condition. The test pieces are made from austenitic stainless steel. SCC is located in of the test pieces as shown in table 2. The SCC test pieces were inspected by 10MHz and 5MHz linear-array probes with angle beam technique using “MatrixeyeTM”. The 3D imaging data of SCC are acquired by scanning the probe in parallel with SCC defects from both side of SCC using wired encoder as shown in Fig. 13. In the case of share wave testing, 5MHz linear array probe was applied to perform 57 degree angle beam by contact testing technique. In the case of longitudinal wave testing, 10 MHz linear array probe was applied to perform 32 degree angle beam by immersion technique. The conditions of SCC test are shown in Table 3.
Items Conditions
Material of test piece austenitic stainless steel
Location of SCC in base material Size of test piece 005 300mm x 70mm x t9
Size of test piece B5 170mm x 70mm x t19
Table 2 - Specification of SCC test piece 005 and B5
Test result Most of defects detected by surface examination of the test pieces 005 and B5 were detected by 3D SAFT method using “Matrixeye
TM”. In the case of testing 005, though nine or ten SCC flaws are
located in parallel in the same test piece, it was possible to detect all of them by only one scanning as shown in Fig. 14. In the case of testing B5, it was possible to visualize a tip of SCC clearly by 32 degree longitudinal angle beam as shown in Fig. 15. Its sizing result was 4.4mm. But, actual height of SCC is unknown because it has not been cut yet.
CCoonnddiittiioonnss (1)Probe: 5MHz (8x8ch) (2)Wedge : 45 deg (Share wave)
(3)Target : SUS (30mm thick)
(4)Defect : Slit (2mm, 5mm height)
Corner image of slit
5mm high slit Scan
FFiigguurree 1122 -- SSccaann ((3D View image) ssccrreeeenn ffoorr iinnssppeeccttiioonn ((MMaattrriixx--aarrrraayy))
X-Y view X-Z view
2mm high slit 5mm high slit
Y-Z view
2mm high slit
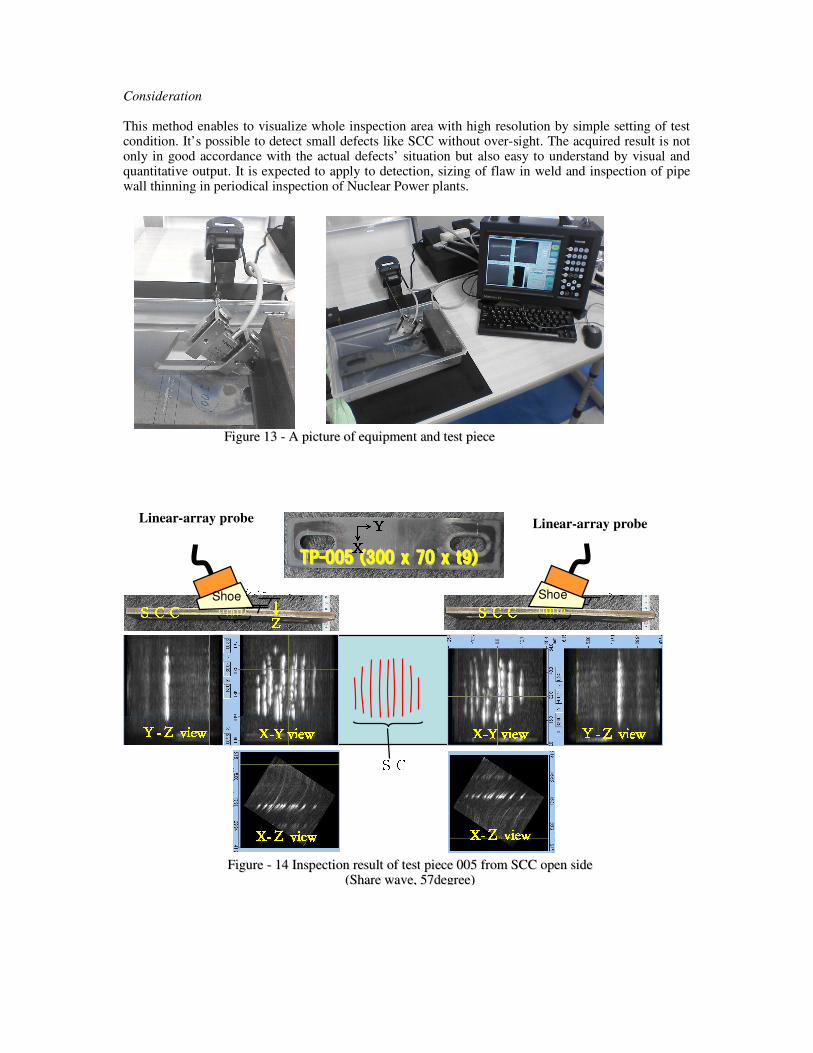
Consideration This method enables to visualize whole inspection area with high resolution by simple setting of test condition. It’s possible to detect small defects like SCC without over-sight. The acquired result is not only in good accordance with the actual defects’ situation but also easy to understand by visual and quantitative output. It is expected to apply to detection, sizing of flaw in weld and inspection of pipe wall thinning in periodical inspection of Nuclear Power plants.
SCシュSCCSCCSCCSCC
シュSCCSCCSCCSCC
FFiigguurree -- 1144 IInnssppeeccttiioonn rreessuulltt ooff tteesstt ppiieeccee 000055 ffrroomm SSCCCC ooppeenn ssiiddee
((SShhaarree wwaavvee,, 5577ddeeggrreeee))
TTTTTTTTPPPPPPPP--------000000000000000055555555 ((((((((333333330000000000000000 xxxxxxxx 7777777700000000 xxxxxxxx tttttttt99999999))))))))
XXXX----YYYY view view view view
XXXX----ZZZZ view view view view
YYYY----ZZZZ view view view view
シュー
↓↓↓↓ XXXX
→→→→YYYY
↓↓↓↓ ZZZZ
Linear-array probe Linear-array probe
Shoe Shoe
XXXX----YYYY view view view view
XXXX----ZZZZ view view view view
YYYY----ZZZZ view view view view
FFiigguurree 1133 -- AA ppiiccttuurree ooff eeqquuiippmmeenntt aanndd tteesstt ppiieeccee

Items Linear-array angle bean inspection
Testing method Share wave
/Contact testing Longitudinal wave / Contact testing
Couplant Water (Velocity : 1,480 m/s �
Frequency of probe 5MHz 10MHz
Element of probe 1×64 (1.0mm pitch) 1×64 (1.0mmpitch)
Sampling frequency 20 MHz 40MH�
Wedge Polystyrene( Velocity:2,330 m/s�
Velocity of base material 3100 m/s 5700 m/s
X: 32mm 32mm
Y: 1mm (Scanning wise) Imaging area
Z: 40mm 18mm
Beam angle(Calculated) 57 degree 32 degree
Path length to center 19mm, 33mm, 66mm 16mm
Gain 30 dB 20dB
Averaging 1
T/R pattern Tranmission64, Reception15(relative)
SAFT range 10 degree
Scan pitch 1 mm
Table 3 - The conditions of SCC test
SCCSCCSCCSCC
SCCSCCSCCSCC SCCSCCSCCSCC
Linear-array probe
FFiigguurree 1155 -- IInnssppeeccttiioonn rreessuulltt ooff tteesstt ppiieeccee BB55 ffrroomm SSCCCC ooppeenn ssiiddee
((LLoonnggiittuuddiinnaall wwaavvee,, 3322 ddeeggrreeee))
TTTTTTTTPPPPPPPP--------BBBBBBBB55555555 ((((((((111111117777777700000000 xxxxxxxx 7777777700000000 xxxxxxxx
tttttttt1111111199999999))))))))
XXXX----YYYY view view view view XXXX----ZZZZ view view view view
YYYY----ZZZZ view view view view
↓↓↓↓ XXXX
→→→→YYYY
↓↓↓↓ ZZZZ XXXX----YYYY view view view view XXXX----YYYY view view view view YYYY----ZZZZ view view view view
XXXX----ZZZZ view view view view SCCSCCSCCSCC HeightHeightHeightHeight
Shoe Shoe
Linear-array probe
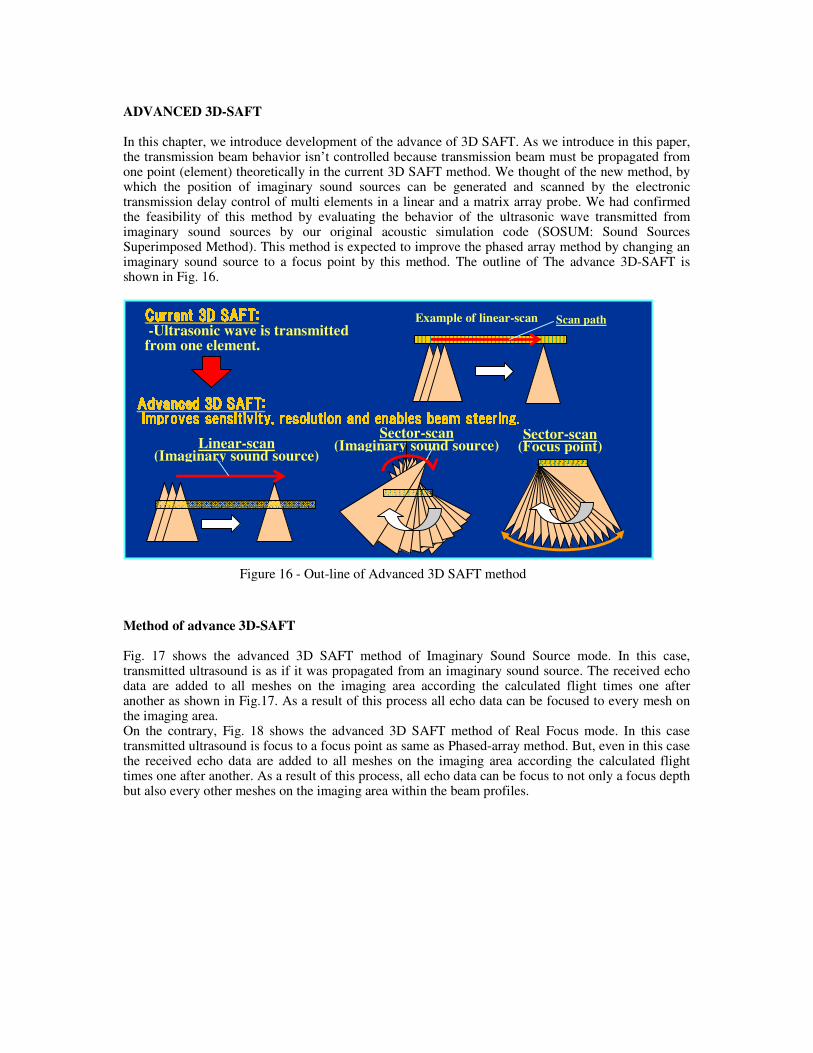
ADVANCED 3D-SAFT In this chapter, we introduce development of the advance of 3D SAFT. As we introduce in this paper, the transmission beam behavior isn’t controlled because transmission beam must be propagated from one point (element) theoretically in the current 3D SAFT method. We thought of the new method, by which the position of imaginary sound sources can be generated and scanned by the electronic transmission delay control of multi elements in a linear and a matrix array probe. We had confirmed the feasibility of this method by evaluating the behavior of the ultrasonic wave transmitted from imaginary sound sources by our original acoustic simulation code (SOSUM: Sound Sources Superimposed Method). This method is expected to improve the phased array method by changing an imaginary sound source to a focus point by this method. The outline of The advance 3D-SAFT is shown in Fig. 16.
Method of advance 3D-SAFT Fig. 17 shows the advanced 3D SAFT method of Imaginary Sound Source mode. In this case, transmitted ultrasound is as if it was propagated from an imaginary sound source. The received echo data are added to all meshes on the imaging area according the calculated flight times one after another as shown in Fig.17. As a result of this process all echo data can be focused to every mesh on the imaging area. On the contrary, Fig. 18 shows the advanced 3D SAFT method of Real Focus mode. In this case transmitted ultrasound is focus to a focus point as same as Phased-array method. But, even in this case the received echo data are added to all meshes on the imaging area according the calculated flight times one after another. As a result of this process, all echo data can be focus to not only a focus depth but also every other meshes on the imaging area within the beam profiles.
CCCCCCCCuuuuuuuurrrrrrrrrrrrrrrreeeeeeeennnnnnnntttttttt 33333333DDDDDDDD SSSSSSSSAAAAAAAAFFFFFFFFTTTTTTTT:::::::: -Ultrasonic wave is transmitted from one element.
Example of linear-scan Scan path
AAAAAAAAddddddddvvvvvvvvaaaaaaaannnnnnnncccccccceeeeeeeedddddddd 33333333DDDDDDDD SSSSSSSSAAAAAAAAFFFFFFFFTTTTTTTT:::::::: Improves sensitivity, resolution and enables beam steering. Improves sensitivity, resolution and enables beam steering. Improves sensitivity, resolution and enables beam steering. Improves sensitivity, resolution and enables beam steering. Linear-scan
(Imaginary sound source)
Sector-scan (Imaginary sound source)
Sector-scan (Focus point)
Figure 16 - Out-line of Advanced 3D SAFT method
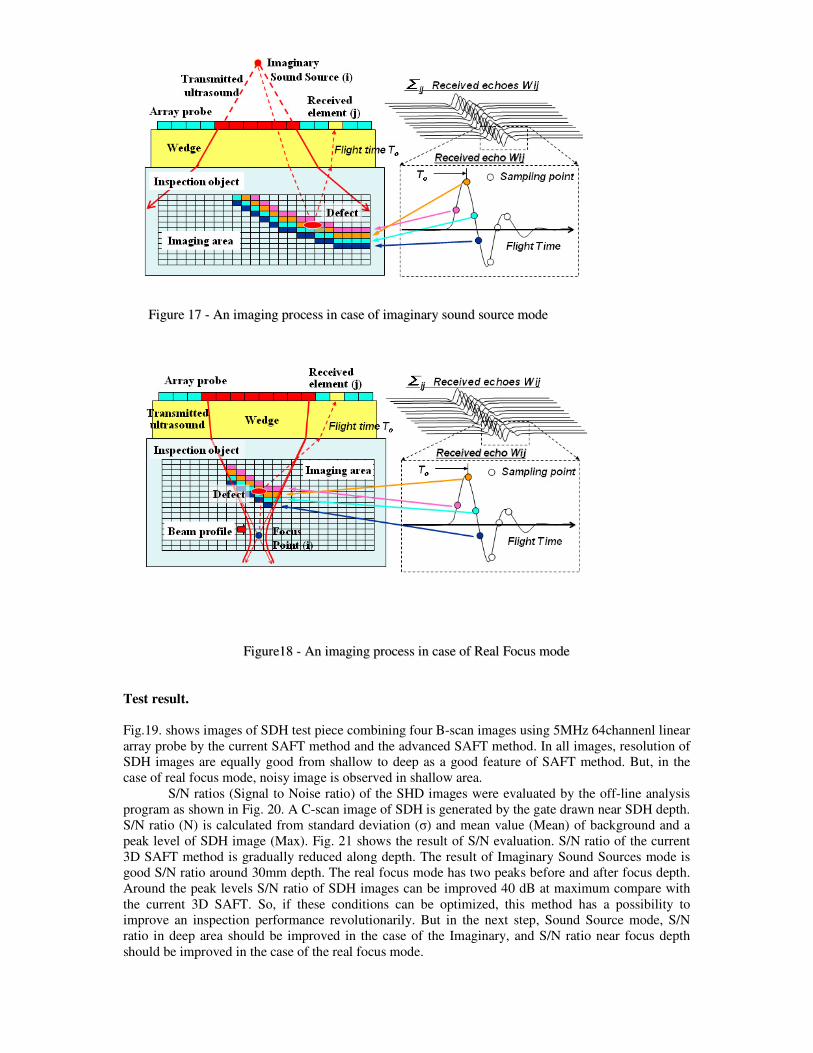
FFiigguurree1188 -- AAnn iimmaaggiinngg pprroocceessss iinn ccaassee ooff RReeaall FFooccuuss mmooddee
Test result.
Fig.19. shows images of SDH test piece combining four B-scan images using 5MHz 64channenl linear
array probe by the current SAFT method and the advanced SAFT method. In all images, resolution of
SDH images are equally good from shallow to deep as a good feature of SAFT method. But, in the
case of real focus mode, noisy image is observed in shallow area.
S/N ratios (Signal to Noise ratio) of the SHD images were evaluated by the off-line analysis
program as shown in Fig. 20. A C-scan image of SDH is generated by the gate drawn near SDH depth.
S/N ratio (N) is calculated from standard deviation (σ) and mean value (Mean) of background and a
peak level of SDH image (Max). Fig. 21 shows the result of S/N evaluation. S/N ratio of the current
3D SAFT method is gradually reduced along depth. The result of Imaginary Sound Sources mode is
good S/N ratio around 30mm depth. The real focus mode has two peaks before and after focus depth.
Around the peak levels S/N ratio of SDH images can be improved 40 dB at maximum compare with
the current 3D SAFT. So, if these conditions can be optimized, this method has a possibility to
improve an inspection performance revolutionarily. But in the next step, Sound Source mode, S/N
ratio in deep area should be improved in the case of the Imaginary, and S/N ratio near focus depth
should be improved in the case of the real focus mode.
FFiigguurree 1177 -- AAnn iimmaaggiinngg pprroocceessss iinn ccaassee ooff iimmaaggiinnaarryy ssoouunndd ssoouurrccee mmooddee

FFiigguurree 2211 -- AAddvvaanncceedd 33DD SSAAFFTT bbaassiicc tteesstt rreessuulltt
Background SDH image
Gate-1
C-scan image generated by gate-1
Amplitude of image
Mean
σ (STDV)
Max
= N x σ+ Mean
Background
SDH
Image
FFiigguurree 2200 -- SS//NN eevvaalluuaattiioonn mmeetthhoodd
Figure 19 - SDH image synthesized by 3D SAFT method
REFERENCES
1) Hirokazu Karasawa, Mamoru Izumi, Takehiko Suzuki, Satoshi Nagai, Masaaki Tamura,
Shyuuichi Fujimori, “Development of under sodium 3D visual inspection technique by using matrix-array ultrasonic transducer” Journal of Nuclear Science and Technology, vol.37, No.9. Pp.769-779, September 2000.
2) Abe Motohisa, Hirokazu Karasawa, “Matrixeye Portable 3D Ultrasonic Inspection System” , TOSHIBA REVIEW Vol.60, No.4, 2005, PUBLISHED by TOSHIBA CORPORATION.
3) Shin Matsumoto, Hirokazu Karasawa, Takahiro Ikeda, “Three-dimensional Synthetic Aperture Focusing Technique(3D-SAFT) and Applications”, Automotive Engineering by JSAE, Vol.62, No.7, 2008
4) Takahiro.Ikeda, Hirokazu.Karasawa, Shin.Matsumoto, Shinobu.Satonaka, Chihiro Iwamoto, “Development of new inspection technique for spot welds using a matrix array ultrasonic probe”, IIW Doc.No.III-1343-05