3d web visualization toolcs-courses.mines.edu/csci370/fs2015/finrpt_newmont.pdf · export survey...
TRANSCRIPT
3D Web Visualization Tool
Team Members: Chris Butler
Alan VanderMeer Joseph Stockwell Mason Traylor
Client:
Brian Krzys
June 16, 2015

Introduction The Denver based mining company, Newmont, is one of the largest producers of gold in
the world. Part of their workflow entails analyzing potential mining properties by using desktop software suites. This software takes their survey hole drilling data and helps them to visualize underground ore distributions. However, these suites require expensive hardware to run, take long times to load, and have a steep learning curve. Newmont is investigating a web application to streamline the basic visualization so that anyone can view the ore distributions on a desktop or laptop device, in a major browser, without needing flash. This web application needs to provide a “quick look” visualization of the ore distributions for geologists and investors to streamline their workflow. Our team is working to provide the Newmont corporation with a way to visualize drilled core samples of various minerals in 3D.
Requirements
Functional Requirements
The web application needs to create a visualization of the survey lines, sample intervals, and terrain of the area with applicable user interface controls.
● 3D Visualization ○ Survey lines (core sample)
■ Display where survey was done ■ Draw sample intervals on these
○ Sample intervals ■ Segments for mineral type (gold, silver, etc) ■ Display one mineral at a time ■ Filter by concentration (grams per ton)
○ Terrain ■ Wireframe terrain mesh ■ From geological data provided by Newmont
○ Bounding box around area ■ Axis with distance measurement
● Navigation ○ Rotate ○ Zoom
■ don’t scroll the page ○ Pan ○ JS Orbital View library for mouse control
● UI ○ Concentration filter
■ slide bar ○ Ore selector
1

■ One/multiple ores displayed at once ○ Buttons for view navigation ○ “Quick Facts” about survey area
■ Property name ■ Location ■ Principal commodity ■ Hole count ■ “X meters of drilling shown”
Optional Functional Requirements ● 2D visualization
○ “Slice” view of side ● Export survey location in Google Earth kml file ● Tooltips on mouseover ● Stratus lines ● Variable concentration visualization
○ Thickness ○ Transparency ○ Color
NonFunctional Requirements ● GitHub
○ Public code ○ Documentation in a wiki
● Support latest version of desktop/laptop browsers: ○ Chrome ○ Firefox ○ Internet Explorer ○ Safari
● Mobile support is nice but should not take a priority ● Read survey data from JSON files
○ Provided by Newmont ● Does not rely on Flash
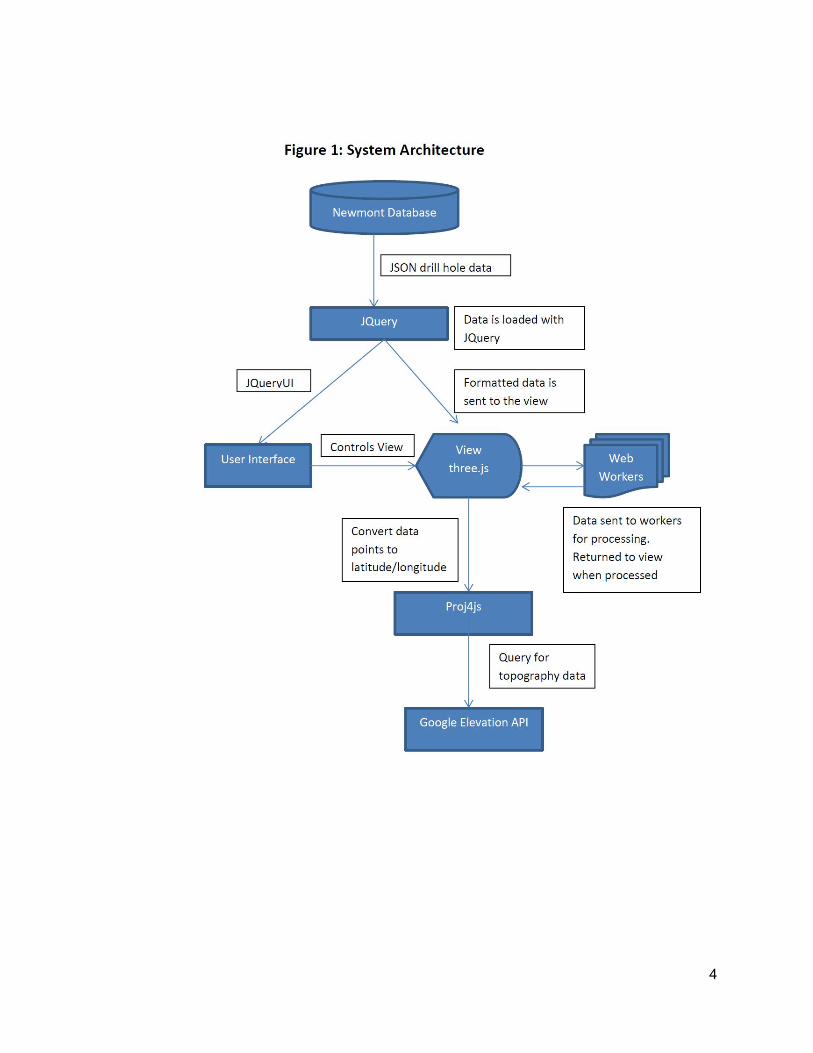
System Architecture 1. Newmont gathers data from drill sites and use their own internal and open source software to translate it into JSON which is easily loaded by our program. The data in this file includes:
● Coordinates of the drill site ● Local coordinates of the individual survey holes, including the downhole locations (The surveys
are often not straight holes)
2
● Types of minerals found in each of the holes ● Concentrations of given minerals at each depth
2. Almost everything in the application depends on data being loaded, so the first thing the application does when the page starts is to load the JSON data. The application uses a synchronous ajax call to retrieve the JSON file(s) from the Newmont servers. This data is then parsed to make a minerals object for ease of use in our program. 3. The application represents drill survey data using lines and mineral data using cylinders. These are both easy to render with three.js. The cylinders are drawn on a coordinate plane with the axis scale labeled. A topographical map of the area is overlayed. This data will be obtained by querying an external database. 4. Once the view has been added to the screen, the application overlays an interface to help the user interact with the data. Individual components of the interface include:
● Controls to allow the user to rotate and zoom on the data ● Buttons that let the user control whether the terrain mesh or survey holes are visible ● A file menu to let the user select other drill sites to view ● An area that allows the user to change the type of mineral they are viewing ● A slider that changes the cutoff concentration of the given material, in case they are only
interested in large deposits.
3
4
Technical Design
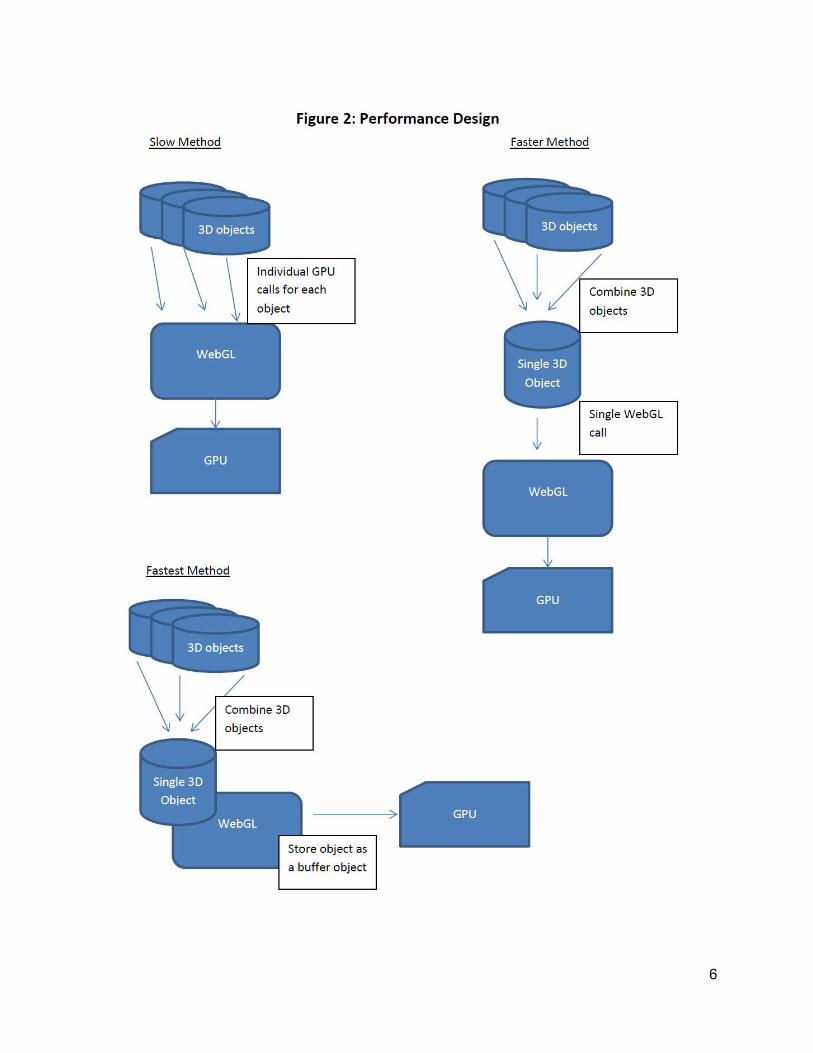
Performance The most challenging feature of our implementation was performance. Our initial design
worked well with smaller data sets. This design was simply added a number of distinct objects to the scene. However, once we tried loading very large data sets it became apparent that this implementation would need to change. This issue is a result of a limitation of WebGL. JavaScript calls to WebGL are expensive and adding the objects individually caused the program to lag or hang once too many objects were on screen. We rectified this issue by combining all of our objects into a single mesh. This implementation caused longer initial loading times but made the program much more responsive once loading was completed. We were able to further improve the performance by using a Buffer Object. A Buffer Object stores all of its data within buffers which greatly reduces the cost of sending data to the GPU (Figure 2: Performance Design).
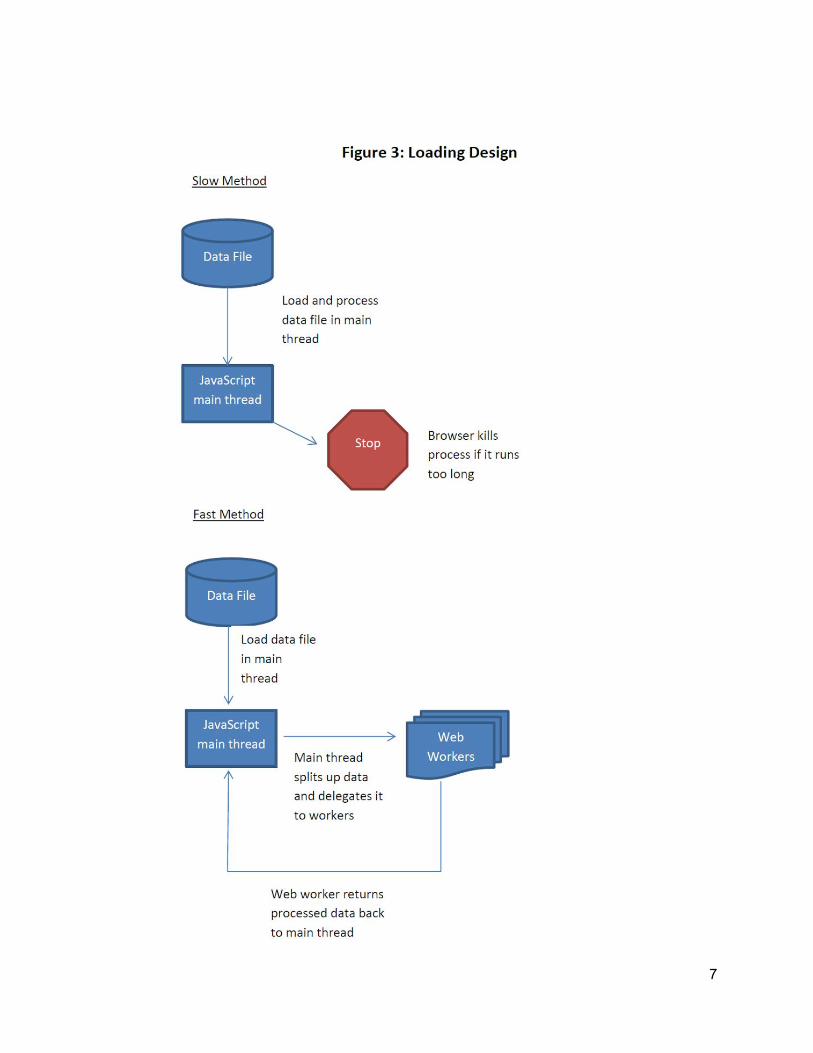
Loading Running very resource intensive scripts in the main thread is ill advised. All modern web
browsers will kill a script if it runs for more than an arbitrary time limit. This caused us issues with larger data sets because our script would be killed before it could complete execution. We solved this problem using web workers. Web workers are an HTML5 feature which supports multithreading. Because of this, the browser will not kill the script no matter how long it takes to run. They also give the advantage of not making the web page appear unresponsive while the script is running. Web workers can take advantage of multicore CPUs and as a result the program loads faster (Figure 3: Loading Design).
5
6
7
Design and Implementation Decisions
● Three.js ○ Our first design decision was which library to use to display our data. Our only
requirements being that it could not use Flash and it had to be supported by all modern browsers. There are many libraries that fulfill these requirements but we chose Three.js for a number of reasons. Three.js is a JavaScript library that uses WebGL to display 3D content in a web browser. We chose to use this library because it has a strong community and much of our needed functionality is already implemented, including cameras, lighting, and controls. It runs in all browsers which support WebGL which includes all major modern browsers as well as some mobile browsers. Three.js is also very easy to use and has extensive documentation.
● jQuery ○ jQuery is a JavaScript library that includes much of our needed functionality. It
has methods to load a JSON file and to easily create buttons and menus. This makes it simple for us to create a full featured user interface.
● The Google Elevation API ○ Our project is required to have a topographical overlay of the area. However, our
client was not able to provide topographical data in the provided JSON file so we had to find a third party source to retrieve this data. Google provides a basic elevation API which allows us to query Google’s servers with a latitude and longitude and receive a JSON file with the elevation at that point.
● Web Workers ○ When we began having performance issues on loading very large data sets the
possibility of threading was considered. Unfortunately, JavaScript was not designed to support threading and Google Chrome is currently the only browser that supports multithreading. This is an issue because web browsers will assume a script is unresponsive if it takes too long to run and kill it before it can complete execution. The browser will also be unresponsive until the script completes execution. This problem can be avoided in JavaScript using HTML5 web workers. Web workers allow the webpage to still be responsive while the script is running and prevents the script from being killed before execution is completed.
8
Lessons Learned ● Scaling is an issue when it comes to programming. What works well on a small dataset may work
poorly or not at all for a larger dataset. We ran into this issue when using three.js to render a large number of cylinders. Our method for displaying approximately 1000 worked fine but once we got into the hundreds of thousands our program was unable to handle the data set.
● Although threading significantly increased the responsiveness and speed of our program, it also greatly increased the complexity of the code and lead to many issues getting everything to work together properly.
● While JavaScript may look like Java syntactically, it behaves very differently. ● Running very resource intensive scripts in the main thread is a bad idea. Browsers will consider
scripts unresponsive and kill them if they run too long.
Results All nonoptional requirements of our project were met. Our program successfully takes a data file
in JSON format and displays the survey data in a web browser. The program also loads topographical data of the area and displays it over the survey holes. The user can control the perspective from which the data is being rendered, the types minerals that are being displayed, as well as filter such minerals by a concentration threshold. The user can also hover over the data being displayed to the screen and see a tooltip information about the mineral interval.
Testing The mineral viewer was tested on all major modern web browsers (Firefox version 38,
Chrome version 43, Safari), as well as all major operating systems (Windows, Mac, Linux). The mineral viewer gave acceptable performance in all of these tests although some operating system/browser configurations performed significantly better than others. We monitored the frames per second each browser produced and changed our implementation as needed when performance issues were encountered.
Future Work We were unable to meet many of our optional requirements, most notably the 2D sectional view.
Implementing this 2D sectional view would be an interesting way to expand the functionality of the program. Performance was our main issue when viewing large data sets and it may be possible to improve the performance further. Another feature which might be useful is varying the opacity of the cylinders based on the mineral concentration.
9
Appendices
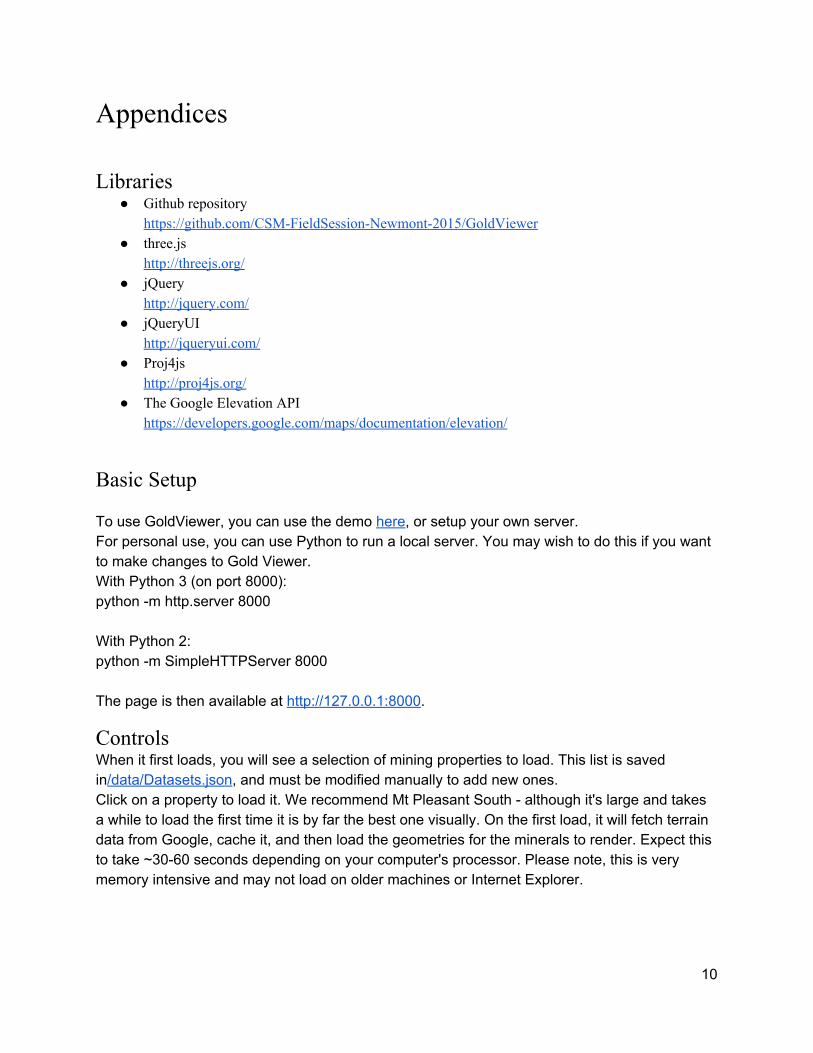
Libraries ● Github repository
https://github.com/CSMFieldSessionNewmont2015/GoldViewer ● three.js
http://threejs.org/ ● jQuery
http://jquery.com/ ● jQueryUI
http://jqueryui.com/ ● Proj4js
http://proj4js.org/ ● The Google Elevation API
https://developers.google.com/maps/documentation/elevation/
Basic Setup To use GoldViewer, you can use the demo here, or setup your own server. For personal use, you can use Python to run a local server. You may wish to do this if you want to make changes to Gold Viewer. With Python 3 (on port 8000): python m http.server 8000 With Python 2: python m SimpleHTTPServer 8000 The page is then available at http://127.0.0.1:8000.
Controls When it first loads, you will see a selection of mining properties to load. This list is saved in/data/Datasets.json, and must be modified manually to add new ones. Click on a property to load it. We recommend Mt Pleasant South although it's large and takes a while to load the first time it is by far the best one visually. On the first load, it will fetch terrain data from Google, cache it, and then load the geometries for the minerals to render. Expect this to take ~3060 seconds depending on your computer's processor. Please note, this is very memory intensive and may not load on older machines or Internet Explorer.
10
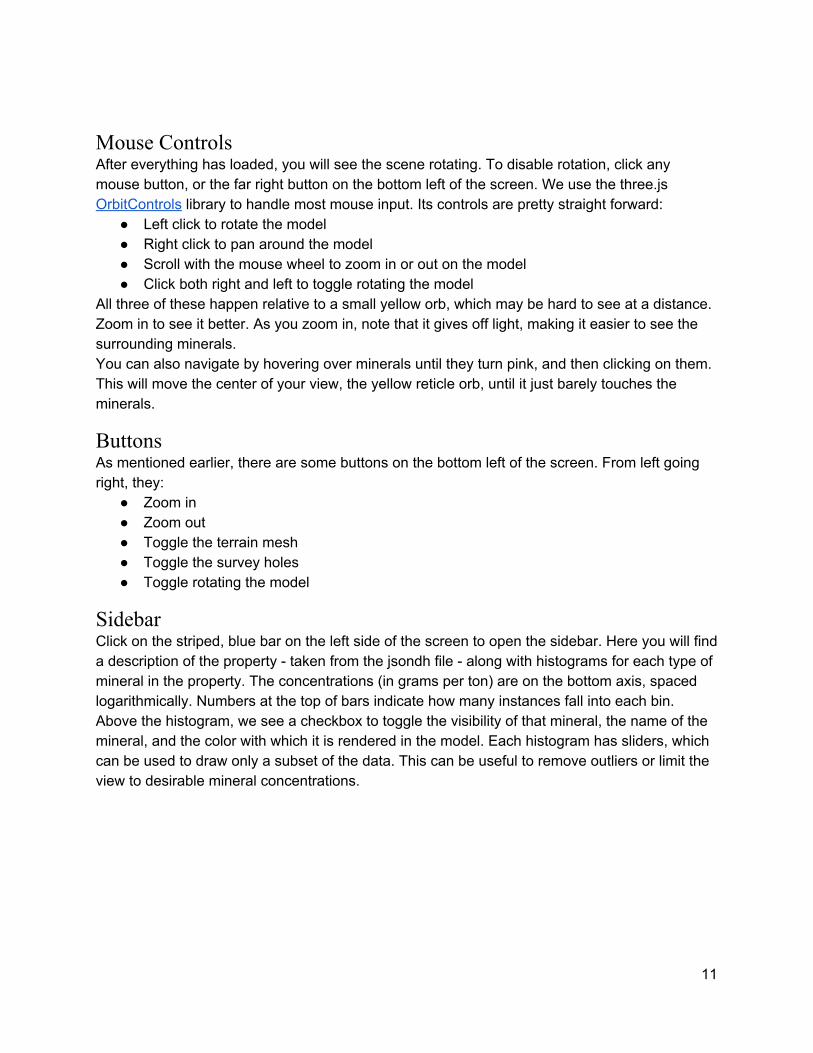
Mouse Controls After everything has loaded, you will see the scene rotating. To disable rotation, click any mouse button, or the far right button on the bottom left of the screen. We use the three.js OrbitControls library to handle most mouse input. Its controls are pretty straight forward:
● Left click to rotate the model ● Right click to pan around the model ● Scroll with the mouse wheel to zoom in or out on the model ● Click both right and left to toggle rotating the model
All three of these happen relative to a small yellow orb, which may be hard to see at a distance. Zoom in to see it better. As you zoom in, note that it gives off light, making it easier to see the surrounding minerals. You can also navigate by hovering over minerals until they turn pink, and then clicking on them. This will move the center of your view, the yellow reticle orb, until it just barely touches the minerals.
Buttons As mentioned earlier, there are some buttons on the bottom left of the screen. From left going right, they:
● Zoom in ● Zoom out ● Toggle the terrain mesh ● Toggle the survey holes ● Toggle rotating the model
Sidebar Click on the striped, blue bar on the left side of the screen to open the sidebar. Here you will find a description of the property taken from the jsondh file along with histograms for each type of mineral in the property. The concentrations (in grams per ton) are on the bottom axis, spaced logarithmically. Numbers at the top of bars indicate how many instances fall into each bin. Above the histogram, we see a checkbox to toggle the visibility of that mineral, the name of the mineral, and the color with which it is rendered in the model. Each histogram has sliders, which can be used to draw only a subset of the data. This can be useful to remove outliers or limit the view to desirable mineral concentrations.
11