3pl pricing trends and practices - chainalytics
TRANSCRIPT

3PL Pricing Trends and Practices
Dr. Chris Caplice - MIT Matthew Harding – Chainalytics
October 3, 2011
50.0
60.0
70.0
80.0
90.0
100.0
110.0
1980198219841986198819901992199419961998200020022004200620082010
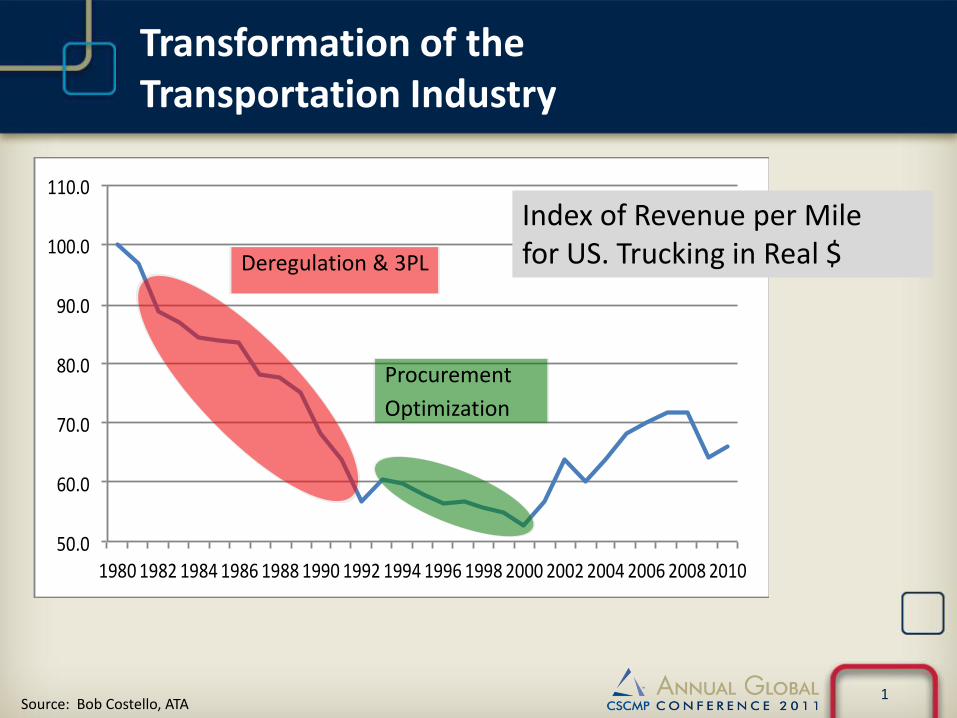
Index of Revenue per Mile for US. Trucking in Real $ Deregulation & 3PL
Procurement
Optimization
Source: Bob Costello, ATA 1
Transformation of the Transportation Industry

Transformation of the Transportation Industry
“We’ve moved from being a trucking company that has technology to basically a technology company that just happens to
have trucks,”
Scott Davis, CEO UPS

Transformation of the Transportation Industry
• Evolution of Critical Skills Required for 3PLs
– Operational Expertise
• Expected for all 3PLs today
• Essentially the price of entry
– Analytical Expertise
• Serves as a competitive differentiator
• Allows for de-commoditization of services
• Provides opportunity for greater margins
3

Why are 3PLs different?
• 3PLs have a unique view into the market
S1
C1
C4
C3
C2
S2
Each shipper has a limited view of only those carriers that they work with and they only see how
they work with them!
Each carrier has a limited view of only those shippers that they work with and how they work with
them!
3PL
3PLs are uniquely positioned between shippers and carriers.
4

Rate “Trough” 2009-2010
Fuel Shock 2010-2011
Note that the line haul rates are still below 2006 levels!
1st Level of Analysis: Historical Rates
5

1st Level of Analysis: Historical Rates
$1.390
$1.400
$1.410
$1.420
$1.430
$1.440
$1.450
$1.460
$1.470
$1.480
$1.490
$1.500
$1.510
$1.520
$1.530
$1.540
Oct-06
Jan-07
Apr-07
Jul-0
7
Oct-07
Jan-08
Apr-08
Jul-0
8
Oct-08
Jan-09
Apr-09
Jul-0
9
Oct-09
Jan-10
Apr-10
Jul-1
0
Oct-10
Jan-11
Apr-11
CostperM
ile
LinehaulCostPerMileforLHDV
LinehaulCPM
6

• Objective: – Develop an estimate of the “contract market” cost per load for
truckload transportation for any mode, lane, and condition.
• Technique: – Collect a large set of transactional cost data from multiple
companies
– Harmonize and standardize the data set
– Estimate the ‘best-fit’ line between all of the observations using regression
– Isolate the impact on CPL for individual factors (distance, equipment, etc.)
• Output: – Snapshot comparison of each firm’s lanes to the “contract
market”
– Tool to estimate ‘contract market” rates for new lanes
2nd Level of Analysis: Econometric Models

• Example, portion of the current Longhaul Dry Van model: (“All In” rates with fuel @ $3.00 per gallon)
CPL = $722 + $1.34 (Distance) + $200 / (AnnualCorridorVolume) + $64 (MultiStopFlag) . . .
• Two unique benefits of this approach – Ability to isolate the impact of individual factors
– Ability to quantify the regional effect at a very detailed level
2nd Level of Analysis: Econometric Models
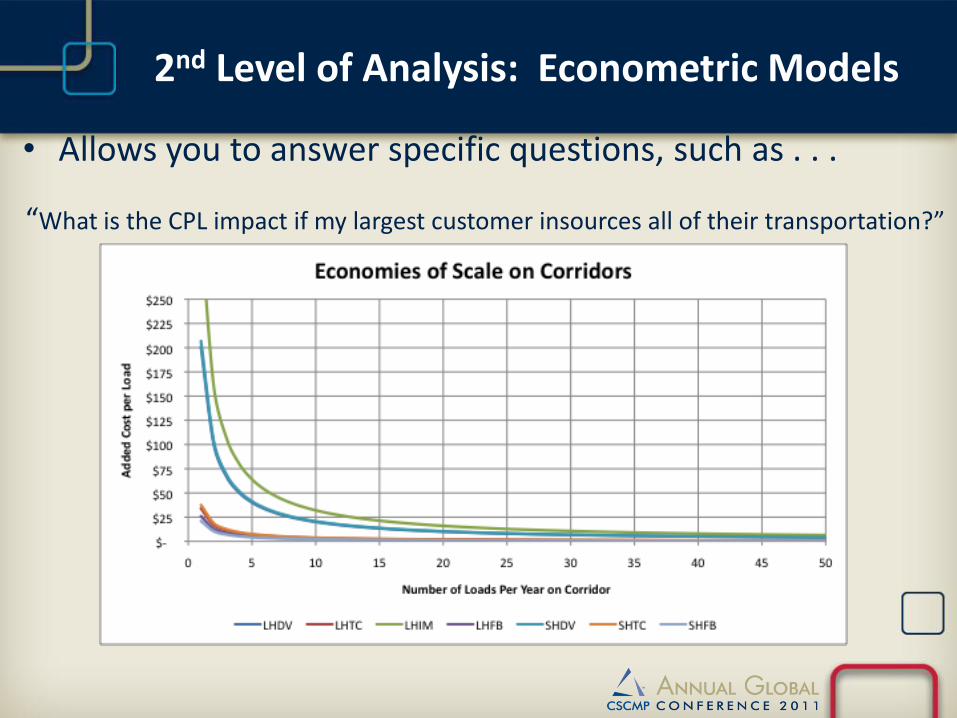
• Allows you to answer specific questions, such as . . .
“What is the CPL impact if my largest customer insources all of their transportation?”
2nd Level of Analysis: Econometric Models

• How can we capture the backhaul effect? – Created >100 Regional Value Flags across North America – Each captures financial impact of starting/ending a trip in that area – Each shipment is flagged to its origin and destination location – Smaller areas (3DZ) are mapped to these regions
What are the benefits?
– Enables us to estimate rates on lanes where we have no history – O&D effects are isolated
– Allows for very detailed mapping of regional value effects – good for site location
2nd Level of Analysis: Econometric Models

Heat Map of LHDV Rate Imbalances
2nd Level of Analysis: Econometric Models

3rd Level of Analysis: Sense-Making
• Most 3PLs do not realize the value of their own data
• Value in combining different data sources
– Procurement (bid) data
– Transactional shipment records
– Policy and practices
• Provides opportunity for “Sense-Making”
– How do policies & practices influence rates?
– How should fuel be managed?
– How should my pricing be aligned?
12

Freight Markets are Vast
FOR-HIRE DOMESTIC MARKET Approx. $300B
Understanding the effects of perfect competition & truckload contracts
2010 Transport Topics
Top 10 Truckload Carriers
~12B
Chainalytics Truckload
Benchmarking
Consortium
~23B
“Large” $210MM
Shipper
13
0
20
40
60
80
100
120
0
50,000
100,000
150,000
200,000
250,000
300,000
350,000
400,000
450,000
10/2/2006 10/2/2007 10/2/2008 10/2/2009
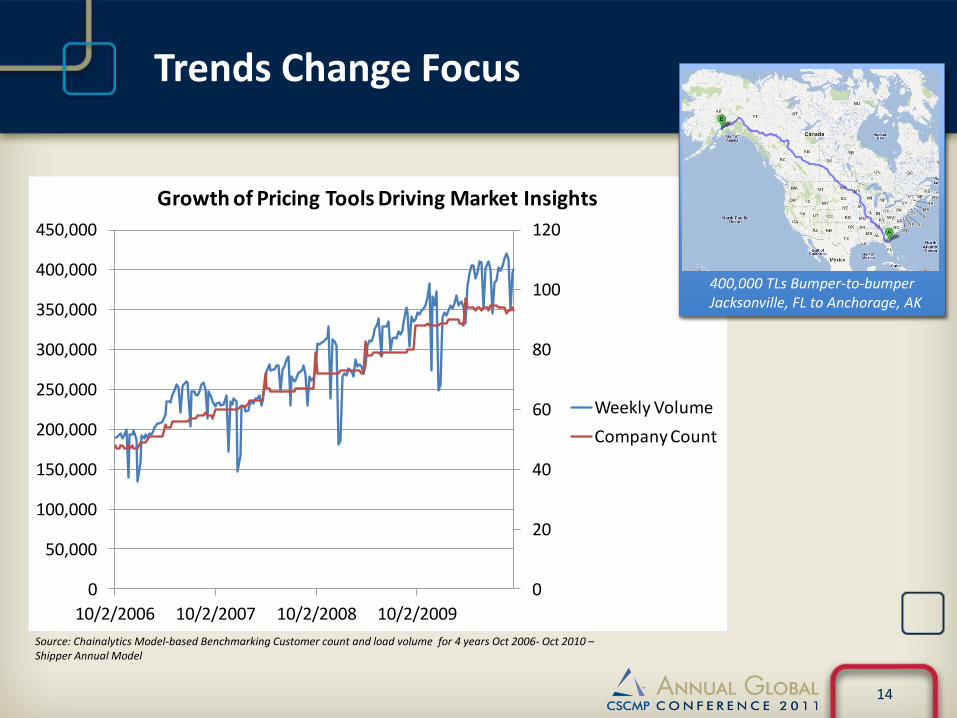
Growth of Pricing Tools Driving Market Insights
Weekly Volume
Company Count
Trends Change Focus
400,000 TLs Bumper-to-bumper Jacksonville, FL to Anchorage, AK
Source: Chainalytics Model-based Benchmarking Customer count and load volume for 4 years Oct 2006- Oct 2010 – Shipper Annual Model
14
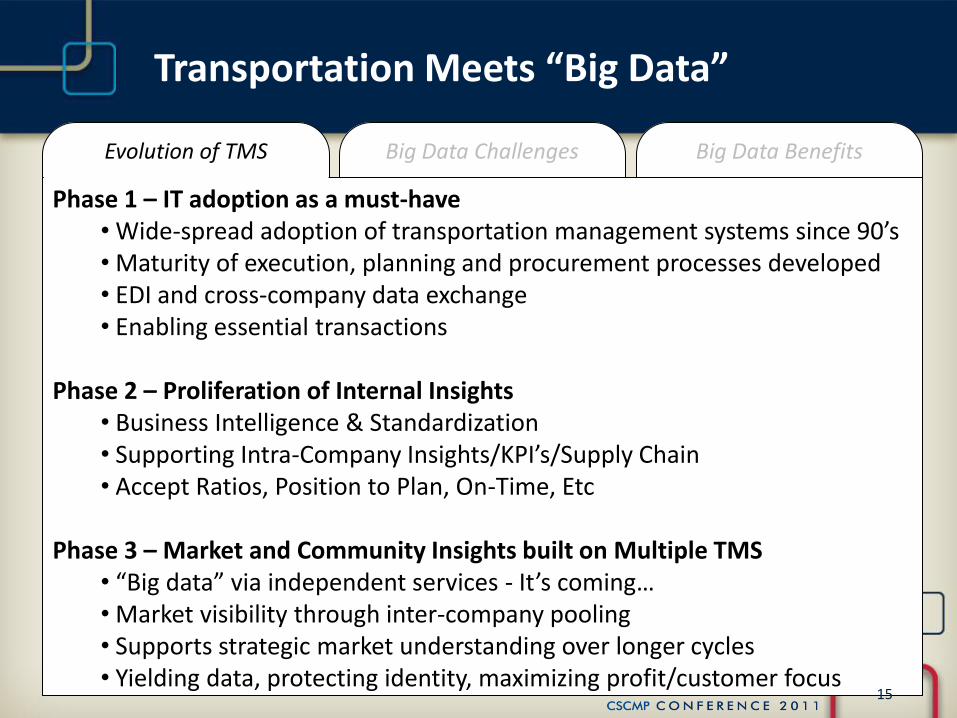
Transportation Meets “Big Data”
Evolution of TMS Big Data Challenges Big Data Benefits
Phase 1 – IT adoption as a must-have • Wide-spread adoption of transportation management systems since 90’s • Maturity of execution, planning and procurement processes developed • EDI and cross-company data exchange • Enabling essential transactions
Phase 2 – Proliferation of Internal Insights
• Business Intelligence & Standardization • Supporting Intra-Company Insights/KPI’s/Supply Chain • Accept Ratios, Position to Plan, On-Time, Etc
Phase 3 – Market and Community Insights built on Multiple TMS
• “Big data” via independent services - It’s coming… • Market visibility through inter-company pooling • Supports strategic market understanding over longer cycles • Yielding data, protecting identity, maximizing profit/customer focus
15

Evolution of TMS Big Data Challenges Big Data Benefits
The Focus of Independents Data Throughput /Technology
• Capture • Storage • Distribution
Process/Intellect
• Analytics • Research • Relevance
Innovative Service & Application
• Pricing Support • Visualization • Sharing • Searching • Trending • Community Development • Integrating In/Outflows
Transportation Meets “Big Data”
16

Evolution of TMS Big Data Challenges Big Data Benefits
Quantitative Analysis -Pricing Benchmarks -Business Trends -Fuel Impacts -Regional Seasonality -Customer Solutions -Industry Specific Focus - Surveys - Cost / Service Tradeoffs - Buyer Market Identity - Contractual Choice - Debunking Common Myths
Supporting Execution, Planning & Strategy
- Load Planning - Procurement Strategy - Account Management - Network Design - Facility Location - Policy Changes
Transportation Meets “Big Data”
17
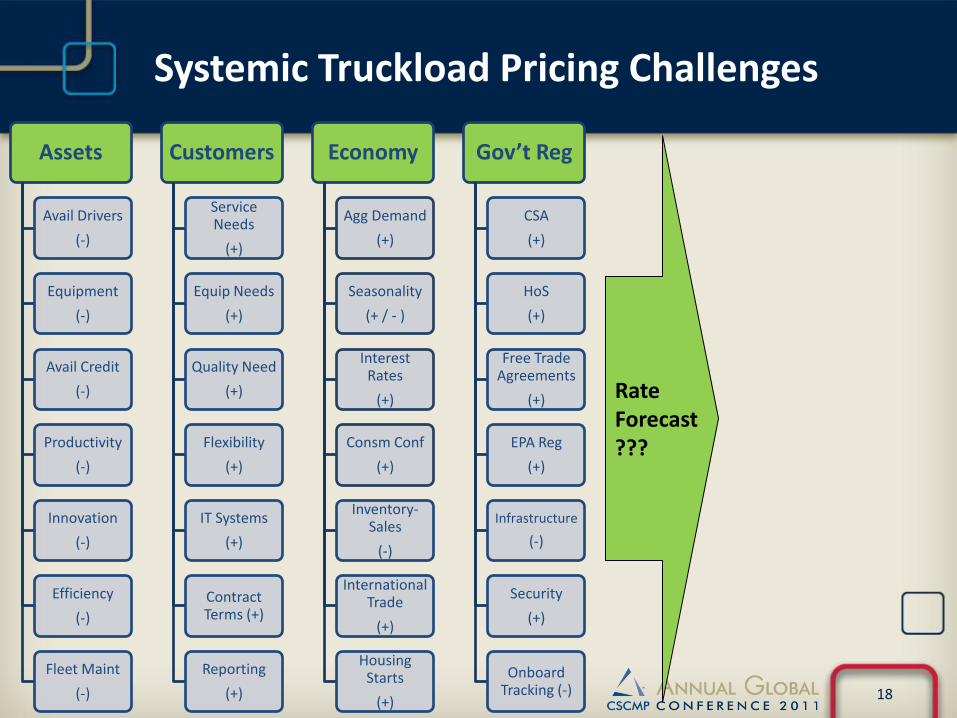
Systemic Truckload Pricing Challenges
Assets
Avail Drivers
(-)
Equipment
(-)
Avail Credit
(-)
Productivity
(-)
Innovation
(-)
Efficiency
(-)
Fleet Maint
(-)
Customers
Service Needs
(+)
Equip Needs
(+)
Quality Need
(+)
Flexibility
(+)
IT Systems
(+)
Contract Terms (+)
Reporting
(+)
Economy
Agg Demand
(+)
Seasonality
(+ / - )
Interest Rates
(+)
Consm Conf
(+)
Inventory-Sales
(-)
International Trade
(+)
Housing Starts
(+)
Gov’t Reg
CSA
(+)
HoS
(+)
Free Trade Agreements
(+)
EPA Reg
(+)
Infrastructure
(-)
Security
(+)
Onboard Tracking (-)
Rate Forecast ???
18

Assets
Avail Drivers
(-)
Equipment
(-)
Avail Credit
(-)
Productivity
(-)
Innovation
(-)
Efficiency
(-)
Fleet Maint
(-)
Customers
Service Needs
(+)
Equip Needs
(+)
Quality Need
(+)
Flexibility
(+)
IT Systems
(+)
Contract Terms (+)
Reporting
(+)
Economy
Agg Demand
(+)
Seasonality
(+ / - )
Interest Rates
(+)
Consm Conf
(+)
Inventory-Sales
(-)
International Trade
(+)
Housing Starts
(+)
Gov’t Reg
CSA
(+)
HoS
(+)
Free Trade Agreements
(+)
EPA
(+)
Infrastructure
(-)
Security
(+)
Onboard Tracking (-)
Systemic Truckload Pricing Challenges
Rate Forecast
Reality: Cause and Effect relationships are too numerous, complex and dynamic Big Data Concept: Multi-cyclical approach to defray interdependencies and isolate systemic relationships
19

Developing Aggregate Insights
Going beyond the transaction to yield strategic insight… A single econometric model generates ~50MM possible benchmarks Since January 1.4B 3PL Benchmarks Created
Big Data
Customer
Carrier
Geography
Policy
Seasonal
Effects
Service
20

The Basics
$-
$200
$400
$600
$800
$1,000
$1,200
Jan-11 Feb-11 Mar-11 Apr-11 May-11 Jun-11 Jul-11 Aug-11 Sep-11
Philadelphia - Chicago Dry Van
All-In
Fuel
Linehaul
21
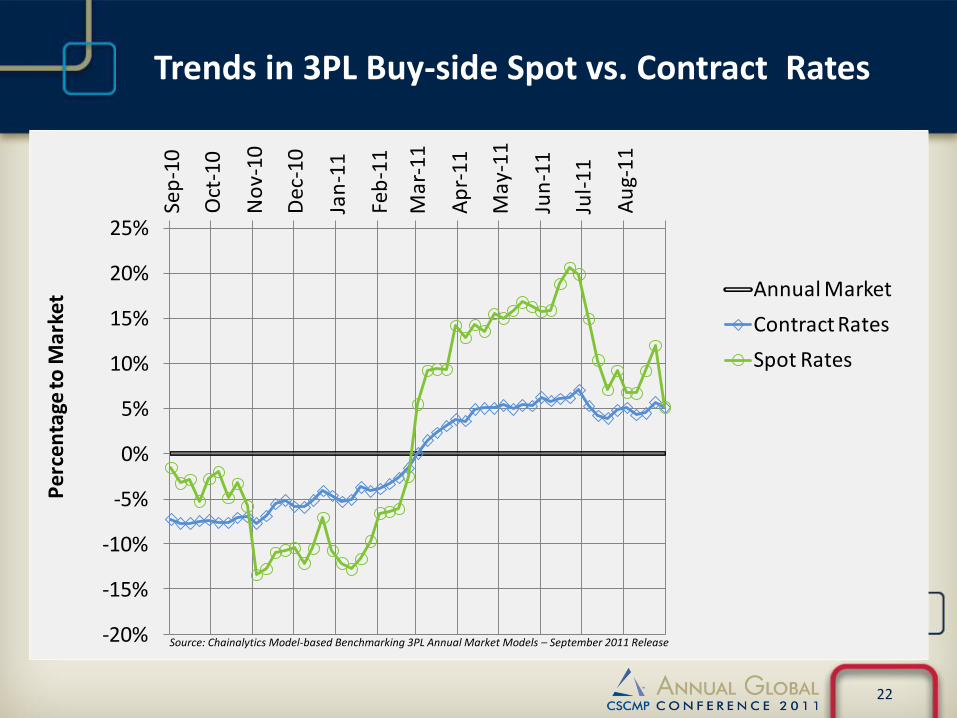
Trends in 3PL Buy-side Spot vs. Contract Rates
-20%
-15%
-10%
-5%
0%
5%
10%
15%
20%
25%
Sep
-10
Oct
-10
No
v-10
Dec
-10
Jan
-11
Feb
-11
Mar
-11
Ap
r-1
1
May
-11
Jun
-11
Jul-
11
Au
g-1
1
Per
cen
tage
to M
arke
t Annual Market
Contract Rates
Spot Rates
Source: Chainalytics Model-based Benchmarking 3PL Annual Market Models – September 2011 Release
22

y = 0.0006x + 1.9153R² = 0.7475
$-
$0.50
$1.00
$1.50
$2.00
$2.50
$3.00
$3.50
$4.00
$4.50
$5.00
0 1000 2000 3000 4000 5000
DO
E -
#2 D
iese
l
Weekly Spot Volume
Correlation - Weekly Spot Market Volume to Price of Diesel
Diesel Price
Linear (Diesel Price)
Relationships and Market Effects
Source: Chainalytics Model-based Benchmarking 3PL Annual Market Models – September 2011 Release
23

Relationships and Market Effects
y = 0.0006x + 1.9153R² = 0.7475
$-
$0.50
$1.00
$1.50
$2.00
$2.50
$3.00
$3.50
$4.00
$4.50
$5.00
0 1000 2000 3000 4000 5000
DO
E -
#2 D
iese
l
Weekly Spot Volume
Correlation - Weekly Spot Market Volume to Price of Diesel
Diesel Price
Linear (Diesel Price)
Source: Chainalytics Model-based Benchmarking 3PL Annual Market Models – September 2011 Release
24

Testing Policy and Buyer Attributes
Source: Chainalytics Model-based Benchmarking Shipper Annual Model & Dry Van Policy Survey Results – July 2011 Release
25
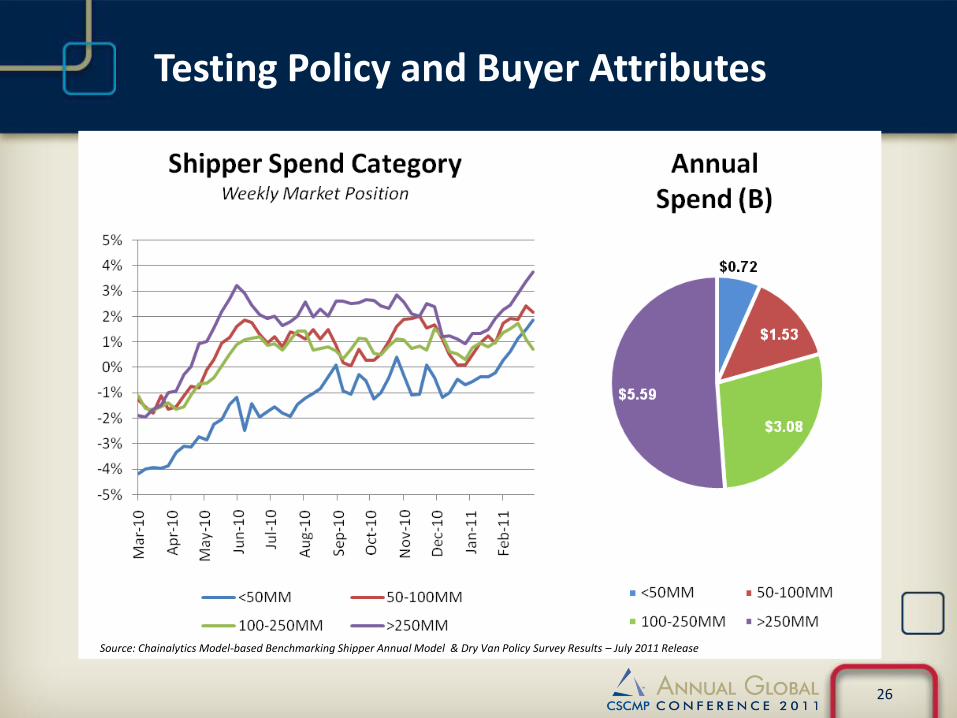
Testing Policy and Buyer Attributes
Source: Chainalytics Model-based Benchmarking Shipper Annual Model & Dry Van Policy Survey Results – July 2011 Release
26

Testing Policy and Buyer Attributes
Source: Chainalytics Model-based Benchmarking Shipper Annual Model & Dry Van Policy Survey Results – July 2011 Release
27
Transportation Benchmarking
Insights Transportation Benchmarking
Insights Transportation Benchmarking
Insights
Transportation Benchmarking
Insights Transportation Benchmarking
Insights Transportation Benchmarking
Insights Transportation Management
Systems
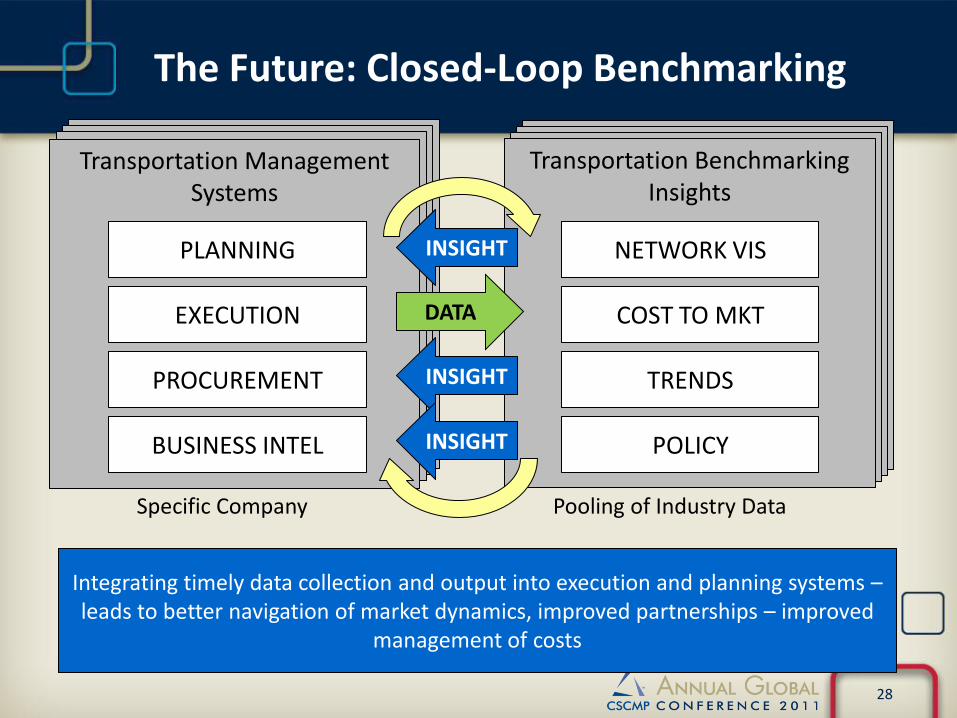
The Future: Closed-Loop Benchmarking
PLANNING
EXECUTION
PROCUREMENT
BUSINESS INTEL
Transportation Benchmarking Insights
COST TO MKT
NETWORK VIS
TRENDS
Specific Company Pooling of Industry Data
DATA
INSIGHT
INSIGHT
INSIGHT POLICY
Integrating timely data collection and output into execution and planning systems – leads to better navigation of market dynamics, improved partnerships – improved
management of costs
28
Final remarks
• Markets are too complex and too dynamic to efficiently rationalize in isolation
• Buyer strengths grounded in adaptation
– Strategies are highly cyclical
– Core capacity and leverage offset by fragmentation and regional focus
• 3PLs need to be aware of new frontier of “Big Data” concepts
– Many are now adopting multiple sources into planning and execution systems
– Insights provide valuable opportunities to better manage volatility and customer relationships
– Essential to growth as uses become more common
29