3q 2020 earnings october 2020 - seeking alpha
TRANSCRIPT
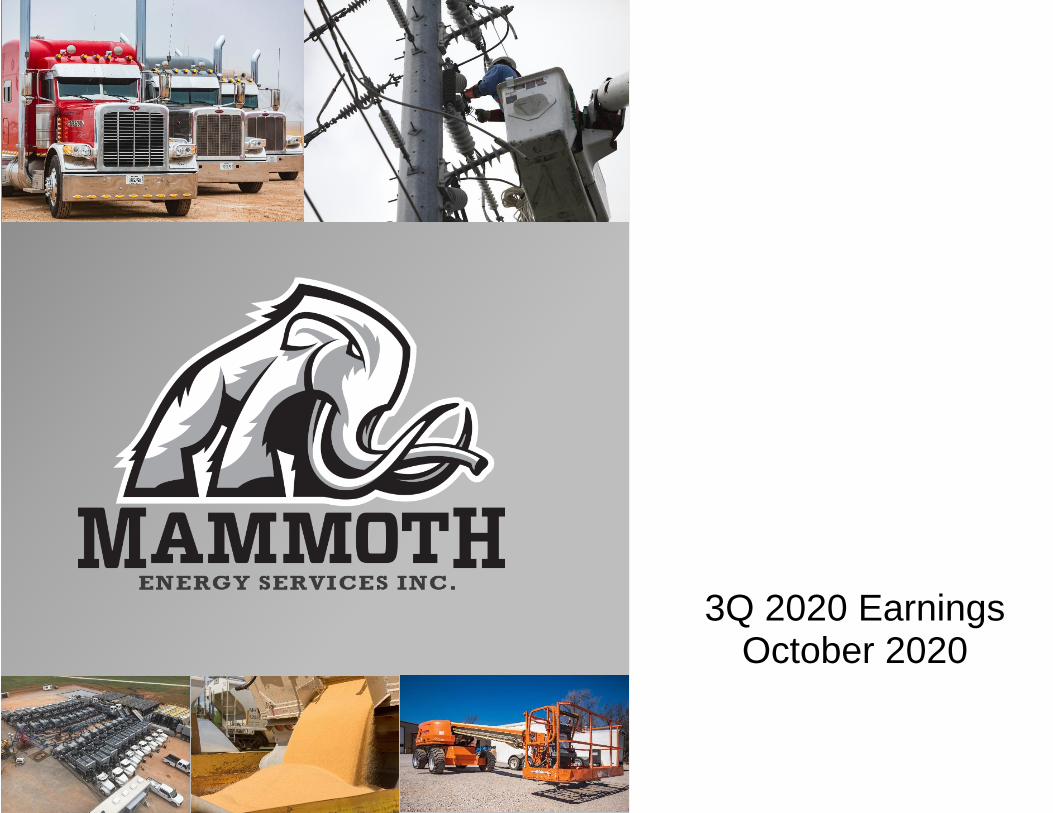
3Q 2020 Earnings October 2020
October 2020 1
Forward Looking and Cautionary Statements
Forward-Looking Statements
The information in this investor presentation of Mammoth Energy Services, Inc. (“Mammoth” or “Mammoth Energy”) includes “forward-looking statements.” All statements, other
than statements of historical facts that address activities, events or developments that Mammoth expects, believes or anticipates will or may occur in the future are forward-looking
statements. The words “anticipate,” “believe,” “ensure,” “expect,” “if,” “intend,” “plan,” “estimate,” “project,” “forecasts,” “predict,” “outlook,” “aim,” “will,” “could,” “should,” “potential,”
“would,” “may,” “probable,” “likely” and similar expressions, and the negative thereof, are intended to identify forward-looking statements. Without limiting the generality of the
foregoing, forward-looking statements contained in this investor presentation may include statements, estimates and projections regarding Mammoth’s business outlook and
plans, future financial position, liquidity and capital resources, operations, performance, acquisitions, returns, capital expenditure budgets, costs and other guidance regarding
future developments. Forward-looking statements are not assurances of future performance. These forward-looking statements are based on management’s current expectations
and beliefs, forecasts for Mammoth’s existing operations, experience and perception of historical trends, current conditions, anticipated future developments and their effect on
Mammoth, and other factors believed to be appropriate. Although management believes that the expectations and assumptions reflected in these forward-looking statements are
reasonable as and when made, no assurance can be given that these assumptions are accurate or that any of these expectations will be achieved (in full or at all). Moreover,
these forward-looking statements are subject to significant risks and uncertainties, including those described in Mammoth’s Annual Reports on Form 10-K, Quarterly Reports on
Form 10-Q, Current Reports on Form 8-K and other filings Mammoth makes with the Securities and Exchange Commission (“SEC”), which may cause actual results to differ
materially from its historical experience and present expectations or projections which are implied or expressed by the forward-looking statements. Important factors that could
cause actual results to differ materially from those in the forward-looking statements include, but are not limited to: the failure to receive or delays in receiving governmental
authorizations, approvals and/or payments; the outcome of an ongoing governmental investigation and other legal proceedings, including those relating to the contracts awarded
to our subsidiary Cobra Acquisitions LLC by the Puerto Rico Electric Power Authority and contracts for our pressure pumping services and natural sand proppant; and related
investigations and legal proceedings; our ability to replace the prior levels of work in our business segments, including our infrastructure and pressure pumping segments; risks
relating to economic conditions; delays in or failure of delivery of current or future orders of specialized equipment; the loss of or interruption in operations of one or more key
suppliers or customers; the effects of government regulation, permitting and other legal requirements; operating risks; the adequacy of our capital resources and liquidity; weather;
natural disasters; global or national health concerns, including the outbreak of pandemic or contagious diseases, such as COVID-19; the health and well-being of Mammoth’s
employees; the performance of contracts and supply chain disruptions during the ongoing COVID-19 pandemic; litigation; depressed commodity markets; reduced demand for
oilfield services, conditions in the capital, financial and credit markets; competition in the oil and natural gas and infrastructure industries; and costs and availability of resources.
Investors are cautioned not to place undue reliance on any forward-looking statements, which speak only as of the date of this presentation. Except as otherwise required by
applicable law, we disclaim any duty to update and do not intend to update any forward-looking statements, all of which are expressly qualified by the statements in this section, to
reflect events or circumstances after the date of this presentation.
This presentation includes financial measures that are not presented in accordance with generally accepted accounting principles (“GAAP”), including Adjusted EBITDA. While
management believes such non-GAAP measures are useful for investors, they should not be used as a replacement for financial measures that are in accordance with GAAP.
Please see the Appendix and our filings with the SEC for reconciliations of those measures to comparable GAAP measures.
Industry and Market Data
This presentation has been prepared by Mammoth and includes market data and other statistical information from third-party sources, including independent industry publications,
government publications or other published independent sources. Although Mammoth believes these third-party sources are reliable as of their respective dates, Mammoth has
not independently verified the accuracy or completeness of this information. Some data are also based on the Mammoth’s good faith estimates, which are derived from its review
of internal sources as well as the third-party sources described above.

October 2020 2
3Q 2020 Financial Performance
Highlights
(1) See reconciliation of Adjusted EBITDA to comparable GAAP measure at the end of this presentation and in our filings with the SEC
3Q20 revenues of ~$71 million, net income
of ~$3 million and Adjusted EBITDA of
~$22 million(1)
62% of 3Q 2020 revenue from
Infrastructure Segment
3Q 2020 capex of ~$1.5 million
Completed 449 high pressure stages
during 3Q20
Sold ~68,000 tons of sand during 3Q20;
Average sales price of ~$15.39ton
$113
$71
$(4)
$22
3Q19 3Q20
Revenue Adjusted EBITDA

October 2020 3
Diversified Portfolio of Infrastructure and Oil field Services
Engineering
Transmission
Construction
Rental Equipment
Drilling Rigs &
Directional Drilling
Logistics
Pressure Pumping Water TransferHigh Quality Frac
Sand
Substation
Construction
Aviation Services
Distribution
Construction
Manufacturing
Design
Develop
AnalyzeConstruct
Evaluate
Project Management

October 2020 4
Mammoth Metamorphosis
Mammoth has created an entrepreneurial culture where management teams can flourish
Strong foundation in place providing a platform by which to grow through organic expansion or acquisitions
Management teams compete for growth capital
Evaluated more than 300 individual deals over the past three years, closed 9
M&A focus has shifted to industrial sectors
Industrial Company
Infrastructure Construction
• Transmission construction
• Substation construction
• Distribution construction
• Aviation services
• Project engineering
• Logistics
Industrial Industries
• Full service transportation
• Manufacturing
• Exploring Telecommunications
Oil Field Service
• Pressure pumping
• Natural proppant
• Sand and crude transportation
• Rental equipment
• Water handling
• Drilling rigs
• Directional drilling
• Coil tubing
Future
Energy Service
Infrastructure Construction
• Transmission construction
• Substation construction
• Distribution construction
• Aviation services
• Project engineering
• Logistics
Industrial Industries
• Full service transportation
• Manufacturing
Oil Field Service
• Pressure pumping
• Natural proppant
• Sand and crude transportation
• Rental equipment
• Water handling
• Drilling rigs
• Directional drilling
• Coil tubing
Present
Pure Oil Field Service
• Pressure pumping
• Natural proppant
• Sand transportation
• Drilling rigs
• Directional drilling
• Flowback
• Coil tubing
Past (pre-2017)

October 2020 5
Integrated Infrastructure Construction Services
Ownership in Brim Aviation is through a joint venture with Wexford Capital
(1) Brim Aviation holds FAA 133, 135 and 137 certifications
Transmission
EngineeringDistribution
Substation
Project
Management Aviation
Services
LogisticsEmergency
Restoration
DesignDesign capabilities of overhead
transmission and distribution electrical
infrastructure
Overhead and underground voltages
up to 34.5Kv
Bare-hand live line up to 345KV
Team of experienced electrical,
mechanical and civil engineers
Planning, system oversight, 3rd party
contracting, administrative capabilities
Capabilities to procure and ship
materials and personnel to any location
Substation and switchyard
construction and maintenance
FAA 133, 135 and 137 certifications(1)
Highly experienced in storm recovery
(Hurricanes, ice storms, tornadoes)
Field offices spread across the Midwest, Southern and Western portions of the U.S.
Crews specializing in transmission, substation, C&I and distribution construction and maintenance
7 Light lift aircraft

October 2020 6
Infrastructure Services
High Quality Customer Base
Ownership in Brim Aviation is through a joint venture with Wexford Capital

October 2020 7
Aviation Services
7 Light Lift Helicopters:
3 – MD-600
3 – MD-902
1 – Augusta AW109SP (leased)
Fleet of 7 light lift aircraft
FAA 133, 135 and 137 certifications(1) allow for a wide
range of aviation services including:
Powerline construction
Search and rescue
Aerial photography
Law enforcement training
Integration with infrastructure construction and project
engineering provides a complete solution for customers
Ownership in Brim Aviation is through a joint venture with Wexford Capital
(1) Brim Aviation holds FAA 133, 135 and 137 certifications

October 2020 8
Logistics
Leveraged extensive experience in the logistics
industry to expand offerings and transition into
a diversified transportation company.
Utilize an asset light model including owned
assets, owner operators and brokerage to
boost earnings potential.
Sand Logistics Crude Hauling General Freight

October 2020 9
Oil Field ServicesHigh Quality Customer BaseFully integrated Oil Field Service capability
Six high pressure pumping fleets (~50,000 Hhp each)
Two high quality Northern White sand mines
Total processing capacity of 4.4 Mmtpa
Best in class cost structure ($10-$12/Ton)
Water transfer
Full-service logistics
Sand
Crude
General cargo
Full suite of rental equipment
11 Drilling rigs (all in Permian)
Directional drilling
Five coil tubing spreads

October 2020 10
Business Model
Mammoth management has been
successful at identifying growth
opportunities
Business lines are run independently but
leverage synergies and customer
relationships
Management teams are the key to
successful business lines
Utilize cash flows to grow once
management team is in place and
integrated into culture
Evaluated 300+ opportunities over the past
three years
Identify Opportunities
Purchase at Discount
Integrate into Culture
Use Cash Flow to Grow
Hold Management Accountable

October 2020 11
Corporate Strategy
ENTREPRENEURIAL
CULTURE
INVEST IN
ATTRACTIVE
OPPORTUNITIES
GROWTH: QUALITY
OVER QUANTITY
EXECUTION IS
CRITICAL

October 2020 12
TUSK Well Positioned vs Peers
Compelling value opportunity versus peers
Trading at discount to peer group despite superior balance sheet and service diversification
Market capitalization(1) of ~$71 million, enterprise value of ~$147 million, based on ~$90 million of debt and ~$14 million of cash on September 30, 2020
~62% of 3Q 2020 revenue generated from Infrastructure segment
Revenue by Segment in 3Q 2020EV / 2021 EBITDA (Consensus Estimates) (1)(2)
Source: Factset
(1) Based on 10/28/2020 closing price
(2) Large Cap (SLB, HAL, BKR); Proppant (SLCA, SND); Land Drillers (NBR, HP, PDS, ICD); Pressure Pumping (BAS, FRAC, LBRT, FTSI, PUMP, RES, USWS); Transmission and Distribution (EME, DY, MTZ, MYRG, PWR)
3.1x
7.4x 8.2x 8.3x 8.8x 16.4x
Mammoth Transmission
and
Distribution
Proppant
Peers
Large Cap
Peers
Pressure
Pumping
Peers
Land Driller
Peers
Oil Field Services
38%
Infrastructure
62%

October 2020 13
$5
$2
$3
~$10 million(1)
2020 Capex Budget
2020 Major Projects
Upgrading pressure pumping fleets to Dynamic Gas Blending (DGB)
Organically grow the continental U.S. infrastructure business, ultimately dependent on contract coverage
Expand rental division
Expand water transfer
Growth capital will remain dependent on market conditions
~$6 million spent through September 30, 2020
PressurePumping
Other
Infrastructure
(1) Maximum budget amount. Actual expenditures expected to be less based on current market conditions.

October 2020 14
Adjusted EBITDA Reconciliation
Adjusted EBITDA is a supplemental non-GAAP financial measure that is used by management and external users of our financial statements, such as industry analysts, investors, lenders and rating agencies. We define Adjusted EBITDA as net income (loss) before depreciation, depletion, accretion and amortization expense, impairment of goodwill, impairment of other long-lived assets, inventory obsolesce charges, stock based compensation, interest expense, net other income, net, and benefit for income taxes, further adjusted to add back interest on trade accounts receivable. We exclude the items listed above from net income in arriving at Adjusted EBITDA because these amounts can vary substantially from company to company within our industry depending upon accounting methods and book values of assets, capital structures and the method by which the assets were acquired. Adjusted EBITDA should not be considered as an alternative to, or more meaningful than, net income (loss) or cash flows from operating activities as determined in accordance with GAAP or as an indicator of our operating performance or liquidity. Certain items excluded from Adjusted EBITDA are significant components in understanding and assessing a company’s financial performance, such as a company’s cost of capital and tax structure, as well as the historic costs of depreciable assets, none of which are components of Adjusted EBITDA. Our computations of Adjusted EBITDA may not be comparable to other similarly titled measure of other companies. We believe that Adjusted EBITDA is a widely followed measure of operating performance and may also be used by investors to measure our ability to meet debt service requirements.
Reconciliation of Adjusted EBITDA to net income (loss) (000’s)Three Months Ended
September 30, 2020
Three Months Ended
September 30, 2019
Net Income (Loss) $3,430 ($35,709)
Depreciation, Depletion, Accretion and Amortization Expense $23,132 $29,791
Impairment of Goodwill - $3,194
Impairment of Other Long-lived Assets - $3,348
Inventory Obsolescence Charges - $1,349
Stock Based Compensation $353 $1,134
Interest Expense, net $1,098 $1,398
Other Income, net ($9,042) ($6,368)
Benefit for Income Taxes ($6,193) ($7,794)
Interest on Trade Accounts Receivable $9,285 $5,896
Adjusted EBITDA $22,063 ($3,761)
October 2020 15
Company Headquarters14201 Caliber Drive, Suite 300
Oklahoma City, OK 73134405-608-6007