3q fy2017 earnings presentation
TRANSCRIPT
© Copyright 2017, Cardinal Health, Inc. or one of its subsidiaries. All rights reserved
Q3 FY2017 Cardinal Health, Inc. Earnings Investor/Analyst call
May 1, 2017
© Copyright 2017, Cardinal Health, Inc. or one of its subsidiaries. All rights reserved.2
Forward-looking statements and GAAP reconciliationCautions Concerning Forward-Looking Statements
This presentation contains forward-looking statements addressing expectations, prospects, estimates and other matters that are dependent upon
future events or developments. These statements may be identified by words such as "expect," "anticipate," "intend," "plan," "believe," "will,"
"should," "could," "would," "project," "continue," "likely," and similar expressions, and include statements reflecting future results, trends or guidance,
statements of outlook and expense accruals. These matters are subject to risks and uncertainties that could cause actual results to differ materially
from those projected, anticipated or implied. These risks and uncertainties include competitive pressures in Cardinal Health's various lines of
business; the amount or rate of generic and branded pharmaceutical price appreciation or deflation and the timing of and benefit from generic
pharmaceutical introductions; the ability to maintain the benefits from the generic sourcing venture with CVS Health; the ability to successfully
complete the acquisition of the Patient Recovery businesses from Medtronic on a timely basis, including obtaining required regulatory approvals
and the satisfaction of other conditions; the conditions of the credit markets and our ability to issue debt to fund the acquisition on acceptable terms;
if the acquisition of the Patient Recovery businesses is completed, the ability to retain the acquired businesses’ customers and employees, the
ability to successfully integrate the acquired businesses into our operations and the ability to achieve the expected synergies as well as accretion in
earnings; risks associated with the anticipated increase of indebtedness and potential limitations on our ability to use our cash for other purposes;
our ability to successfully integrate and realize the benefits from the acquisition of Cordis; the risk of non-renewal or a default under one or more key
customer or supplier arrangements or changes to the terms of or level of purchases under those arrangements; uncertainties due to government
health care reform including proposals to modify or repeal the Affordable Care Act; uncertainties with respect to U.S. tax or trade laws, including
proposals relating to a “border adjustment tax” or new import tariffs; changes in the distribution patterns or reimbursement rates for health care
products and services; the effects of any investigation or action by any regulatory authority; and changes in foreign currency rates and the cost of
commodities such as oil-based resins, cotton, latex and diesel fuel. Cardinal Health is subject to additional risks and uncertainties described in
Cardinal Health's Form 10-K, Form 10-Q and Form 8-K reports and exhibits to those reports. This presentation reflects management's views as of
May 1, 2017. Except to the extent required by applicable law, Cardinal Health undertakes no obligation to update or revise any forward-looking
statement. In addition, this presentation contains Non-GAAP financial measures. Cardinal Health provides definitions and reconciliations of the
differences between the Non-GAAP financial measures and their most directly comparable GAAP financial measures in the Financial Appendix at
the end of this presentation and at ir.cardinalhealth.com. An audio replay of the webcast will be available at ir.cardinalhealth.com.
© Copyright 2017, Cardinal Health, Inc. or one of its subsidiaries. All rights reserved
Q3 FY2017 results
© Copyright 2017, Cardinal Health, Inc. or one of its subsidiaries. All rights reserved.4
1Attributable to Cardinal Health, Inc.
Please see appendix for GAAP to Non-GAAP reconciliations.
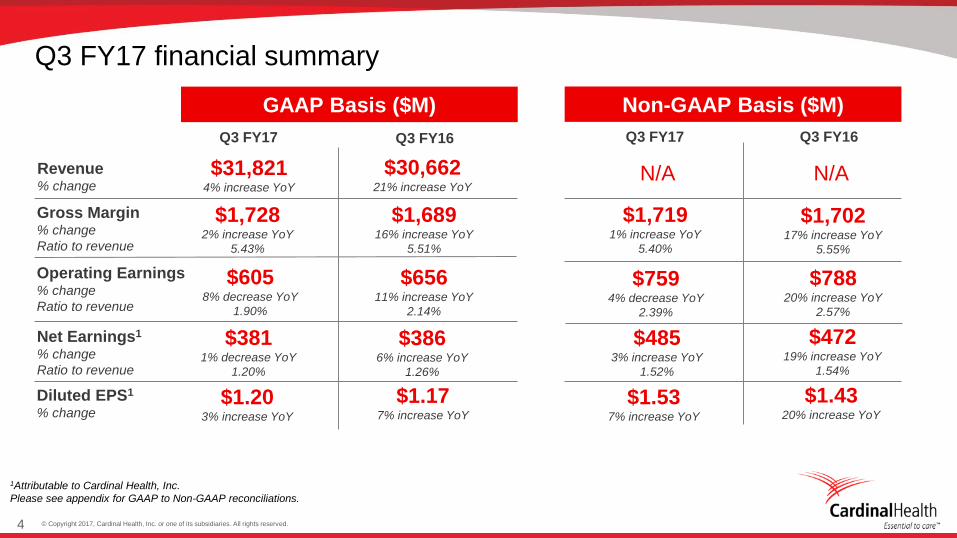
$31,8214% increase YoY
GAAP Basis ($M)
$6058% decrease YoY
1.90%
$3811% decrease YoY
1.20%
$1.203% increase YoY
Revenue% change
Operating Earnings% change
Ratio to revenue
Net Earnings1
% change
Ratio to revenue
Diluted EPS1
% change
$30,66221% increase YoY
Q3 FY17 Q3 FY16
$65611% increase YoY
2.14%
$3866% increase YoY
1.26%
$1.177% increase YoY
Non-GAAP Basis ($M)
Q3 FY17 Q3 FY16
$7594% decrease YoY
2.39%
$4853% increase YoY
1.52%
$1.537% increase YoY
$78820% increase YoY
2.57%
$47219% increase YoY
1.54%
$1.4320% increase YoY
Gross Margin% change
Ratio to revenue
$1,7282% increase YoY
5.43%
$1,68916% increase YoY
5.51%
$1,7191% increase YoY
5.40%
$1,70217% increase YoY
5.55%
Q3 FY17 financial summary
N/A N/A
© Copyright 2017, Cardinal Health, Inc. or one of its subsidiaries. All rights reserved.5
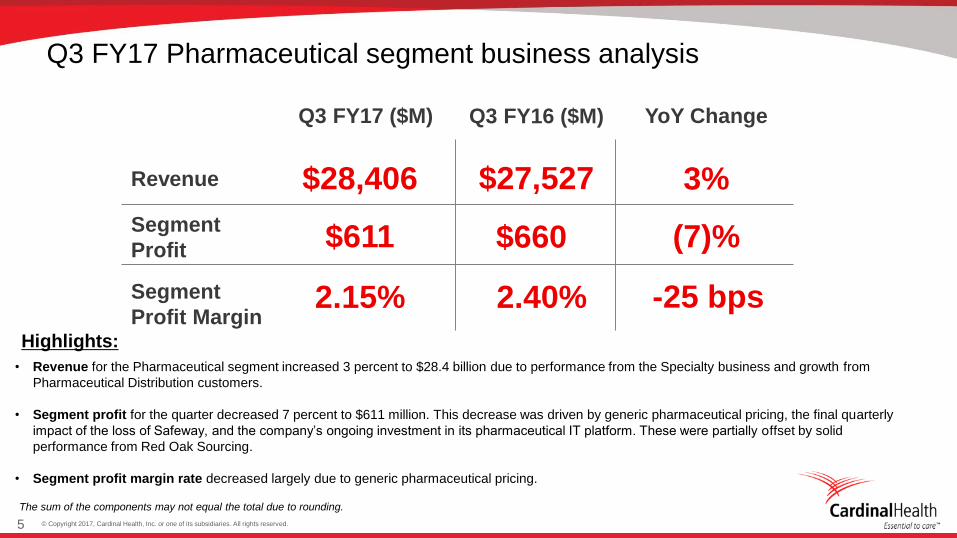
Q3 FY17 Pharmaceutical segment business analysis
The sum of the components may not equal the total due to rounding.
Revenue
Segment
Profit
Segment
Profit Margin
Q3 FY17 ($M) YoY Change
3%$28,406
(7)%$611
2.15%
Highlights:
• Revenue for the Pharmaceutical segment increased 3 percent to $28.4 billion due to performance from the Specialty business and growth from
Pharmaceutical Distribution customers.
• Segment profit for the quarter decreased 7 percent to $611 million. This decrease was driven by generic pharmaceutical pricing, the final quarterly
impact of the loss of Safeway, and the company’s ongoing investment in its pharmaceutical IT platform. These were partially offset by solid
performance from Red Oak Sourcing.
• Segment profit margin rate decreased largely due to generic pharmaceutical pricing.
2.40%
$660
$27,527
Q3 FY16 ($M)
-25 bps
© Copyright 2017, Cardinal Health, Inc. or one of its subsidiaries. All rights reserved.6
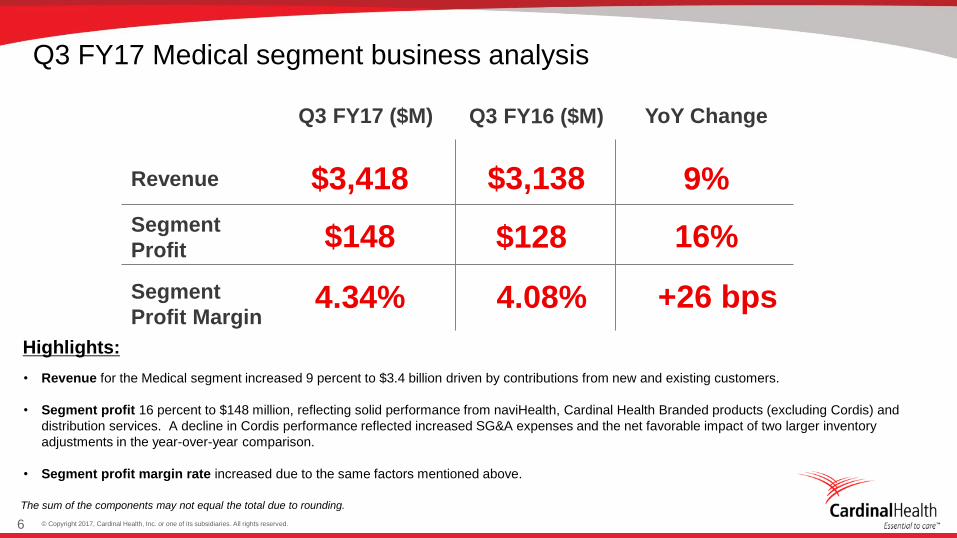
The sum of the components may not equal the total due to rounding.
Revenue
Segment
Profit
Segment
Profit Margin
Q3 FY17 ($M) YoY Change
9%$3,418
16%$148
4.34%
Highlights:
• Revenue for the Medical segment increased 9 percent to $3.4 billion driven by contributions from new and existing customers.
• Segment profit 16 percent to $148 million, reflecting solid performance from naviHealth, Cardinal Health Branded products (excluding Cordis) and
distribution services. A decline in Cordis performance reflected increased SG&A expenses and the net favorable impact of two larger inventory
adjustments in the year-over-year comparison.
• Segment profit margin rate increased due to the same factors mentioned above.
4.08%
$128
$3,138
Q3 FY16 ($M)
Q3 FY17 Medical segment business analysis
+26 bps
© Copyright 2017, Cardinal Health, Inc. or one of its subsidiaries. All rights reserved.7
Gross
Margin ($M)
Operating
Earnings ($M)
Net Earnings2
($M)Diluted EPS2 Gross
Margin ($M)
Operating
Earnings ($M)
Net Earnings2
($M)Diluted EPS2
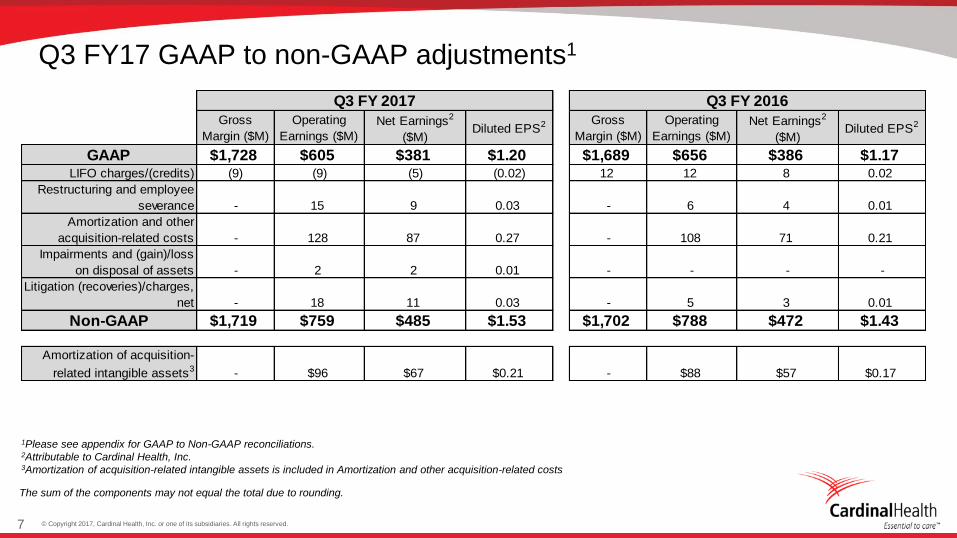
GAAP $1,728 $605 $381 $1.20 $1,689 $656 $386 $1.17LIFO charges/(credits) (9) (9) (5) (0.02) 12 12 8 0.02
Restructuring and employee
severance - 15 9 0.03 - 6 4 0.01
Amortization and other
acquisition-related costs - 128 87 0.27 - 108 71 0.21
Impairments and (gain)/loss
on disposal of assets - 2 2 0.01 - - - -
Litigation (recoveries)/charges,
net - 18 11 0.03 - 5 3 0.01
Non-GAAP $1,719 $759 $485 $1.53 $1,702 $788 $472 $1.43
Amortization of acquisition-
related intangible assets3 - $96 $67 $0.21 - $88 $57 $0.17
Q3 FY 2017 Q3 FY 2016
The sum of the components may not equal the total due to rounding.
Q3 FY17 GAAP to non-GAAP adjustments1
1Please see appendix for GAAP to Non-GAAP reconciliations.2Attributable to Cardinal Health, Inc.3Amortization of acquisition-related intangible assets is included in Amortization and other acquisition-related costs
© Copyright 2017, Cardinal Health, Inc. or one of its subsidiaries. All rights reserved
FY2017 OutlookThe company presents its outlook for fiscal 2017 non-GAAP EPS and non-GAAP effective tax rate on
the following pages. As previously disclosed, the company does not provide a GAAP EPS or GAAP
effective tax rate outlook because it is unable to reliably forecast many of the items that the company
excludes from GAAP EPS and effective tax rate to calculate them. See “Forward-Looking non-GAAP
Measures” following the attached schedules for additional information.
© Copyright 2017, Cardinal Health, Inc. or one of its subsidiaries. All rights reserved.9
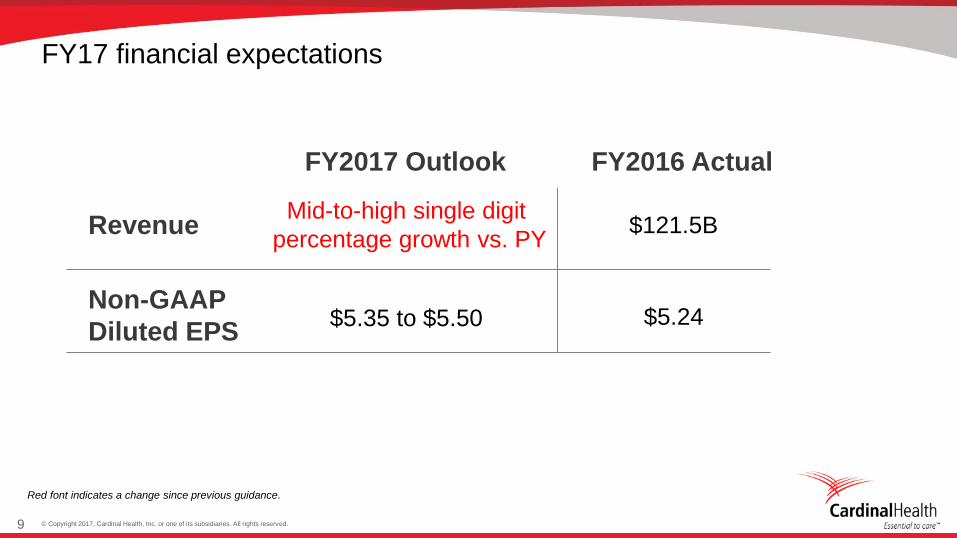
FY17 financial expectations
Revenue
Non-GAAP
Diluted EPS
FY2017 Outlook FY2016 Actual
$121.5BMid-to-high single digit
percentage growth vs. PY
$5.24$5.35 to $5.50
Red font indicates a change since previous guidance.
© Copyright 2017, Cardinal Health, Inc. or one of its subsidiaries. All rights reserved.10
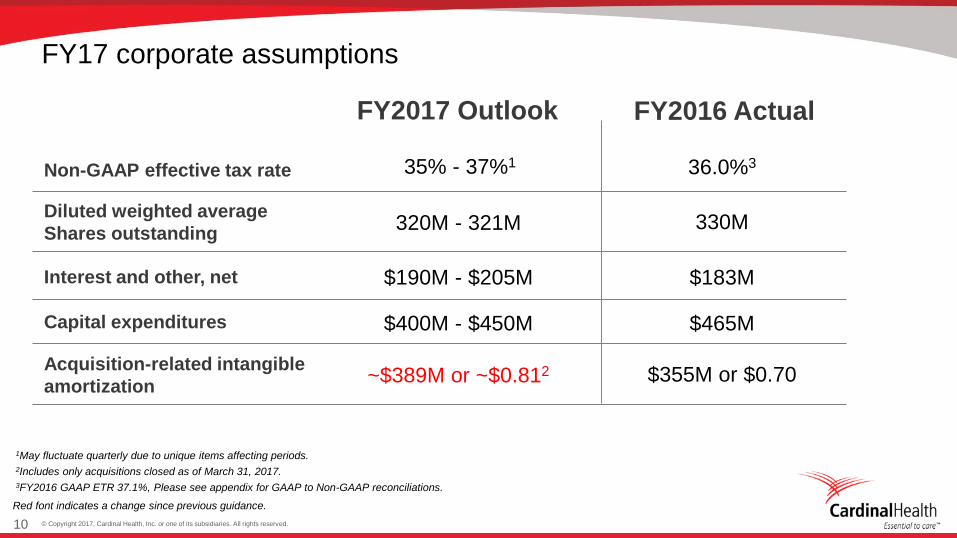
1May fluctuate quarterly due to unique items affecting periods.
2Includes only acquisitions closed as of March 31, 2017.
3FY2016 GAAP ETR 37.1%, Please see appendix for GAAP to Non-GAAP reconciliations.
FY17 corporate assumptions
Non-GAAP effective tax rate
FY2017 Outlook FY2016 Actual
320M - 321MDiluted weighted average
Shares outstanding
Interest and other, net
Capital expenditures
Acquisition-related intangible
amortization
35% - 37%1
$190M - $205M
$400M - $450M
~$389M or ~$0.812
36.0%3
330M
$183M
$465M
$355M or $0.70
Red font indicates a change since previous guidance.
© Copyright 2017, Cardinal Health, Inc. or one of its subsidiaries. All rights reserved.11
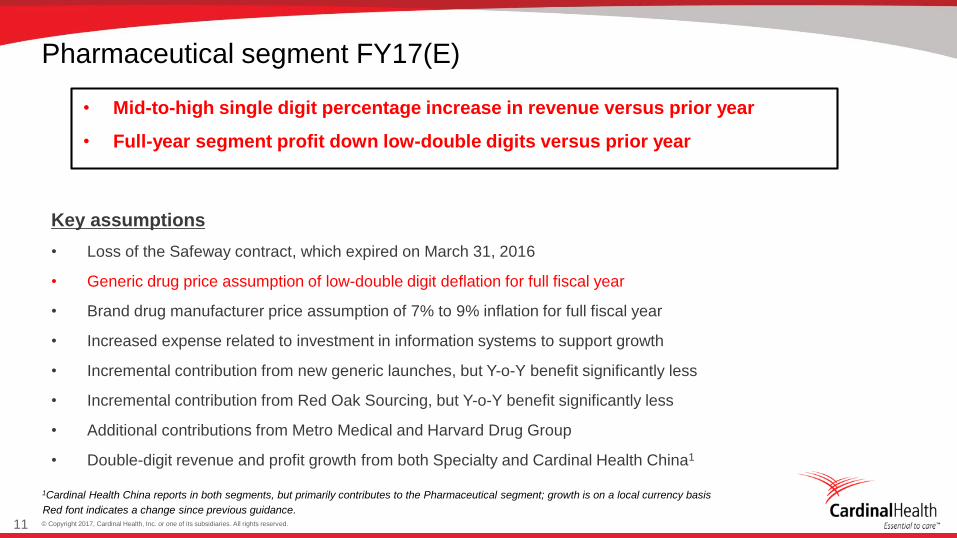
Pharmaceutical segment FY17(E)
Key assumptions
• Loss of the Safeway contract, which expired on March 31, 2016
• Generic drug price assumption of low-double digit deflation for full fiscal year
• Brand drug manufacturer price assumption of 7% to 9% inflation for full fiscal year
• Increased expense related to investment in information systems to support growth
• Incremental contribution from new generic launches, but Y-o-Y benefit significantly less
• Incremental contribution from Red Oak Sourcing, but Y-o-Y benefit significantly less
• Additional contributions from Metro Medical and Harvard Drug Group
• Double-digit revenue and profit growth from both Specialty and Cardinal Health China1
• Mid-to-high single digit percentage increase in revenue versus prior year
• Full-year segment profit down low-double digits versus prior year
1Cardinal Health China reports in both segments, but primarily contributes to the Pharmaceutical segment; growth is on a local currency basis
Red font indicates a change since previous guidance.
© Copyright 2017, Cardinal Health, Inc. or one of its subsidiaries. All rights reserved.12
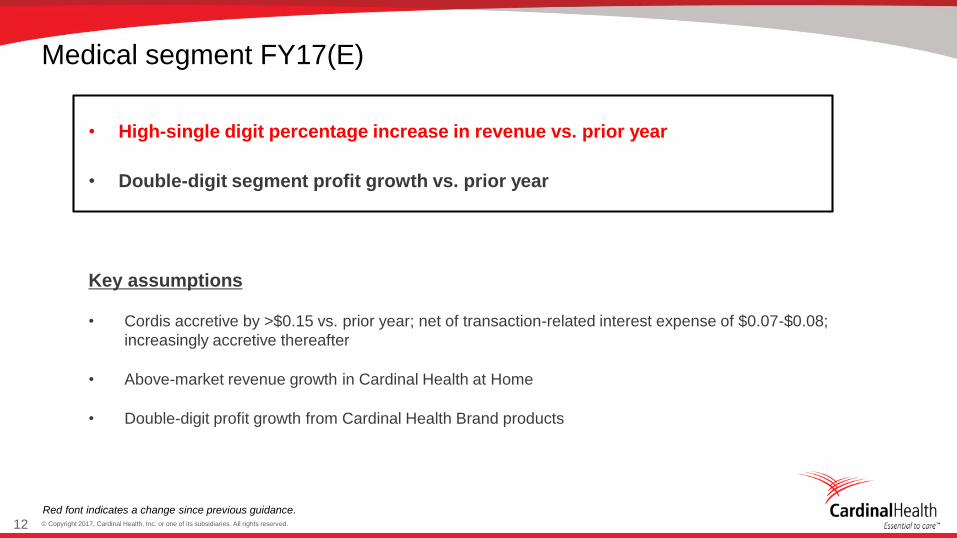
Medical segment FY17(E)
Key assumptions
• Cordis accretive by >$0.15 vs. prior year; net of transaction-related interest expense of $0.07-$0.08;
increasingly accretive thereafter
• Above-market revenue growth in Cardinal Health at Home
• Double-digit profit growth from Cardinal Health Brand products
• High-single digit percentage increase in revenue vs. prior year
• Double-digit segment profit growth vs. prior year
Red font indicates a change since previous guidance.
© Copyright 2017, Cardinal Health, Inc. or one of its subsidiaries. All rights reserved.13
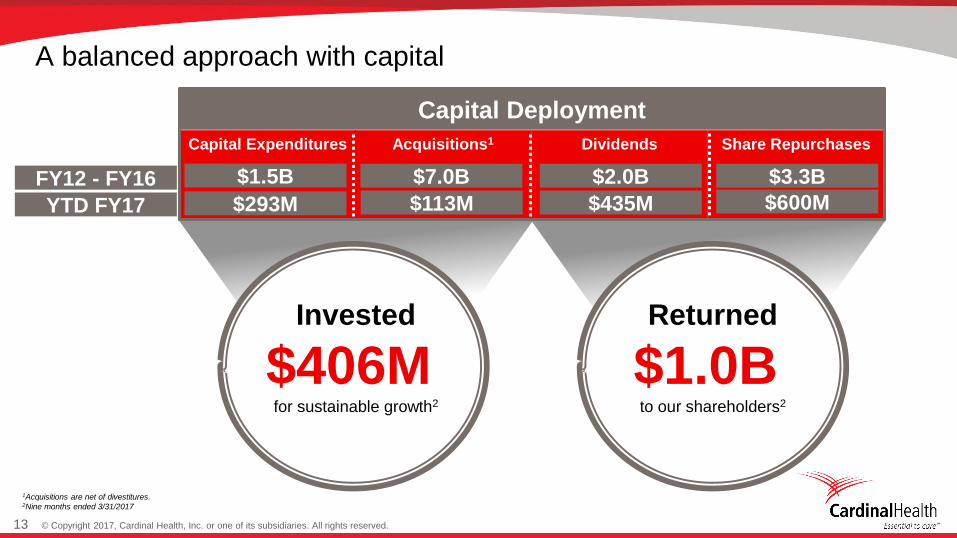
A balanced approach with capital
1Acquisitions are net of divestitures.2Nine months ended 3/31/2017
Capital Deployment
Capital Expenditures Acquisitions1 Dividends Share Repurchases
Invested
$406M for sustainable growth2
FY12 - FY16
YTD FY17
$1.5B
$293M
$7.0B
$113M
$2.0B
$435M
$3.3B
$600M
Returned
$1.0B to our shareholders2
© Copyright 2017, Cardinal Health, Inc. or one of its subsidiaries. All rights reserved
Q3 FY2017 trailing five quarters,
GAAP to Non-GAAP reconciliation statements
and supplemental financial information
Appendix
© Copyright 2017, Cardinal Health, Inc. or one of its subsidiaries. All rights reserved.15
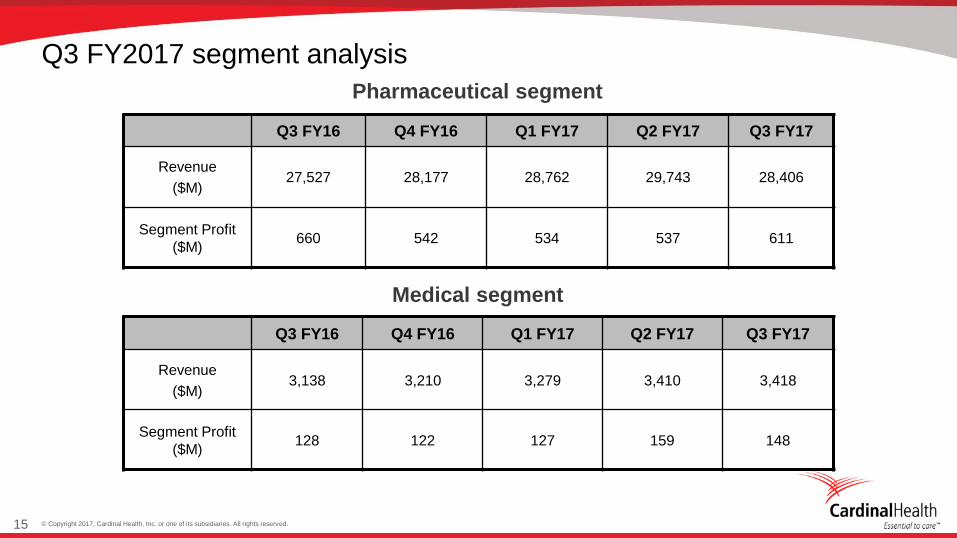
Q3 FY2017 segment analysis
Q3 FY16 Q4 FY16 Q1 FY17 Q2 FY17 Q3 FY17
Revenue
($M)27,527 28,177 28,762 29,743 28,406
Segment Profit
($M)660 542 534 537 611
Q3 FY16 Q4 FY16 Q1 FY17 Q2 FY17 Q3 FY17
Revenue
($M)3,138 3,210 3,279 3,410 3,418
Segment Profit
($M)128 122 127 159 148
Pharmaceutical segment
Medical segment
© Copyright 2017, Cardinal Health, Inc. or one of its subsidiaries. All rights reserved.16
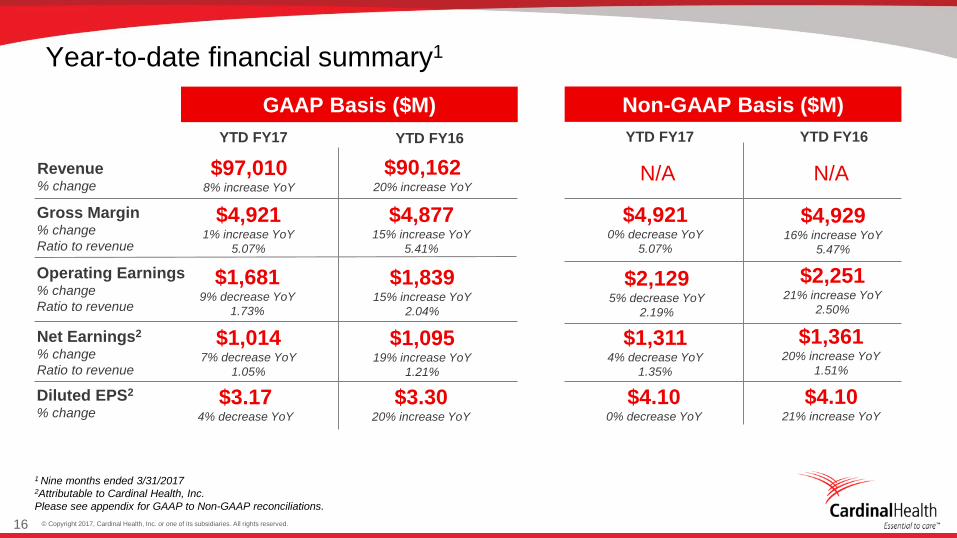
Year-to-date financial summary1
1 Nine months ended 3/31/20172Attributable to Cardinal Health, Inc.
Please see appendix for GAAP to Non-GAAP reconciliations.
$97,0108% increase YoY
GAAP Basis ($M)
$1,6819% decrease YoY
1.73%
$1,0147% decrease YoY
1.05%
$3.174% decrease YoY
Revenue% change
Operating Earnings% change
Ratio to revenue
Net Earnings2
% change
Ratio to revenue
Diluted EPS2
% change
$90,16220% increase YoY
YTD FY17 YTD FY16
$1,83915% increase YoY
2.04%
$1,09519% increase YoY
1.21%
$3.3020% increase YoY
Non-GAAP Basis ($M)
YTD FY17 YTD FY16
$2,1295% decrease YoY
2.19%
$1,3114% decrease YoY
1.35%
$4.100% decrease YoY
$2,25121% increase YoY
2.50%
$1,36120% increase YoY
1.51%
$4.1021% increase YoY
Gross Margin% change
Ratio to revenue
$4,9211% increase YoY
5.07%
$4,87715% increase YoY
5.41%
$4,9210% decrease YoY
5.07%
$4,92916% increase YoY
5.47%
N/A N/A
Gross
Margin Operating Provision for Net Diluted
Gross Growth Operating Earnings Earnings Before Income Net Earnings2 Diluted EPS2
Margin Rate Earnings Growth Rate Income Taxes Taxes Earnings2 Growth Rate EPS2,3,4 Growth Rate
(in millions, except per common share amounts)
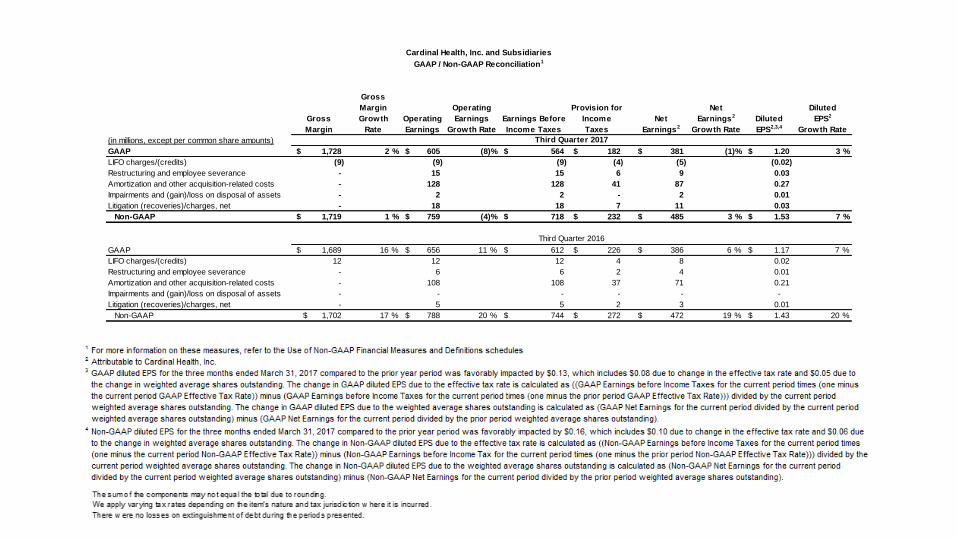
GAAP 1,728$ 2 % 605$ (8)% 564$ 182$ 381$ (1)% 1.20$ 3 %
LIFO charges/(credits) (9) (9) (9) (4) (5) (0.02)
Restructuring and employee severance - 15 15 6 9 0.03
Amortization and other acquisition-related costs - 128 128 41 87 0.27
Impairments and (gain)/loss on disposal of assets - 2 2 - 2 0.01
Litigation (recoveries)/charges, net - 18 18 7 11 0.03
Non-GAAP 1,719$ 1 % 759$ (4)% 718$ 232$ 485$ 3 % 1.53$ 7 %
GAAP 1,689$ 16 % 656$ 11 % 612$ 226$ 386$ 6 % 1.17$ 7 %
LIFO charges/(credits) 12 12 12 4 8 0.02
Restructuring and employee severance - 6 6 2 4 0.01
Amortization and other acquisition-related costs - 108 108 37 71 0.21
Impairments and (gain)/loss on disposal of assets - - - - - -
Litigation (recoveries)/charges, net - 5 5 2 3 0.01
Non-GAAP 1,702$ 17 % 788$ 20 % 744$ 272$ 472$ 19 % 1.43$ 20 %
Cardinal Health, Inc. and Subsidiaries
GAAP / Non-GAAP Reconciliation1
Third Quarter 2017
Third Quarter 2016
1 For more information on these measures, refer to the Use of Non-GAAP Financial Measures and Definitions schedules2 Attributable to Cardinal Health, Inc.
The sum of the components may not equal the total due to rounding.
There w ere no losses on extinguishment of debt during the periods presented.
We apply varying tax rates depending on the item’s nature and tax jurisdiction w here it is incurred.
Gross
Margin Operating Provision for Net Diluted
Gross Growth Operating Earnings Earnings Before Income Net Earnings2 Diluted EPS2
Margin Rate Earnings Growth Rate Income Taxes Taxes Earnings2 Growth Rate EPS2 Growth Rate
(in millions, except per common share amounts)
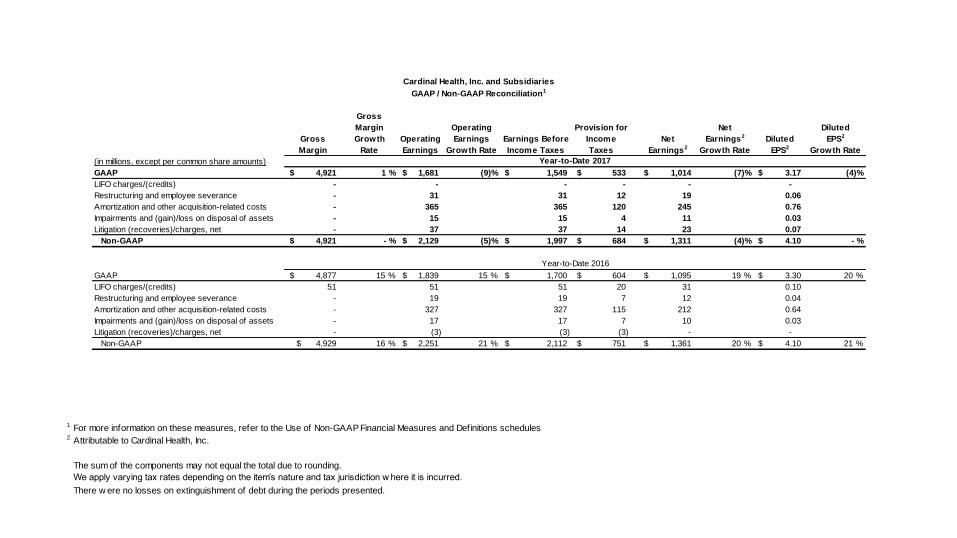
GAAP 4,921$ 1 % 1,681$ (9)% 1,549$ 533$ 1,014$ (7)% 3.17$ (4)%
LIFO charges/(credits) - - - - - -
Restructuring and employee severance - 31 31 12 19 0.06
Amortization and other acquisition-related costs - 365 365 120 245 0.76
Impairments and (gain)/loss on disposal of assets - 15 15 4 11 0.03
Litigation (recoveries)/charges, net - 37 37 14 23 0.07
Non-GAAP 4,921$ - % 2,129$ (5)% 1,997$ 684$ 1,311$ (4)% 4.10$ - %
GAAP 4,877$ 15 % 1,839$ 15 % 1,700$ 604$ 1,095$ 19 % 3.30$ 20 %
LIFO charges/(credits) 51 51 51 20 31 0.10
Restructuring and employee severance - 19 19 7 12 0.04
Amortization and other acquisition-related costs - 327 327 115 212 0.64
Impairments and (gain)/loss on disposal of assets - 17 17 7 10 0.03
Litigation (recoveries)/charges, net - (3) (3) (3) - -
Non-GAAP 4,929$ 16 % 2,251$ 21 % 2,112$ 751$ 1,361$ 20 % 4.10$ 21 %
Year-to-Date 2016
Cardinal Health, Inc. and Subsidiaries
GAAP / Non-GAAP Reconciliation1
Year-to-Date 2017
1 From continuing operations
2 Attributable to Cardinal Health, Inc.
The sum of the components may not equal the total due to rounding.
We apply varying tax rates depending on the item’s nature and tax jurisdiction where it is incurred.
Net Earnings
Net Earnings from
Operating Provision for from Continuing Diluted
Operating Earnings Earnings1 Before Income Continuing Operations2 Diluted EPS1,2
Earnings Growth Rate Income Taxes Taxes Operations2 Growth Rate EPS1,2 Growth Rate
(in millions, except per common share amounts)
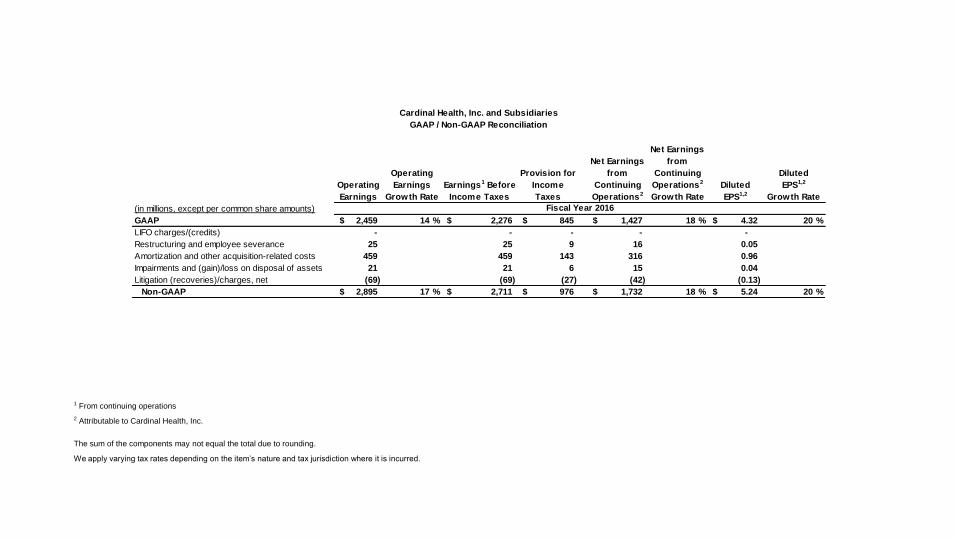
GAAP 2,459$ 14 % 2,276$ 845$ 1,427$ 18 % 4.32$ 20 %
LIFO charges/(credits) - - - - -
Restructuring and employee severance 25 25 9 16 0.05
Amortization and other acquisition-related costs 459 459 143 316 0.96
Impairments and (gain)/loss on disposal of assets 21 21 6 15 0.04
Litigation (recoveries)/charges, net (69) (69) (27) (42) (0.13)
Non-GAAP 2,895$ 17 % 2,711$ 976$ 1,732$ 18 % 5.24$ 20 %
Cardinal Health, Inc. and Subsidiaries
GAAP / Non-GAAP Reconciliation
Fiscal Year 2016
Refer to the GAAP/Non-GAAP reconciliation for definitions and calculations supporting the Non-GAAP balances.
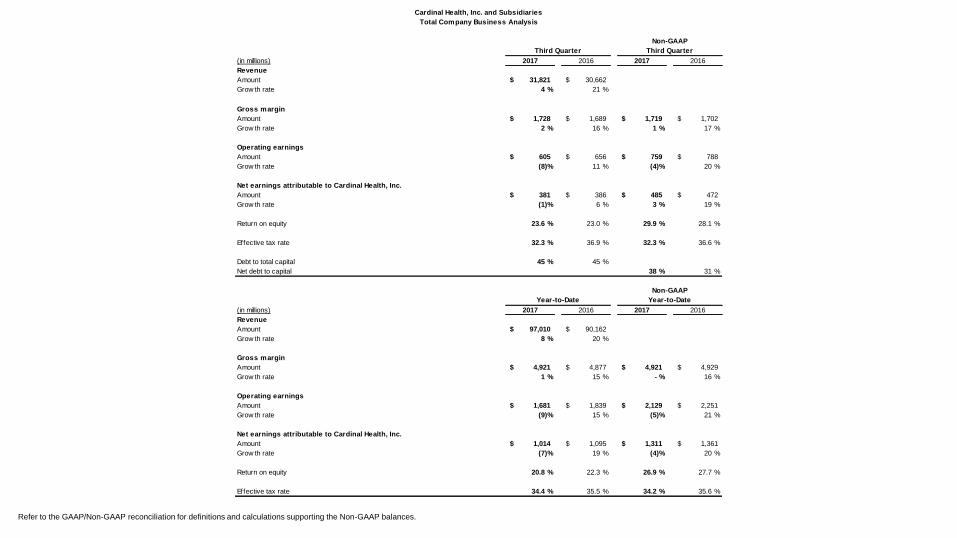
(in millions) 2017 2016 2017 2016
Revenue
Amount 31,821$ 30,662$
Grow th rate 4 % 21 %
Gross margin
Amount 1,728$ 1,689$ 1,719$ 1,702$
Grow th rate 2 % 16 % 1 % 17 %
Operating earnings
Amount 605$ 656$ 759$ 788$
Grow th rate (8)% 11 % (4)% 20 %
Net earnings attributable to Cardinal Health, Inc.
Amount 381$ 386$ 485$ 472$
Grow th rate (1)% 6 % 3 % 19 %
Return on equity 23.6 % 23.0 % 29.9 % 28.1 %
Effective tax rate 32.3 % 36.9 % 32.3 % 36.6 %
Debt to total capital 45 % 45 %
Net debt to capital 38 % 31 %
(in millions) 2017 2016 2017 2016
Revenue
Amount 97,010$ 90,162$
Grow th rate 8 % 20 %
Gross margin
Amount 4,921$ 4,877$ 4,921$ 4,929$
Grow th rate 1 % 15 % - % 16 %
Operating earnings
Amount 1,681$ 1,839$ 2,129$ 2,251$
Grow th rate (9)% 15 % (5)% 21 %
Net earnings attributable to Cardinal Health, Inc.
Amount 1,014$ 1,095$ 1,311$ 1,361$
Grow th rate (7)% 19 % (4)% 20 %
Return on equity 20.8 % 22.3 % 26.9 % 27.7 %
Effective tax rate 34.4 % 35.5 % 34.2 % 35.6 %
Cardinal Health, Inc. and Subsidiaries
Total Company Business Analysis
Year-to-Date Year-to-Date
Non-GAAP
Non-GAAP
Third Quarter Third Quarter
(in millions) 2017 2016 (in millions) 2017 2016
Pharmaceutical Medical
Revenue Revenue
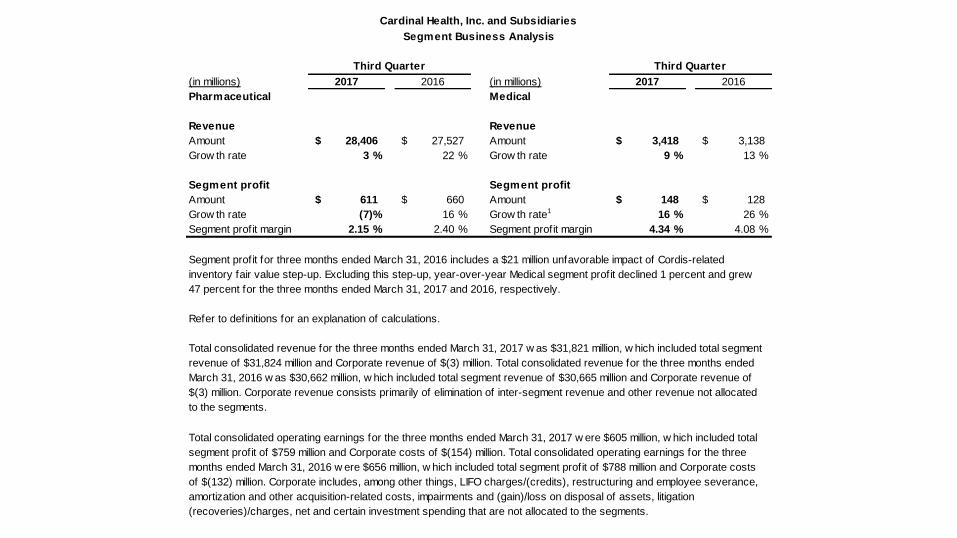
Amount 28,406$ 27,527$ Amount 3,418$ 3,138$
Grow th rate 3 % 22 % Grow th rate 9 % 13 %
Segment profit Segment profit
Amount 611$ 660$ Amount 148$ 128$
Grow th rate (7)% 16 % Grow th rate1 16 % 26 %
Segment profit margin 2.15 % 2.40 % Segment profit margin 4.34 % 4.08 %
Total consolidated operating earnings for the three months ended March 31, 2017 w ere $605 million, w hich included total
segment profit of $759 million and Corporate costs of $(154) million. Total consolidated operating earnings for the three
months ended March 31, 2016 w ere $656 million, w hich included total segment profit of $788 million and Corporate costs
of $(132) million. Corporate includes, among other things, LIFO charges/(credits), restructuring and employee severance,
amortization and other acquisition-related costs, impairments and (gain)/loss on disposal of assets, litigation
(recoveries)/charges, net and certain investment spending that are not allocated to the segments.
Cardinal Health, Inc. and Subsidiaries
Segment Business Analysis
Third Quarter Third Quarter
Total consolidated revenue for the three months ended March 31, 2017 w as $31,821 million, w hich included total segment
revenue of $31,824 million and Corporate revenue of $(3) million. Total consolidated revenue for the three months ended
March 31, 2016 w as $30,662 million, w hich included total segment revenue of $30,665 million and Corporate revenue of
$(3) million. Corporate revenue consists primarily of elimination of inter-segment revenue and other revenue not allocated
to the segments.
Refer to definitions for an explanation of calculations.
Segment profit for three months ended March 31, 2016 includes a $21 million unfavorable impact of Cordis-related
inventory fair value step-up. Excluding this step-up, year-over-year Medical segment profit declined 1 percent and grew
47 percent for the three months ended March 31, 2017 and 2016, respectively.
(in millions) 2017 2016 (in millions) 2017 2016
Pharmaceutical Medical
Revenue Revenue
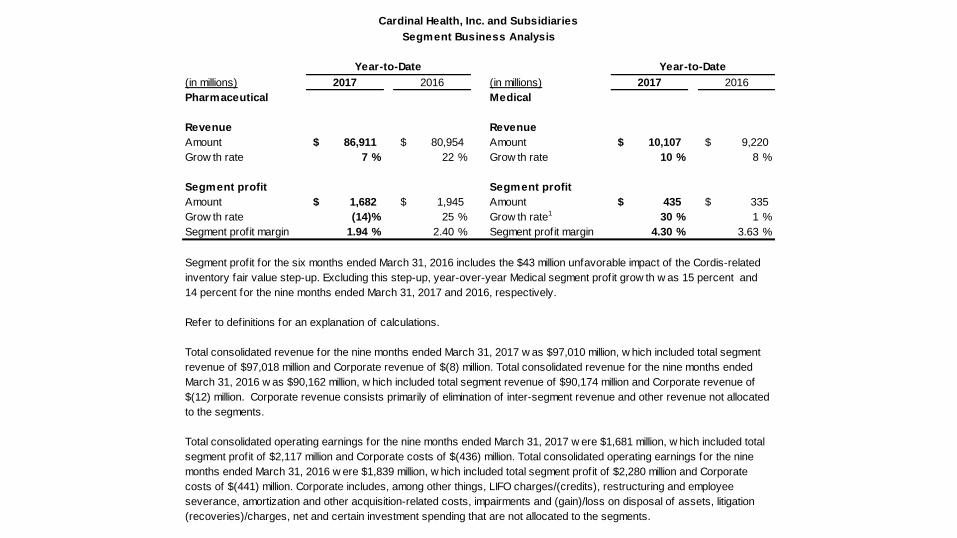
Amount 86,911$ 80,954$ Amount 10,107$ 9,220$
Grow th rate 7 % 22 % Grow th rate 10 % 8 %
Segment profit Segment profit
Amount 1,682$ 1,945$ Amount 435$ 335$
Grow th rate (14)% 25 % Grow th rate1 30 % 1 %
Segment profit margin 1.94 % 2.40 % Segment profit margin 4.30 % 3.63 %
Total consolidated revenue for the nine months ended March 31, 2017 w as $97,010 million, w hich included total segment
revenue of $97,018 million and Corporate revenue of $(8) million. Total consolidated revenue for the nine months ended
March 31, 2016 w as $90,162 million, w hich included total segment revenue of $90,174 million and Corporate revenue of
$(12) million. Corporate revenue consists primarily of elimination of inter-segment revenue and other revenue not allocated
to the segments.
Total consolidated operating earnings for the nine months ended March 31, 2017 w ere $1,681 million, w hich included total
segment profit of $2,117 million and Corporate costs of $(436) million. Total consolidated operating earnings for the nine
months ended March 31, 2016 w ere $1,839 million, w hich included total segment profit of $2,280 million and Corporate
costs of $(441) million. Corporate includes, among other things, LIFO charges/(credits), restructuring and employee
severance, amortization and other acquisition-related costs, impairments and (gain)/loss on disposal of assets, litigation
(recoveries)/charges, net and certain investment spending that are not allocated to the segments.
Cardinal Health, Inc. and Subsidiaries
Segment Business Analysis
Year-to-Date Year-to-Date
Refer to definitions for an explanation of calculations.
Segment profit for the six months ended March 31, 2016 includes the $43 million unfavorable impact of the Cordis-related
inventory fair value step-up. Excluding this step-up, year-over-year Medical segment profit grow th w as 15 percent and
14 percent for the nine months ended March 31, 2017 and 2016, respectively.
The sum of the components may not equal the total due to rounding.
We apply varying tax rates depending on the item’s nature and tax jurisdiction where it is incurred.
(in millions) 2017 2016
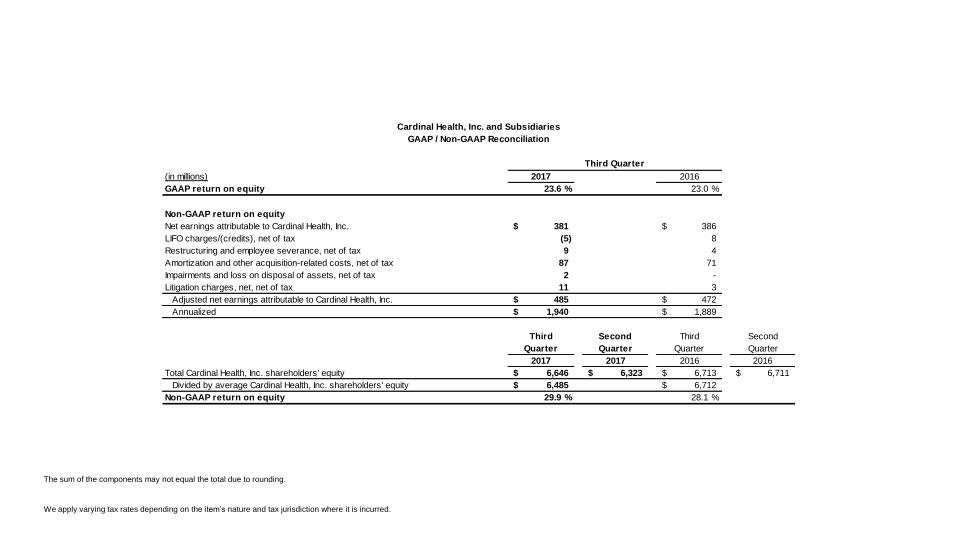
GAAP return on equity 23.6 % 23.0 %
Non-GAAP return on equity
Net earnings attributable to Cardinal Health, Inc. 381$ 386$
LIFO charges/(credits), net of tax (5) 8
Restructuring and employee severance, net of tax 9 4
Amortization and other acquisition-related costs, net of tax 87 71
Impairments and loss on disposal of assets, net of tax 2 -
Litigation charges, net, net of tax 11 3
Adjusted net earnings attributable to Cardinal Health, Inc. 485$ 472$
Annualized 1,940$ 1,889$
Third Second Third Second
Quarter Quarter Quarter Quarter
2017 2017 2016 2016
Total Cardinal Health, Inc. shareholders' equity 6,646$ 6,323$ 6,713$ 6,711$
Divided by average Cardinal Health, Inc. shareholders' equity 6,485$ 6,712$
Non-GAAP return on equity 29.9 % 28.1 %
Cardinal Health, Inc. and Subsidiaries
GAAP / Non-GAAP Reconciliation
Third Quarter
The sum of the components may not equal the total due to rounding.
We apply varying tax rates depending on the item’s nature and tax jurisdiction where it is incurred.
(in millions) 2017 2016
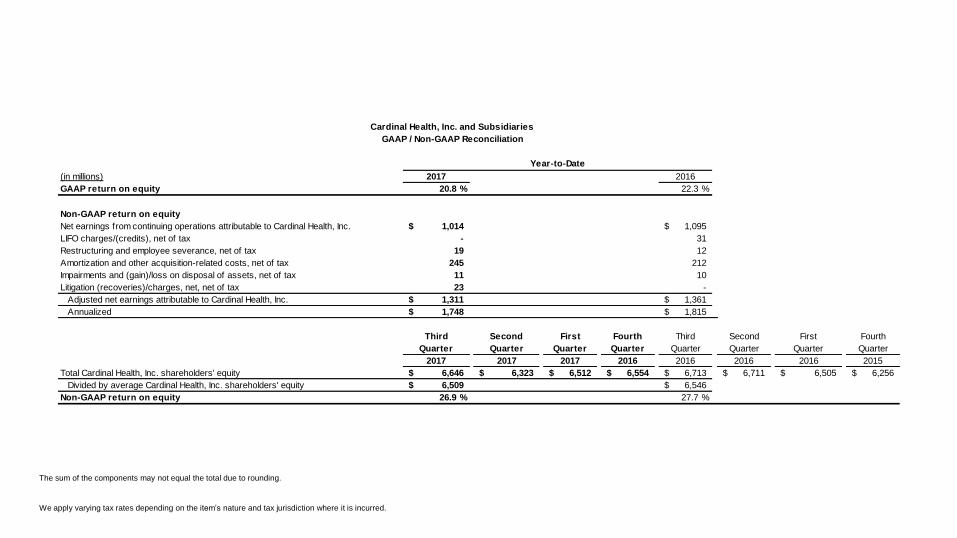
GAAP return on equity 20.8 % 22.3 %
Non-GAAP return on equity
Net earnings from continuing operations attributable to Cardinal Health, Inc. 1,014$ 1,095$
LIFO charges/(credits), net of tax - 31
Restructuring and employee severance, net of tax 19 12
Amortization and other acquisition-related costs, net of tax 245 212
Impairments and (gain)/loss on disposal of assets, net of tax 11 10
Litigation (recoveries)/charges, net, net of tax 23 -
Adjusted net earnings attributable to Cardinal Health, Inc. 1,311$ 1,361$
Annualized 1,748$ 1,815$
Third Second First Fourth Third Second First Fourth
Quarter Quarter Quarter Quarter Quarter Quarter Quarter Quarter
2017 2017 2017 2016 2016 2016 2016 2015
Total Cardinal Health, Inc. shareholders' equity 6,646$ 6,323$ 6,512$ 6,554$ 6,713$ 6,711$ 6,505$ 6,256$
Divided by average Cardinal Health, Inc. shareholders' equity 6,509$ 6,546$
Non-GAAP return on equity 26.9 % 27.7 %
Cardinal Health, Inc. and Subsidiaries
GAAP / Non-GAAP Reconciliation
Year-to-Date
The sum of the components may not equal the total due to rounding.
We apply varying tax rates depending on the item’s nature and tax jurisdiction where it is incurred.
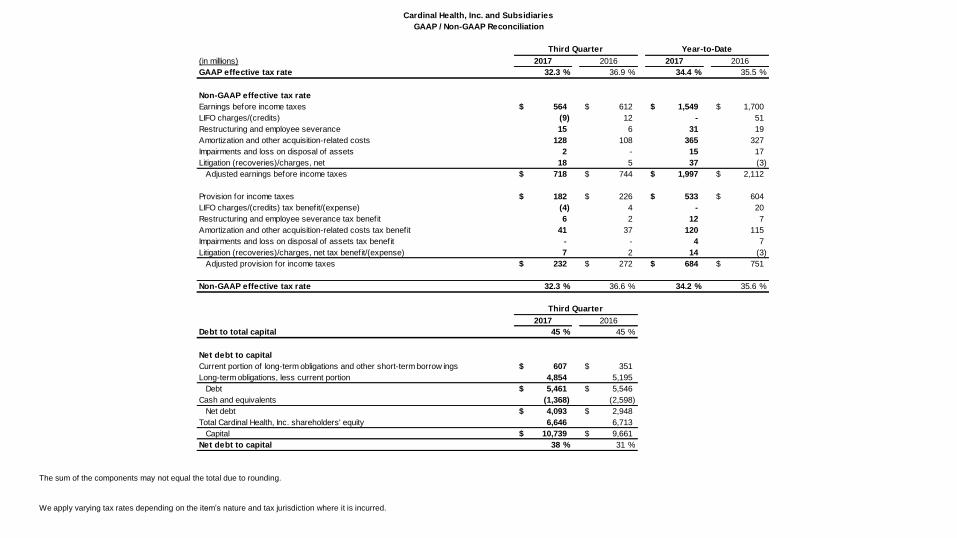
(in millions) 2017 2016 2017 2016
GAAP effective tax rate 32.3 % 36.9 % 34.4 % 35.5 %
Non-GAAP effective tax rate
Earnings before income taxes 564$ 612$ 1,549$ 1,700$
LIFO charges/(credits) (9) 12 - 51
Restructuring and employee severance 15 6 31 19
Amortization and other acquisition-related costs 128 108 365 327
Impairments and loss on disposal of assets 2 - 15 17
Litigation (recoveries)/charges, net 18 5 37 (3)
Adjusted earnings before income taxes 718$ 744$ 1,997$ 2,112$
Provision for income taxes 182$ 226$ 533$ 604$
LIFO charges/(credits) tax benefit/(expense) (4) 4 - 20
Restructuring and employee severance tax benefit 6 2 12 7
Amortization and other acquisition-related costs tax benefit 41 37 120 115
Impairments and loss on disposal of assets tax benefit - - 4 7
Litigation (recoveries)/charges, net tax benefit/(expense) 7 2 14 (3)
Adjusted provision for income taxes 232$ 272$ 684$ 751$
Non-GAAP effective tax rate 32.3 % 36.6 % 34.2 % 35.6 %
2017 2016
Debt to total capital 45 % 45 %
Net debt to capital
Current portion of long-term obligations and other short-term borrow ings 607$ 351$
Long-term obligations, less current portion 4,854 5,195
Debt 5,461$ 5,546$
Cash and equivalents (1,368) (2,598)
Net debt 4,093$ 2,948$
Total Cardinal Health, Inc. shareholders' equity 6,646 6,713
Capital 10,739$ 9,661$
Net debt to capital 38 % 31 %
Third Quarter
Cardinal Health, Inc. and Subsidiaries
GAAP / Non-GAAP Reconciliation
Year-to-DateThird Quarter
The sum of the components may not equal the total due to rounding.
We apply varying tax rates depending on the item’s nature and tax jurisdiction where it is incurred.
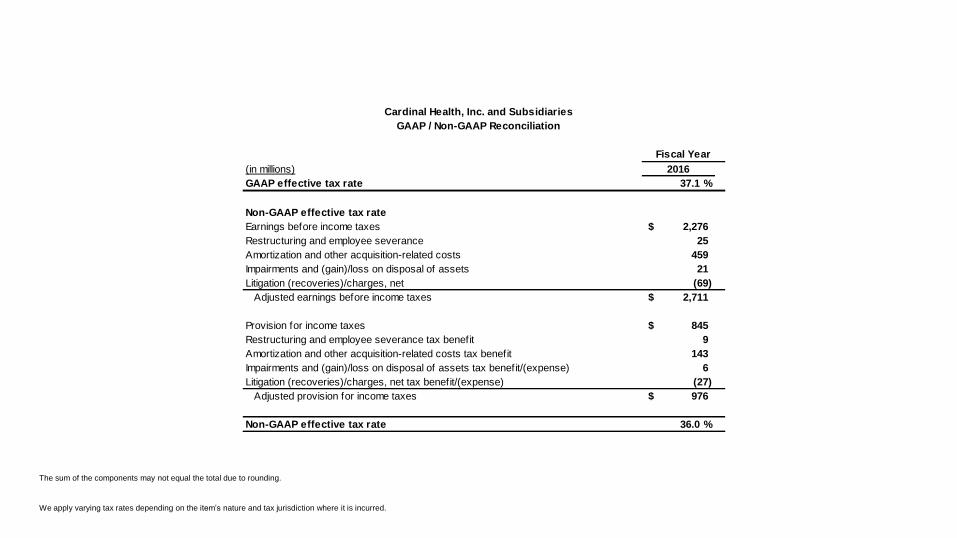
(in millions) 2016
GAAP effective tax rate 37.1 %
Non-GAAP effective tax rate
Earnings before income taxes 2,276$
Restructuring and employee severance 25
Amortization and other acquisition-related costs 459
Impairments and (gain)/loss on disposal of assets 21
Litigation (recoveries)/charges, net (69)
Adjusted earnings before income taxes 2,711$
Provision for income taxes 845$
Restructuring and employee severance tax benefit 9
Amortization and other acquisition-related costs tax benefit 143
Impairments and (gain)/loss on disposal of assets tax benefit/(expense) 6
Litigation (recoveries)/charges, net tax benefit/(expense) (27)
Adjusted provision for income taxes 976$
Non-GAAP effective tax rate 36.0 %
Cardinal Health, Inc. and Subsidiaries
GAAP / Non-GAAP Reconciliation
Fiscal Year
Cardinal Health, Inc. and Subsidiaries
Forward Looking non-GAAP Measures
In this presentation, the Company presents its outlook for fiscal 2017 non-GAAP EPS and non-GAAP Effective Tax Rate (ETR). The Company does not
provide EPS or ETR outlook, which are the most directly comparable GAAP measures to non-GAAP EPS and non-GAAP ETR, respectively, because
changes in the items that the Company excludes from GAAP EPS and GAAP ETR to calculate these measures can be dependent on future events that are
less capable of being controlled or reliably predicted by management and are not part of the Company’s routine operating activities. Additionally, due to their
unpredictability, management does not forecast many of the excluded items for internal use and therefore cannot create or rely on EPS or ETR outlook
numbers.
The timing and amount of any of the excluded items could significantly impact the Company’s fiscal 2017 EPS. Over the past five fiscal years, the excluded
items have lowered the Company’s EPS from $0.14 to $2.76, which includes a goodwill impairment charge of $2.32 per share related to our Nuclear
Pharmacy Services division that we recognized in fiscal 2013.
1The inventories of the Company's core pharmaceutical distribution facilities in the Pharmaceutical segment are valued at the lower of cost, using the LIFO method, or market. These charges or credits are included in cost of products sold, and represent
changes in the Company's LIFO inventory reserve.
2Programs by which the Company fundamentally changes its operations such as closing and consolidating facilities, moving manufacturing of a product to another location, production or business process sourcing, employee severance (including
rationalizing headcount or other significant changes in personnel), and realigning operations (including realignment of the management structure of a business unit in response to changing market conditions).
3Costs that consist primarily of amortization of acquisition-related intangible assets, transaction costs, integration costs, and changes in the fair value of contingent consideration obligations.
4Asset impairments and (gains)/losses from the disposal of assets not eligible to be classified as discontinued operations are classified within impairments and (gain)/loss on disposal of assets within the condensed consolidated statements of earnings.
5Loss contingencies related to litigation and regulatory matters and income from favorable resolution of legal matters.
6Charges related to the make-whole premium on the redemption of notes.
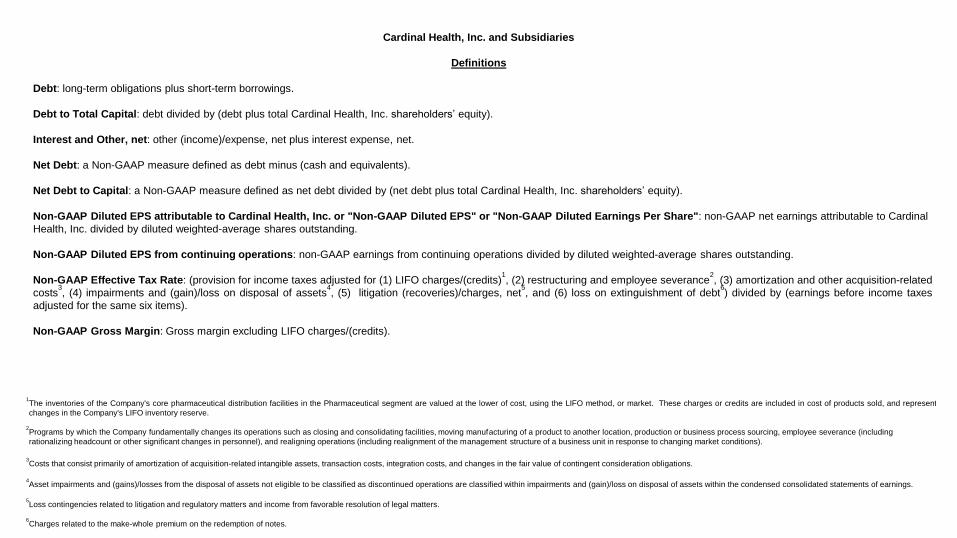
Cardinal Health, Inc. and Subsidiaries
Definitions
Debt: long-term obligations plus short-term borrowings.
Debt to Total Capital: debt divided by (debt plus total Cardinal Health, Inc. shareholders’ equity).
Interest and Other, net: other (income)/expense, net plus interest expense, net.
Net Debt: a Non-GAAP measure defined as debt minus (cash and equivalents).
Net Debt to Capital: a Non-GAAP measure defined as net debt divided by (net debt plus total Cardinal Health, Inc. shareholders’ equity).
Non-GAAP Diluted EPS attributable to Cardinal Health, Inc. or "Non-GAAP Diluted EPS" or "Non-GAAP Diluted Earnings Per Share": non-GAAP net earnings attributable to Cardinal
Health, Inc. divided by diluted weighted-average shares outstanding.
Non-GAAP Diluted EPS from continuing operations: non-GAAP earnings from continuing operations divided by diluted weighted-average shares outstanding.
Non-GAAP Effective Tax Rate: (provision for income taxes adjusted for (1) LIFO charges/(credits)1, (2) restructuring and employee severance
2, (3) amortization and other acquisition-related
costs3, (4) impairments and (gain)/loss on disposal of assets
4, (5) litigation (recoveries)/charges, net
5, and (6) loss on extinguishment of debt
6) divided by (earnings before income taxes
adjusted for the same six items).
Non-GAAP Gross Margin: Gross margin excluding LIFO charges/(credits).
Cardinal Health, Inc. and Subsidiaries
Definitions
Non-GAAP Net Earnings attributable to Cardinal Health, Inc. or "Non-GAAP Net Earnings": net earnings attributable to Cardinal Health, Inc. excluding (1) LIFO
charges/(credits), (2) restructuring and employee severance, (3) amortization and other acquisition-related costs, (4) impairments and (gain)/loss on disposal of assets, (5)
litigation (recoveries)/charges, net, and (6) loss on extinguishment of debt, each net of tax.
Non-GAAP Earnings from Continuing Operations: earnings from continuing operations excluding (1) LIFO charges/(credits), (2) restructuring and employee severance,
(3) amortization and other acquisition-related costs, (4) impairments and (gain)/loss on disposal of assets, (5) litigation (recoveries)/charges, net, and (6) loss on
extinguishment of debt, each net of tax.
Non-GAAP Operating Earnings: operating earnings excluding (1) LIFO charges/(credits), (2) restructuring and employee severance, (3) amortization and other acquisition-
related costs, (4) impairments and (gain)/loss on disposal of assets, (5) litigation (recoveries)/charges, net.
Non-GAAP Return on Equity: (annualized current period net earnings attributable to Cardinal Health, Inc. excluding (1) LIFO charges/(credits), (2) restructuring and
employee severance, (3) amortization and other acquisition-related costs, (4) impairments and (gain)/loss on disposal of assets, (5) litigation (recoveries)/charges, net, and
(6) loss on extinguishment of debt, each net of tax) divided by average Cardinal Health, Inc. shareholders’ equity.
Return on Equity: annualized current period net earnings attributable to Cardinal Health, Inc. divided by average Cardinal Health, Inc. shareholders’ equity.
Segment Profit: segment revenue minus (segment cost of products sold and segment distribution, selling, general, and administrative expenses).
Segment Profit Margin: segment profit divided by segment revenue.