3q11 results - fleury medicina e saúderi.fleury.com.br/fleury/web/arquivos/3q11...
TRANSCRIPT
TODOS OS DIREITOS RESERVADOS – 2011
3Q11 Results
November, 2011
FLRY3
The 15th most innovative Brazilian company by
“Epoca Negocios” magazine.
Disclaimer
This presentation may contain forward-looking statements. Such statements are not statements ofhistorical facts and reflect the beliefs and expectations of the Company s management. The words“anticipates”, “believes”, “estimates”, “expects”, “forecasts”, “plans”, “predicts”, “project”, “targets”and similar words are intended to identify these statements, which necessarily involve known andunknown risks and uncertainties. Known risks and uncertainties include but are not limited to theimpact of competitive services and pricing market acceptance of services, service transactions by theCompany and its competitors, regulatory approval, currency fluctuations, changes in service mixoffered, and other risks described in the Company s registration statement. Forward-lookingstatements speak only as of the date they are made and the Fleury Group does not undertake anyobligation to update them in light of new information or future developments.
All figures are compared to 3Q2010
except when stated otherwise

Operational Highlights
3
The new areas “Customer Intimacy” and “Organizational Culture” have been added tothe structure, reporting directly to the CEO. The reason is to reinforce the clear linkbetween growth and improved relationship with clients and physicians.
Grupo Fleury launched the Corporate University’s new building, with 1600 m2 and acapacity to train 300 persons simultaneously. This initiative reflects one of Grupo Fleury’smost important beliefs: to allow the Company to keep Sustainable Growth whileestablishing leading edge quality standards and reinforcing market differentiation.
On August 15th, Capital Research and Management Company became owner of 5.03% ofFleury’s shares.
On August 29th, the Company hosted the first “Fleury Investor’s Day”
at its headquarters in São Paulo. The event was attended by 92
investors and analysts.
On September 1st, Mr. Mauro Figueiredo resigned as Chairman of the Board in order topursue new career challenges. Mr. José Gilberto H. Vieira, Board’s Vice-President and“Core Participações” President, has taken the role as Chairman of the Board. Moreover,two new board members were elected on October 31st: Mr. Jorge Moll and Ms. VivienNavarro Rosso.
On October 6th, Grupo Fleury was considered one of the twenty most innovativecompanies in Brazil by “Época Negócios” Magazine, in partnership with A.T. Kearneyconsultancy.
Operational Highlights
4
Financial Highlights
5
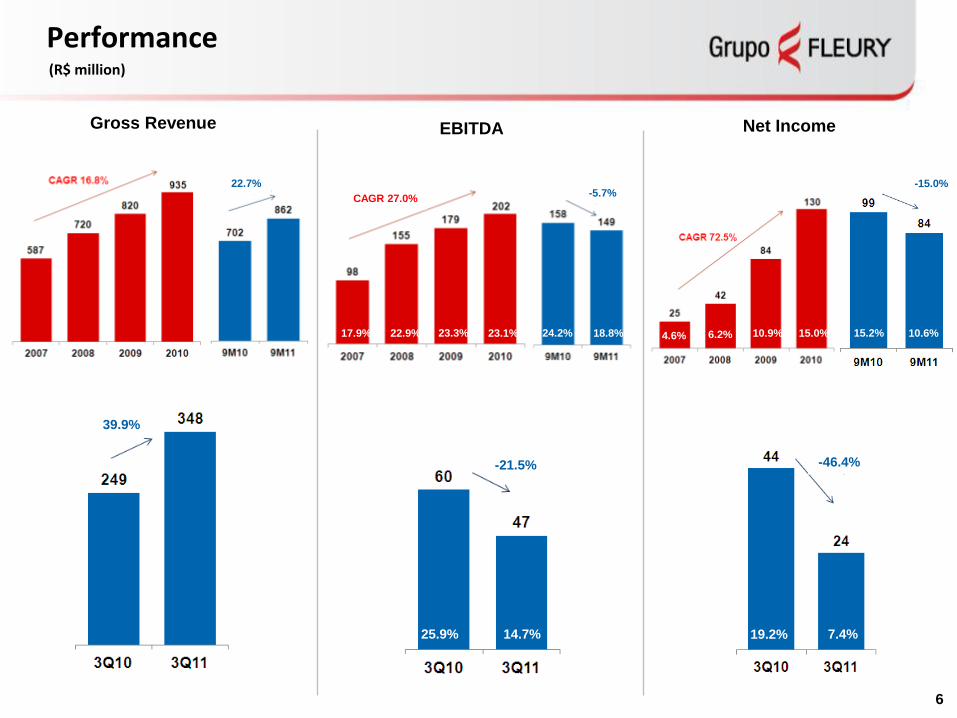
Consolidated Gross Revenue increases by 39.9% to R$ 348 million, or 16.9% if weexclude Labs D’Or figures. Organic growth achieves 13.7%.
PSC: + 44.4% ; organic growth: + 12.7%
Operations in Hospitals: + 25.2%
Reference Laboratory: -4.1%
Preventive Medicine: + 24.2%
Gross profit in 3Q11 achieves R$ 120 million, 37.6% of Net Revenue.
General and Administrative expenses (ex-depreciation) represents 19.2% of NetRevenues.
EBITDA R$ 47.1 million. Margin on Net Revenue of 14.7%. EBITDA margin would be816bps higher if we exclude the non-recurring expenses.
Net income to Fleury’s shareholders achieves R$ 24 million (R$ 0.18 per share), 7.4%margin on net revenue.
Performance(R$ million)
6
Gross Revenue EBITDA Net Income
25.9% 14.7% 19.2% 7.4%
17.9% 22.9% 23.3% 23.1% 24.2% 18.8% 4.6% 6.2% 10.9% 15.0% 15.2% 10.6%
22.7%
39.9%
-5.7%
-21.5%
-15.0%
-46.4%
CAGR 27.0%
7
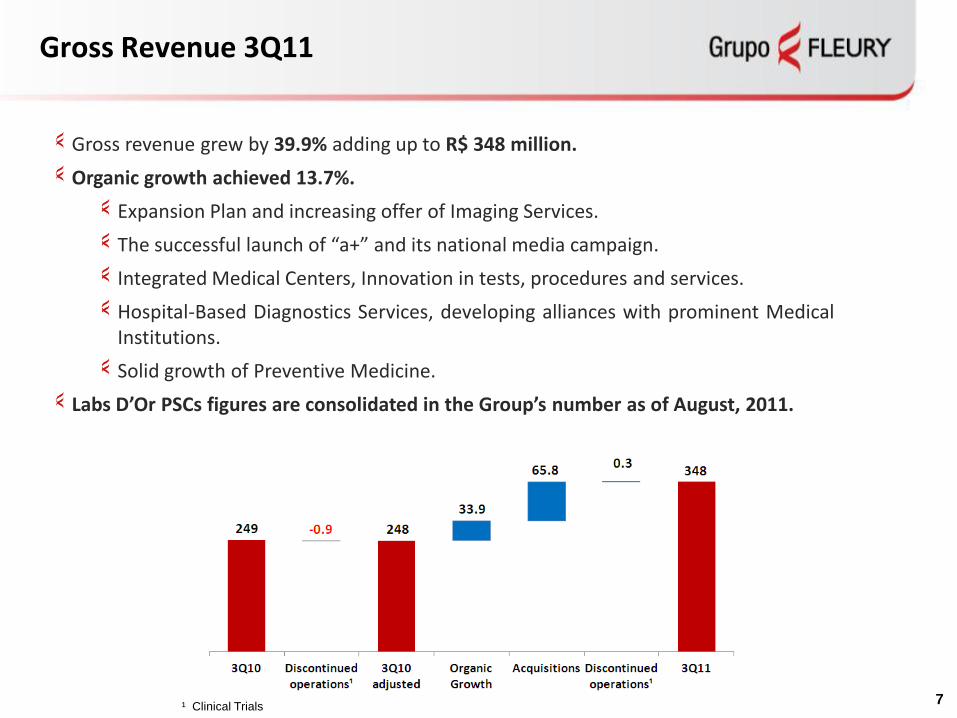
Gross Revenue 3Q11
¹ Clinical Trials
Gross revenue grew by 39.9% adding up to R$ 348 million.
Organic growth achieved 13.7%.
Expansion Plan and increasing offer of Imaging Services.
The successful launch of “a+” and its national media campaign.
Integrated Medical Centers, Innovation in tests, procedures and services.
Hospital-Based Diagnostics Services, developing alliances with prominent MedicalInstitutions.
Solid growth of Preventive Medicine.
Labs D’Or PSCs figures are consolidated in the Group’s number as of August, 2011.
8
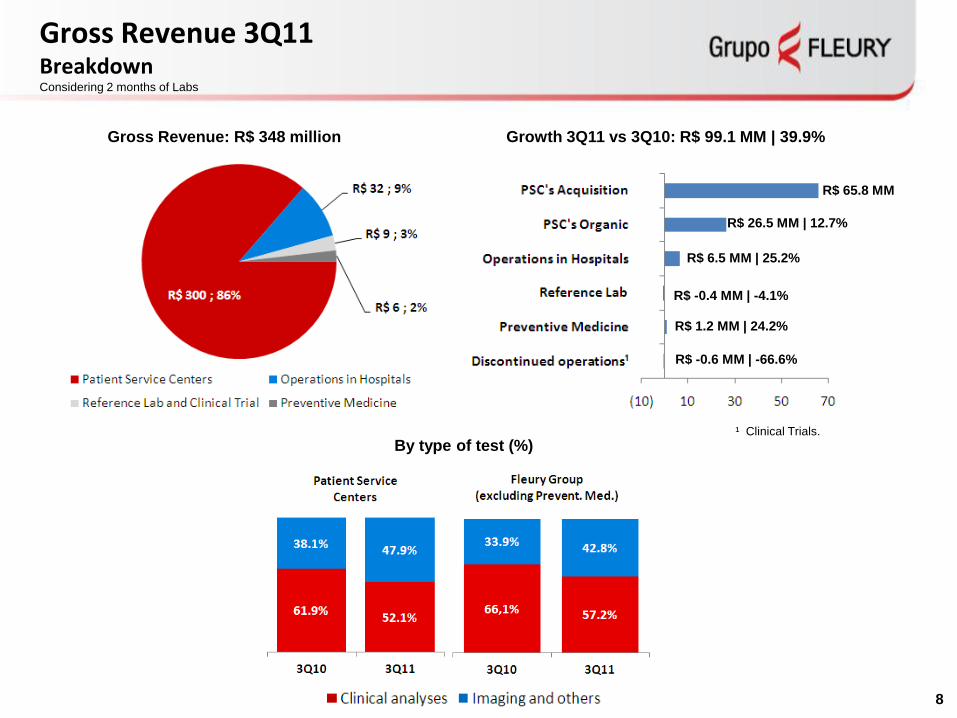
Gross Revenue 3Q11 Breakdown
Gross Revenue: R$ 348 million Growth 3Q11 vs 3Q10: R$ 99.1 MM | 39.9%
R$ 65.8 MM
R$ 6.5 MM | 25.2%
R$ -0.4 MM | -4.1%
R$ 1.2 MM | 24.2%
R$ -0.6 MM | -66.6%
¹ Clinical Trials.
R$ 26.5 MM | 12.7%
Considering 2 months of Labs
By type of test (%)
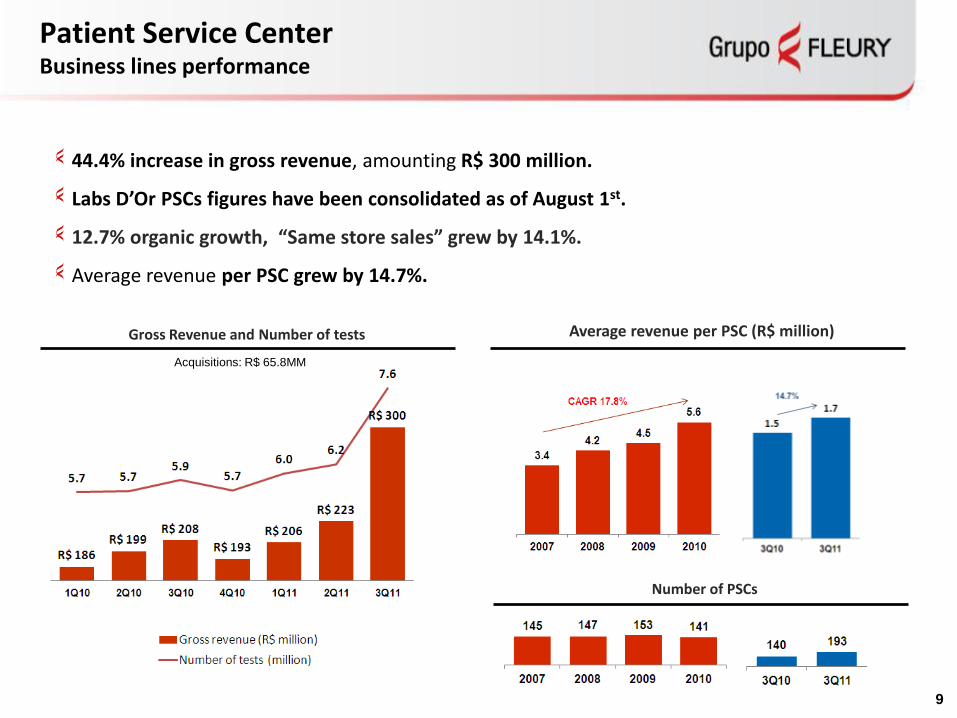
Patient Service CenterBusiness lines performance
44.4% increase in gross revenue, amounting R$ 300 million.
Labs D’Or PSCs figures have been consolidated as of August 1st.
12.7% organic growth, “Same store sales” grew by 14.1%.
Average revenue per PSC grew by 14.7%.
Gross Revenue and Number of tests
9
Average revenue per PSC (R$ million)
Number of PSCs
Acquisitions: R$ 65.8MM
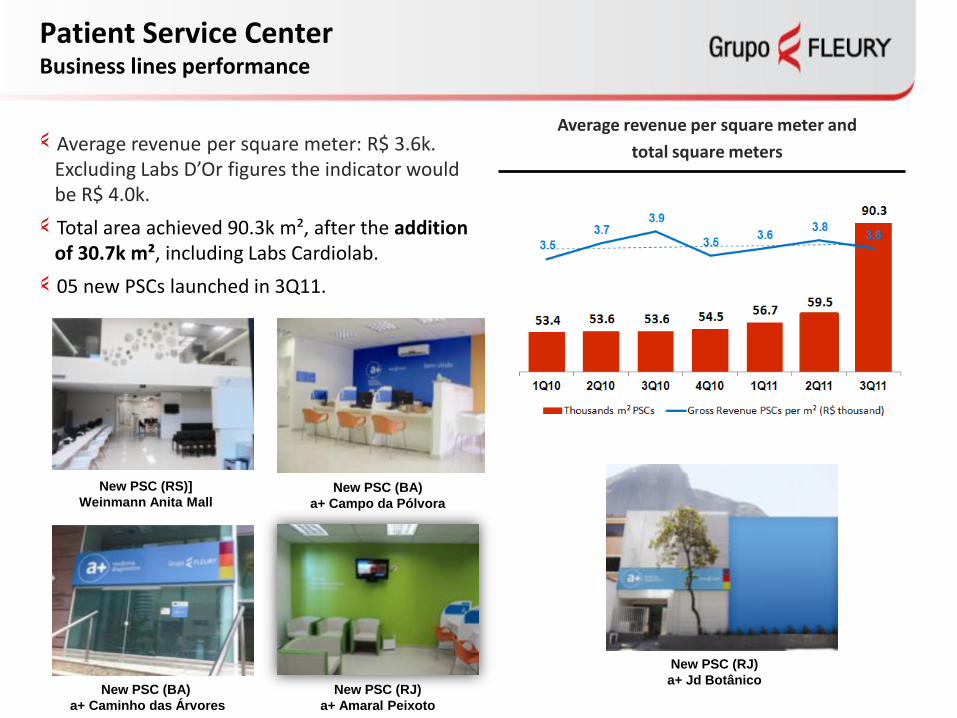
Patient Service CenterBusiness lines performance
Average revenue per square meter: R$ 3.6k. Excluding Labs D’Or figures the indicator would be R$ 4.0k.
Total area achieved 90.3k m², after the addition of 30.7k m², including Labs Cardiolab.
05 new PSCs launched in 3Q11.
Average revenue per square meter and
total square meters
New PSC (RS)]
Weinmann Anita Mall
New PSC (RJ)
a+ Jd BotânicoNew PSC (RJ)
a+ Amaral Peixoto
New PSC (BA)
a+ Caminho das Árvores
New PSC (BA)
a+ Campo da Pólvora
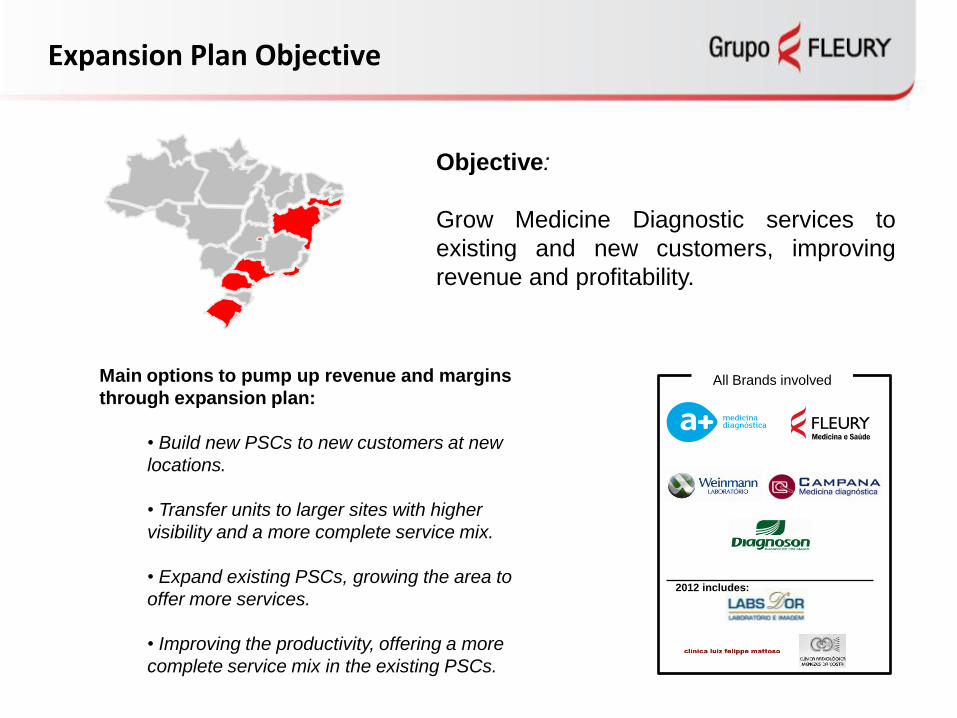
Expansion Plan Objective
All Brands involved
2012 includes:
Main options to pump up revenue and margins
through expansion plan:
• Build new PSCs to new customers at new
locations.
• Transfer units to larger sites with higher
visibility and a more complete service mix.
• Expand existing PSCs, growing the area to
offer more services.
• Improving the productivity, offering a more
complete service mix in the existing PSCs.
Objective:
Grow Medicine Diagnostic services to
existing and new customers, improving
revenue and profitability.
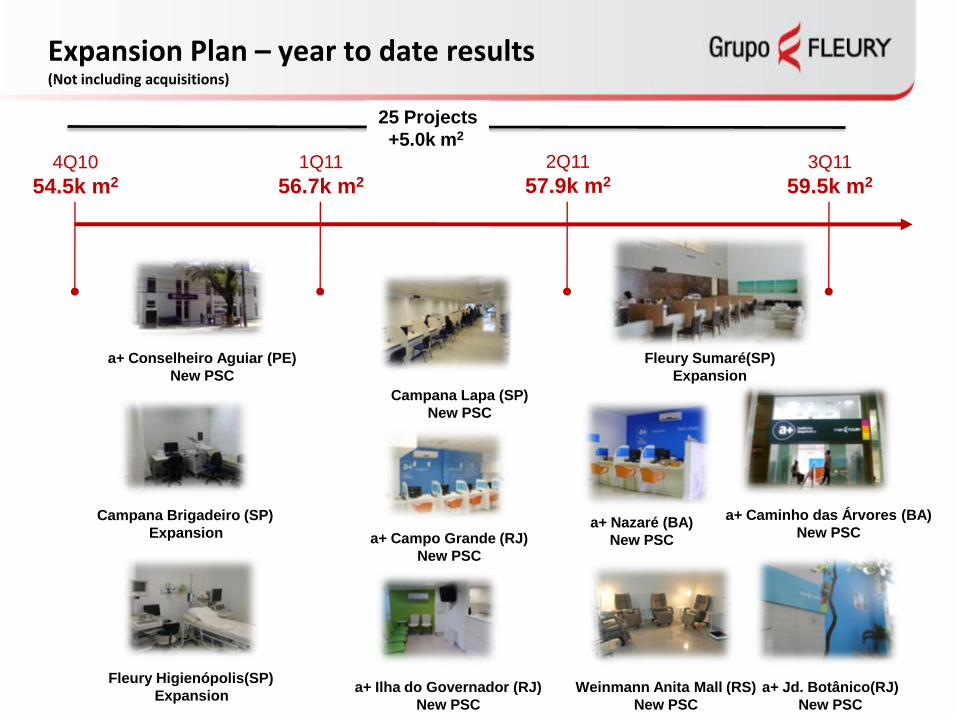
Expansion Plan – year to date results(Not including acquisitions)
4Q10
54.5k m2
1Q11
56.7k m2
2Q11
57.9k m2
3Q11
59.5k m2
a+ Conselheiro Aguiar (PE)
New PSC
Campana Brigadeiro (SP)
Expansion
Campana Lapa (SP)
New PSC
a+ Campo Grande (RJ)
New PSC
a+ Ilha do Governador (RJ)
New PSC
Fleury Sumaré(SP)
Expansion
a+ Nazaré (BA)
New PSC
a+ Jd. Botânico(RJ)
New PSC
a+ Caminho das Árvores (BA)
New PSC
Weinmann Anita Mall (RS)
New PSC
Fleury Higienópolis(SP)
Expansion
25 Projects
+5.0k m2
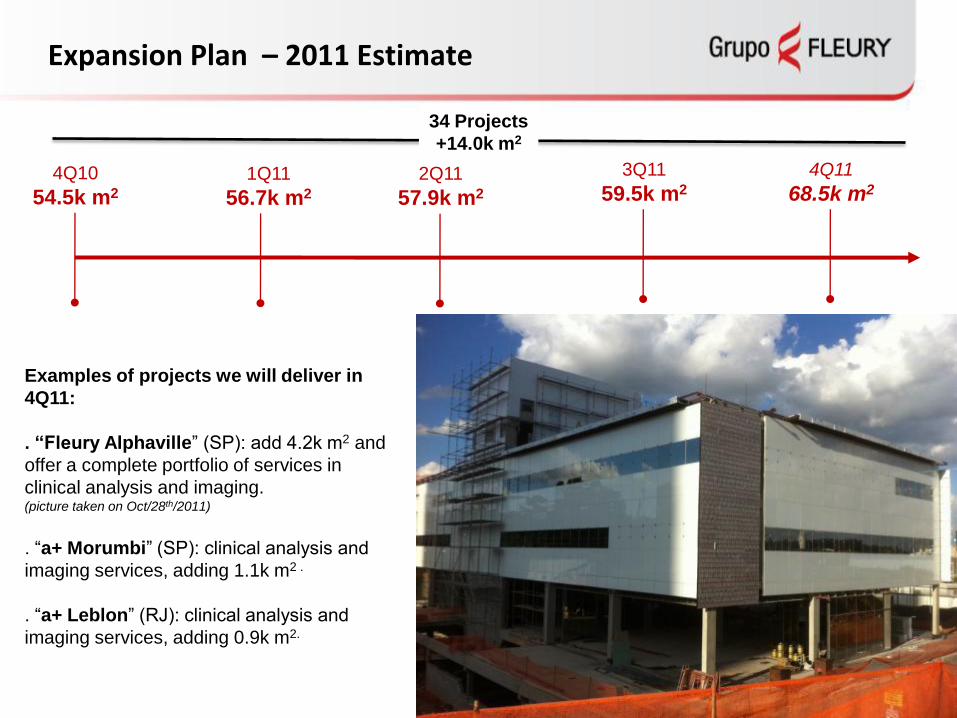
Expansion Plan – 2011 Estimate
4Q10
54.5k m2
1Q11
56.7k m2
2Q11
57.9k m2
3Q11
59.5k m2
34 Projects
+14.0k m2
4Q11
68.5k m2
Examples of projects we will deliver in
4Q11:
. “Fleury Alphaville” (SP): add 4.2k m2 and
offer a complete portfolio of services in
clinical analysis and imaging. (picture taken on Oct/28th/2011)
. “a+ Morumbi” (SP): clinical analysis and
imaging services, adding 1.1k m2 .
. “a+ Leblon” (RJ): clinical analysis and
imaging services, adding 0.9k m2.
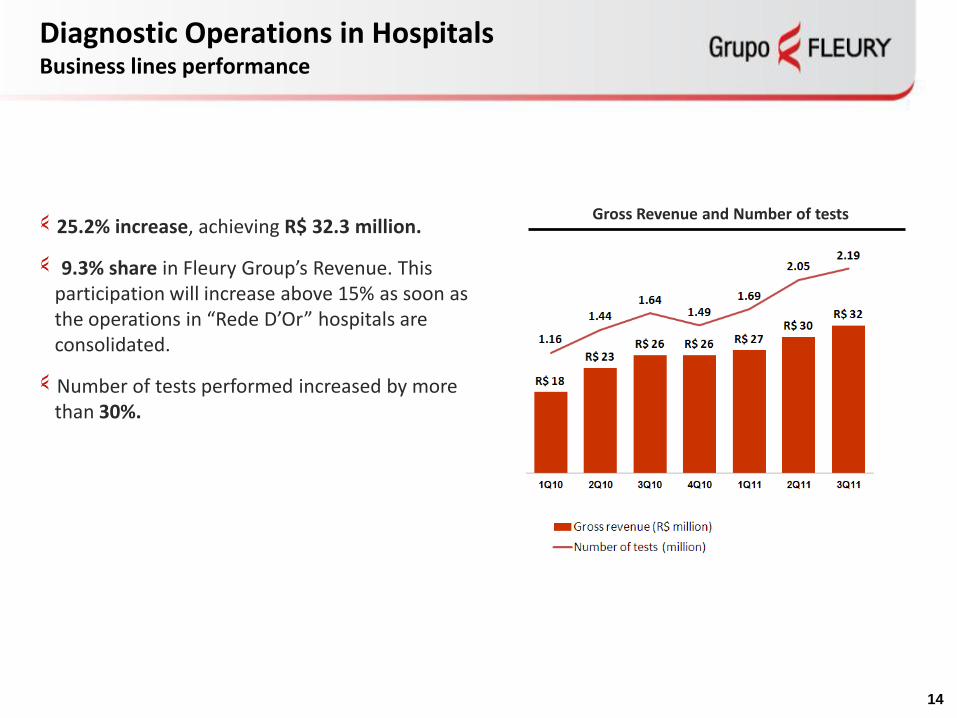
Diagnostic Operations in HospitalsBusiness lines performance
25.2% increase, achieving R$ 32.3 million.
9.3% share in Fleury Group’s Revenue. This participation will increase above 15% as soon as the operations in “Rede D’Or” hospitals are consolidated.
Number of tests performed increased by more than 30%.
14
Gross Revenue and Number of tests
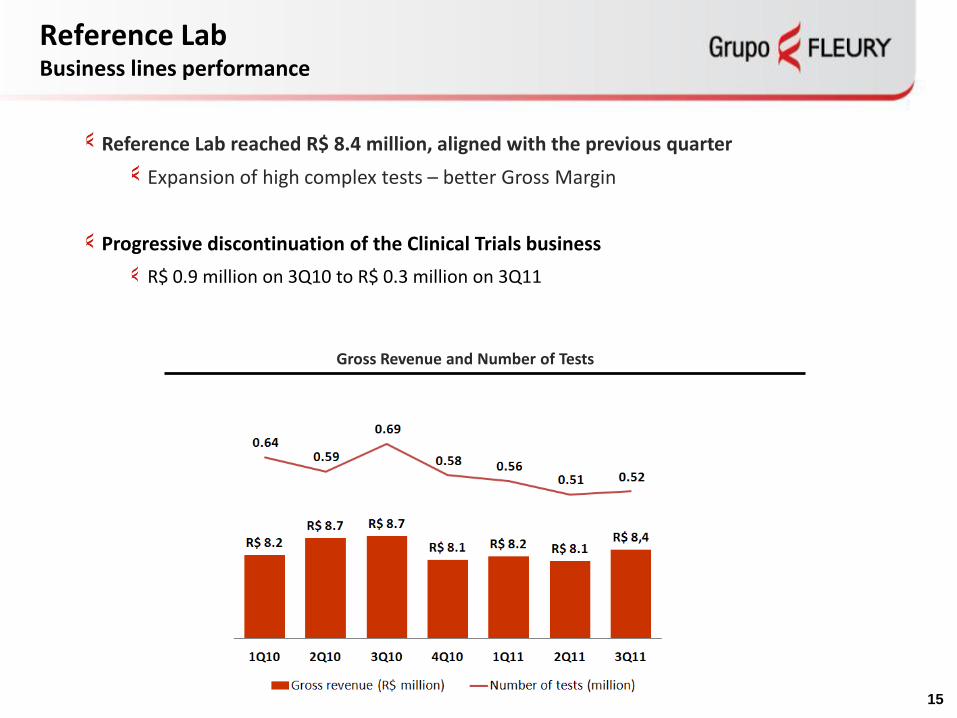
Reference Lab Business lines performance
15
Reference Lab reached R$ 8.4 million, aligned with the previous quarter
Expansion of high complex tests – better Gross Margin
Progressive discontinuation of the Clinical Trials business
R$ 0.9 million on 3Q10 to R$ 0.3 million on 3Q11
Gross Revenue and Number of Tests
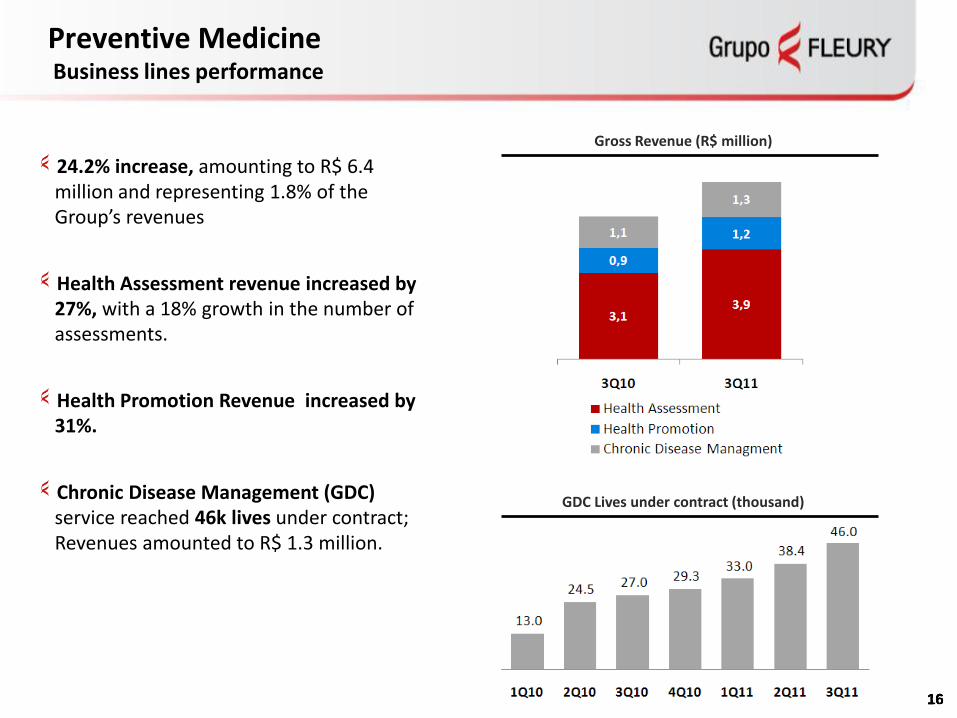
Preventive MedicineBusiness lines performance
1616
24.2% increase, amounting to R$ 6.4 million and representing 1.8% of the Group’s revenues
Health Assessment revenue increased by 27%, with a 18% growth in the number of assessments.
Health Promotion Revenue increased by 31%.
Chronic Disease Management (GDC) service reached 46k lives under contract; Revenues amounted to R$ 1.3 million.
1616
Gross Revenue (R$ million)
GDC Lives under contract (thousand)
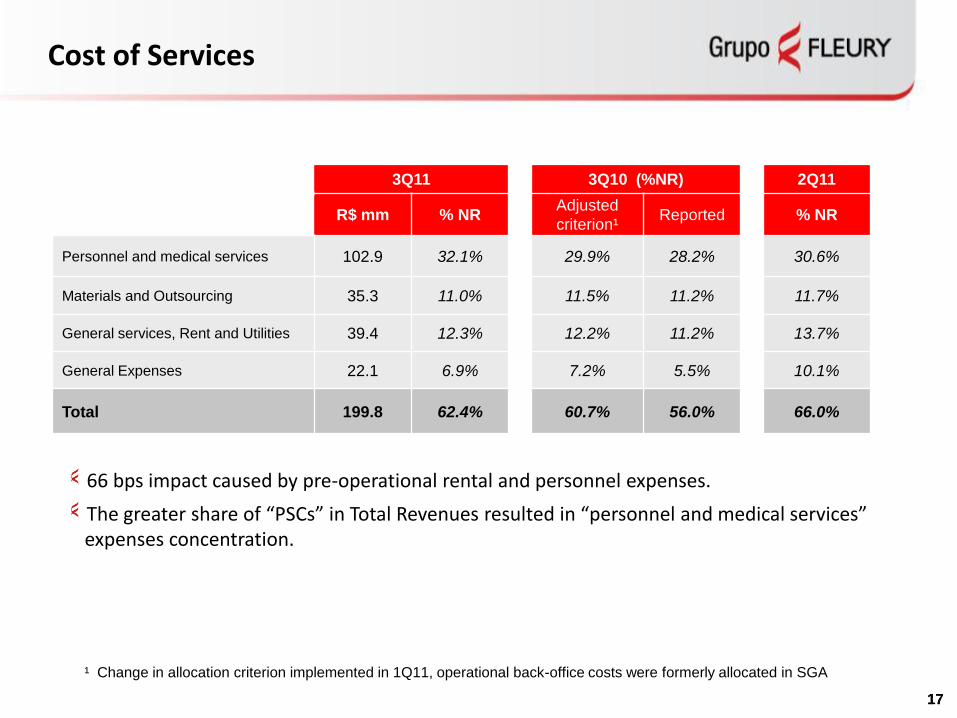
Cost of Services
1717
3Q11 3Q10 (%NR) 2Q11
R$ mm % NRAdjusted
criterion¹Reported % NR
Personnel and medical services 102.9 32.1% 29.9% 28.2% 30.6%
Materials and Outsourcing 35.3 11.0% 11.5% 11.2% 11.7%
General services, Rent and Utilities 39.4 12.3% 12.2% 11.2% 13.7%
General Expenses 22.1 6.9% 7.2% 5.5% 10.1%
Total 199.8 62.4% 60.7% 56.0% 66.0%
¹ Change in allocation criterion implemented in 1Q11, operational back-office costs were formerly allocated in SGA
66 bps impact caused by pre-operational rental and personnel expenses.
The greater share of “PSCs” in Total Revenues resulted in “personnel and medical services” expenses concentration.

Gross Margin
1818
Gross profit has reached R$ 120.3 million, a 32% increase over adjusted 3Q10
37.6% of Net Revenue (170 bps decrease)
Gross Margin to Net Revenue
Benefit by cost line, normalizing allocation criterion (%)

Operating Expenses
1919
Non recurring events:
“a+” Marketing campaign amounted approximately R$ 6 million, an impact of 187bps in margin.
“Labs D’or” acquisition fees were R$ 8 million, or a 250bps impact in margin.
The cash recovery effort net impact was 250bps as receivables written-off.
Depreciation – R$ 19.3 million, compared to R$ 8.3 million in 3Q10. Assets write-off have an impact of R$ 5.8 million in this quarter.
¹ Change in allocation criterion implemented in 1Q11, operational back-office costs were formerly allocated in SGA
3Q11 3Q10 (%NR) 2Q11
R$ mm % NRAdjusted
criterion¹Reported % NR
General and administrative 61.5 19.2% 15.2% 19.9% 11.7%
Other operating expenses (revenue), net 12.0 3.7% (0.4%) (0.4%) 0.7%
Contingency provision (0.3) (0.1%) (1.4%) (1.4%) 0.5%
Operating Expenses (ex-depreciation) 73.2 22.9% 13.4% 18.1% 12.9%
Net Income to Fleury’s Shareholders
2020
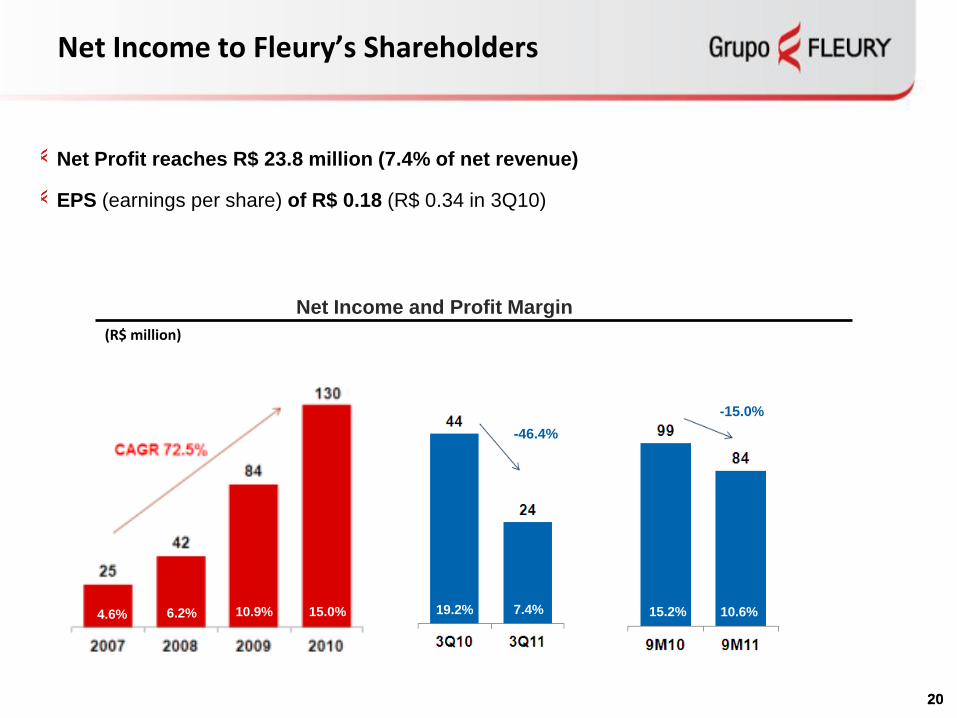
Net Profit reaches R$ 23.8 million (7.4% of net revenue)
EPS (earnings per share) of R$ 0.18 (R$ 0.34 in 3Q10)
Net Income and Profit Margin
(R$ million)
19.2% 7.4%4.6% 6.2% 10.9% 15.0% 15.2% 10.6%
-15.0%
-46.4%
EBITDA
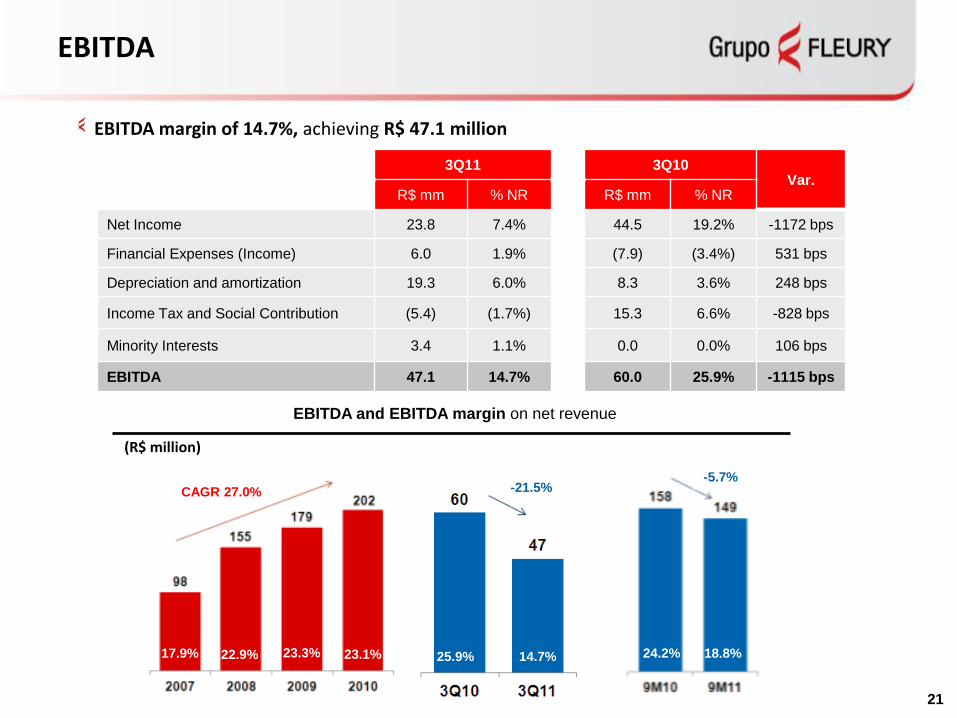
EBITDA margin of 14.7%, achieving R$ 47.1 million
EBITDA and EBITDA margin on net revenue
21
3Q11 3Q10Var.
R$ mm % NR R$ mm % NR
Net Income 23.8 7.4% 44.5 19.2% -1172 bps
Financial Expenses (Income) 6.0 1.9% (7.9) (3.4%) 531 bps
Depreciation and amortization 19.3 6.0% 8.3 3.6% 248 bps
Income Tax and Social Contribution (5.4) (1.7%) 15.3 6.6% -828 bps
Minority Interests 3.4 1.1% 0.0 0.0% 106 bps
EBITDA 47.1 14.7% 60.0 25.9% -1115 bps
(R$ million)
25.9% 14.7%17.9% 22.9% 23.3% 23.1% 24.2% 18.8%
-5.7%-21.5%CAGR 27.0%
EBITDA Analysis
17.9% 22.9%
22
23.1% 21.9%22.0%
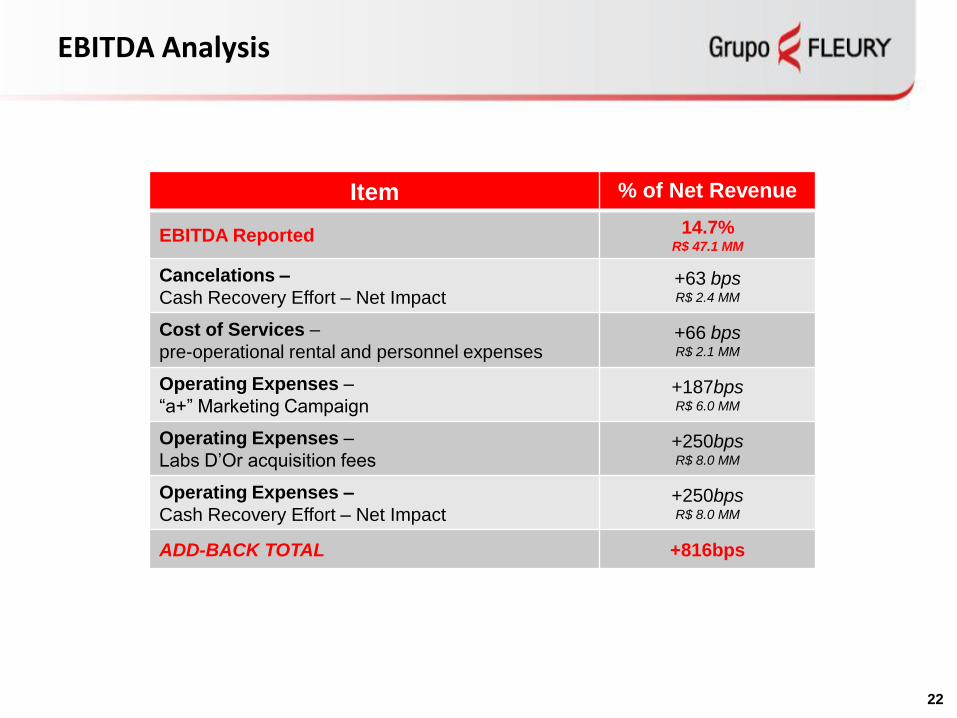
Item % of Net Revenue
EBITDA Reported 14.7%R$ 47.1 MM
Cancelations –
Cash Recovery Effort – Net Impact+63 bpsR$ 2.4 MM
Cost of Services –
pre-operational rental and personnel expenses+66 bpsR$ 2.1 MM
Operating Expenses –
“a+” Marketing Campaign+187bpsR$ 6.0 MM
Operating Expenses –
Labs D’Or acquisition fees+250bpsR$ 8.0 MM
Operating Expenses –
Cash Recovery Effort – Net Impact+250bpsR$ 8.0 MM
ADD-BACK TOTAL +816bps
Cash Flow, Investments and Return
2323
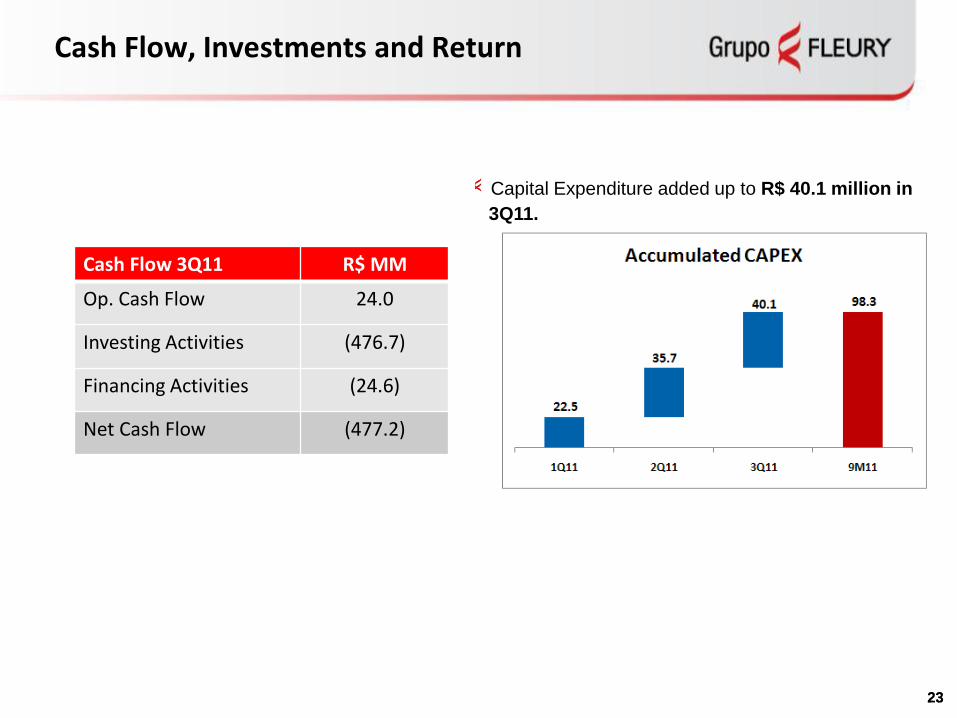
Capital Expenditure added up to R$ 40.1 million in
3Q11.
Cash Flow 3Q11 R$ MM
Op. Cash Flow 24.0
Investing Activities (476.7)
Financing Activities (24.6)
Net Cash Flow (477.2)
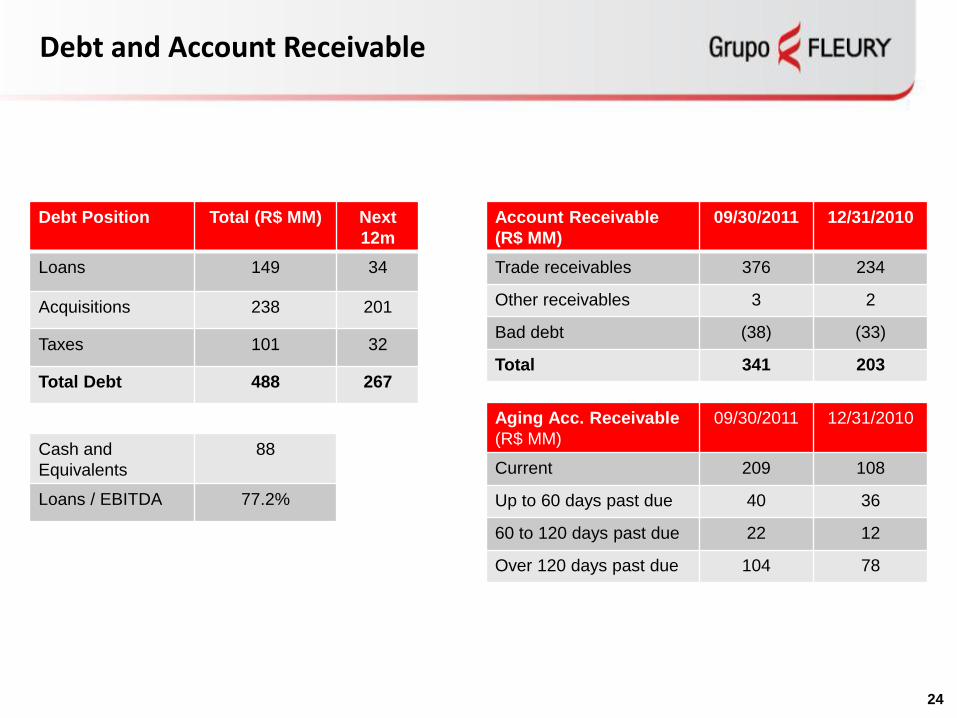
Debt and Account Receivable
Debt Position Total (R$ MM) Next
12m
Loans 149 34
Acquisitions 238 201
Taxes 101 32
Total Debt 488 267
Cash and
Equivalents
88
Loans / EBITDA 77.2%
24
Account Receivable
(R$ MM)
09/30/2011 12/31/2010
Trade receivables 376 234
Other receivables 3 2
Bad debt (38) (33)
Total 341 203
Aging Acc. Receivable
(R$ MM)
09/30/2011 12/31/2010
Current 209 108
Up to 60 days past due 40 36
60 to 120 days past due 22 12
Over 120 days past due 104 78
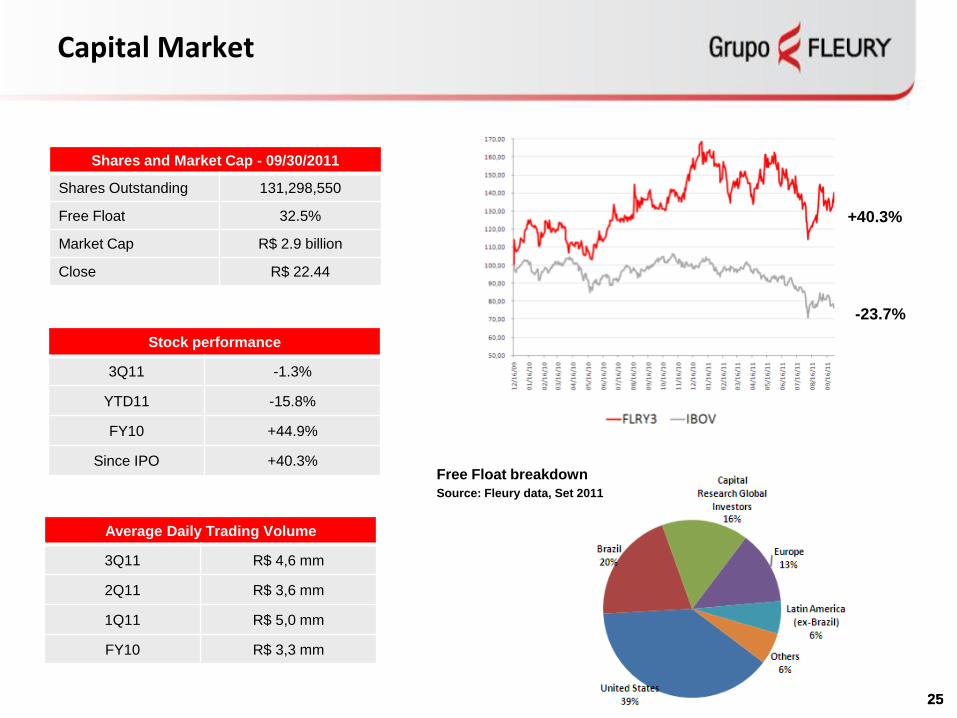
Capital Market
2525
+40.3%
-23.7%
Shares and Market Cap - 09/30/2011
Shares Outstanding 131,298,550
Free Float 32.5%
Market Cap R$ 2.9 billion
Close R$ 22.44
Stock performance
3Q11 -1.3%
YTD11 -15.8%
FY10 +44.9%
Since IPO +40.3%
Average Daily Trading Volume
3Q11 R$ 4,6 mm
2Q11 R$ 3,6 mm
1Q11 R$ 5,0 mm
FY10 R$ 3,3 mm
Free Float breakdown
Source: Fleury data, Set 2011
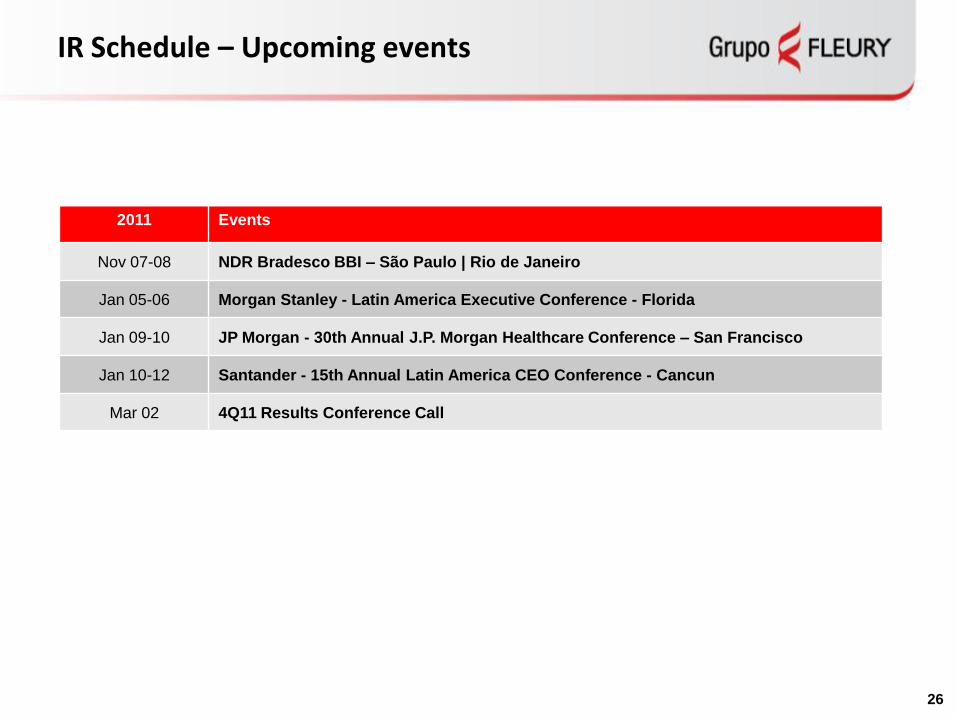
IR Schedule – Upcoming events
2011 Events
Nov 07-08 NDR Bradesco BBI – São Paulo | Rio de Janeiro
Jan 05-06 Morgan Stanley - Latin America Executive Conference - Florida
Jan 09-10 JP Morgan - 30th Annual J.P. Morgan Healthcare Conference – San Francisco
Jan 10-12 Santander - 15th Annual Latin America CEO Conference - Cancun
Mar 02 4Q11 Results Conference Call
26