3q13 earnings english final - lg
TRANSCRIPT

0
2012년 2월 1일
3Q13 Earnings Release
October 24th 2013

All information regarding management performance and financial results of LG Electronics (the “Company”) during the 3rd
quarter of 2013 as contained herein has been prepared on a consolidated basis in accordance with International Financial
Reporting Standards (“IFRS”). Please note that starting from January 1, 2013, the Company accounted LG Innotek as a
consolidated subsidiary of the Company pursuant to the enactment of K-IFRS 1110, 'Consolidated Financial Statements'. The
comparative consolidated financial data are restated accordingly.
In addition, the information regarding results of 3rd quarter of 2013 has been prepared in advance, prior to being reviewed by
outside auditors, solely for the convenience of investors of the Company, and is subject to change in the process of final
reviewing by external auditors.
The information contained herein includes forward-looking statements in respect to future plans, prospects, and performances
of the Company as well as the Company’s projected sales plan for 4th quarter of 2013. These forward-looking statements also
refer to the Company’s performance on consolidated base, as indicated.
The aforementioned forward-looking statements are influenced by changes in the management environment and relative
events, and by their nature, these statements refer to uncertain circumstances. Consequently, due to these uncertainties, the
Company’s actual future results may differ materially from those expressed or implied by such statements.
Please note that as the forward-looking statements contained herein are based on the current market situation and the
Company’s management direction, they are subject to change according to the changes in future market environment and
business strategy.
The information contained herein should not be utilized for any legal purposes in regards to investors’ investment results. The
Company hereby expressly disclaims any and all liability for any loss or damage resulting from the investors’ reliance on the
information contained herein.

Ⅰ. Overview
Ⅱ. 3Q13 Results (Consolidated)
Ⅲ. Performance and Outlook by Division
Table of Contents

Ⅰ. Overview
1
Comment on 3Q13 Results
Comment on 4Q13 Outlook

3Q13 Results

2
8.8%↓ 15.23
13.28 13.89
3Q’12 2Q’13 3Q’13
4.6%↑ 3Q13 3Q12
218
109
722
2Q13 QoQ YoY
172
624
165
↓ 261bn ↑ 46bn
↓ 56bn
479
156
950
↓ 47bn
↓ 228bn ↑ 98bn
Ⅱ. 3Q13 Results (Consolidated) Sales/Profit
Profit
(Unit : KRW bn)
Sales
(Unit : KRW tn)
Net Profit
Operating
Profit
EBITDA
* Starting from January 1, 2013, the Company accounted LG Innotek as a consolidated subsidiary of the Company pursuant to the enactment of K-IFRS 1110,
'Consolidated Financial Statements'. The comparative consolidated financial data are restated accordingly.

Net Profit Investment Income
(Unit : KRW bn) (Unit : KRW bn)
Ⅱ. 3Q13 Results (Consolidated)
3
LG Display
Others
Net Profit
Gain/Loss on equity
method investment
3Q13
93
86
-7
Net Profit
218 Tax
Net financial
income/expense
50
Gain on equity
method investment
30
115
Other non-operating
income/expense
109
Op. Profit
2Q13
34
35
1
86
Gain/Loss on equity
method investment

Ⅱ. 3Q13 Results (Consolidated) Cash Flow Statement
4
3Q Net* Cash Flow
(Unit : KRW bn)
Cash Out Cash In
Net Profit
Depreciation
Gain on equity
method investment
504
Net *
-3
Change in
working capital
109
FX effect from
foreign currency
denominated cash
Cash flow from
investing activities
86
171
511
255 Others
103
Cash Flow Statement
(Unit : KRW bn)
3Q13 2Q13
Cash at beginning of period 2,011 2,454
Cash flow from operating activities 611 726
Net income/loss
Depreciation
Gain/Loss on equity method investment
Change in working capital
Others
2,339 2,011 Cash at end of period
328 -443 Net changes in cash
337 -533 Increase/Decrease in debt
331 -578 Cash flow from financing activities
-103 3 FX effect from foreign currency denominated cash
-437
-511
-103
0
-451
-594
-75
-4
Cash flow from investing activities
Increase in tangible assets
Increase in intangible assets
Decrease in cash and cash equivalents due to changes in scope of subsidiaries
* Net= Excluding Cash flow from financing activities
156
471
-35
-280
414
109
504
-86
255
-171

Ⅱ. 3Q13 Results (Consolidated)
5
Financial Structure
Balance Sheet Financial Ratio
(Unit : %) (Unit: KRW tn)
Assets
Liabilities
Equity
Current Liabilities
Non-Current Liabilities
Current Assets
Debt
Cash
Inventory
4Q12 3Q13
Debt to Equity
Net Debt
to Equity
Total Liability
to Equity
Non-Current Assets
Net Debt
183
52
174
51
2Q13
68 68
4Q12
34.77
22.06
12.71
14.51
7.55
16.31
8.64
2.19
5.07
18.46
6.45
* Starting from January 1, 2013, the Company accounted LG Innotek as a consolidated subsidiary of the Company pursuant to the enactment of K-IFRS 1110,
'Consolidated Financial Statements'. The comparative consolidated financial data are restated accordingly.
3Q13
36.41
23.53
12.88
15.44
8.09
17.43
8.97
2.34
5.86
18.98
6.64
183
70
52
2Q13
37.19
24.04
13.15
16.69
7.35
18.07
8.90
2.01
5.52
19.12
6.89

Performance and Outlook

Ⅲ. Performance and Outlook by Division Home Entertainment
7
2013년 2분기 실적
4Q13 Outlook
Market:
LGE:
3Q13 Performance
Expect LCD TV demand to increase QoQ due to seasonality,
but expect to decrease YoY
Plan to expand global sales of premium products such as
OLED TV and Ultra HD TV, while continuing cost reduction efforts
0.5%
3Q‘12 4Q‘12
0.3%
1Q‘13
5.38
1.8%
2Q‘13
6.32 4.96
5.26
0.0%
2.5%
3Q‘13
5.01
Sales
Business Performance
(KRW tn)
Op. Margin
Profitability:
Sales:
LCD TV : Sales increased in developing markets such as Asia and CIS,
but decreased in developed markets such as Europe
Improved QoQ due to efficient management of operating
and marketing expenses
Decreased both QoQ and YoY due to slow market demand

Ⅲ. Performance and Outlook by Division Mobile Communications
8
3Q13 Performance
4Q13 Outlook
Profitability:
Sales:
Achieved 12.0M units of smartphone shipments
- Improved LTE sales by 31% QoQ due to the launching of G2
- 3G sales declined due to intensified competition in developing markets
Market:
LGE: Plan to increase sales in the premium segment with the full
fledged global launch of the G2, while enhancing marketing for
both Mass LTE and 3G smartphones in order to maximize sales
during the peak season and to improve brand power and
market position
Expect smartphone market to grow continuously, especially
for the LTE phone market. However, overall market competition
will be intensified due to handset makers diversifying their
portfolio in order to gain market share
Declined due to increase in marketing expense for G2
and decrease in ASP as a result of intensified competition
Business Performance
(KRW tn)
Op. Margin
Sales
3Q`12 4Q`12 1Q`13
2.81 2.45
2.0%
2Q`13
3.21
4.1%
3Q`13
3.21
2.0%
3.12 3.05
-0.2%
-2.6%
Increased 24% YoY, but declined 2% QoQ to KRW 3.0 trillion

Ⅲ. Performance and Outlook by Division
9
Home Appliance
3Q13 Performance
4Q13 Outlook
Market: Expect demand to gradually increase in developed markets
such as North America and Europe as a result of positive
economy recovery trend of the market. However, in major
developing markets, recovery trend will be limited due to
unfavorable FX movements
LGE: Plan to continuously grow faster than the market by launching
market leading products for washing machines and refrigerators,
and improve profitability by cost innovation
3Q'12 4Q'12 1Q'13 2Q'13
2.94 2.87 2.81 3.19
4.3%
3.6% 3.8%
Sales
3Q'13
2.97
3.7%
2.7%
Business Performance
(KRW tn)
Op. Margin
Sales:
Domestic: Revenue increased by 8% YoY due to good response from new
models for both washing machines and refrigerators launched during
2nd quarter of this year
Profitability: Despite stronger sales and improving cost structure,
profit declined YoY due to effect of unfavorable
FX movements
Increased by 3% YoY but declined by 7% QoQ to KRW 3.0 trillion
Overseas: Increased 5% YoY due to improving sales in both North America
and China despite slow market growth in developing markets due to
decrease of demand

Ⅲ. Performance and Outlook by Division Air-Conditioning & Energy Solution
10
Sales :
LGE:
Market:
Profitability :
Domestic: Revenue increased by 24% YoY due to stronger products sales
Overseas: Declined by 9% YoY due to weaker sales in major emerging and
developing markets as a result of weaker market conditions
4Q13 Outlook
3Q13 Performance
Expect continuous weak market conditions due to off-season
effect and unstable political and economical conditions to
continue in the Middle East and Africa
Plan to increase sales by strengthening marketing for
non seasonal products along with globally launching of
new models for commercial air-conditioner 3Q`12 4Q`12 1Q`13 2Q`13
3.21
3Q`13
3.12
Sales
9.9%
2.1%
-0.6%
6.7%
2.0%
0.67
1.22
0.96
1.73
0.97
Decreased by 44% QoQ due to seasonality, but increased by
1% YoY to KRW 1 trillion
Despite better cost structure due to cost innovations
and product competitiveness, operating profit margin was
flat YoY due to increased R&D spending
Business Performance
(KRW tn)
Op. Margin

http://www.lg.com

Appendix. LG Electronics Business Organization
12
Home
Appliance
Air-Conditioning
& Energy Solution
Home
Entertainment
Mobile
Communications
Vehicle
Components
- Solar
- Commercial Water
- C&M
- Lighting
- TV (LCD, CRT, PDP)
- Media
- IT (Monitor & PC)
- CEM
- DS Brand
- Handset
- Refrigerator
- Washing machine
- Cooking & Cleaning
- Residential AC
- System AC
(CAC, Chiller)
- BdMS
* CEM= Chemical & Electronic Material
Independent
Business Unit
- IVI (In-Vehicle
Infotainment)
- VE (Vehicle
Engineering)
- H&M (HVAC & Motor)
- A new division, Vehicle Components, was established on July 1, 2013

13 * Since this is not an audited nor reviewed report, content may be changed in the future if an auditor has a concern.
Appendix
Income Statement
Summarized Financial Statements (Parent)
(Unit : KRW bn)
2012 2013
1Q 2Q 3Q 4Q Total 1Q 2Q 3Q
Sales 6,237 100.0% 6,600 100.0% 6,487 100.0% 6,104 100.0% 25,427 100.0% 6,898 100.0% 7,432 100.0% 6,835 100.0%
Domestic 2,090 33.5% 2,009 30.4% 1,888 29.1% 1,846 30.3% 7,833 30.8% 2,242 32.5% 2,065 27.8% 2,041 29.9%
Export 4,147 66.5% 4,591 69.6% 4,599 70.9% 4,257 69.7% 17,594 69.2% 4,656 67.5% 5,367 72.2% 4,794 70.1%
Cost of goods sold 4,954 79.4% 5,001 75.8% 5,053 77.9% 4,979 81.6% 19,986 78.6% 5,568 80.7% 5,778 77.7% 5,578 81.6%
Gross profit 1,283 20.6% 1,599 24.2% 1,434 22.1% 1,125 18.4% 5,441 21.4% 1,330 19.3% 1,654 22.3% 1,257 18.4%
Selling & admin expense 1,200 19.2% 1,379 20.9% 1,467 22.6% 1,348 22.1% 5,395 21.2% 1,350 19.6% 1,519 20.4% 1,418 20.7%
Operating income (Loss) 82 1.3% 220 3.3% (33) -0.5% (223) -3.7% 46 0.2% (20) -0.3% 135 1.8% (161) -2.4%
Financial income (Expense) (35) -0.6% (62) -0.9% (76) -1.2% (40) -0.7% (213) -0.8% (35) -0.5% (59) -0.8% (55) -0.8%
Other non operating income (Expense) 347 5.6% (24) -0.4% 34 0.5% (430) -7.0% (72) -0.3% 88 1.3% (3) 0.0% 4 0.1%
Net profit (Loss) before tax 394 6.3% 135 2.0% (75) -1.2% (693) -11.3% (240) -0.9% 33 0.5% 73 1.0% (212) -3.1%
Tax 78 1.2% 21 0.3% (11) -0.2% 26 0.4% 113 0.4% 1 0.0% 11 0.1% (69) -1.0%
Net profit (Loss) 316 5.1% 114 1.7% (64) -1.0% (718) -11.8% (352) -1.4% 32 0.5% 62 0.8% (143) -2.1%
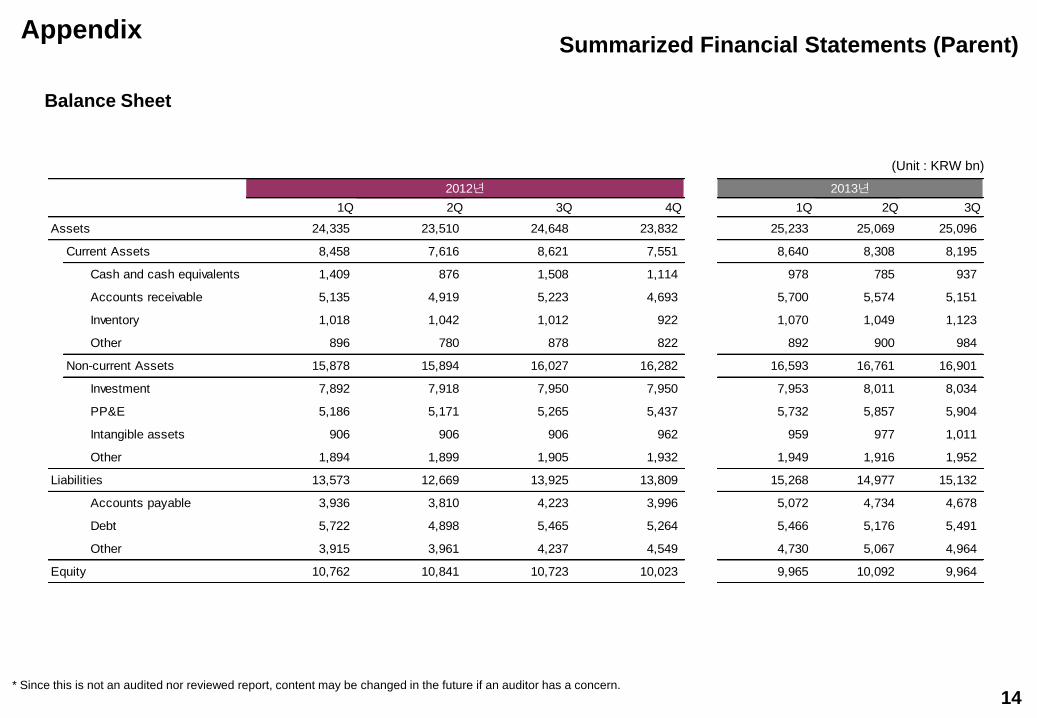
Appendix
Balance Sheet
Summarized Financial Statements (Parent)
14
(Unit : KRW bn)
* Since this is not an audited nor reviewed report, content may be changed in the future if an auditor has a concern.
1Q 2Q 3Q 4Q 1Q 2Q 3Q
Assets 24,335 23,510 24,648 23,832 25,233 25,069 25,096
Current Assets 8,458 7,616 8,621 7,551 8,640 8,308 8,195
Cash and cash equivalents 1,409 876 1,508 1,114 978 785 937
Accounts receivable 5,135 4,919 5,223 4,693 5,700 5,574 5,151
Inventory 1,018 1,042 1,012 922 1,070 1,049 1,123
Other 896 780 878 822 892 900 984
Non-current Assets 15,878 15,894 16,027 16,282 16,593 16,761 16,901
Investment 7,892 7,918 7,950 7,950 7,953 8,011 8,034
PP&E 5,186 5,171 5,265 5,437 5,732 5,857 5,904
Intangible assets 906 906 906 962 959 977 1,011
Other 1,894 1,899 1,905 1,932 1,949 1,916 1,952
Liabilities 13,573 12,669 13,925 13,809 15,268 14,977 15,132
Accounts payable 3,936 3,810 4,223 3,996 5,072 4,734 4,678
Debt 5,722 4,898 5,465 5,264 5,466 5,176 5,491
Other 3,915 3,961 4,237 4,549 4,730 5,067 4,964
Equity 10,762 10,841 10,723 10,023 9,965 10,092 9,964
2012년 2013년

Appendix
Income Statement
Summarized Financial Statements (Consolidated)
15
(Unit : KRW bn)
* Starting from January 1, 2013, the Company accounted LG Innotek as a consolidated subsidiary of the Company pursuant to the enactment of K-IFRS 1110,
'Consolidated Financial Statements'. The comparative consolidated financial data are restated accordingly. * Since this is not an audited nor reviewed report, content may be changed in the future if an auditor has a concern.
2012 2013
1Q 2Q 3Q 4Q Total 1Q 2Q 3Q
Sales 13,205 100.0% 13,835 100.0% 13,282 100.0% 14,801 100.0% 55,123 100.0% 14,101 100.0% 15,232 100.0% 13,892 100.0%
Cost of goods sold 10,152 76.9% 10,402 75.2% 10,033 75.5% 11,665 78.8% 42,252 76.7% 10,967 77.8% 11,550 75.8% 10,599 76.3%
Gross profit 3,053 23.1% 3,433 24.8% 3,249 24.5% 3,136 21.2% 12,871 23.3% 3,134 22.2% 3,682 24.2% 3,293 23.7%
Selling & admin expense 2,651 20.1% 2,906 21.0% 3,078 23.2% 3,019 20.4% 11,654 21.1% 2,784 19.7% 3,203 21.0% 3,075 22.1%
Operating income (Loss) 402 3.0% 527 3.8% 171 1.3% 117 0.8% 1,217 2.2% 350 2.5% 479 3.1% 218 1.6%
Financial income (Expense) (92) -0.7% (99) -0.7% (115) -0.9% (84) -0.6% (390) -0.7% (80) -0.6% (106) -0.7% (115) -0.8%
Gains (loss) on equity method investment (52) -0.4% (32) -0.2% 62 0.5% 109 0.7% 87 0.2% (26) -0.2% 35 0.2% 86 0.6%
Other non operating income (Loss) 200 1.5% (162) -1.2% 69 0.5% (472) -3.2% (365) -0.7% (67) -0.5% (175) -1.1% (50) -0.4%
Net income before tax 458 3.5% 235 1.7% 187 1.4% (331) -2.2% 549 1.0% 177 1.3% 233 1.5% 139 1.0%
Tax 210 1.6% 66 0.5% 22 0.2% 148 1.0% 446 0.8% 155 1.1% 77 0.5% 30 0.2%
Net income 248 1.9% 169 1.2% 165 1.2% (478) -3.2% 103 0.2% 22 0.2% 156 1.0% 109 0.8%
Controlled shares 244 164 157 (472) 93 24 132 84
Noncontrolled shares 4 5 8 (6) 10 (2) 24 25

Appendix Summarized Financial Statements (Consolidated)
Balance Sheet
(Unit : KRW bn)
16
* Starting from January 1, 2013, the Company accounted LG Innotek as a consolidated subsidiary of the Company pursuant to the enactment of K-IFRS 1110,
'Consolidated Financial Statements'. The comparative consolidated financial data are restated accordingly. * Since this is not an audited nor reviewed report, content may be changed in the future if an auditor has a concern.
2012 2013
1Q 2Q 3Q 4Q 1Q 2Q 3Q
Assets 35,242 35,166 36,534 34,766 37,147 37,193 36,413
Current Assets 17,309 17,207 18,308 16,312 18,305 18,071 17,427
Cash and cash equivalents 3,083 2,673 3,104 2,185 2,454 2,011 2,339
Accounts receivable 7,127 7,813 7,482 7,333 8,534 8,621 7,388
Inventory 5,284 5,071 5,970 5,075 5,525 5,524 5,857
Other 1,815 1,650 1,752 1,719 1,792 1,915 1,843
Non-current Assets 17,933 17,959 18,226 18,455 18,842 19,122 18,986
Investment 4,087 4,084 4,114 4,183 4,180 4,292 4,311
PP&E 9,591 9,578 9,766 9,889 10,265 10,391 10,221
Intangible assets 1,152 1,150 1,152 1,222 1,222 1,263 1,284
Other 3,103 3,147 3,194 3,161 3,175 3,176 3,170
Liabilities 21,838 21,762 23,098 22,060 24,318 24,040 23,535
Accounts payable 5,694 5,679 6,358 5,627 6,989 6,819 6,533
Debt 9,528 9,097 9,173 8,638 9,397 8,902 8,974
Other 6,616 6,986 7,566 7,795 7,932 8,319 8,028
Equity 13,404 13,404 13,436 12,706 12,829 13,153 12,878

Appendix Divisional Sales (Consolidated)
17
(Unit : KRW bn)
* Due to the establishment of Vehicle Components division(VC), the divisional financial data has been restated accordingly.
* Since this is not an audited nor reviewed report, content may be changed in the future if an auditor has a concern.
1Q'12 2Q'12 3Q'12 4Q'12 '12 Total 1Q'13 2Q'13 3Q'13
QoQ YoY
Home
Entertainment
Sales 5,248 5,381 5,384 6,319 22,331 4,959 5,258 5,007 -5% -7%
Op. Income 150 287 29 1 468 13 93 124
(%) 2.9% 5.3% 0.5% 0.0% 2.1% 0.3% 1.8% 2.5%
Mobile
Communications
Sales 2,497 2,321 2,448 2,812 10,078 3,210 3,123 3,045 -2% 24%
Op. Income 35 -28 -4 57 59 133 61 -80
(%) 1.4% -1.2% -0.2% 2.0% 0.6% 4.1% 2.0% -2.6%
Handset Sales 2,452 2,286 2,423 2,779 9,941 3,202 3,123 3,045 -2% 26%
Op. Income 31 -30 -5 56 51 133 61 -80
(%) 1.3% -1.3% -0.2% 2.0% 0.5% 4.1% 2.0% -2.6%
Home
Appliance
Sales 2,536 2,875 2,868 2,942 11,221 2,807 3,188 2,967 -7% 3%
Op. Income 143 184 122 80 529 102 121 109
(%) 5.7% 6.4% 4.3% 2.7% 4.7% 3.6% 3.8% 3.7%
Air Conditioning
& Energy Solution
Sales 1,206 1,464 961 669 4,299 1,217 1,734 973 -44% 1%
Op. Income 77 91 21 -4 185 82 171 20
(%) 6.4% 6.2% 2.1% -0.6% 4.3% 6.7% 9.9% 2.0%
Others Sales 742 818 716 756 3,032 709 749 654 -13% -9%
Op. Income -29 -26 -21 -25 -101 3 -3 -12
LGE Consolidated Sales 12,228 12,859 12,376 13,497 50,960 12,901 14,051 12,647 -10% 2%
before including Op. Income 376 508 147 108 1,140 333 443 161
LG Innotek. (%) 3.1% 4.0% 1.2% 0.8% 2.2% 2.6% 3.2% 1.3%
LG Innotek earnings Sales 977 976 906 1,304 4,163 1,199 1,181 1,245 5% 37%
excluding internal transactions Op. Income 26 18 25 9 77 17 36 57
LGE Consolidated Sales 13,205 13,835 13,282 14,801 55,123 14,101 15,232 13,892 -9% 5%
Op. Income 402 527 172 117 1,217 350 479 218
(%) 3.0% 3.8% 1.3% 0.8% 2.2% 2.5% 3.1% 1.6%
* Starting from January 1, 2013, the Company accounted LG Innotek as a consolidated subsidiary of the Company pursuant to the enactment of K-IFRS 1110,
'Consolidated Financial Statements'. The comparative consolidated financial data are restated accordingly.