3q2003uk
DESCRIPTION
TiscaliTRANSCRIPT

Third-quarter report to 30 September 2003
Tiscali Group
2
Directors and Auditors
Board of Directors Chairman
Renato Soru Directors
Franco Bernabè Victor Bischoff Tomaso Barbini Gabriel Pretre
Mario Rosso
Board of Auditors Chairman
Aldo Pavan Statutory Auditors
Piero Maccioni Massimo Giaconia Deputy Auditors
Andrea Zini Rita Casu
External Auditors Deloitte & Touche SpA

Third-quarter report to 30 September 2003
3
Total consolidated revenues stood at EUR 222.2 million in 3Q03, up 24% on 3Q02 and 2% on 2Q03. Revenues for the first nine months stood at EUR 652 million, an increase of 19% on the same period of 2002;
The number of ADSL users continued to rise: the total at 30 September 2003 was 602,000, up 43% on the 420,000 customers registered in 1H03. The total number of active users was stable at 7.6 million, mainly because of the seasonal nature of narrowband use;
EBITDA, also affected by seasonal factors, was EUR 14.1 million (6.3% of revenues) compared with a loss of EUR 3.7 million in 3Q02. The figure for the first nine months was EUR 47.1 million, compared with a negative result of EUR 12.2 million in the same period of last year;
EBIT was negative in 3Q03, at EUR –52.4 million, a sharp improvement on the EUR 84.4 million loss recorded in 3Q02;
Net debt was EUR 233.4 million at 30 September, while cash and cash equivalents stood at EUR 447 million.
Highlights

Tiscali Group
4
Tiscali shares Tiscali shares are listed on both the Milan Nuovo Mercato (TIS) and the Paris Nouveau Marché (005773). In the third quarter Tiscali once again had the highest capitalisation of any company on both the Nuovo Mercato and the Nouveau Marché: EUR 1.93 billion at end-September, following a peak of EUR 2.16 billion in August. In the first nine months, the total number of shares rose from 366,114,338 at 30 June to 368,920,427 at 30 September. The table below lists the capital increases carried out during the third quarter:
Date Description Shares issued Share capital
31.07.2003 Capital increase subscribed by Telenor Business Solution Holdings AS 643,950 368,920,427
31.07.2003 Capital increase subscribed by Airtelnet Movil SA 2,162,139 368,276,477
The chart below shows Tiscali’s shareholder base at 30 September 2003:
Source: Tiscali
Report on operations
Market 47.6%
Kingfisher International
3.3%Europatweb
NV 3.3%
Sandoz Family Foundation
16.5%
Renato Soru 29.3%

Third-quarter report to 30 September 2003
5
Tiscali’s share price performed very positively from August, in line with other internet stocks and the stock market as a whole, thanks to good half-year results and to investors’ renewed interest and confidence in technology stocks and the equity market in general.
An average of 3.9 million Tiscali shares were traded daily in the period, an increase on the average for the first six months. The average daily value of trades was EUR 20.6 million. Tiscali posted the highest monthly value of trades, at EUR 517.6 million in September, an increase of 52% on June, making Tiscali the most liquid stock on the Italian Nuovo Mercato and one of the most frequently traded internet stocks in Europe.
Above-average daily volumes were recorded towards the end of August, with a peak of 20.5 million shares traded on 29 August 2003. The highest price of the year to date (EUR 6.13) was registered on 26 August, while the lowest (EUR 3.40) came on 12 March.
0%
20%
40%
60%
80%
100%
120%
140%
160%
Jul-03 Jul-03 Jul-03 Aug-03 Aug-03 Sep-03 Sep-03
NUMTEL Bloomberg European Internet Index Tiscali

Tiscali Group
6
The Nuovo Mercato remains Tiscali’s main market, accounting for 99.76% of total trades.
Average daily trades of Tiscali shares on its two markets. Number of shares
Nuovo Mercato Nouveau Marché Total Date No. of shares % No. of shares % No. of shares % Jan-03 3,056,821 99.87% 3,872 0.13% 3,060,692 100% Feb-03 2,305,031 99.72% 6,410 0.28% 2,311,440 100% Mar-03 2,719,402 99.72% 7,761 0.28% 2,727,163 100% Apr-03 2,500,580 99.76% 5,907 0.24% 2,506,487 100% May-03 1,988,456 99.56% 8,713 0.44% 1,997,168 100% Jun-03 3,387,675 99.89% 3,580 0.11% 3,391,255 100% Jul-03 2,514,171 99.70% 7,480 0.30% 2,521,652 100% Aug-03 5,463,499 99.82% 9,819 0.18% 5,473,318 100% Sep-03 4,042,548 99.78% 8,740 0.22% 4,051,288 100%
Daily average 3,108,687 99.76% 6,920 0.24% 3,115,607 100.00% Source: Tiscali Finanza
0.0
1.0
2.0
3.0
4.0
5.0
6.0
7.0
Jul-03
Jul-03 Aug-03 Sep-03 Sep-03 0
5
10
15
20
25 Price € Volume m

Third-quarter report to 30 September 2003
7
Tiscali group: key figures At 30 September 2003 Tiscali’s consolidated revenues stood at EUR 652 million, an increase of 19% on the EUR 547.5 million posted in the same period of 2002. Third-quarter revenues were EUR 222.2 million, broadly flat on the previous quarter, but up 24% on the EUR 179.9 million generated in the same period of last year. The results confirm the company’s growth trend, despite the seasonal dip in activity during July and August which was largely offset by a good performance in September.
The company had 7.65 million active users at end-September. An increasing number of these were broadband customers: the number stood at 602,000, a rise of 132,000 on the previous quarter.
€m
-
0
100
200
300
400
500
600
700
Revenues Gross profit EBITDA
Sep 2002 YTD Sep 2003 YTD
With 12.4 million unique visitors to its portal in September 2003 (source Nielsen@ratings), Tiscali once again confirmed its ranking as one of Europe’s biggest web properties, thanks to a significant presence in 15 countries and its leadership
Tiscali Group
8
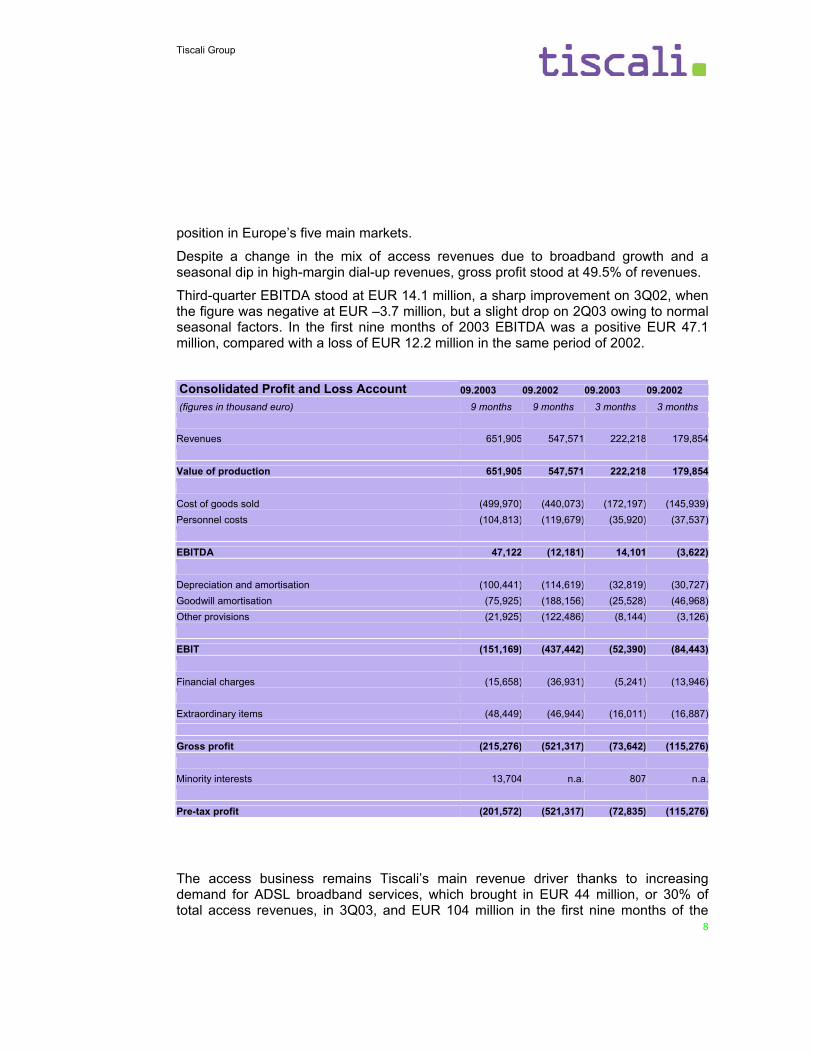
position in Europe’s five main markets.
Despite a change in the mix of access revenues due to broadband growth and a seasonal dip in high-margin dial-up revenues, gross profit stood at 49.5% of revenues.
Third-quarter EBITDA stood at EUR 14.1 million, a sharp improvement on 3Q02, when the figure was negative at EUR –3.7 million, but a slight drop on 2Q03 owing to normal seasonal factors. In the first nine months of 2003 EBITDA was a positive EUR 47.1 million, compared with a loss of EUR 12.2 million in the same period of 2002.
Consolidated Profit and Loss Account 09.2003 09.2002 09.2003 09.2002 (figures in thousand euro) 9 months 9 months 3 months 3 months Revenues 651,905 547,571 222,218 179,854 Value of production 651,905 547,571 222,218 179,854 Cost of goods sold (499,970) (440,073) (172,197) (145,939)Personnel costs (104,813) (119,679) (35,920) (37,537) EBITDA 47,122 (12,181) 14,101 (3,622) Depreciation and amortisation (100,441) (114,619) (32,819) (30,727)Goodwill amortisation (75,925) (188,156) (25,528) (46,968)Other provisions (21,925) (122,486) (8,144) (3,126) EBIT (151,169) (437,442) (52,390) (84,443) Financial charges (15,658) (36,931) (5,241) (13,946) Extraordinary items (48,449) (46,944) (16,011) (16,887) Gross profit (215,276) (521,317) (73,642) (115,276) Minority interests 13,704 n.a. 807 n.a. Pre-tax profit (201,572) (521,317) (72,835) (115,276)
The access business remains Tiscali’s main revenue driver thanks to increasing demand for ADSL broadband services, which brought in EUR 44 million, or 30% of total access revenues, in 3Q03, and EUR 104 million in the first nine months of the

Third-quarter report to 30 September 2003
9
year. Total access revenues stood at EUR 150.5 million in the quarter, or 68% of total revenues. The figure was up 24% on 3Q02, and broadly flat on the previous quarter. Access revenues in the first nine months stood at EUR 449.2 million (69% of the total), an increase of 18% on the same period of 2002.
Revenues from business services grew steadily throughout 2003, thanks to both organic growth brought about by a sharper commercial focus, and external growth following the acquisition of Cable & Wireless in France (consolidated from July) and Eunet in Austria. Business services revenues in the third quarter stood at EUR 41.6 million (19% of total revenues), up 37% on 3Q02, and 18% on the previous quarter. In the first nine months, the figure rose by 49% on the same period of 2002, to EUR 111 million.
Portal revenues in 3Q03 came in at EUR 10.9 million, or 5% of total revenues. The slight dip on 2Q03 was due to continuing stagnation in the advertising market, which also affected the online segment, and to normal seasonal factors. In the first nine months of the year portal revenues stood at EUR 34.9 million.
Voice revenues stood at EUR 16.8 million in 3Q03, or 8% of the total. They remained broadly flat on 2Q03 but were up 31% on 3Q02. In the first nine months, voice revenues were up 33% on the same period of last year, at EUR 49.3 million.
Consolidated revenues 09.2003 09.2002 09.2003 09.2002 (figures in thousand euro) 9 months 9 months 3 months 3 months Access 449,329 380,214 150,628 121,690 Voice 49,206 37,239 16,689 12,807 Business 111,061 74,340 41,624 30,365 Portal 34,849 36,616 10,944 9,386 Other revenues 7,460 19,162 2,333 5,606 Total revenues 651,905 547,571 222,218 179,854

Tiscali Group
10
Revenues by region
Spain 2%
Switz. 2%
Czech Rep. 2%
Benelux 10%
S. Africa 3%
Nordic 6%
France 21%
UK 21%
Germany 9%
Ti-Net 3%
Italy 19%
Austria 2%
The breakdown of revenues by region above shows that 80% of revenues are generated in Europe’s five main markets. Interestingly, the share generated by the UK grew in the third quarter, from 18% in 1Q03 to 21% in 3Q03. This was due to both an increase in broadband revenues and the acquisition of npower’s telephony business on 4 September.
Third-quarter report to 30 September 2003
11
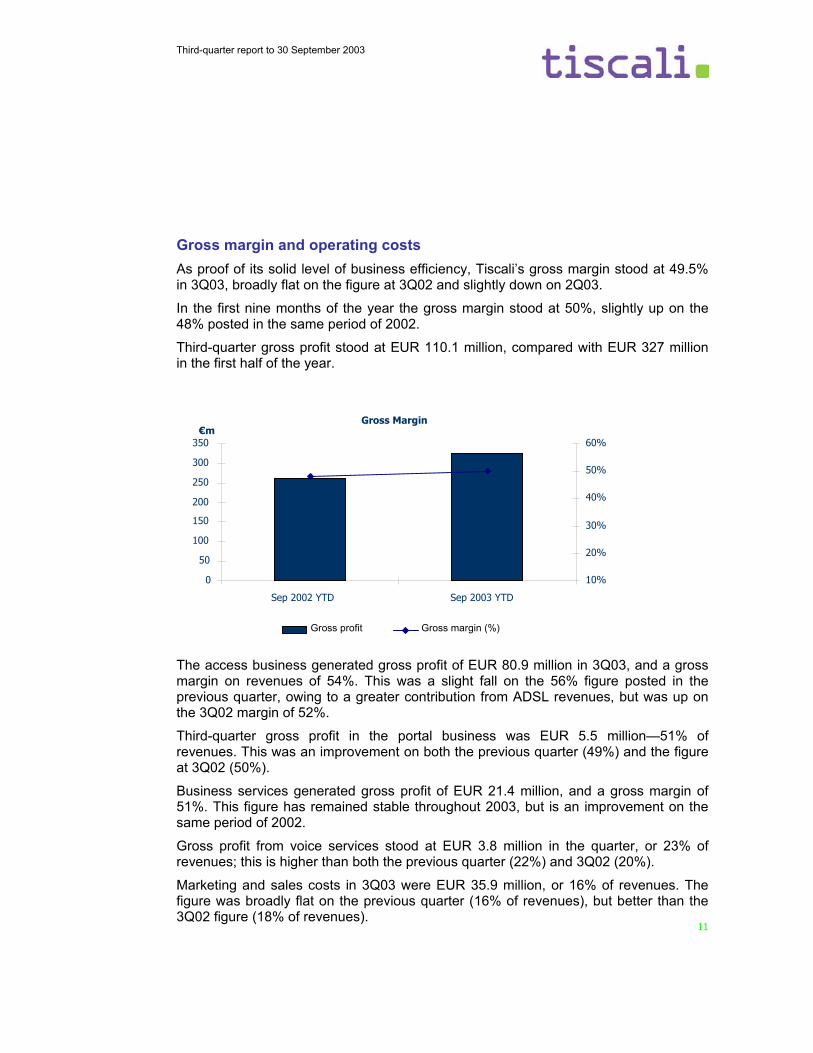
Gross margin and operating costs As proof of its solid level of business efficiency, Tiscali’s gross margin stood at 49.5% in 3Q03, broadly flat on the figure at 3Q02 and slightly down on 2Q03.
In the first nine months of the year the gross margin stood at 50%, slightly up on the 48% posted in the same period of 2002.
Third-quarter gross profit stood at EUR 110.1 million, compared with EUR 327 million in the first half of the year.
The access business generated gross profit of EUR 80.9 million in 3Q03, and a gross margin on revenues of 54%. This was a slight fall on the 56% figure posted in the previous quarter, owing to a greater contribution from ADSL revenues, but was up on the 3Q02 margin of 52%.
Third-quarter gross profit in the portal business was EUR 5.5 million—51% of revenues. This was an improvement on both the previous quarter (49%) and the figure at 3Q02 (50%).
Business services generated gross profit of EUR 21.4 million, and a gross margin of 51%. This figure has remained stable throughout 2003, but is an improvement on the same period of 2002.
Gross profit from voice services stood at EUR 3.8 million in the quarter, or 23% of revenues; this is higher than both the previous quarter (22%) and 3Q02 (20%).
Marketing and sales costs in 3Q03 were EUR 35.9 million, or 16% of revenues. The figure was broadly flat on the previous quarter (16% of revenues), but better than the 3Q02 figure (18% of revenues).
Gross Margin
0
50
100
150
200
250
300
350
Sep 2002 YTD Sep 2003 YTD
10%
20%
30%
40%
50%
60%
Gross profit Gross margin (%)
€m
Tiscali Group
12
In the first nine months of the year, marketing and sales costs came in at EUR 102.3 million, or 16% of revenues. This percentage was also broadly stable on the same period of last year.
Personnel costs totalled EUR 35.9 million in 3Q03, in line with the previous quarter and with 3Q02. They fell as a percentage of sales, from 20% in 2Q02 to 16%, owing mainly to restructuring activities carried out in 2002. In the first nine months of this year personnel costs were EUR 104.9 million, or 16% of total revenues; this was a sharp drop on the same period of 2002, when costs stood at EUR 106.5 million, or 19% of revenues.
At 30 September 2003 Tiscali had 3,111 employees, compared with 3,036 at end-June. This increase was mainly due to the consolidation of Cable & Wireless in France, which was bought at end-June and consolidated from 20 July. The new acquisition is currently undergoing a staff rationalisation programme, which will be completed by the end of this year.
G&A costs, at EUR 24.2 million, were slightly up on the previous quarter, but remained flat as a percentage of revenues, at 11%. However, they were sharply down on the EUR 26.9 million (15% of revenues) posted in 3Q02. G&A costs in the first nine months were EUR 72.7 million, or 11% of revenues, a decline on the EUR 76.8 million (14%) registered in the same period of 2002.
Operating costs came in at EUR 279.8 million in the first nine months, or 43% of total revenues. Last year, the figure was EUR 274.3 million, or 50% of revenues. This reduction in costs as a percentage of revenues followed the rationalisation process completed in 2002.
The reduction in operating costs in the first nine months produced a positive EBITDA of EUR 47.1 million, compared with a loss of EUR 12.2 million at September 2002.
This result was achieved thanks to the intensive restructuring and rationalisation of the group completed in 2002, following the aggressive acquisitions campaign that turned the company into the European player it is today.

Third-quarter report to 30 September 2003
13
In the third quarter, the group posted EBITDA of EUR 14.1 million, a sharp improvement on the loss of EUR 3.7 million recorded in 3Q02.
EBIT was negative, at EUR –52.4 million in the third quarter, compared with the loss of EUR 84.4 million recorded in 3Q02. Depreciation and amortisation charges were higher than in the second quarter of 2003, chiefly owing to investments in unbundled networks in countries where the group has a large share of ADSL users.
The group posted an EBIT loss of EUR 151.1 million for the first nine months, compared with a loss of EUR 437.4 million at the end of September 2002. EBITA was negative to the tune of EUR 76 million.
The group registered a consolidated pre-tax loss of EUR 201 million for the first nine months of the year, compared with a loss of EUR 521.3 million at 30 September 2002.
EBITDA
-20
-10
0
10
20
30
40
50
60
Sep 2002 YTD Sep 2003 YTD
-4%
-2%
0%
2%
4%
6%
8%
EBITDA EBITDA (%)
€m

Tiscali Group
14
Extraordinary operations
In July 2003, Tiscali completed the acquisition of the domestic internet access and business services activities of Cable & Wireless in France (annualised sales of EUR 35 million), through its French subsidiary Liberty Surf Group SA. The operation is part of Tiscali’s drive to increase its range of services to SMEs on the French market, and will take sales of business services at Tiscali France to EUR 50 million.
The company was consolidated from 20 July 2003, and generated revenues of EUR 4.8 million to 30 September.
The acquisition cost of EUR 5.6 million will be paid in two tranches, in cash. The first tranche was paid in the third quarter of 2003.
The integration of the Cable & Wireless internet business will bring Tiscali a highly prestigious client base, and generate substantial synergies and improvements in the profitability of its French business.
The acquisition will enable the company to broaden its portfolio of products and services significantly (particularly in VPN/IP and VISP), extend its network in France and improve its efficiency. This will be achieved thanks to the integration of Cable & Wireless’ national transmission network (24 regional POPs, plus a metropolitan network in Paris connecting the various nodes) and value-added services platforms (VISP, VPN/IP, firewalls).
In September, Tiscali acquired the telephony business of UK group npower, through its subsidiary Tiscali UK, for a price between GBP 6 and 7 million. The final amount will be paid in December 2003 upon completion of the customer migration process in mid-November.
The operation strengthens Tiscali’s UK telephony business, thanks to npower’s database totalling over 200,000 customers. Tiscali expects the business to generate revenues of over GBP 25 million a year, before synergies.
The business was consolidated from 1 September 2003, and generated revenues of EUR 3 million to 30 September.
Third-quarter report to 30 September 2003
15
The acquisition represents a significant opportunity for Tiscali, which aims to make telephony one of its core businesses. It will be able to offer its new customers a wide range of voice services, as well as dial-up and broadband connections. The acquisition is part of the group’s strategy to strengthen its presence on the UK market.
On 5 September 2003, Tiscali announced the launch of a EUR 209.5 million equity-linked bond issue due 2006.
The bonds were issued by Luxembourg subsidiary Tiscali Finance SA and backed by Tiscali SpA.
The redemption price was set at EUR 7.57, which offered a premium of 32% on the price of Tiscali shares at issue. The coupon was set at 4.25%.
From September 2004, holders will have the option to redeem their bonds for a cash amount linked to the performance of Tiscali shares (“equity-linked redemption”).
If the bondholders decide to exercise this redemption right, Tiscali Finance SA will have the option to repay the bonds in ordinary Tiscali shares.
At maturity, or in certain other circumstances, the bonds will be redeemed at par in cash, or at the issuer’s discretion, in a combination of Tiscali shares and cash.
Tiscali SpA may launch a capital increase if the bonds are redeemed in shares.
The issue will allow Tiscali to refinance part of its existing debt under better conditions.
Tiscali Group
16
Financial position
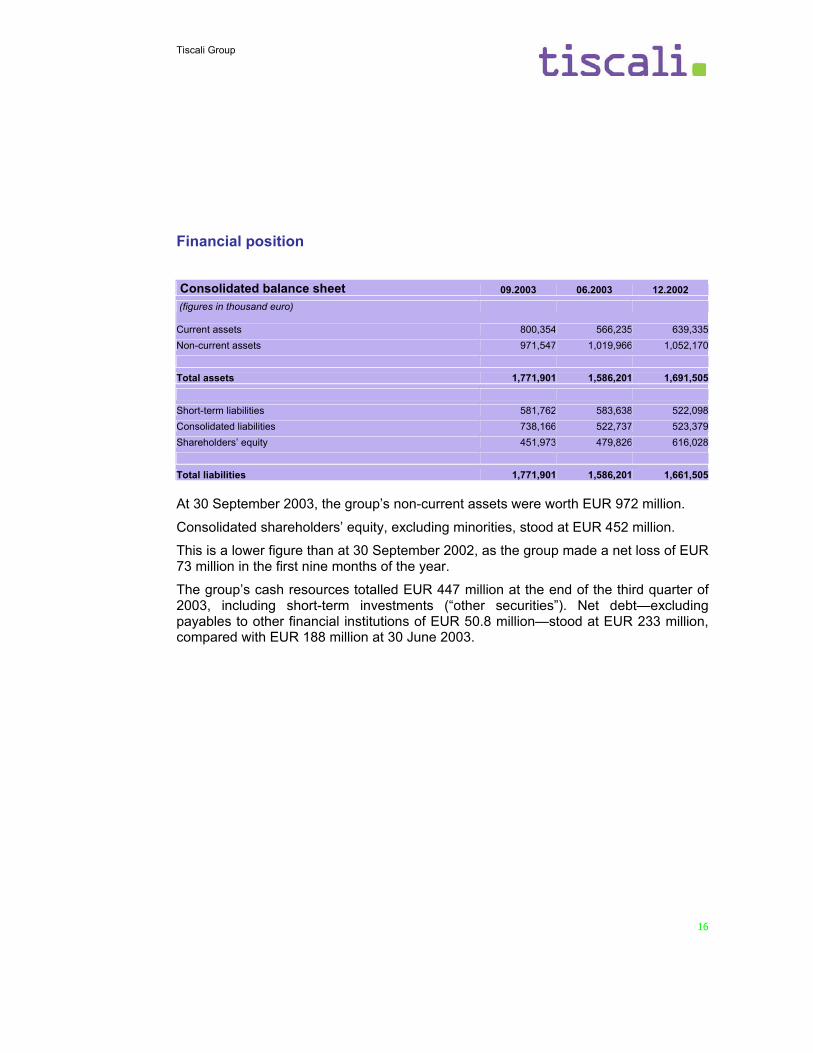
Consolidated balance sheet 09.2003 06.2003 12.2002 (figures in thousand euro) Current assets 800,354 566,235 639,335 Non-current assets 971,547 1,019,966 1,052,170 Total assets 1,771,901 1,586,201 1,691,505 Short-term liabilities 581,762 583,638 522,098 Consolidated liabilities 738,166 522,737 523,379 Shareholders’ equity 451,973 479,826 616,028 Total liabilities 1,771,901 1,586,201 1,661,505 At 30 September 2003, the group’s non-current assets were worth EUR 972 million.
Consolidated shareholders’ equity, excluding minorities, stood at EUR 452 million.
This is a lower figure than at 30 September 2002, as the group made a net loss of EUR 73 million in the first nine months of the year.
The group’s cash resources totalled EUR 447 million at the end of the third quarter of 2003, including short-term investments (“other securities”). Net debt—excluding payables to other financial institutions of EUR 50.8 million—stood at EUR 233 million, compared with EUR 188 million at 30 June 2003.

Third-quarter report to 30 September 2003
17
Financial position 09.2003 06.2003 03.2003 12.2002 (figures in thousand euro) Cash and cash equivalents 447,074 284,516 314,636 333,757 Short-term bank debt (37,443) (39,276) (52,876) (56,057) Short-term cash position 409,631 245,240 261,760 277,700 Medium-/long-term debt (643,003) (433,503) (420,488) (412,460) Net debt (233,372) (188,263) (158,728) (134,760)
Net debt rose EUR 45.1 million over the third quarter.
The group generated operating cash flow of EUR 31 million in 3Q03. Cash outlay mainly related to the building of the Tiscali Campus in Cagliari, interest paid on bonds over the period, the npower and Cable & Wireless acquisitions and other one-off payments.
Investment
Gross investment in the quarter totalled EUR 35.2 million, and mainly related to the installation of network infrastructure required to provide unbundled broadband services.
Around EUR 17 million was spent on the new headquarters in Cagliari.

Tiscali Group
18
Significant events since the end of the period
On 17 October 2003, Tiscali announced plans to launch a buy-back on all bonds issued in July 2002 and due July 2004 by subsidiary Tiscali Finance SA, for a total of EUR 150 million.
The operation will allow Tiscali to restructure its debt under better conditions, both in terms of cost and maturity, following the strategy it announced to the market at the launch of the equity-linked bond issue in September.
Outlook Tiscali’s main objective in 2003 is to capture market share in the European broadband market, particularly in ADSL.
Selective investment in unbundled ADSL and voice network infrastructure should support growth and improve margins on Tiscali’s broadband services.
Revenues are expected to grow by over 20% YoY in 2003, and the EBITDA margin is forecast in the region of 8%.

Third-quarter report to 30 September 2003
19
Parent company: key figures
Parent company: profit and loss account Profit and Loss Account 09.2003 09.2002 09.2003 09.2002 (figures in thousand euro) 9 months 9 months 3 months 3 months Revenues 123,534 96,432 38,543 31,925 Value of production 123,534 96,432 38,543 31,925 Cost of goods sold (114,653) (107,564) (40,643) (35,097)Personnel costs (23,236) (19,971) (8,341) (6,615) EBITDA (14,355) (31,103) (10,441) (9,787) Depreciation and amortisation (19,591) (10,263) (7,523) (3,480)Other provisions (1,030) (190,911) (612) (124) EBIT (34,976) (223,277) (18,576) (13,391) Financial charges (4,983) (15,843) (742) (26,378) Extraordinary items (9,220) (12,722) - (25,206) Gross profit (49,179) (260,842) (19,318) (64,975)
At 30 September 2003, EBITDA was negative to the tune of EUR 14.3 million, including holding costs. The EBITDA loss in the third quarter was EUR 10.4 million. The nine-month result net of adjustments made pursuant to IAS 17 was EUR –7.5 million.
The main costs in the first nine months related to line and port rentals (EUR 23.6 million, or 20% of revenues), the purchase of traffic (EUR 29 million, or 24% of revenues) and advertising and promotions (EUR 12.1 million, or 10% of revenues).

Tiscali Group
20
Personnel costs rose 21% from EUR 19.9 million at 30 September 2002 to EUR 23.2 million at 30 September 2003. Over the quarter, these costs were up 17% compared with 3Q02. The headcount rose from 794 at 30 September 2002 to 836 at 30 September 2003.
In the first nine months of 2003, the parent company’s investments totalled EUR 42.7 million (of which EUR 30.3 million was spent in the third quarter). This breaks down into spending of EUR 11.3 million on intangible assets and EUR 31.4 million on tangible assets. Investment in tangible assets mainly related to the building of the group’s new headquarters in Cagliari, and the purchase of equipment to expand the fibre-optic network acquired in 2002 and to cover the increase in ADSL users. Spending on intangible assets related to the purchase and development of software, as well as work on new POP servers following the expansion of the network.
Parent company: financial position Financial position 09.2003 06.2003 03.2003 (figures in thousand euro.) Cash and cash equivalents 3,157 6,989 4,722 Short-term bank debt (30,461) (31,003) (34,933) Short-term debt (27,304) (24,014) (30,211) Medium-/long-term debt (33,503) (33,503) (5,463) Net debt (60,807) (57,517) (35,674)

Third-quarter report to 30 September 2003
21
Parent company: revenue breakdown Revenues 09.2003 09.2002 09.2003 09.2002 (figures in thousand euro.) 9 months 9 months 3 months 3 months Access 69,346 49,007 23,480 15,579 Voice 21,972 14,603 8,040 6,268 Business 6,113 3,533 1,623 1,022 Portal 10,327 12,533 3,133 3,266 Other revenues 15,776 16,756 2,267 5,790 Total revenues 123,534 96,432 38,543 31,925
Parent company revenues totalled EUR 123.5 million in the first nine months of 2003, an increase of 29% on the same period of 2002.
Growth was largely driven by higher access and voice revenues. Access revenues rose on the back of the launch of the ADSL service and growth in reverse interconnection traffic; voice revenues rose from EUR 14.6 million in 3Q02 to EUR 21.9 million in 3Q03, following significant growth in traffic minutes, particularly among business customers.
Third-quarter revenues stood at EUR 38.5 million, an increase of 21% on the EUR 31.9 million posted in 3Q02. Access revenues came in at EUR 23.4 million, up 50.7% from EUR 15.6 million in 3Q02. The change was mainly due to the huge rise in ADSL customers (who numbered 83,000 at 30 September 2003, a 294% increase on the figure at 30 September 2002) and the introduction of the decade 7 access service, which generates higher revenues per minute than reverse interconnection. Dial-up minutes fell slightly from 2 billion in the third quarter of 2002 to 1.8 billion, owing to “cannibalisation” by ADSL. The number of active users was flat at 1.3 million. Voice revenues rose from EUR 6.2 million in 3Q02 to EUR 8 million in the same period this year.
This increase was chiefly driven by higher sales of wholesale services. B2B services generated revenues of EUR 1.6 million in the third quarter, compared with EUR 1 million in 3Q02.