3q2015 economic metrics
TRANSCRIPT

Lee & AssociatesReal Estate Economics Metrics TrackerThird Quarter 2015

ISection One
Unemployment and Jobs Data

National
• 142,371,000: Total Nonfarm Payroll Employment, Sep. 2015 (SA)-(Preliminary)• 65,217: 10-Year Average number of jobs added per month• 142,000: Number of jobs added September 2015 (Preliminary)• 5.1%: September 2015 Unemployment Rate (SA)• 7.0%: 10-Year Unemployment Rate Average
Bureau of Labor Statistics
National unemployment rate decreased to 5.1% September 2015. Unemployment dropped 20 basis points quarter-to-quarter. The lowest it's been since April 2008 at 5%. We're gradually edging downwards to pre-recession rates which are below 5%. Employers added 142,000 jobs in September (preliminary figure). Collectively, Q3 added 501,000 jobs.
7.0%
0.0%
2.0%
4.0%
6.0%
8.0%
10.0%
12.0%
Oct
-05
May
-06
Dec-
06Ju
l-07
Feb-
08Se
p-08
Apr-
09N
ov-0
9Ju
n-10
Jan-
11Au
g-11
Mar
-12
Oct
-12
May
-13
Dec-
13Ju
l-14
Feb-
15Se
p-15
National Unemployment Rate
Unemployment Rate (SA) 10-Year Avg.
(1,000,000)
(800,000)
(600,000)
(400,000)
(200,000)
0
200,000
400,000
600,000
Oct
-05
Feb-
06
Jun-
06
Oct
-06
Feb-
07
Jun-
07
Oct
-07
Feb-
08
Jun-
08
Oct
-08
Feb-
09
Jun-
09
Oct
-09
Feb-
10
Jun-
10
Oct
-10
Feb-
11
Jun-
11
Oct
-11
Feb-
12
Jun-
12
Oct
-12
Feb-
13
Jun-
13
Oct
-13
Feb-
14
Jun-
14
Oct
-14
Feb-
15
Jun-
15
National Nonfarm Jobs Added (October 2005 - September 2015)

New York City
• 4,202,400: Total Nonfarm Jobs as of September 2015 (SA)• 3,597: 20-Year Average number of jobs added monthly (SA)• 4,950: 10-Year Average number of jobs added montly (SA)• 8,000: Number of jobs gained in September 2015 (SA)• -4,400: Number of jobs gained in 3Q 2015 (SA)• 5.2%: September 2015 Unemployment Rate (SA)• 7.5%: 10-Year Unemployment Rate Average
New York Department of Labor
Q3 had a net gain of -4,400 in jobs added in NYC. September saw an addition of 8,000 jobs, but it wasn't enough due to August's bad month in losing 13,400 jobs. Unemployment in the city continues to strengthen leading to a quarter closing of a low rate of 5.2%. This is the lowest since March 2008 (5.1%).
7.5%
0.0%
2.0%
4.0%
6.0%
8.0%
10.0%
12.0%
Oct
-05
Apr-
06O
ct-0
6Ap
r-07
Oct
-07
Apr-
08O
ct-0
8Ap
r-09
Oct
-09
Apr-
10O
ct-1
0Ap
r-11
Oct
-11
Apr-
12O
ct-1
2Ap
r-13
Oct
-13
Apr-
14O
ct-1
4Ap
r-15
New York City Unemployment Rate
Unemployment Rate (SA) 10 Year Average
(40)
(30)
(20)
(10)
-
10
20
30
Oct
-05
Jan-
06Ap
r-06
Jul-0
6O
ct-0
6Ja
n-07
Apr-
07Ju
l-07
Oct
-07
Jan-
08Ap
r-08
Jul-0
8O
ct-0
8Ja
n-09
Apr-
09Ju
l-09
Oct
-09
Jan-
10Ap
r-10
Jul-1
0O
ct-1
0Ja
n-11
Apr-
11Ju
l-11
Oct
-11
Jan-
12Ap
r-12
Jul-1
2O
ct-1
2Ja
n-13
Apr-
13Ju
l-13
Oct
-13
Jan-
14Ap
r-14
Jul-1
4O
ct-1
4Ja
n-15
Apr-
15Ju
l-15
Thou
sand
s
New York City Nonfarm Jobs Added

Unemployment Rate ComparisonSeasonally Adjusted
September 2015 Unemployment Rate 10-Year Unemployment Rate AverageUnited States 5.1% 7.0%New York City 5.2% 7.5%
Bureau of Labor Statistics and New York Department of Labor
United States 10-year unemployment rate average decreased by 20 basis points since last quarter, bringing it within 10 basis points of NYC's unemployment rate. The U.S. unemployment rate decreased to 5.1%, as low as it has been since 2008. Similarly NYC's unemployment rate dropped by 1.5 percentage points since Sept. 2015 (6.7%).
0.0%
2.0%
4.0%
6.0%
8.0%
10.0%
12.0%
Oct
-05
Jan-
06Ap
r-06
Jul-0
6O
ct-0
6Ja
n-07
Apr-
07Ju
l-07
Oct
-07
Jan-
08Ap
r-08
Jul-0
8O
ct-0
8Ja
n-09
Apr-
09Ju
l-09
Oct
-09
Jan-
10Ap
r-10
Jul-1
0O
ct-1
0Ja
n-11
Apr-
11Ju
l-11
Oct
-11
Jan-
12Ap
r-12
Jul-1
2O
ct-1
2Ja
n-13
Apr-
13Ju
l-13
Oct
-13
Jan-
14Ap
r-14
Jul-1
4O
ct-1
4Ja
n-15
Apr-
15Ju
l-15
United States vs. New York City Unemployment Rate
U.S. N.Y.C. 10-Year U.S. Avg. 10-Year N.Y.C. Avg.

Unemployment and Jobs Added Overview
Start of 2007 Recession End of Recession: 2009Unemployment Peak:
2009September
201520-YearAverage
10-YearAverage
United States 5.0% 9.5% 10.0% 5.1% 6.0% 7.0%New York State 4.9% 8.6% 8.9% 4.8% 6.2% 6.7%New York City 5.2% 9.6% 10.2% 5.2% 7.5% 7.5%
Start of 2007 Recession End of Recession: 2009Lowest Job Numbers
2010September
201520-YearAverage
10-YearAverage
United States 138,350,000 130,944,000 129,649,000 142,371,000 131,952,000 135,429,000New York State 8,774,000 8,522,600 8,496,900 9,261,000 8,566,700 8,778,900New York City 3,776,500 3,683,600 3,678,400 4,202,400 3,698,700 3,842,400
Start of 2007 Recession: December 2007
End of Recession: June 2009
Bureau of Labor Statistics and New York Department of Labor
UnemploymentTime Period
Non-FarmJobs
Time Period
Employment increased across the United States and New York State. New York City lost 1,100 jobs since last quarter. All three markets are performing better compared to their 20 and 10 year averages. New York State finally lowered its unemployment rate to pre-recession levels at 4.8%. New York City also cut its unemployment rate to 5.2%, to what it was at the beginning of the 2007 recession.

September 2015 New York City Industry Composition of Nonfarm JobsNot Seasonally Adjusted. Data is preliminary and can be adjusted.
New York Department of Labor
• The Leisure and Hospitality sector has grown 102% in 20 years.• The Goods Producing sector lost 32% of its labor force in 20 years.• Vice versa, the Service Producting sector grew by 32% in 20 years.• In a 20-Year growth, the following sectors grew by 50-60%: Professional and Business Services; Education and Health Services; & Other Services.• Financial Activities had the weakest 10-Year growth at 2.6%.• Government lost 0.6% of its workforce in 10 years.
Goods Producing, 2.8%
Service Producing, 52.8%
Information, 2.4%
Financial Activities, 6.1%
Professional & Business Services,
9.1%
Education & Health Services, 11.5%
Leisure & Hospitality, 5.7%
Other Services, 2.5%
Government, 7.2%
2015
Goods Producing,
3.6%
Service Producing,
52.5%
Information, 2.6%
Financial Activities,
7.0%
Professional & Business
Services, 8.7%
Education & Health
Services, 10.5%
Leisure & Hospitality,
4.4%
Other Services, 2.4%
Government, 8.5%
2005
Goods Producing,
5.3%
Service Producing,
51.9%
Information, 2.7%
Financial Activities, 8.1%
Professional & Business
Services, 7.7%
Education & Health
Services, 9.4%
Leisure & Hospitality,
3.6%
Other Services, 2.1%
Government, 9.2%
1995

September 2015 New York City Industry SnapshotNot Seasonally Adjusted. Data is preliminary and can be adjusted.Industry Sectors are sorted by September 2015 results.
IndustrySeptember
2015August2015
September2014
NetMonth
PercentMonth
NetYear
PercentYear
Total Nonfarm 4,191,500 4,191,900 4,119,600 (400) 0.0% 71,900 1.7%Total Private 3,648,900 3,644,100 3,579,100 4,800 0.1% 69,800 2.0%Service Providing 3,982,200 3,980,000 3,909,500 2,200 0.1% 72,700 1.9%Education & Health Services 866,100 852,900 845,300 13,200 1.5% 20,800 2.5%Professional & Business Services 686,500 692,800 672,400 (6,300) -0.9% 14,100 2.1%Government 542,600 547,800 540,500 (5,200) -0.9% 2,100 0.4%Financial Activities 458,900 464,200 450,400 (5,300) -1.1% 8,500 1.9%Leisure & Hospitality 426,800 426,100 413,600 700 0.2% 13,200 3.2%Goods Producing 209,300 211,900 210,100 (2,600) -1.2% (800) -0.4%Other Services 187,200 188,700 179,800 (1,500) -0.8% 7,400 4.1%Information 183,200 185,500 185,100 (2,300) -1.2% (1,900) -1.0%
New York Department of Labor

September 2015 New York City Industry Snapshot: Yearly Percentage ChangeNot Seasonally Adjusted. Data is preliminary and can be adjusted.Industry Sectors are sorted by Percentage by Year.
IndustrySeptember
2015August2015
September2014
NetMonth
PercentMonth
NetYear
PercentYear
Total Nonfarm 4,191,500 4,191,900 4,119,600 (400) 0.0% 71,900 1.7%Total Private 3,648,900 3,644,100 3,579,100 4,800 0.1% 69,800 2.0%Goods Producing 187,200 188,700 179,800 (1,500) -0.8% 7,400 4.1%Information 426,800 426,100 413,600 700 0.2% 13,200 3.2%Professional & Business Services 866,100 852,900 845,300 13,200 1.5% 20,800 2.5%Education & Health Services 686,500 692,800 672,400 (6,300) -0.9% 14,100 2.1%Other Services 3,982,200 3,980,000 3,909,500 2,200 0.1% 72,700 1.9%Service Providing 458,900 464,200 450,400 (5,300) -1.1% 8,500 1.9%Leisure & Hospitality 542,600 547,800 540,500 (5,200) -0.9% 2,100 0.4%Financial Activities 209,300 211,900 210,100 (2,600) -1.2% (800) -0.4%Government 183,200 185,500 185,100 (2,300) -1.2% (1,900) -1.0%
New York Department of Labor

New York City Historical Industry SnapshotNot Seasonally Adjusted
IndustrySeptember
2015September
2010September
2005Net
5 YearPercent5 Year
Net10 Year
Percent10 Year
Total Nonfarm 4,191,500 3,704,100 3,610,000 487,400 13.2% 581,500 16.1%Total Private 3,648,900 3,157,800 3,064,100 491,100 15.6% 584,800 19.1%Service Providing 3,982,200 3,512,900 3,377,600 469,300 13.4% 604,600 17.9%Education & Health Services 866,100 744,500 673,300 121,600 16.3% 192,800 28.6%Professional & Business Services 686,500 575,000 558,700 111,500 19.4% 127,800 22.9%Government 542,600 546,300 545,900 -3,700 -0.7% -3,300 -0.6%Financial Activities 458,900 430,800 447,300 28,100 6.5% 11,600 2.6%Leisure & Hospitality 426,800 327,900 282,100 98,900 30.2% 144,700 51.3%Goods Producing 209,300 191,200 232,400 18,100 9.5% -23,100 -9.9%Other Services 187,200 159,900 153,400 27,300 17.1% 33,800 22.0%Information 183,200 167,900 164,500 15,300 9.1% 18,700 11.4%
New York Department of Labor
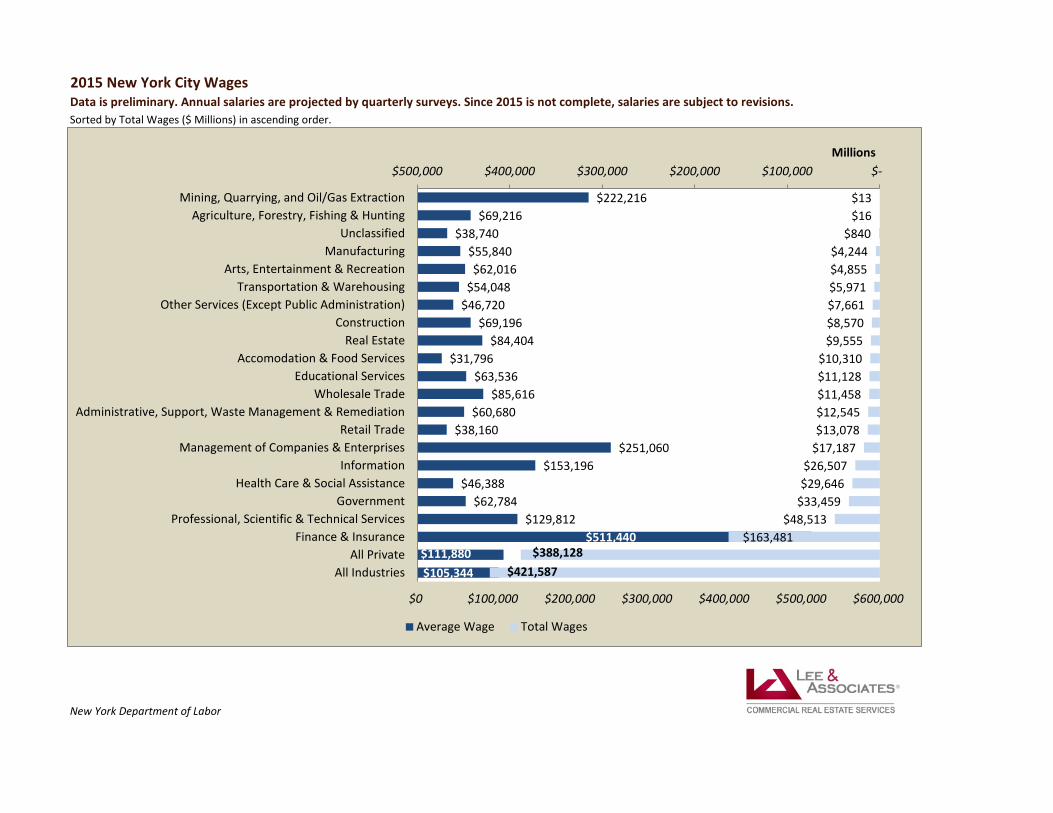
2015 New York City WagesData is preliminary. Annual salaries are projected by quarterly surveys. Since 2015 is not complete, salaries are subject to revisions.Sorted by Total Wages ($ Millions) in ascending order.
New York Department of Labor
$105,344 $111,880
$511,440 $129,812
$62,784 $46,388
$153,196 $251,060
$38,160 $60,680
$85,616 $63,536
$31,796 $84,404
$69,196 $46,720 $54,048
$62,016 $55,840
$38,740 $69,216
$222,216
$421,587 $388,128
$163,481 $48,513
$33,459 $29,646 $26,507
$17,187 $13,078 $12,545 $11,458 $11,128 $10,310
$9,555 $8,570 $7,661 $5,971 $4,855 $4,244
$840 $16 $13
$- $100,000 $200,000 $300,000 $400,000 $500,000
$0 $100,000 $200,000 $300,000 $400,000 $500,000 $600,000
All IndustriesAll Private
Finance & InsuranceProfessional, Scientific & Technical Services
GovernmentHealth Care & Social Assistance
InformationManagement of Companies & Enterprises
Retail TradeAdministrative, Support, Waste Management & Remediation
Wholesale TradeEducational Services
Accomodation & Food ServicesReal Estate
ConstructionOther Services (Except Public Administration)
Transportation & WarehousingArts, Entertainment & Recreation
ManufacturingUnclassified
Agriculture, Forestry, Fishing & HuntingMining, Quarrying, and Oil/Gas Extraction
Millions
Average Wage Total Wages

New York City Wages: Time ComparisonAverage Salaries
2015Estimated
2010% Change
5 Year2005
% Change10 Year
Recession2007-2009
% ChangeSince Recession
All Industries $105,344 $77,997 35.1% $67,858 55.2% $78,129 34.8%All Private $111,880 $81,786 36.8% $70,834 57.9% $82,295 35.9%
Accommodation & Food Services $31,796 $28,585 11.2% $25,941 22.6% $28,384 12.0%Administrative, Support, Waste Management & Remediation $60,680 $50,383 20.4% $40,332 50.5% $47,449 27.9%
Agriculture, Forestry, Fishing & Hunting $69,216 $56,385 22.8% $32,292 114.3% $51,892 33.4%Arts, Entertainment & Recreation $62,016 $63,986 -3.1% $55,939 10.9% $61,730 0.5%
Construction $69,196 $69,650 -0.7% $58,314 18.7% $67,522 2.5%Educational Services $63,536 $52,569 20.9% $44,094 44.1% $49,996 27.1%Finance & Insurance $511,440 $260,986 96.0% $208,907 144.8% $266,084 92.2%
Government $62,784 $56,960 10.2% $51,730 21.4% $54,688 14.8%Health Care & Social Assistance $46,388 $47,226 -1.8% $41,759 11.1% $45,712 1.5%
Information $153,196 $107,815 42.1% $93,002 64.7% $103,569 47.9%Management of Companies & Enterprises $251,060 $186,681 34.5% $157,398 59.5% $173,013 45.1%
Manufacturing $55,840 $53,449 4.5% $48,316 15.6% $52,490 6.4%Mining, Quarrying & Oil/Gas Extraction $222,216 $150,855 47.3% $115,834 91.8% $134,840 64.8%
Professional, Scientific & Technical Services $129,812 $109,512 18.5% $94,057 38.0% $105,108 23.5%Real Estate $84,404 $60,650 39.2% $53,159 58.8% $60,752 38.9%
Retail Trade $38,160 $34,673 10.1% $32,715 16.6% $34,961 9.2%Transportation & Warehousing $54,048 $48,341 11.8% $42,754 26.4% $46,914 15.2%
Wholesale Trade $85,616 $78,069 9.7% $68,428 25.1% $75,306 13.7%Other Services (Except Public Administration) $46,720 $44,311 5.4% $36,593 27.7% $41,952 11.4%
Unclassified $38,740 $41,408 -6.4% $32,861 17.9% $35,017 10.6%
New York Department of Labor
IndustriesTime Period

Historical Monthly Consumer Price Index (CPI) in New York-Northern New Jersey-Long Island
• 261.887: CPI in September 2015• 213.363: 20-Year (1995 to 2015) average monthly CPI• 242.771: 10-Year (2005 to 2015) average monthly CPI• 0.5%: 10-Year (2005 to 2015) average monthly change in CPI
Bureau of Labor Statistics
Consumer Price Index is at a current level of 261.89, up from 261.35 last month and up from 261.07 one year ago. This is a change of 0.21% from last month and 0.31% from one year ago.
-4.0%
-3.0%
-2.0%
-1.0%
0.0%
1.0%
2.0%
3.0%
4.0%
0
50
100
150
200
250
300
Oct
-05
Feb-
06
Jun-
06
Oct
-06
Feb-
07
Jun-
07
Oct
-07
Feb-
08
Jun-
08
Oct
-08
Feb-
09
Jun-
09
Oct
-09
Feb-
10
Jun-
10
Oct
-10
Feb-
11
Jun-
11
Oct
-11
Feb-
12
Jun-
12
Oct
-12
Feb-
13
Jun-
13
Oct
-13
Feb-
14
Jun-
14
Oct
-14
Feb-
15
Jun-
15
Consumer Price Index | New York-Northern New Jersey-Long Island
CPI Quarterly % Change

IISection Two
Economic Activity

National Gross Domestic Product (Real GDP)Adjusted For Inflation: Chained (2009) DollarsGDP figures for the third quarter were not released while compiling this report.
• $16,333.6 Billion: Q2 Gross Domestric Product• $13,680.1 Billion: 20-Year National GDP Quarterly Average• $15,102.8 Billion: 10-Year National GDP Quarterly Average• 3.9%: Q2 Real Gross Domestic Product Percent Change• 2.5%: 20-Year Average Quarterly Change in Real National GDP• 1.5%: 10-Year Average Quarterly Change in Real National GDP
Bureau of Economic Analysis
US Monthly Real GDP is at a current level of 16.35T (August 2015), down from 16.38T the prior month. This represents a monthly annualized growth rate of -1.83%, compared to a long term
average annualized growth rate of 2.49%. The increase in real GDP in the second quarter primarily reflected positive contributions from PCE, exports, nonresidential fixed investment, state and local
government spending, and residential fixed investment. Imports, which are a subtraction in the calculation of GDP, increased. Real GDP increased 3.9 percent in the second quarter, after
increasing 0.6 percent in the first.
-10.0
-8.0
-6.0
-4.0
-2.0
0.0
2.0
4.0
6.0
13,000.0
13,500.0
14,000.0
14,500.0
15,000.0
15,500.0
16,000.0
16,500.0
2005
q320
05q4
2006
q120
06q2
2006
q320
06q4
2007
q120
07q2
2007
q320
07q4
2008
q120
08q2
2008
q320
08q4
2009
q120
09q2
2009
q320
09q4
2010
q120
10q2
2010
q320
10q4
2011
q120
11q2
2011
q320
11q4
2012
q120
12q2
2012
q320
12q4
2013
q120
13q2
2013
q320
13q4
2014
q120
14q2
2014
q320
14q4
2015
q120
15q2
$ (B
illio
ns)
National Gross Domestic Product
GDP % Change in GDP

New York City Coincident Economic Indicators (CEI)
• 209.71: CEI in September 2015• 169.44: Ten Year Average• 42.36%: Ten Year Growth• 31.04%: Five Year Growth
Federal Reserve Bank of New York
A coindicent index is a single summary statistic that tracks the current state of the economy. The index is computed from a number of data series that move systematically with overall economic conditions. A rise in the index indicates an expansion of economic activity and a decline in the index indicates a contraction in economic activity. Index is computed using data on employment, real earnings, the unemployment rate and average weekly hours worked in manufacturing.
In September, the New York City Index of Coincident Economic Indicators (CEI) increased at an annual rate of 4.2%, following a 4.7% increase in August. The index has risen 5.6% over the past 12 months.
169.44 (NYC-CEI) 10-Year Average
0
50
100
150
200
250
10/1
/200
5
2/1/
2006
6/1/
2006
10/1
/200
6
2/1/
2007
6/1/
2007
10/1
/200
7
2/1/
2008
6/1/
2008
10/1
/200
8
2/1/
2009
6/1/
2009
10/1
/200
9
2/1/
2010
6/1/
2010
10/1
/201
0
2/1/
2011
6/1/
2011
10/1
/201
1
2/1/
2012
6/1/
2012
10/1
/201
2
2/1/
2013
6/1/
2013
10/1
/201
3
2/1/
2014
6/1/
2014
10/1
/201
4
2/1/
2015
New York City Coincident Economic Indicator
New York City 10-Year Average New York New Jersey

Monthly National Housing Starts
• 1,206,000: September 2015 Seasonally Adjusted Annual Rate of Housing Starts• 1,333,000: 20-Year Average• 986,000: 10-Year Average
U.S. Census Bureau
Housing starts reflect a seasonally adjusted annual rate. Seasonal adjustment is the process of estimating and removing seasonal effects from a time series to better reveal certain non-seasonal features such as underlying trends and business cycles. The seasonally adjusted annual rate is the seasonally adjusted monthly value multiplied by 12. The benefit of the annual rate is that not only can one monthly estimate be compared with another, monthly data can also be compared with an annual total. The seasonally adjusted annual rate is neither a forecast nor a projection; rather, it is a description of the rate of housing starts in the particular month for which they are calculated.
US Housing Starts is at a current level of 1.206M, up from 1.132M last month and up from 1.026M one year ago. This is a change of 6.54% from
last month and 17.54% from one year ago.
986
0
500
1,000
1,500
2,000
2,500
Oct
200
5
Feb
2006
Jun
2006
Oct
200
6
Feb
2007
Jun
2007
Oct
200
7
Feb
2008
Jun
2008
Oct
200
8
Feb
2009
Jun
2009
Oct
200
9
Feb
2010
Jun
2010
Oct
201
0
Feb
2011
Jun
2011
Oct
201
1
Feb
2012
Jun
2012
Oct
201
2
Feb
2013
Jun
2013
Oct
201
3
Feb
2014
Jun
2014
Oct
201
4
Feb
2015
Jun
2015
Thou
sand
s
National Housing Starts
Housing Starts 10-Year Average

National Auto SalesLight Vehicle Total - Seasonally Adjusted at Annual Rates (Millions)
• 18.1 Million: September 2015 U.S. Auto Sales• 15.4 Million: 20-Year average monthly auto sales• 14.4 Million: 10-Year average monthly auto sales
Bureau of Economic Analysis
14.4 - 10-Year Average
0.0
5.0
10.0
15.0
20.0
25.0
Jul-0
5
Nov
-05
Mar
-06
Jul-0
6
Nov
-06
Mar
-07
Jul-0
7
Nov
-07
Mar
-08
Jul-0
8
Nov
-08
Mar
-09
Jul-0
9
Nov
-09
Mar
-10
Jul-1
0
Nov
-10
Mar
-11
Jul-1
1
Nov
-11
Mar
-12
Jul-1
2
Nov
-12
Mar
-13
Jul-1
3
Nov
-13
Mar
-14
Jul-1
4
Nov
-14
Mar
-15
Jul-1
5
Mill
ions
National Auto Sales
Sales 10-Year Avg.

National Corporate ProfitsProfits From Current ProductionThird Quarter Numbers Currently Not Released
• $2,083 Billion: Second Quarter 2015 corporate profits from production• $1,731.2 Billion: 10-Year quarterly average corporate profits from production
Bureau of Economic Analysis
Profits from current production and capital consumption adjustment increased $70.4 billion in the second quarter, in contrast to a decrease of $123.0 billion in the first.
$1,731.2 Billion
0.00
500.00
1,000.00
1,500.00
2,000.00
2,500.00
3Q05
4Q05
1Q06
2Q06
3Q06
4Q06
1Q07
2Q07
3Q07
4Q07
1Q08
2Q08
3Q08
4Q08
1Q09
2Q09
3Q09
4Q09
1Q10
2Q10
3Q10
4Q10
1Q11
2Q11
3Q11
4Q11
1Q12
2Q12
3Q12
4Q12
1Q13
2Q13
3Q13
4Q13
1Q14
2Q14
3Q14
4Q14
1Q15
2Q15
Billi
ons
National Corporate Profits
Profit 10-Year Average

Thomson Reuters University of Michigan Index of Consumer Sentiment
• 87.2: September 2015 Consumer Sentiment Index• 90.8: Third Quarter 2015 Consumer Sentiment Index• 77.3: 10-Year Average Consumer Sentiment Index
University of Michigan
The Survey of Consumers is a rotating panel survey based on a nationally representative sample that gives each household in the coterminous U.S. an equal probability of being selected. Interviews are conducted throughout the month by telephone. The survey assesses near-time consumer attitudes on the business climate, personal finance, and spending, promotes an understanding of, and to forecast changes in, the national economy, provides a means of incorporating empirical measures of consumer expectations into models of spending and saving behavior, gauges the economic expectations and probable future spending behavior of the consumer, judges the consumer's level of optimism/pessimism.
The CSI is a key indicator that gauges the average US consumer's confidence level. This is an important indicator for retailers, economists, and investors. The Sentiment Index was 87.2 in the September 2015 survey, down from
91.9 in August, but above last September’s 84.6. Stronger CSI also indicates improving incomes and positive prospects for the economy, stimulating a strengthening US dollar, and in turn makes gold less attractive.
77.3 ICS 10-Year Average
0.0
20.0
40.0
60.0
80.0
100.0
120.0
4Q05
1Q06
2Q06
3Q06
4Q06
1Q07
2Q07
3Q07
4Q07
1Q08
2Q08
3Q08
4Q08
1Q09
2Q09
3Q09
4Q09
1Q10
2Q10
3Q10
4Q10
1Q11
2Q11
3Q11
4Q11
1Q12
2Q12
3Q12
4Q12
1Q13
2Q13
3Q13
4Q13
1Q14
2Q14
3Q14
4Q14
1Q15
2Q15
3Q15
Thomson Reuters University of Michigan Index of Consumer Sentiment
Index 10-Year Average

New York Focused REIT Stock PricesYear-Over-Year
Close price adjusted for dividends and splits.
New York Stock Exchange and Yahoo! Finance
• SL Green Realty increased 99% in stock value over a ten year span. September's adjusted closing was $108.95.• Boston Properties increased 156% in stock value over a ten year span. September's adjusted closing was $117.47.• Equity Residential increased 187% in stock value over a ten year span. September's adjusted closing was $73.55.• Vornado Realty Trust increased 70% in stock value over a ten year span. September's adjusted closing was $90.63.• AvalonBay Communities increased 194% in stock value over a ten year span. September's adjusted closing was $172.81
$-
$20.00
$40.00
$60.00
$80.00
$100.00
$120.00
$140.00
$160.00
$180.00
$200.00
2005 2006 2007 2008 2009 2010 2011 2012 2013 2014 2015
Real Estate Investment Trusts | Year-Over-Year (September)
SL Green Realty Boston Properties Equity Residential Vornado Realty Trust AvalonBay

Interest RatesDaily Treasury Yield Curve Rates
• Rate on Sept. 30, 2015: 0.33% • Rate on Sept. 30, 2015: 1.37% • Rate on Sept. 30, 2015: 2.06% • Rate on Sept. 30, 2015: 2.87%• 10-Year Average: 1.39% • 10-Year Average: 2.34% • 10-Year Average: 3.17% • 10-Year Average: 3.91%
U.S. Department of Treasury
One-Year Treasury Five-Year Treasury Ten-Year Treasury Thirty-Year Treasury
30-Year Treasury constant maturity series was discontinued on February 18, 2002 and reintroduced on February 9, 2006. From February 18, 2002 to February 8, 2006, Treasury published alternatives to a 30-year rate. Historical trend reflects discontinued time frame as an estimation.
0
1
2
3
4
5
6
10/3/2005 10/3/2006 10/3/2007 10/3/2008 10/3/2009 10/3/2010 10/3/2011 10/3/2012 10/3/2013 10/3/2014
Treasury Rates
One-Year Treasury Five-Year Treasury Ten-Year Treasury Thirty-Year Treasury

IIISection Three
Office Market Indicators

Availability and Vacancy Overview3Q 2015
3Q15 2Q15Q-to-QTrend
3Q14Yr-to-YrTrend
Availability by Market
Manhattan 10.6% 10.7% 10.6%
Midtown 11.0% 11.0% 11.2%
Midtown South 8.7% 8.9% 9.2%
Downtown 12.1% 12.8% 12.3%
Sublease Overall 1.5% 1.6% 1.7%
Vacancy by Market
Manhattan 8.0% 8.0% 8.4%
Midtown 7.8% 7.8% 8.2%
Midtown South 5.9% 6.0% 6.3%
Downtown 11.0% 11.3% 11.6%
Sublease Overall 0.7% 0.7% 0.8%
Strengthening Market Flat Market
Lee & Associates
Weakening Market

Asking Rent Overview (Average)Overall: Direct and Sublease
3Q15 2Q15% Change
Q-to-QQ-to-QTrend
3Q14% Change
Y-to-YY-to-YTrend
Overall Asking Rent
Manhattan $61.27 $59.78 2.5% $57.13 7.2%
Midtown $67.34 $66.14 1.8% $64.27 4.8%
Midtown South $65.27 $63.11 3.4% $60.07 8.7%
Downtown $49.15 $49.54 -0.8% $45.96 6.9%
Asking Rent by Class (Manhattan)
Class A $61.22 $60.35 1.4% $59.32 3.2%
Class B $62.52 $60.34 3.6% $54.13 4.0%
Class C $57.55 $54.85 4.9% $50.70 13.5%
Strengthening Market Flat Market Weakening Market
For historical purposes, data was based on figures provided by CoStar. Figures were based on office buildings with an RBA equal to or over 100,000 square feet. Figures may change due to post-quarter adjustments and corrections. The objective of this page is to provide a quick snapshot of the Office Market according to outside sources. Lee & Associates Office Metrics were implemented Q1 2015. Statistics on this page will reflect full Lee & Associates metrics in Q1 2016. Please reference the latest Lee & Associates NYC Manhattan Office Report for a detailed explanation of the Manhattan Office market.
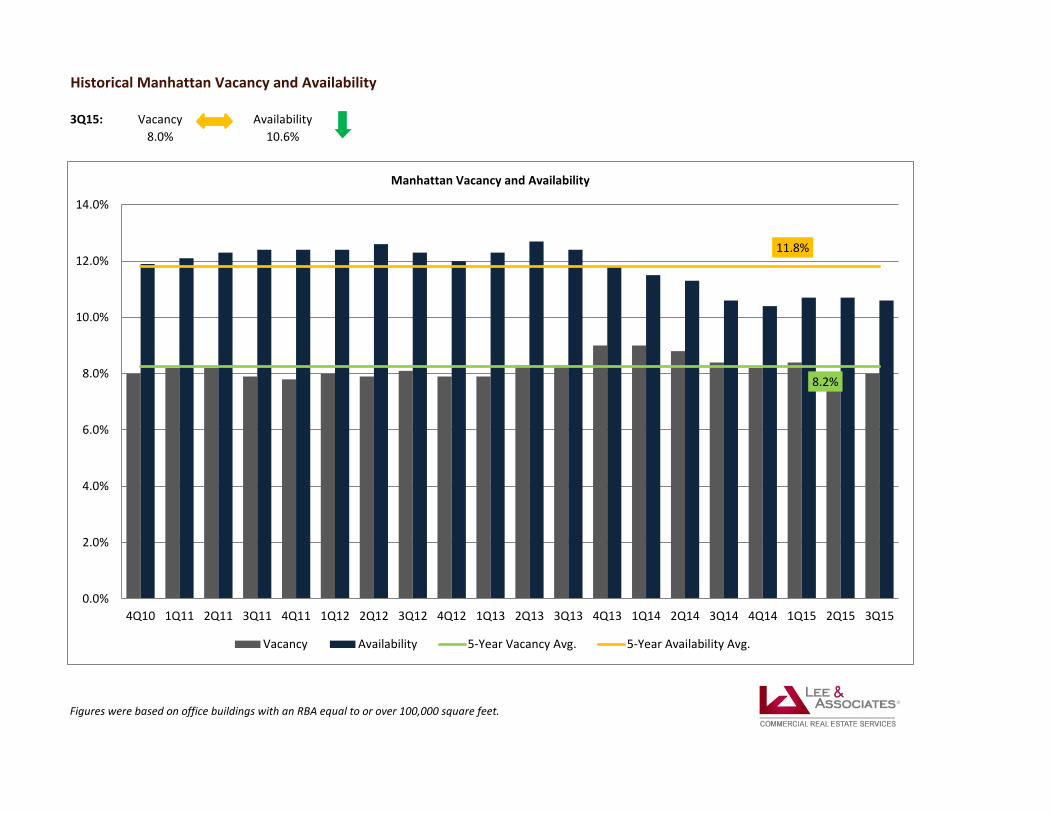
Historical Manhattan Vacancy and Availability
3Q15: Vacancy Availability8.0% 10.6%
Figures were based on office buildings with an RBA equal to or over 100,000 square feet.
8.2%
11.8%
0.0%
2.0%
4.0%
6.0%
8.0%
10.0%
12.0%
14.0%
4Q10 1Q11 2Q11 3Q11 4Q11 1Q12 2Q12 3Q12 4Q12 1Q13 2Q13 3Q13 4Q13 1Q14 2Q14 3Q14 4Q14 1Q15 2Q15 3Q15
Manhattan Vacancy and Availability
Vacancy Availability 5-Year Vacancy Avg. 5-Year Availability Avg.

Historical Availability: Market Comparison II
2Q15: Midtown Midtown South Downtown11.0% 8.7% 12.1%
Figures were based on office buildings with an RBA equal to or over 100,000 square feet.
12.1%
9.7%
14.1%
0.0%
2.0%
4.0%
6.0%
8.0%
10.0%
12.0%
14.0%
16.0%
18.0%
4Q10 1Q11 2Q11 3Q11 4Q11 1Q12 2Q12 3Q12 4Q12 1Q13 2Q13 3Q13 4Q13 1Q14 2Q14 3Q14 4Q14 1Q15 2Q15 3Q15
Historical Availability
Midtown Midtown South Downtown 5Y Midtown Avg. 5Y Midtown South Avg. 5Y Downtown Avg.

Historical Vacancy: Market Comparison
3Q15: Midtown Midtown South Downtown7.8% 5.9% 11.0%
Figures were based on office buildings with an RBA equal to or over 100,000 square feet.
8.4%
6.5%
10.2%
0.0%
2.0%
4.0%
6.0%
8.0%
10.0%
12.0%
14.0%
4Q10 1Q11 2Q11 3Q11 4Q11 1Q12 2Q12 3Q12 4Q12 1Q13 2Q13 3Q13 4Q13 1Q14 2Q14 3Q14 4Q14 1Q15 2Q15 3Q15
Historical Vacancy
Midtown Midtown South Downtown
5-Year Midtown Avg. 5-Year Mid. South Avg. 5-Year Downtown Avg.
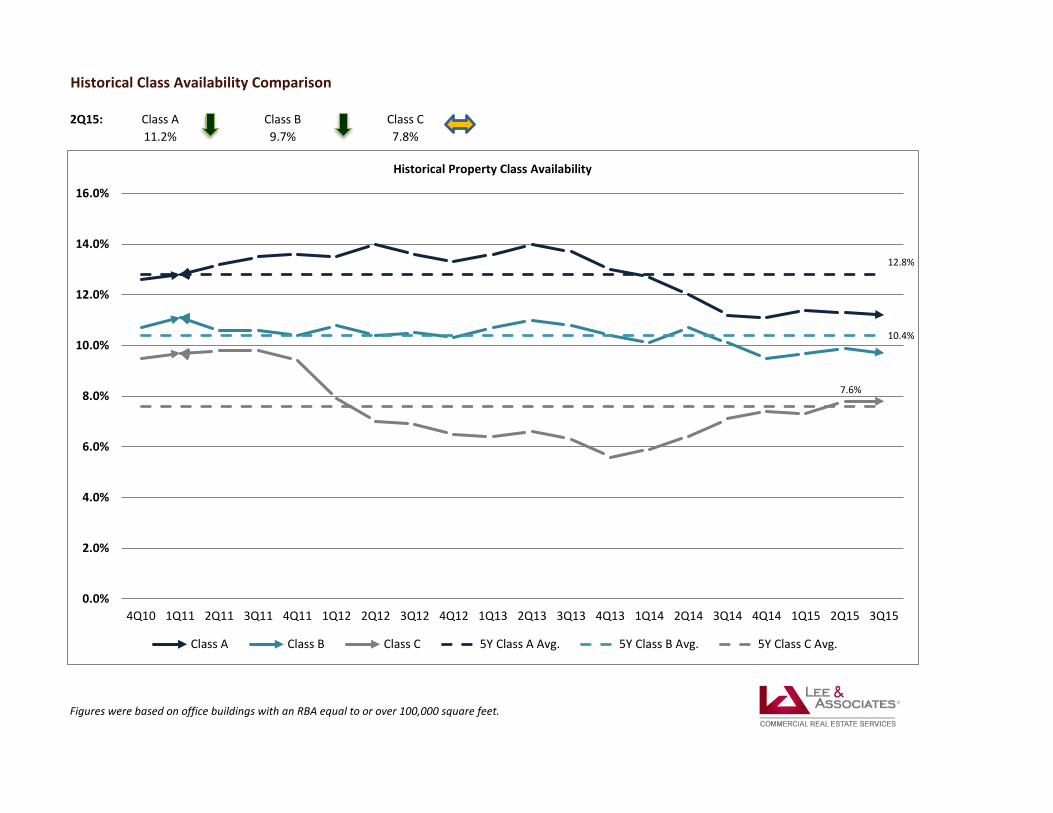
Historical Class Availability Comparison
2Q15: Class A Class B Class C11.2% 9.7% 7.8%
Figures were based on office buildings with an RBA equal to or over 100,000 square feet.
12.8%
10.4%
7.6%
0.0%
2.0%
4.0%
6.0%
8.0%
10.0%
12.0%
14.0%
16.0%
4Q10 1Q11 2Q11 3Q11 4Q11 1Q12 2Q12 3Q12 4Q12 1Q13 2Q13 3Q13 4Q13 1Q14 2Q14 3Q14 4Q14 1Q15 2Q15 3Q15
Historical Property Class Availability
Class A Class B Class C 5Y Class A Avg. 5Y Class B Avg. 5Y Class C Avg.

Yearly Historical Available Supply: Direct vs Sublease
Figures were based on office buildings with an RBA equal to or over 100,000 square feet.
30.89 28.34 33.55
43.52 46.00 47.84 47.39 48.48 43.76 43.60
8.31 7.66
8.88
15.09 12.11 9.67 10.24 9.18
7.90 7.12
-
10.00
20.00
30.00
40.00
50.00
60.00
70.00
2006 2007 2008 2009 2010 2011 2012 2013 2014 2015 to Date
Mill
ions
SF
Direct vs Sublease | Yearly Historical
Direct Sublease

Historical Manhattan Asking Rents
3Q Direct Sublease Overall2015 61.44$ 50.54$ 61.27$
For historical purposes, data was based on figures provided by CoStar. Figures were based on office buildings with an RBA equal to or over 100,000 square feet. Figures may change due to post-quarter adjustments and corrections. The objective of this page is to provide a quick snapshot of the Office Market according to outside sources. Lee & Associates Office Metrics were implemented Q1 2015. Please reference the latest Lee & Associates NYC Manhattan Office Report for a detailed explanation of the Manhattan Office market.
$53.56
$47.49
$52.92
$-
$10.00
$20.00
$30.00
$40.00
$50.00
$60.00
$70.00
$80.00
4Q2005 3Q2006 2Q2007 1Q2008 4Q2008 3Q2009 2Q2010 1Q2011 4Q2011 3Q2012 2Q2013 1Q2014 4Q2014 3Q2015
Historical Manhattan Asking Rents
Direct Sublet Overall 10-Year Direct Avg. 10-Year Sublet Avg. 10-Year Overall Avg.

Historical Overall Asking Rents: Market Comparison
3Q Midtown Midtown South Downtown2015 $67.34 $65.27 $49.15
For historical purposes, data was based on figures provided by CoStar. Figures were based on office buildings with an RBA equal to or over 100,000 square feet. Figures may change due to post-quarter adjustments and corrections. The objective of this page is to provide a quick snapshot of the Office Market according to outside sources. Lee & Associates Office Metrics were implemented Q1 2015. Please reference the latest Lee & Associates NYC Manhattan Office Report for a detailed explanation of the Manhattan Office market.
$66.11
$46.61
$43.34
$-
$10.00
$20.00
$30.00
$40.00
$50.00
$60.00
$70.00
$80.00
$90.00
4Q20
051Q
2006
2Q20
063Q
2006
4Q20
061Q
2007
2Q20
073Q
2007
4Q20
071Q
2008
2Q20
083Q
2008
4Q20
081Q
2009
2Q20
093Q
2009
4Q20
091Q
2010
2Q20
103Q
2010
4Q20
101Q
2011
2Q20
113Q
2011
4Q20
111Q
2012
2Q20
123Q
2012
4Q20
121Q
2013
2Q20
133Q
2013
4Q20
131Q
2014
2Q20
143Q
2014
4Q20
141Q
2015
2Q20
153Q
2015
Historical Overall Asking Rents | Market Comparison
Midtown Midtown South Downtown
10-Year Midtown Avg. 10-Year Mid. South Avg. 10-Year Downtown Avg.
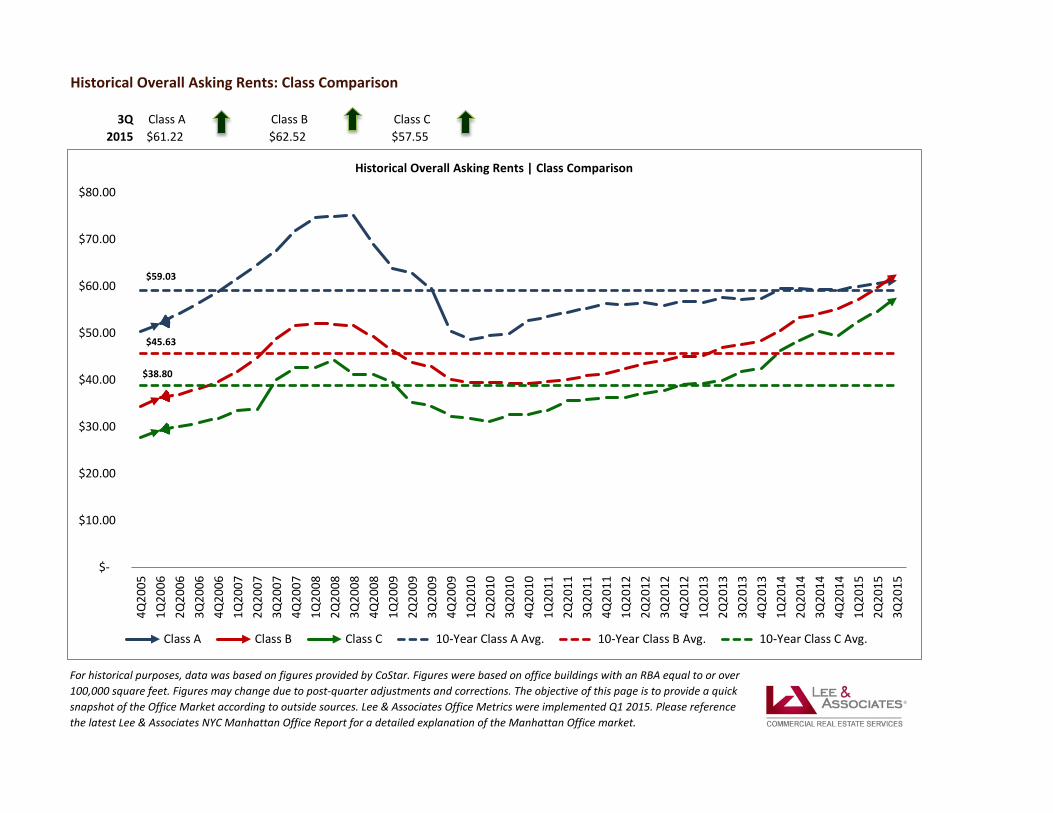
Historical Overall Asking Rents: Class Comparison
3Q Class A Class B Class C2015 $61.22 $62.52 $57.55
For historical purposes, data was based on figures provided by CoStar. Figures were based on office buildings with an RBA equal to or over 100,000 square feet. Figures may change due to post-quarter adjustments and corrections. The objective of this page is to provide a quick snapshot of the Office Market according to outside sources. Lee & Associates Office Metrics were implemented Q1 2015. Please reference the latest Lee & Associates NYC Manhattan Office Report for a detailed explanation of the Manhattan Office market.
$59.03
$45.63
$38.80
$-
$10.00
$20.00
$30.00
$40.00
$50.00
$60.00
$70.00
$80.00
4Q20
051Q
2006
2Q20
063Q
2006
4Q20
061Q
2007
2Q20
073Q
2007
4Q20
071Q
2008
2Q20
083Q
2008
4Q20
081Q
2009
2Q20
093Q
2009
4Q20
091Q
2010
2Q20
103Q
2010
4Q20
101Q
2011
2Q20
113Q
2011
4Q20
111Q
2012
2Q20
123Q
2012
4Q20
121Q
2013
2Q20
133Q
2013
4Q20
131Q
2014
2Q20
143Q
2014
4Q20
141Q
2015
2Q20
153Q
2015
Historical Overall Asking Rents | Class Comparison
Class A Class B Class C 10-Year Class A Avg. 10-Year Class B Avg. 10-Year Class C Avg.


Manhattan 10-Year Quarterly Net Absorption
Figures were based on office buildings with an RBA equal to or over 100,000 square feet.
(4,000,000)
(3,000,000)
(2,000,000)
(1,000,000)
0
1,000,000
2,000,000
3,000,000
4,000,0004Q
2005
1Q20
062Q
2006
3Q20
064Q
2006
1Q20
072Q
2007
3Q20
074Q
2007
1Q20
082Q
2008
3Q20
084Q
2008
1Q20
092Q
2009
3Q20
094Q
2009
1Q20
102Q
2010
3Q20
104Q
2010
1Q20
112Q
2011
3Q20
114Q
2011
1Q20
122Q
2012
3Q20
124Q
2012
1Q20
132Q
2013
3Q20
134Q
2013
1Q20
142Q
2014
3Q20
144Q
2014
1Q20
152Q
2015
3Q20
15
Manhattan Net Absorption
Net Absorption 10-Year Average
352,306 Ten Year Average

Manhattan 10-Year Quarterly Leasing Activity
Figures were based on office buildings with an RBA equal to or over 100,000 square feet.
8,813,144 Ten-Year Average
-
2,000,000
4,000,000
6,000,000
8,000,000
10,000,000
12,000,000
14,000,000
16,000,000
18,000,000
4Q20
051Q
2006
2Q20
063Q
2006
4Q20
061Q
2007
2Q20
073Q
2007
4Q20
071Q
2008
2Q20
083Q
2008
4Q20
081Q
2009
2Q20
093Q
2009
4Q20
091Q
2010
2Q20
103Q
2010
4Q20
101Q
2011
2Q20
113Q
2011
4Q20
111Q
2012
2Q20
123Q
2012
4Q20
121Q
2013
2Q20
133Q
2013
4Q20
131Q
2014
2Q20
143Q
2014
4Q20
141Q
2015
2Q20
153Q
2015
Squa
re F
eet
Quarterly Leasing Activity
Leasing Activity 10-Year Average

CoStar and Lee & Associates
Lee & Associates (New York) | JLL (National)
$73.28 $66.80
$41.68 $36.53
$35.27 $33.98 $33.70
$33.17 $32.59
$31.80 $30.83
$29.91 $29.82
$29.52 $29.28
$28.59 $28.21
$26.33 $25.63
$25.21 $25.16
$24.27 $24.08 $23.93 $23.75
$22.94 $22.63 $22.49 $22.43 $22.42 $22.32 $22.26 $22.03
$21.01 $20.62 $20.52 $20.36
$19.68
$- $10.00 $20.00 $30.00 $40.00 $50.00 $60.00 $70.00 $80.00
New YorkSan FranciscoSilicon Valley
Washington D.C.Los Angeles
MiamiSeattleBostonAustin
Fairfield County (CT)OaklandChicago
West Palm BeachSan Diego
HoustonOrange County (CA)
Ft. LauderdaleLong Island
MinneapolisDenver
New JerseyWestchester County (NY)
PortlandDallas
PhiladelphiaCharlotte
San AntonioPhoenix
SacramentoBaltimore
AtlantaPittsburgh
Tampa BayNashville
Raleigh-DurhamOrlando
Salt Lake CitySt. Louis
Q3 2015 Class A Average Office Rates

Lee & Associates NYC600 Madison Avenue, Third FloorNew York, NY 10022www.leeassociatesnyc.com
James [email protected]
Henry AbramovResearch [email protected]
Lee & Associates NYC | Real Estate Economics Metrics Tracker | Third Quarter 2015