3rd iasme / wseas int. conf. on water resources ... · ukai dam controls the flow of water and...
TRANSCRIPT

STUDY OF FLOOD AT SURAT CITY AND ITS REMSDIAL MEASURES
PRASIT G. AGNIHOTRI, LECTURER AND PH. D. SCHOLAR DR. JAYANTILAL N. PATEL, PROFESSOR
Civil Engineering Department S.V. National Institute of Technology Ichchhanath, Surat-395007. (Gujarat)
INDIA
Abstract: - Floods affect Suart city situated on river Tapi in India many times, which creates damage to the people and properties. In this paper the study of floods at Surat city in general and the study of flood occurred at Surat during 2006 in particular has been made. Certain preventive and curative measures are suggested for reducing the effects of flood in the study area. Key Words: -Surat, River Tapi, Flood, Submergence, Flood Level, Desilting, Diversion, Protection wall, Rainfall 1 Introduction Surat city is situated at the bank of river Tapi. The river Tapi is originating from a mountain Satpuda and flowing through three states Maharastra, Madhya Pradesh and Gujarat. The river Tapi is merging to the Arabian Sea at about 15 kms away from Surat city. The city is situated at the delta region of river Tapi. Ukai dam controls the flow of water and water level in the river Tapi, which is 100 kms away from Surat city. The dam is constructed at Ukai, Tal: Songadh, Dist: Surat. The foundation of dam is resting on Dolerite dykes (Basalt). It is constructed for irrigation purpose mainly and also served the purpose of flood control, generation of hydropower and supply of industrial and drinkable water. The average rainfall in the catchment area is about 785 mm and average yearly run off is 17,226 MCM. The salient features of Ukai Reservoir are shown in Table 1. Total seventeen rain gauge stations are available at different places and twenty two wireless stations are linked with the dam site, which gives the information about rainfall to the Central Water Commission. The Indian Meteorology department predicts the probability of rainfall in the catchment area during next 24 to 48 hours and same information is transferred to Central Water Commission and media. The CWC measures the rainfall at seventeen rain gauge stations and calculate the amount of water to be anticipated to reservoir within 12 hours from the time of measurement. The same information is given to irrigation department of Gujarat state and to the focal officer (Superintendent Engineer, irrigation circle). Surat city is situated at tail end of river Tapi. Flood occurs at Surat city frequently due to sudden release of water from Ukai dam in river Tapi. At the time of floods
in river Tapi, Surat city and surrounding regions are most affected. History of floods at Surat city, details of floods and remedial measures for prevention / minimization of the effect of floods at Surat city are discussed in the subsequent topics.
Table 1 : Salient Features of Ukai Reservoir
Sr. No.
Item Description
1 Location Songadh, (District Surat)
2 River Tapi 3 Catchment Area 62 225 sq km 4 Design Flood
Discharge 49 490 cumecs (1.75 million cusecs)
5 Year Of Completion 1972 6 Gross Storage
Capacity 8.511 BCM
7 Live Storage Capacity
7.092 BCM
8 FRL 105.22 m (345 ft) 9 HFL 107 mt (351 ft.) 10 MDDL 82.3 m (270 ft) 11 Riverbed level 47.87 m (157.05 ft) 12 Installed Power
Generation Capacity 305 MW (4 X 75 MW + 2 X 2.5 MW – this was added at a latter date)
13 Hydraulic Head 34-57 m 14 Maximum Discharge 213 cumecs (7522
cusecs)
3rd IASME / WSEAS Int. Conf. on WATER RESOURCES, HYDRAULICS & HYDROLOGY (WHH '08), University of Cambridge, UK, Feb. 23-25, 2008
ISSN: 1790-2769 Page 151 ISBN: 978-960-6766-37-4

Fig. 1 Map of Tapi River Basin
2 Floods At Surat City The city has faced many floods since long back. There was a flood in the Surat in 1959, 1968, 1998 and 2006. The summary of the flood is given in the table below.
Table 2 : Flood History at Surat Sr. No.
Flood Event
Discharge (Cusecs)
Water Level at Hop Bridge
Period
1 1883 10.05 11.05 July 2 1884 8.46 10.05 September 3 1894 8.01 10.33 July 4 1942 8.60 10.56 August 5 1944 11.84 11.32 August 6 1945 10.24 11.09 August 7 1949 8.42 10.49 September 8 1959 12.94 11.55 September 9 1968 15.5 Lakh 12.08mt. August 10 1994 5.25 Lakh 10.10mt. Aug.-Sep. 11 1998 7.0 Lakh 11.40mt. September 12 2006 9.09 Lakh 12.40mt. August
2.1 Scenario of Flood During August 2006 The level of water started rising in the river Tapi from 1st August 2006 and started spreading in the nearby area of city. By 5th to 9th August 2006, almost 90% area of the city was flooded and according to the topography of water observed in the different area was varying with
respect to the topography of the City. The map of Surat city has been attached showing the variation in the depth of submergence by different colours. The information and warning about flood must be reached to the people timely so that the people can take their own measures of safety and precautions. The figure 2 shows the status of warning in Surat during flood 2006. From the figure, it is evident that about 43% of people did not receive any warning from the Surat Municipal Corporation (SMC) or any other state agency. They learnt about the approaching ood only when they saw the water rising. This proportion was highest (64%) in areas like citylight, umra and piplod, all of which are considered Surat’s posh or upcoming localities. Only around 7% of respondents said that they had received some warning from the administration through vans or Short Service Messages (SMS) on mobile phones. As many as 30.7% of respondents said that they first learnt about the ood through the media. Friends, relatives and neighbours were of big help in warning people. A significant share making up for 20% of respondents said that they got information about the flood either through their friends, relatives or neighbours. The authenticity of message received other than local authority and the media is to be checked. It may cause unnecessary fear and disorder among the community. It is necessary to develop control techniques for flood as well as better warning system if flood occurs. Photographs of a rescue work, flooded river Tapi and area of city are shown in Fig. 4, Fig. 5 and Fig. 6.
Fig. 2 Pie Chart Showing Status of Warning (Source: [2])
Through Neighbours�9.33%
Through Media�30.67%
Through Friends
and Relatives�10.67%
Through Administration�6.8%
No Warning�42.53%
3rd IASME / WSEAS Int. Conf. on WATER RESOURCES, HYDRAULICS & HYDROLOGY (WHH '08), University of Cambridge, UK, Feb. 23-25, 2008
ISSN: 1790-2769 Page 152 ISBN: 978-960-6766-37-4

Fig. 3 Map of Surat City (From S.M.C.)
Fig. 4 A Rescue Work
Fig. 5 Flooded Area of Surat City
Fig. 6 Overflowing Bridges during Flood
3rd IASME / WSEAS Int. Conf. on WATER RESOURCES, HYDRAULICS & HYDROLOGY (WHH '08), University of Cambridge, UK, Feb. 23-25, 2008
ISSN: 1790-2769 Page 153 ISBN: 978-960-6766-37-4
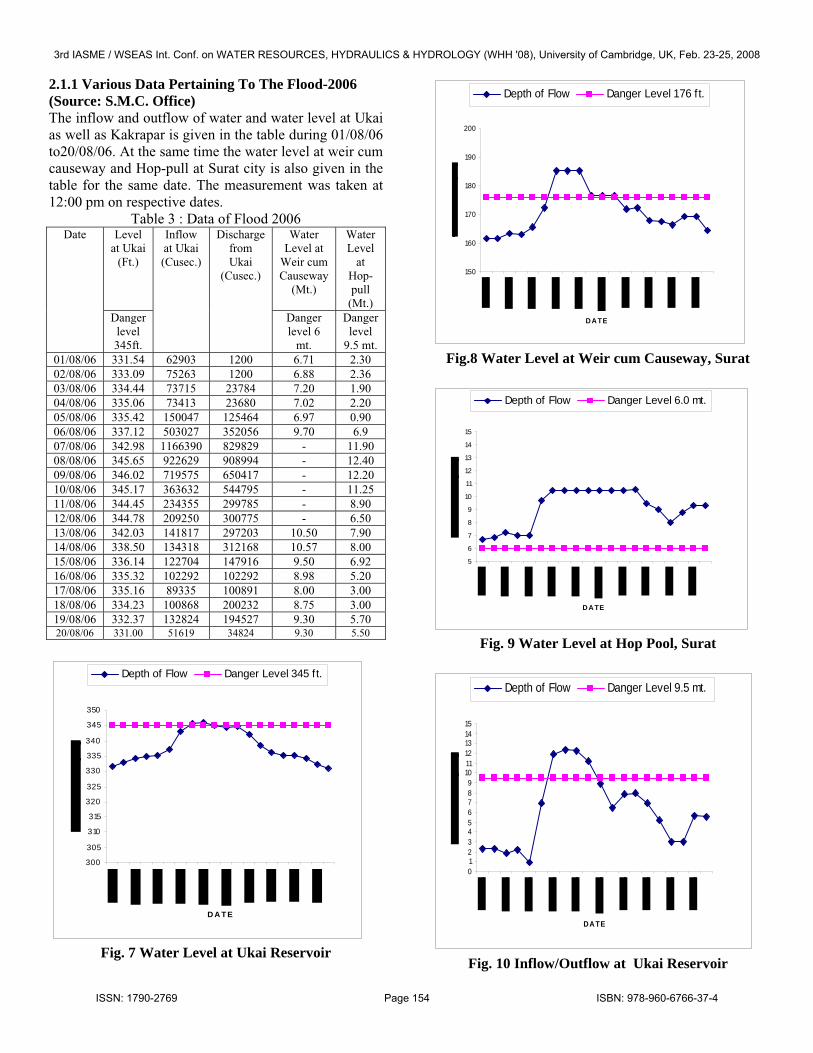
2.1.1 Various Data Pertaining To The Flood-2006 (Source: S.M.C. Office) The inflow and outflow of water and water level at Ukai as well as Kakrapar is given in the table during 01/08/06 to20/08/06. At the same time the water level at weir cum causeway and Hop-pull at Surat city is also given in the table for the same date. The measurement was taken at 12:00 pm on respective dates.
Table 3 : Data of Flood 2006 Level
at Ukai (Ft.)
Water Level at
Weir cum Causeway
(Mt.)
Water Level
at Hop-pull
(Mt.)
Date
Danger level 345ft.
Inflow at Ukai (Cusec.)
Discharge from Ukai
(Cusec.)
Danger level 6
mt.
Danger level
9.5 mt. 01/08/06 331.54 62903 1200 6.71 2.30 02/08/06 333.09 75263 1200 6.88 2.36 03/08/06 334.44 73715 23784 7.20 1.90 04/08/06 335.06 73413 23680 7.02 2.20 05/08/06 335.42 150047 125464 6.97 0.90 06/08/06 337.12 503027 352056 9.70 6.9 07/08/06 342.98 1166390 829829 - 11.90 08/08/06 345.65 922629 908994 - 12.40 09/08/06 346.02 719575 650417 - 12.20 10/08/06 345.17 363632 544795 - 11.25 11/08/06 344.45 234355 299785 - 8.90 12/08/06 344.78 209250 300775 - 6.50 13/08/06 342.03 141817 297203 10.50 7.90 14/08/06 338.50 134318 312168 10.57 8.00 15/08/06 336.14 122704 147916 9.50 6.92 16/08/06 335.32 102292 102292 8.98 5.20 17/08/06 335.16 89335 100891 8.00 3.00 18/08/06 334.23 100868 200232 8.75 3.00 19/08/06 332.37 132824 194527 9.30 5.70 20/08/06 331.00 51619 34824 9.30 5.50
300
305
310
315
320
325
330
335
340
345
350
D A T E
Depth of Flow Danger Level 345 ft.
Fig. 7 Water Level at Ukai Reservoir
150
160
170
180
190
200
DATE
Depth of Flow Danger Level 176 f t.
Fig.8 Water Level at Weir cum Causeway, Surat
5
6
7
8
9
10
11
12
13
14
15
DATE
Depth of Flow Danger Level 6.0 mt.
Fig. 9 Water Level at Hop Pool, Surat
0123456789
101112131415
DATE
Depth of Flow Danger Level 9.5 mt.
Fig. 10 Inflow/Outflow at Ukai Reservoir
3rd IASME / WSEAS Int. Conf. on WATER RESOURCES, HYDRAULICS & HYDROLOGY (WHH '08), University of Cambridge, UK, Feb. 23-25, 2008
ISSN: 1790-2769 Page 154 ISBN: 978-960-6766-37-4

3 Remedial Measures Some remedial measures which include preventive as well as curative steps for the control of flood at Surat are indicated below. 3.1 Preventative Measures 3.1.1 Reservoir Operation Policy Full reservoir level at dam is 345 ft., but the water can be stored up to 351 ft. In critical condition water can be stored up to 348.5 ft. safely according to a study report. 3.1.2 Warning System from U/S Side It is necessary to place advanced and computerized rain gauge stations in the catchment area and must be linked with dam site and flood forecasting cell. 3.1.3 Discharge of water from the Dam The discharge of water from the dam must be in accordance with the water level in the reservoir without affecting the main purpose of irrigation. The power for this action must be avail with dam Superintendent Engineer. The information regarding discharge of water from dam in critical condition must be given to down stream area effectively and timely. 3.2 Curative Measures 3.2.1 Desilting in Reservoir Due to silting in the reservoir the dead storage capacity of dam has been reduced. The average rate of silting is 1 ft. per year. It is difficult to completely remove mud and silt from the dam, however silt removal devices can be installed to minimize the effects. 3.2.2 Increasing the carrying capacity of River Tapi The effective waterway of river Tapi reduce day by day with respect to width and depth due to silting. The dredging of river in certain reaches can be carried out by conducting its feasibility project. 3.2.4 Storm Water Drainage Line Parallel to River Tapi Construction of storm water drainage line parallel to river Tapi must be done on both the bank and necessary floodgates must be placed. 3.2.5 Construction of Flood Protection Wall It is necessary to provide flood protection wall on both the bank of river Tapi where the community is residing. The existing flood protection wall may not be sufficient in respect of length and height as well as it is in a damaged condition. This must be monitored regularly. 3.2.6 Recharge of Ground Water It is necessary to construct recharge wells in the area, which can absorb some portion of the flood water. Such type of artificial recharge wells must be constructed after proper planning and design. 3.2.7 Spreading of Flood Water on Saline Soil
The floodwater may be diverted to the area where saline soil exists. Such a diversion may be done by construction of storm drainage line from the flooded area to the saline area. 3.2.8 Diversion of Flood Water to Other Rivers The drainage system should be developed in such a way that during the situation of flood in river Tapi the water can be diverted to other river viz. Kim, Purna, Mindhola, Tena Khadi etc. existing near river Tapi. 3.2.9 Hi-tech Disaster Management
1. A preparation of counter map for the area from ukai to Sultanabad including Surat city using GPS technique.
2. A preparation of map showing markings of H.F.L as well as their reference (latitude & longitude). This must be co related with discharge and water level at dam.
3. Reference map (co-ordinate) of place should be with rescue and relief team, so that if flood occurs, relief work can be done effectively and efficiently by boat, helicopter etc.
4. Flood hazard map should be prepared using GIS data.
4 Conclusion Surat city (India) situated at the tail end of river Tapi is subjected to moderate to heavy floods frequently due to heavy rainfall in the catchment area. Study of floods at Surat city has been made in this paper. To minimize the effect of flood at Surat city, certain preventative and curative measures have been suggested and discussed in this paper. References: [1] AjayKumar (1995), “Flood Control and
settlement Planning” Mohit Publication, New Delhi.
[2] Akash Acharya, Biswaroop Das, Kiran Pandya et al, (2006), “Surat 2006 Floods: A Citizens’ Report” Centre for Social Studies (CSS) Surat and Department of Human Resource Development (DHRD), Veer Narmad South Gujarat University, Surat October 2006.
[3] Dvoracek M. J. and Peterson S.H., (1971), Artificial Recharge in Water Resources Management. Journal of Irrigation and Drainage Division, A.S.C.E., Vol. 97, No. IR2.
[4} Huisman L. and Olsthoorn T.N., (1983), Artificial Groundwater Recharge, 1st edition, Pitman Advanced Publishing Program, London.
[5] Patel J.N. and Gotawala H.C., (2001), Some Aspects of Storm water Drainage System in
3rd IASME / WSEAS Int. Conf. on WATER RESOURCES, HYDRAULICS & HYDROLOGY (WHH '08), University of Cambridge, UK, Feb. 23-25, 2008
ISSN: 1790-2769 Page 155 ISBN: 978-960-6766-37-4

Conjunction with Groundwater Recharge, International conference on Civil Engineering, July 23-25, 2001, organized by Indian Institute of Science, Bangalore, India.
[6] Patel J.N., (2002), Flood Management over a Region of River Tapi using GPS, Journal of Geospatial Today, Vol. 1, Issue 4, October-November 2002
[7] Patel J.N., (2006), Strategy for Improvement of Groundwater Quality in the Coastal Area near a River, 2nd International Conference on Hydrology and Watershed Management, 5-8 December, 2006, Organized by J.N.T. University, Hyderabad, India.
[8] Patel J. N.,(2007), “Application of Geospatial Technologies For Sustainable Irrigation and Reclamation of Saline Soil”, Fourth International Conference on Irrigation and Drainage, held at Sacramento, USA October 2007, Organized by ICID and USCID, USA.
[9] Shelat R.N. (1969), “Flood Control and the Use of River Water Resources” South Gujarat University, Surat.
[10] Stan Aronoff, (1989) “Geographic Information Systems: A management perspective”, WDL Publications, Canada.
WEBSITES [11] http://www.sandrp.in/new/surat floods aug08.pdf.com [12] http://edcdaac.usgs.gov/aster/ast14dem.html (True as per 14th August, 2003) United States Geological Survey Website [13] http://www.gislounge.com/ll/hydrology.shtml [14] http://www.gpsdotnet.com
3rd IASME / WSEAS Int. Conf. on WATER RESOURCES, HYDRAULICS & HYDROLOGY (WHH '08), University of Cambridge, UK, Feb. 23-25, 2008
ISSN: 1790-2769 Page 156 ISBN: 978-960-6766-37-4