3rd quarter earnings call - pplweb.investorroom.com...(1) 2015 earnings and 2014 earnings (adjusted)...
TRANSCRIPT

© PPL Corporation 2015
3rd Quarter Earnings Call
PPL CorporationOctober 29, 2015

© PPL Corporation 2015 2
Cautionary Statements and Factors That May Affect Future Results
Any statements made in this presentation about future operatingresults or other future events are forward‐looking statementsunder the Safe Harbor Provisions of the Private SecuritiesLitigation Reform Act of 1995. Actual results may differ materiallyfrom such forward‐looking statements. A discussion of factorsthat could cause actual results or events to vary is contained inthe Appendix to this presentation and in the Company’s SECfilings.
© PPL Corporation 2015
Third Quarter Earnings Results, 2015 Earnings Forecast and Operational Overview
U.K. Disclosures: Performance Against Incentives
Segment Results and Financial Overview
Q&A
W. H. Spence
V. Sorgi
Agenda
R. Symons
3

© PPL Corporation 2015
Per S
hare
Note: See Appendix for the reconciliation of reported earnings (loss) to earnings from ongoing operations.
(1) Year‐to‐date reported earnings includes a $915 million loss from discontinued operations, or $1.36 per share.(2) 2014 was adjusted for Supply segment earnings and dissynergies related to the spinoff of the Supply segment. 2015 excludes earnings from the Supply segment.
Earnings Results
$0.74 $0.58
($0.75)
($0.25)
$0.25
$0.75
$1.25
$1.75
$2.25
$2.75
3Q 2014 3Q 2015
Third Quarter Reported Earnings
$0.44 $0.51
($0.75)
($0.25)
$0.25
$0.75
$1.25
$1.75
$2.25
$2.75
3Q 2014 (adj) 3Q 2015
Third Quarter Earnings from Ongoing Operations(2)
Per S
hare
$1.57
$0.42
($0.75)($0.25)$0.25$0.75$1.25$1.75$2.25$2.75
3Q 2014 3Q 2015
Year‐to‐Date Reported Earnings
(1)
Per S
hare
$1.54 $1.77
($0.75)($0.25)$0.25$0.75$1.25$1.75$2.25$2.75
3Q 2014 (adj) 3Q 2015
Year‐to‐Date Earnings from Ongoing Operations(2)
Per S
hare
4

© PPL Corporation 2015
$0.00
$1.00
$2.00
$3.00
2014 Adj Original 2015E Revised 2015E
$2.15
Per S
hare
2015 Ongoing Earnings Forecast
$2.25$2.03
Note: See Appendix for the reconciliation of reported earnings (loss) to earnings from ongoing operations.
(1) 2015 earnings and 2014 earnings (adjusted) presented here excludes any earnings from the Supply segment. However, the Supply segment is part of PPL Corporation’s consolidated reported earnings for the first five months of 2015.
(2) For 2014, earnings from ongoing operations (adjusted) reflects the full impact of dissynergies related to the spinoff of the Supply segment: Indirect O&M ($0.07), Interest ($0.05) and Depreciation ($0.01).
Segment 2014 Earnings (Adjusted)(1)
Original 2015EMidpoint(1)
Revised 2015EMidpoint(1)
U.K. Regulated $1.37 $1.38 $1.43
Kentucky Regulated 0.47 0.48 0.51
PA Regulated 0.40 0.39 0.37
Corporate and Other (0.21) (0.10) (0.11)
Total $2.03 $2.15 $2.20
$2.25
(2)
$2.05
5
© PPL Corporation 2015
Pennsylvania• Rate Case Update
• Black box settlement reached• Includes an annual revenue increase of $124 million• Subject to approval by the Public Utility Commission • Rate increase expected to take effect January 1, 2016
• Smart Meter Program• 23rd JD Power Award Received• Project Compass Update
Kentucky• Environmental Update
U.K.• Performance against incentives
Operational Overview
6
© PPL Corporation 2015 7
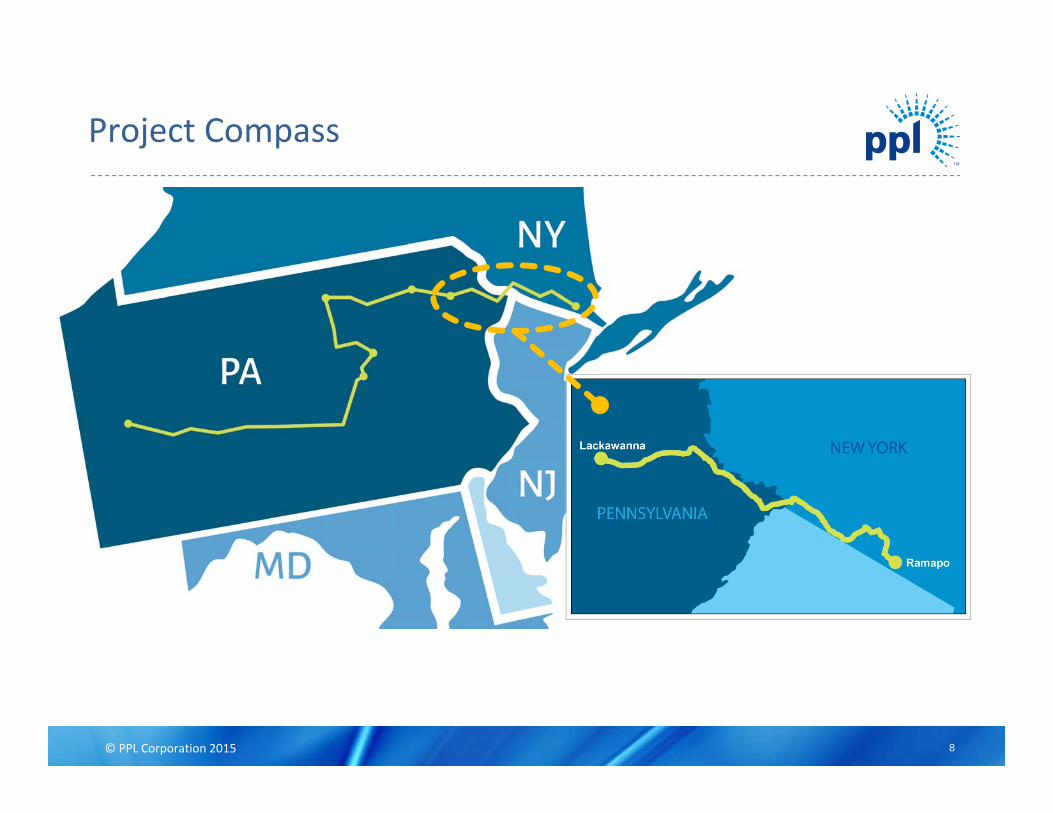
Proposed First Segment:• 95‐mile initial segment from Blakely, PA to Ramapo, NY
• PPL Electric filed interconnection request with NYISO on October 27th• Estimated cost of $500 ‐ $600 million• Estimated in‐service date in 2023
• Benefits as proposed include:• Substantial annual savings for NY customers• Economic development benefits• Grid reliability
Full Project Current Plan: 475‐mile transmission line from Western PA to Southeastern NY at an estimated cost of $3 – $4 billion.
Project Compass Summary
© PPL Corporation 2015
Project Compass
8

© PPL Corporation 2015
Pennsylvania• Rate Case Update
• Black box settlement reached• Includes an annual revenue increase of $124 million• Subject to approval by the Public Utility Commission • Rate increase expected to take effect January 1, 2016
• Smart Meter Program• 23rd JD Power Award Received• Project Compass Update
Kentucky• Environmental Update
U.K.• Performance against incentives
Operational Overview
9
© PPL Corporation 2015
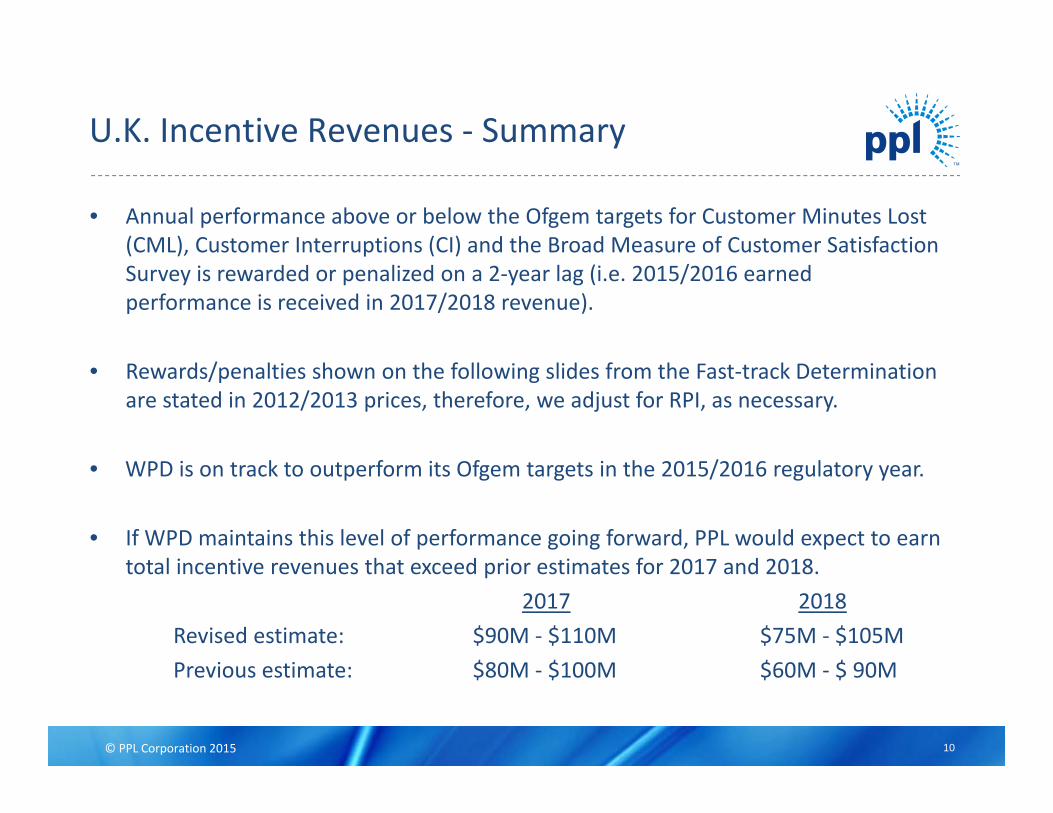
U.K. Incentive Revenues ‐ Summary
• Annual performance above or below the Ofgem targets for Customer Minutes Lost (CML), Customer Interruptions (CI) and the Broad Measure of Customer Satisfaction Survey is rewarded or penalized on a 2‐year lag (i.e. 2015/2016 earned performance is received in 2017/2018 revenue).
• Rewards/penalties shown on the following slides from the Fast‐track Determination are stated in 2012/2013 prices, therefore, we adjust for RPI, as necessary.
• WPD is on track to outperform its Ofgem targets in the 2015/2016 regulatory year.
• If WPD maintains this level of performance going forward, PPL would expect to earn total incentive revenues that exceed prior estimates for 2017 and 2018.
2017 2018Revised estimate: $90M ‐ $110M $75M ‐ $105MPrevious estimate: $80M ‐ $100M $60M ‐ $ 90M
10
© PPL Corporation 2015
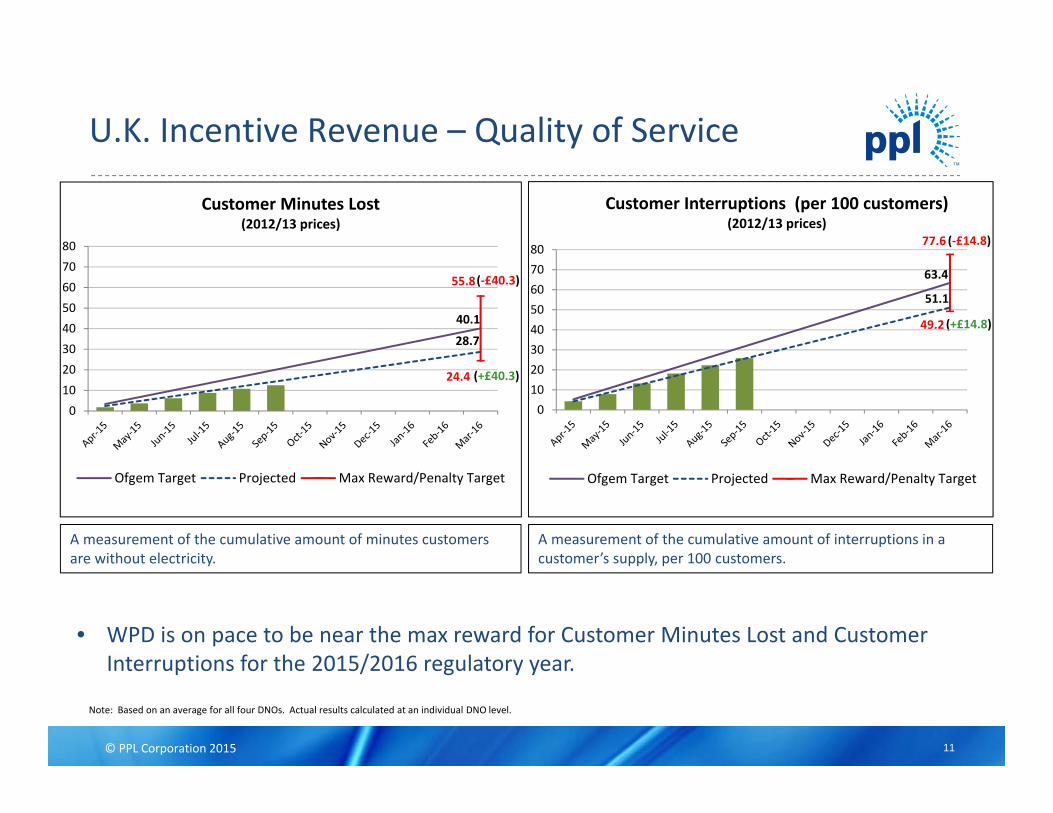
U.K. Incentive Revenue – Quality of Service
• WPD is on pace to be near the max reward for Customer Minutes Lost and Customer Interruptions for the 2015/2016 regulatory year.
Note: Based on an average for all four DNOs. Actual results calculated at an individual DNO level.
(+£14.8)40.1
28.7
24.4
55.8
01020304050607080
Customer Minutes Lost(2012/13 prices)
Ofgem Target Projected Max Reward/Penalty Target
63.4
51.1
49.2
77.6
01020304050607080
Customer Interruptions (per 100 customers)(2012/13 prices)
Ofgem Target Projected Max Reward/Penalty Target
(‐£40.3)
(+£40.3)
(‐£14.8)
11
A measurement of the cumulative amount of minutes customers are without electricity.
A measurement of the cumulative amount of interruptions in a customer’s supply, per 100 customers.
© PPL Corporation 2015
6.5
7.5
8.5
9.5
Interruptions Connections General Inquiries
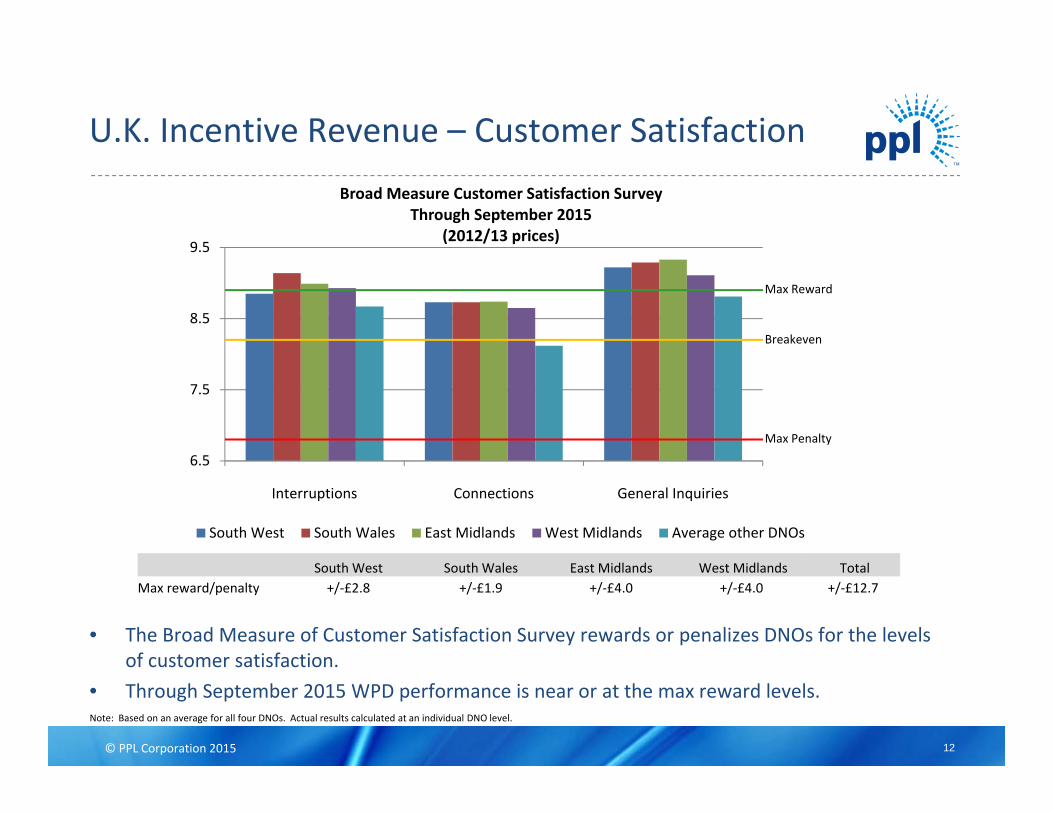
Broad Measure Customer Satisfaction SurveyThrough September 2015
(2012/13 prices)
South West South Wales East Midlands West Midlands Average other DNOs
U.K. Incentive Revenue – Customer Satisfaction
• The Broad Measure of Customer Satisfaction Survey rewards or penalizes DNOs for the levels of customer satisfaction.
• Through September 2015 WPD performance is near or at the max reward levels.Note: Based on an average for all four DNOs. Actual results calculated at an individual DNO level.
South West South Wales East Midlands West Midlands Total Max reward/penalty +/‐£2.8 +/‐£1.9 +/‐£4.0 +/‐£4.0 +/‐£12.7
Max Reward
Breakeven
Max Penalty
12

© PPL Corporation 2015
Summary Financial Highlights
13

© PPL Corporation 2015
Q3 2015 Q3 2014 (adj) ChangePennsylvania Regulated $0.08 $0.08 $0.00Kentucky Regulated 0.16 0.12 0.04U.K. Regulated 0.29 0.28 0.01Corporate and Other (0.02) (0.04) 0.02Total $0.51 $0.44 $0.07
Ongoing Earnings Overview
Note: See Appendix for the reconciliation of reported earnings (loss) to earnings from ongoing operations.
14
© PPL Corporation 2015
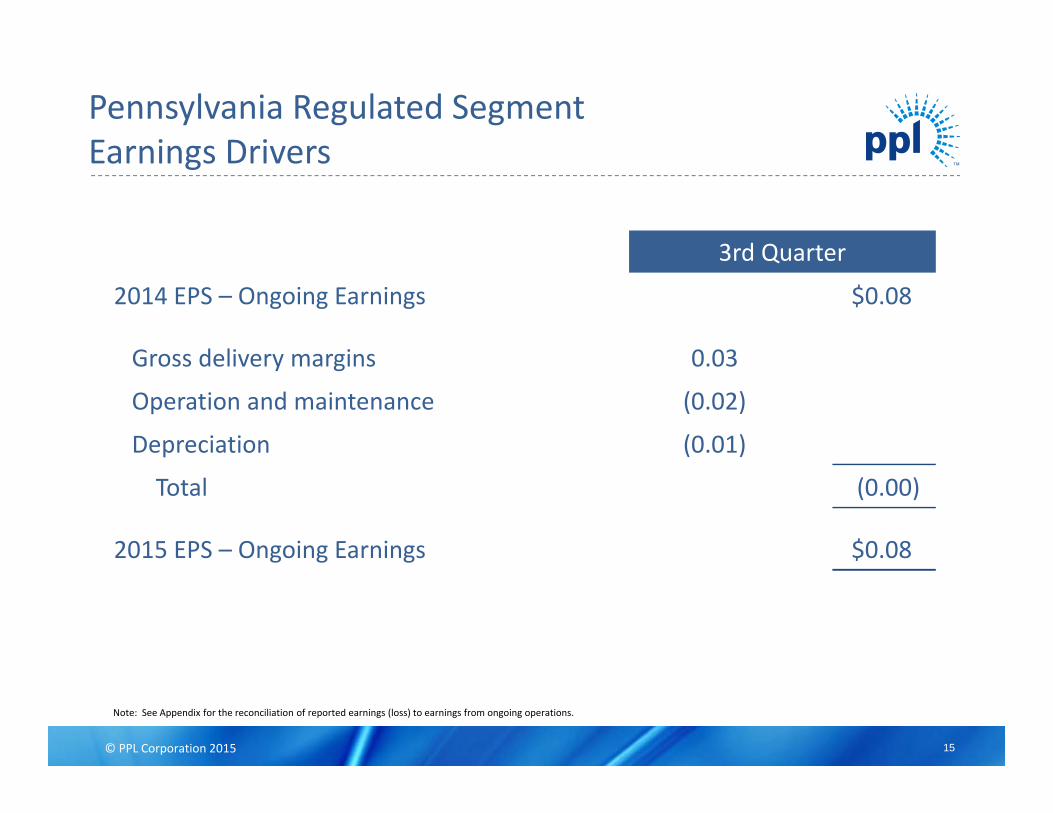
3rd Quarter
2014 EPS – Ongoing Earnings $0.08
Gross delivery margins 0.03
Operation and maintenance (0.02)
Depreciation (0.01)
Total (0.00)
2015 EPS – Ongoing Earnings $0.08
Pennsylvania Regulated SegmentEarnings Drivers
Note: See Appendix for the reconciliation of reported earnings (loss) to earnings from ongoing operations.
15
© PPL Corporation 2015
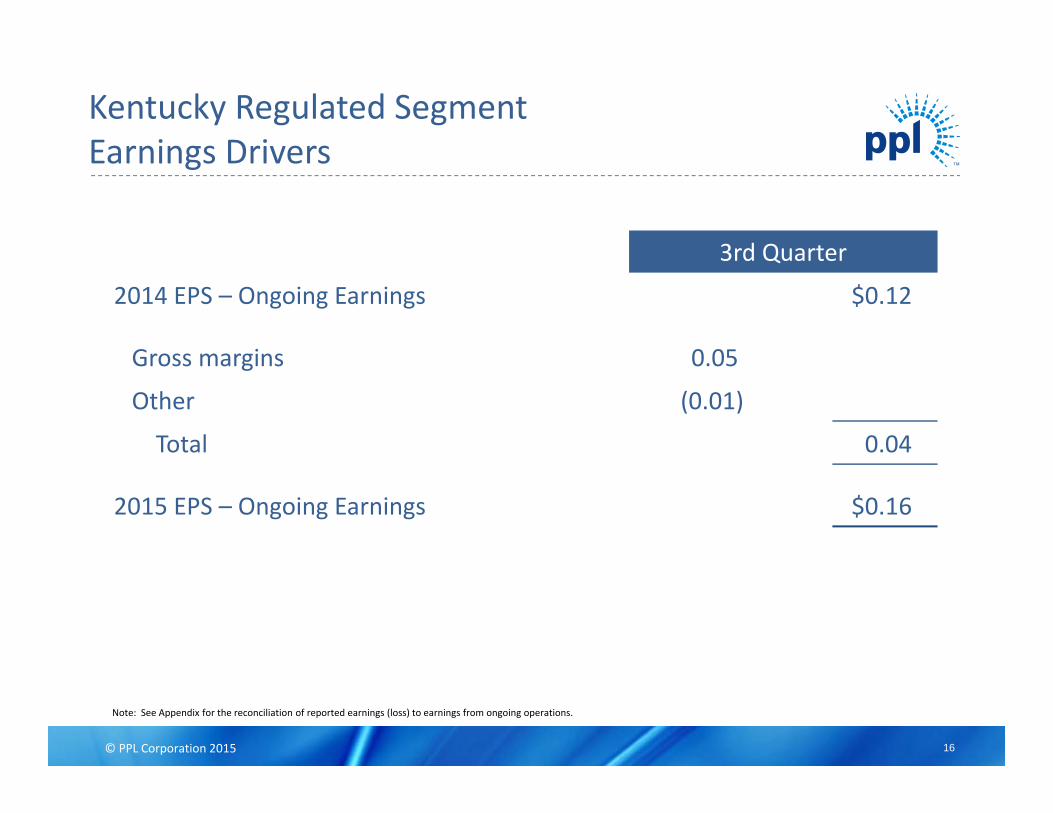
3rd Quarter
2014 EPS – Ongoing Earnings $0.12
Gross margins 0.05
Other (0.01)
Total 0.04
2015 EPS – Ongoing Earnings $0.16
Kentucky Regulated SegmentEarnings Drivers
Note: See Appendix for the reconciliation of reported earnings (loss) to earnings from ongoing operations.
16
© PPL Corporation 2015
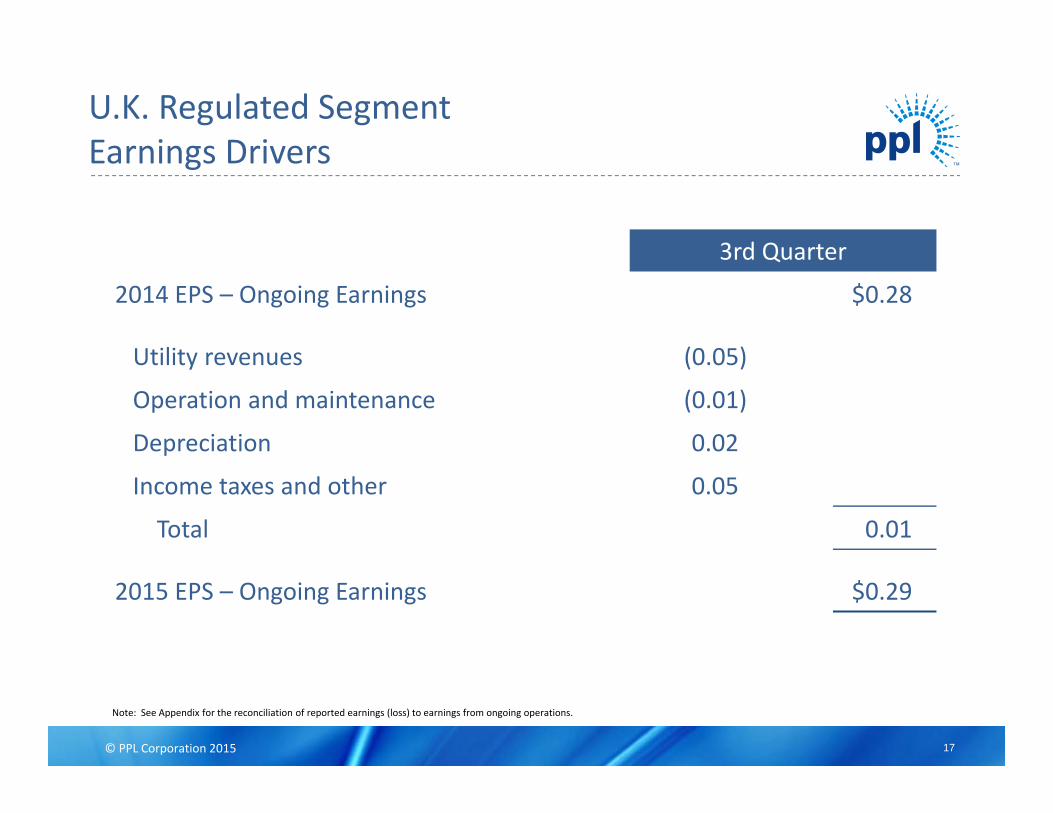
3rd Quarter
2014 EPS – Ongoing Earnings $0.28
Utility revenues (0.05)
Operation and maintenance (0.01)
Depreciation 0.02
Income taxes and other 0.05
Total 0.01
2015 EPS – Ongoing Earnings $0.29
U.K. Regulated SegmentEarnings Drivers
Note: See Appendix for the reconciliation of reported earnings (loss) to earnings from ongoing operations.
17

© PPL Corporation 2015
Foreign Currency Hedging Status and RPI Sensitivity
18
GBP Foreign Currency 2015 2016 2017
Percentage Hedged 100% 83% 66%
Hedged Rate (GBP/USD) $1.54 $1.60 $1.60
Budgeted Rate on Open Position (GBP/USD) $1.60 $1.60 $1.60
EPS Sensitivities:
Decrease in Rate (USD/GBP) (1)
0.05 $0.00 ($0.01) ($0.02)
0.10 $0.00 ($0.02) ($0.03)
Decrease in 2015/2016 RPI (budget assumption 1.6%)(2)
0.5% $0.00 $0.00 ($0.02)
2015/16 2016/17 2017/18Budget RPI assumption 1.6% 2.8% 3.0%Current U.K. HM Treasury RPI forecast 1.6% 2.8% 3.1%
Note: FX hedging status as of 9/30/2015.(1) FX sensitivities do not factor in the potential positive effect from restriking existing hedges.(2) Sensitivities includes the net effect on revenue, O&M and interest expense on index‐linked debt.
Change in EPS
© PPL Corporation 2015
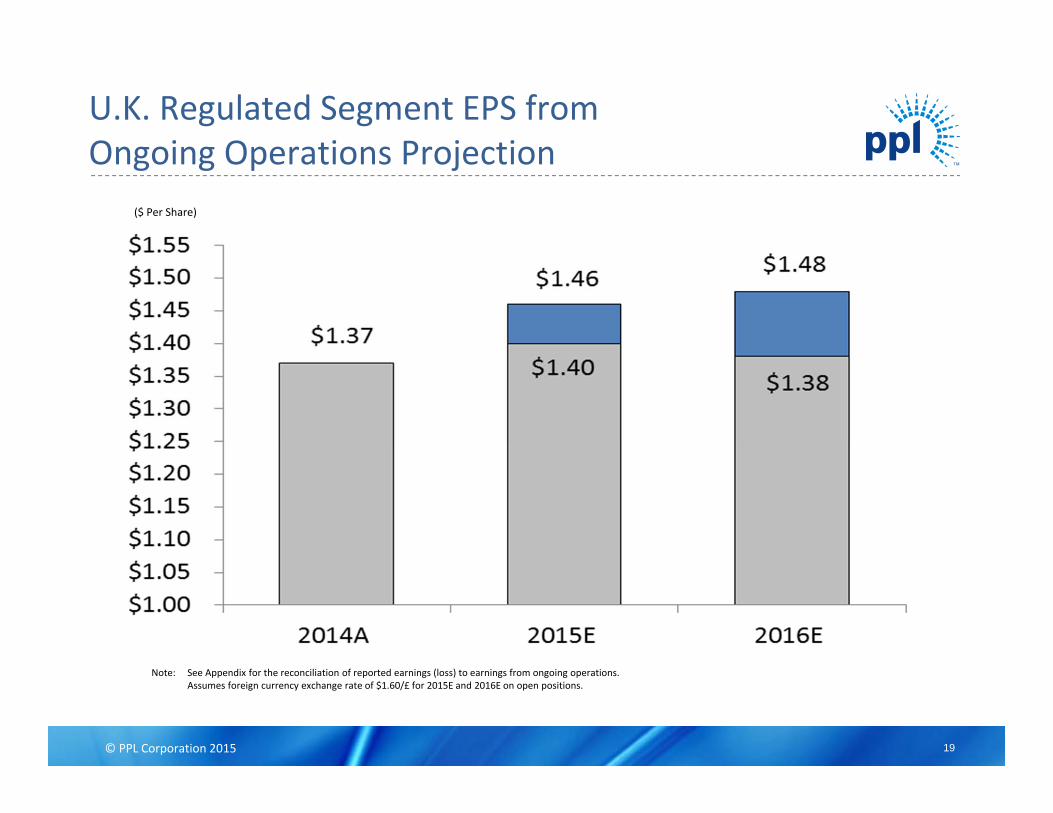
U.K. Regulated Segment EPS from Ongoing Operations Projection
($ Per Share)
Note: See Appendix for the reconciliation of reported earnings (loss) to earnings from ongoing operations.Assumes foreign currency exchange rate of $1.60/£ for 2015E and 2016E on open positions.
19

© PPL Corporation 2015
Appendix
20

© PPL Corporation 2015
Note: Corporate and Other capital expenditures average approximately $5 million per year.(1) WPD figures based on assumed exchange rate of $1.60/£.(2) Expect between 80% and 90% to receive timely returns via ECR mechanism based on historical experience and future projections.
Significant Ongoing Capital Expenditure Program…
($ in billions)
$3.61
$3.33 $3.33
$3.53
$3.78
(1) (2)
~$18 billion of Capital Expenditures from 2015 – 2019 to strengthen safety and reliability of T&D systems and address environmental regulations in Kentucky.
• Over 80% of Regulated capital expenditures earn returns subject to minimal or no lag
• PA – Implementation of ~$450 million Smart Meter Program to be recovered through a rider mechanism (~$328 million of Capital; ~$122 million O&M)
• PA and KY – Continued focus on improving reliability in both Transmission and Distribution systems
• KY – Environmental spending in response to regulations for Mercury, SO2, NOX, Ozone, Particulates, Water Discharge and CCRs (does not include Clean Power Plan)
• U.K. – Continued focus on asset replacement, faults and overheads and general system reinforcement
21

© PPL Corporation 2015
($ in
bill
ions
)
(1) WPD figures based on assumed exchange rate of $1.60/£ for 2015 ‐ 2019.(2) Represents utility capitalization for LKE. Represents Regulatory Asset Value (RAV) for WPD.
Strong regulated rate base growth will drive EPS growth.
…Critical to Driving Strong Rate Base Growth
$32.1
$30.1
$28.0$26.2
$24.6$22.9
(2)(1)
22

© PPL Corporation 2015
U.K. Regulated Segment Cash Repatriation
Note: Assumes foreign currency exchange rate of $1.60/£ for 2015E, 2016E and 2017E.
($ in millions)
Flexible strategy for meaningful U.K. cash repatriation.
23

© PPL Corporation 2015
Note: Total includes Residential, Commercial and Industrial customer classes as well as “Other”, which is not depicted on the charts above.
U.S. Regulated Volume Variances
Residential Commercial Industrial Total Residential Commercial Industrial TotalWeather-Normalized (charted) -0.5% 0.7% -2.2% -0.6% -1.1% -1.0% 0.4% -0.5%Actual 4.6% 2.6% -1.4% 2.0% -0.7% -1.0% 0.7% -3.3%
Residential Commercial Industrial Total Residential Commercial Industrial To talWeather-Normalized (charted) 3.4% 2.0% 1.9% 2.5% -0.4% 1.0% 0.7% 0.3%Actual 8.6% 4.6% 1.9% 5.3% 1.1% 1.8% 0.7% 1.2%
24

© PPL Corporation 2015
Kentucky Environmental ControlsLow Nox Burners
SCR/SNCR ScrubbersClosed Cycle Cooling
TowerDry Handling/ Disposal/ Beneficial
UseBaghouses
NOx NOx SO2 Water Intake Coal Combustion Residuals (CCRs) (2) Hg (Particulates)
Unit 1 (1) (3b)
Unit 2 (1)
Unit 1 Unit 2 (4) (3c)
Unit 3 Unit 4
Unit 1 (4) (1) (4)
Unit 2 (4) (1) (4)
Unit 3 (1) (3a)
Unit 1 (4) (4) Unit 2 (4) Unit 3 (3d)
Unit 4
= Installed(1) Dry handling disposal construction approved by KPSC and permitting or construction underway at Trimble and Brown. Portions of
Ghent systems are operational at this time as other construction activity continues.(2) Wet ash impoundments exist at all plants.(3) Baghouses construction approved by KPSC and construction activity underway at Trimble, Ghent, Brown, and Mill Creek.
(3a) Brown 3's commissioning scheduled to start in November 2015.(3b) Trimble County 1's commissioning scheduled to start in November 2015.(3c) Ghent 2's commissioning scheduled to start in December 2015.(3d) Mill Creek 3's commissioning scheduled to start in June 2016.
(4) Standards are station and company based. KU and LG&E Systems are already in compliance.
Control Device
Addresses
Trimble
County
Ghent
Brow
nMill Creek
25

© PPL Corporation 2015
Funding the Growth
Strong domestic operating cash flows plus the U.K. dividend sufficient to fund the PPL dividend. Domestic debt and equity issuances fund domestic utility growth.
(3)
2013A(4) 2014A(4) 2015E(5)
Domestic Cash from Operations $1,707 $2,219 $1,610Domestic Maintenance Capex(1) (861) (900) (650)Dividend From UK Regulated 261 277 290Cash Available for Distribution $1,107 $1,596 $1,250Common Dividend (878) (967) (1,000)Cash Available for Reinvestment $229 $629 $250
Domestic Growth Capex ($2,142) ($1,816) ($1,615)
Debt Maturities ($747) ($546) ($1,000)Debt Issuances and Change in Cash(2) 1,343 (159) 2,243Equity Issuances 1,330 1,063 200Other Investing & Financing Activities (13) 829 (78)Additional Funding Sources for Domestic Growth Capex $1,913 $1,187 $1,365
Note: Information provided on this slide to be updated on an annual basis. See appendix for the reconciliation of Domestic Cash from Operations.
(1) Represents book depreciation. (2) Includes domestic issuances (short and long term), net of issue costs.(3) Includes approximately $900 million of proceeds from sale of the Montana hydros. (4) Includes results of PPL Energy Supply, LLC.(5) Full year projections do not include activity related to PPL Energy Supply, LLC for any portion of 2015.
26
© PPL Corporation 2015
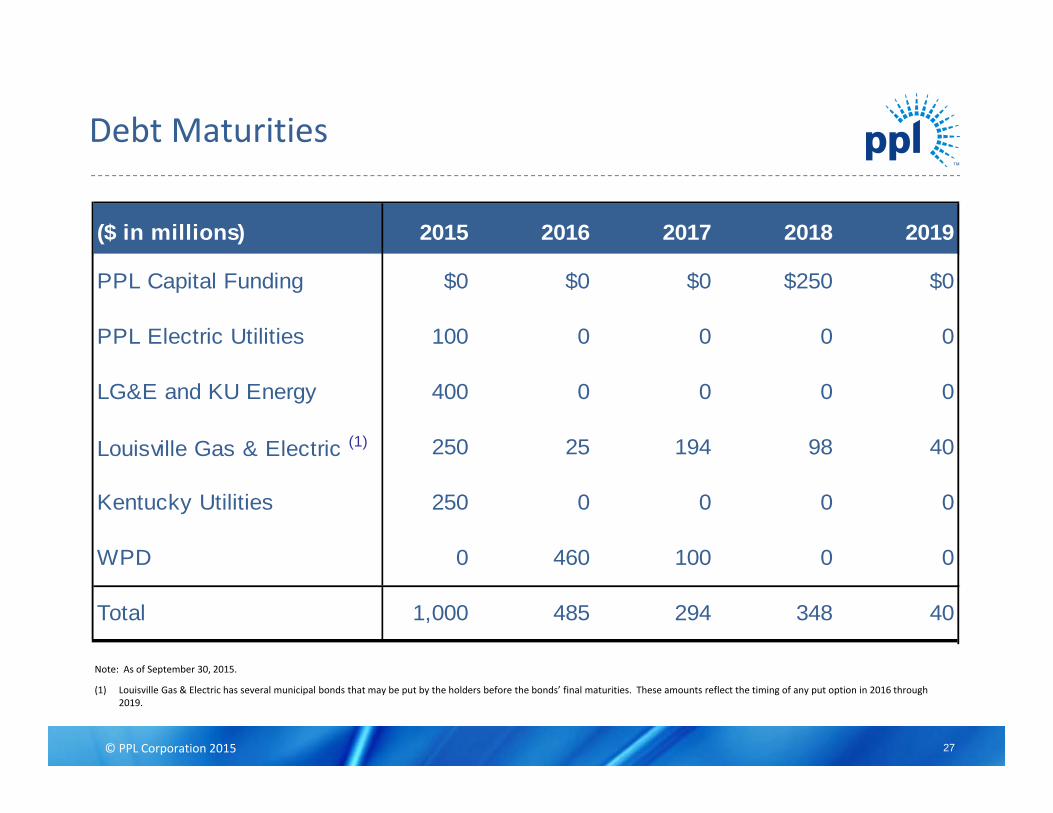
($ in millions) 2015 2016 2017 2018 2019
PPL Capital Funding $0 $0 $0 $250 $0
PPL Electric Utilities 100 0 0 0 0
LG&E and KU Energy 400 0 0 0 0
Louisville Gas & Electric (1) 250 25 194 98 40
Kentucky Utilities 250 0 0 0 0
WPD 0 460 100 0 0
Total 1,000 485 294 348 40
Debt Maturities
Note: As of September 30, 2015.
(1) Louisville Gas & Electric has several municipal bonds that may be put by the holders before the bonds’ final maturities. These amounts reflect the timing of any put option in 2016 through 2019.
27

© PPL Corporation 2015
Liquidity Profile
Note: As of September 30, 2015.
Entity FacilityExpiration
DateCapacity(Millions)
Letters of Credit & Commercial Paper Issued (Millions)
Borrowed (Millions)
Unused Capacity (Millions)
PPL Capital Funding Syndicated Credit Facility Nov‐2018 $300 $0 $0 $300Syndicated Credit Facility Jul‐2019 300 0 0 300Bilateral Credit Facil ity Mar‐2016 150 20 0 130
$750 $20 $0 $730
PPL Electric Utilities Syndicated Credit Facility Jul‐2019 $300 $69 $0 $231
LG&E and KU Energy (LKE) Syndicated Credit Facility Oct‐2018 $75 $0 $75 $0
Louisville Gas & Electric Syndicated Credit Facility Jul‐2019 $500 $0 $0 $500
Kentucky Utilities Syndicated Credit Facility Jul‐2019 $400 $0 $0 $400Letter of Credit Facil ity Oct‐2017 198 198 0 0
$598 $198 $0 $400
WPD WPD Plc. Syndicated Credit Facil ity Dec‐2016 £210 £0 £127 £83WPD (South West) Syndicated Credit Facil ity Jul‐2020 245 0 0 245WPD (East Midlands) Syndicated Credit Facil ity Jul‐2020 300 0 139 161WPD (West Midlands) Syndicated Credit Facil ity Jul‐2020 300 0 0 300Uncommitted Credit Facil ities 65 4 0 61
£1,120 £4 £266 £850
Strong liquidity position to fund current operations and growth.
28
© PPL Corporation 2015
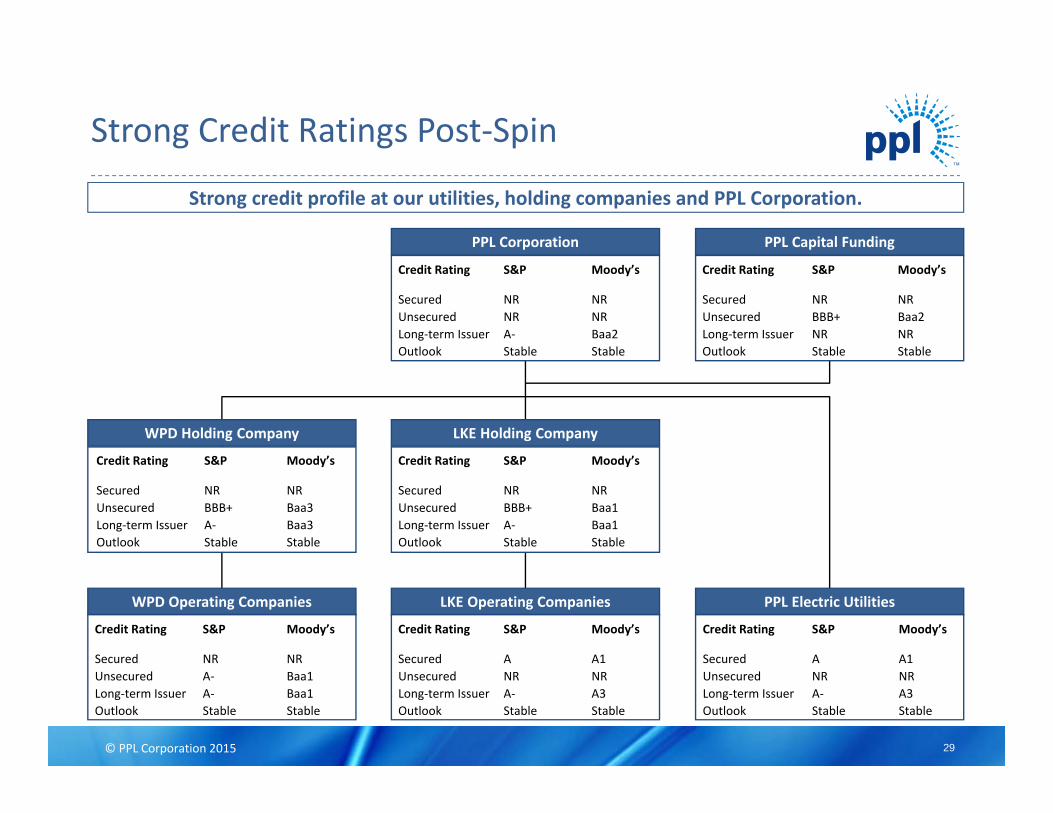
WPD Holding Company LKE Holding Company
PPL Electric UtilitiesLKE Operating Companies
PPL Capital Funding
Credit Rating
SecuredUnsecuredLong‐term IssuerOutlook
S&P
NRBBB+ NRStable
Moody’s
NRBaa2 NRStable
Credit Rating
SecuredUnsecuredLong‐term IssuerOutlook
S&P
NRBBB+ A‐Stable
Moody’s
NRBaa3Baa3Stable
WPD Operating Companies
Credit Rating
SecuredUnsecuredLong‐term IssuerOutlook
S&P
NRA‐A‐Stable
Moody’s
NRBaa1Baa1Stable
Credit Rating
SecuredUnsecuredLong‐term IssuerOutlook
S&P
A NRA‐Stable
Moody’s
A1NRA3Stable
Credit Rating
SecuredUnsecuredLong‐term IssuerOutlook
S&P
NRBBB+ A‐Stable
Moody’s
NRBaa1 Baa1 Stable
Credit Rating
SecuredUnsecuredLong‐term IssuerOutlook
S&P
A NRA‐Stable
PPL Corporation
Credit Rating
SecuredUnsecuredLong‐term IssuerOutlook
S&P
NRNRA‐Stable
Moody’s
NRNRBaa2 Stable
Strong Credit Ratings Post‐Spin
Strong credit profile at our utilities, holding companies and PPL Corporation.
Moody’s
A1NRA3Stable
29

© PPL Corporation 2015
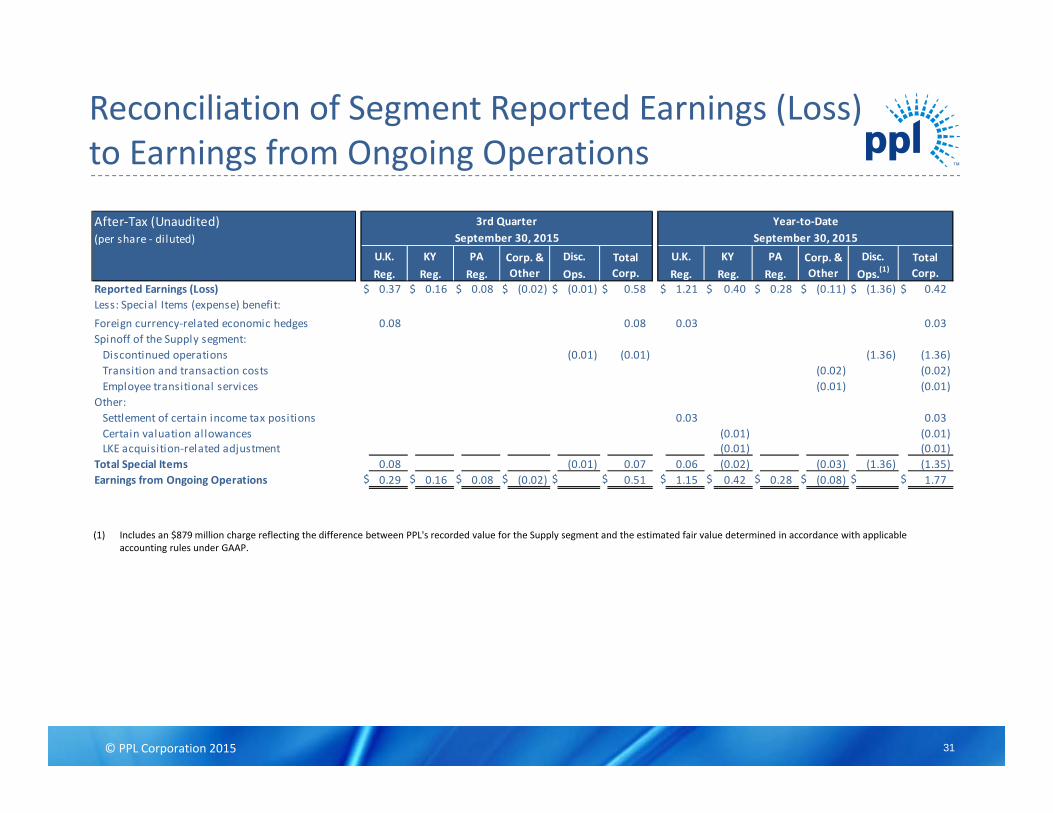
Reconciliation of Segment Reported Earnings (Loss)to Earnings from Ongoing Operations
(1) Includes an $879 million charge reflecting the difference between PPL's recorded value for the Supply segment and the estimated fair value determined in accordance with applicable accounting rules under GAAP.
Reported Earnings (Loss) $ 249 $ 111 $ 55 $ (18) $ (4) $ 393 $ 814 $ 267 $ 191 $ (73) $ (916) $ 283 Less: Special Items (expense) benefit:Foreign currency‐related economic hedges 54 54 20 20 Spinoff of the Supply segment:Discontinued operations (4) (4) (916) (916) Transition and transaction costs (1) (1) (16) (16) Employee transitional services (1) (1) (4) (4) Separation benefits (1) (1) (3) (3)
Other: WPD Midlands acquisition‐related adjustment 2 2 Settlement of certain income tax positions 18 18 Certain valuation allowances (8) (8) LKE acquisition‐related adjustment (1) (1) (5) (5)
Total Special Items 54 (1) (3) (4) 46 40 (13) (23) (916) (912) Earnings from Ongoing Operations $ 195 $ 112 $ 55 $ (15) $ $ 347 $ 774 $ 280 $ 191 $ (50) $ $ 1,195
U.K. KY PA Corp. & Other
Disc. Total Corp.Reg. Reg. Reg. Ops.(1)
U.K. KY PA Corp. & Other
Disc. Total Corp.Reg. Reg.
After‐Tax (Unaudited) 3rd Quarter Year‐to‐DateSeptember 30, 2015 September 30, 2015(mill ions of dollars)
Reg. Ops.
30
© PPL Corporation 2015
Reconciliation of Segment Reported Earnings (Loss) to Earnings from Ongoing Operations
(1) Includes an $879 million charge reflecting the difference between PPL's recorded value for the Supply segment and the estimated fair value determined in accordance with applicable accounting rules under GAAP.
Reported Earnings (Loss) $ 0.37 $ 0.16 $ 0.08 $ (0.02) $ (0.01) $ 0.58 $ 1.21 $ 0.40 $ 0.28 $ (0.11) $ (1.36) $ 0.42 Less: Special Items (expense) benefit:Foreign currency‐related economic hedges 0.08 0.08 0.03 0.03 Spinoff of the Supply segment:Discontinued operations (0.01) (0.01) (1.36) (1.36) Transition and transaction costs (0.02) (0.02) Employee transitional services (0.01) (0.01)
Other: Settlement of certain income tax positions 0.03 0.03 Certain valuation allowances (0.01) (0.01) LKE acquisition‐related adjustment (0.01) (0.01)
Total Special Items 0.08 (0.01) 0.07 0.06 (0.02) (0.03) (1.36) (1.35) Earnings from Ongoing Operations $ 0.29 $ 0.16 $ 0.08 $ (0.02) $ $ 0.51 $ 1.15 $ 0.42 $ 0.28 $ (0.08) $ $ 1.77
After‐Tax (Unaudited) 3rd Quarter Year‐to‐Date(per share ‐ diluted) September 30, 2015 September 30, 2015
Reg. Ops.U.K. KY PA Corp. &
OtherDisc. Total
Corp.Reg. Reg. Reg. Ops.(1)U.K. KY PA Corp. &
OtherDisc. Total
Corp.Reg. Reg.
31
© PPL Corporation 2015
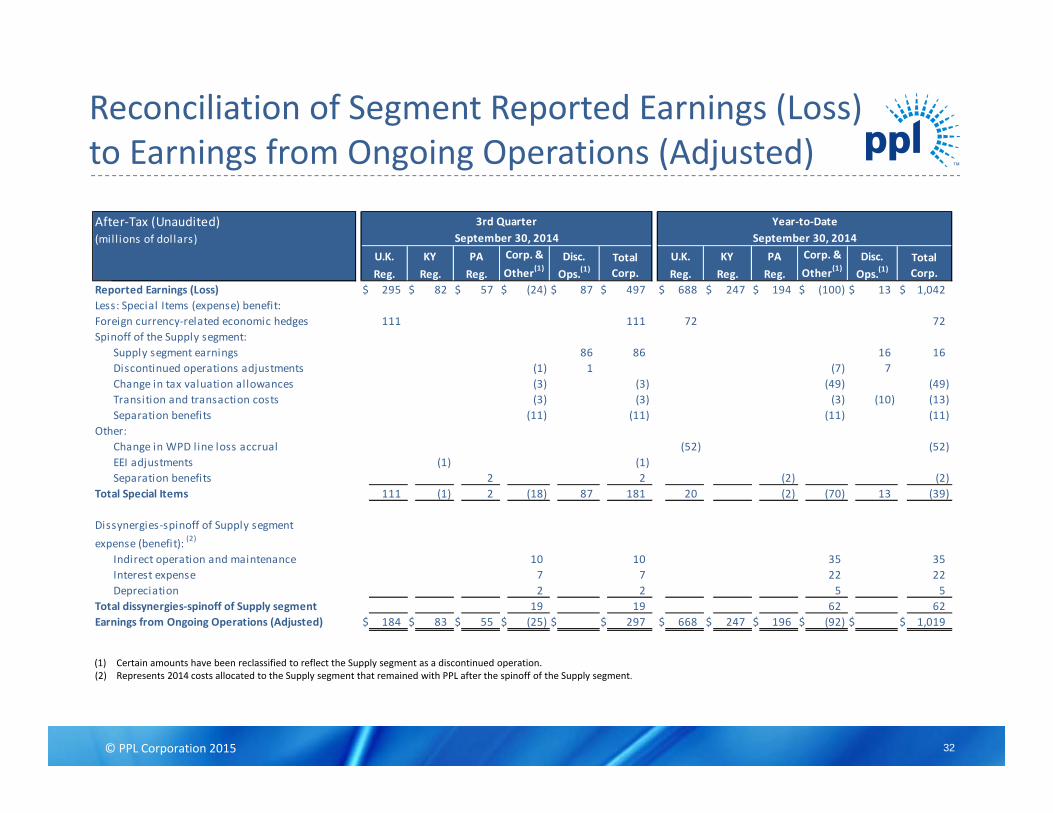
Reconciliation of Segment Reported Earnings (Loss)to Earnings from Ongoing Operations (Adjusted)
(1) Certain amounts have been reclassified to reflect the Supply segment as a discontinued operation.(2) Represents 2014 costs allocated to the Supply segment that remained with PPL after the spinoff of the Supply segment.
Reported Earnings (Loss) $ 295 $ 82 $ 57 $ (24) $ 87 $ 497 $ 688 $ 247 $ 194 $ (100) $ 13 $ 1,042 Less: Special Items (expense) benefit: Foreign currency‐related economic hedges 111 111 72 72 Spinoff of the Supply segment:
Supply segment earnings 86 86 16 16 Discontinued operations adjustments (1) 1 (7) 7 Change in tax valuation allowances (3) (3) (49) (49) Transition and transaction costs (3) (3) (3) (10) (13) Separation benefits (11) (11) (11) (11)
Other: Change in WPD l ine loss accrual (52) (52) EEI adjustments (1) (1) Separation benefits 2 2 (2) (2)
Total Special Items 111 (1) 2 (18) 87 181 20 (2) (70) 13 (39)
Indirect operation and maintenance 10 10 35 35 Interest expense 7 7 22 22 Depreciation 2 2 5 5
Total dissynergies‐spinoff of Supply segment 19 19 62 62 Earnings from Ongoing Operations (Adjusted) $ 184 $ 83 $ 55 $ (25) $ $ 297 $ 668 $ 247 $ 196 $ (92) $ $ 1,019
3rd Quarter Year‐to‐Date(mill ions of dollars) September 30, 2014 September 30, 2014After‐Tax (Unaudited)
expense (benefit): (2)Dissynergies‐spinoff of Supply segment
U.K. KY PA Corp. & Other(1)
Disc. Total Corp.Reg. Reg. Reg. Ops.(1)
U.K. KY PA Corp. & Other(1)
Disc. Total Corp.Reg. Reg. Reg. Ops.(1)
32

© PPL Corporation 2015
Reconciliation of Segment Reported Earnings (Loss) to Earnings from Ongoing Operations (Adjusted)
(1) The "If‐Converted Method" has been applied to PPL's 2011 Equity Units, resulting in $9 million of interest charges (after‐tax) being added back to earnings and approximately 14 million shares of PPL Common Stock being treated as outstanding. Both adjustments are only for purposes of calculating diluted earnings per share.
(2) Certain amounts have been reclassified to reflect the Supply segment as a discontinued operation.(3) Represents 2014 costs allocated to the Supply segment that remained with PPL after the spinoff of the Supply segment.
Reported Earnings (Loss) $ 0.44 $ 0.12 $ 0.09 $ (0.04) $ 0.13 $ 0.74 $ 1.04 $ 0.37 $ 0.29 $ (0.15) $ 0.02 $ 1.57Less: Special Items (expense) benefit:Foreign currency‐related economic hedges 0.16 0.16 0.11 0.11Spinoff of the Supply segment:
Supply segment earnings 0.13 0.13 0.02 0.02Discontinued operations adjustments (0.01) 0.01 Change in tax valuation allowances (0.01) (0.01) (0.07) (0.07)Transition and transaction costs (0.01) (0.01) (0.02)Separation benefits (0.02) (0.02) (0.02) (0.02)
Other:Change in WPD l ine loss accrual (0.08) (0.08)Separation benefits 0.01 0.01
Total Special Items 0.16 0.01 (0.03) 0.13 0.27 0.03 (0.11) 0.02 (0.06)
Dissynergies‐spinoff of Supply segment
Indirect operation and maintenance 0.02 0.02 0.05 0.05 Interest expense 0.01 0.01 0.03 0.03 Depreciation 0.01 0.01
Total dissynergies‐spinoff of Supply segment 0.03 0.03 0.09 0.09 Earnings from Ongoing Operations (Adjusted) $ 0.28 $ 0.12 $ 0.08 $ (0.04) $ $ 0.44 $ 1.01 $ 0.37 $ 0.29 $ (0.13) $ $ 1.54
After‐Tax (Unaudited) 3rd Quarter Year‐to‐Date
(per share ‐ diluted) September 30, 2014 September 30, 2014 (1)
Ops.(2)U.K. KY PA Corp. &
Other(2)Disc. Total
Corp.Reg. Reg. Reg. Ops.(2)U.K. KY PA Corp. &
Other(2)Disc. Total
Corp.Reg. Reg. Reg.
expense (benefit): (3)
33
© PPL Corporation 2015
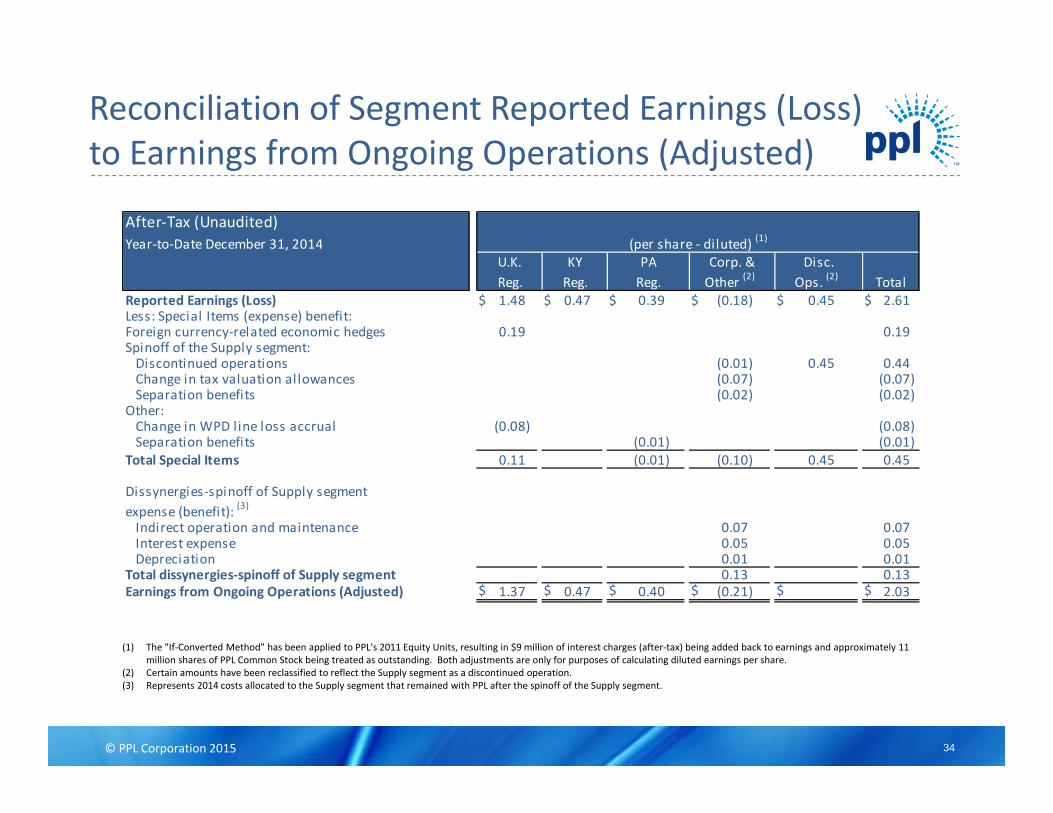
Reconciliation of Segment Reported Earnings (Loss) to Earnings from Ongoing Operations (Adjusted)
(1) The "If‐Converted Method" has been applied to PPL's 2011 Equity Units, resulting in $9 million of interest charges (after‐tax) being added back to earnings and approximately 11 million shares of PPL Common Stock being treated as outstanding. Both adjustments are only for purposes of calculating diluted earnings per share.
(2) Certain amounts have been reclassified to reflect the Supply segment as a discontinued operation.(3) Represents 2014 costs allocated to the Supply segment that remained with PPL after the spinoff of the Supply segment.
$ 1.48 $ 0.47 $ 0.39 $ (0.18) $ 0.45 $ 2.61
0.19 0.19
Discontinued operations (0.01) 0.45 0.44Change in tax valuation allowances (0.07) (0.07)Separation benefits (0.02) (0.02)
Change in WPD l ine loss accrual (0.08) (0.08)Separation benefits (0.01) (0.01)
0.11 (0.01) (0.10) 0.45 0.45
Indirect operation and maintenance 0.07 0.07Interest expense 0.05 0.05Depreciation 0.01 0.01
0.13 0.13$ 1.37 $ 0.47 $ 0.40 $ (0.21) $ $ 2.03
Total dissynergies‐spinoff of Supply segmentEarnings from Ongoing Operations (Adjusted)
Spinoff of the Supply segment:
Other:
Total Special Items
Dissynergies‐spinoff of Supply segmentexpense (benefit): (3)
Reg.Reg.Reported Earnings (Loss)Less: Special Items (expense) benefit:Foreign currency‐related economic hedges
Other (2) Ops. (2) TotalReg.U.K. KY PA Corp. & Disc.
Year‐to‐Date December 31, 2014 (per share ‐ diluted) (1)After‐Tax (Unaudited)
34

© PPL Corporation 2015
Reconciliation of PPL's Forecast of Reported Earnings (Loss) to Earnings from Ongoing Operations
(1) Includes an $879 million charge reflecting the difference between PPL's recorded value for the Supply segment and the estimated fair value determined in accordance with applicable accounting rules under GAAP.
$ 1.49 $ 0.49 $ 0.37 $ (0.14) $ (1.36) $ 0.85 $ 0.90 $ 0.80
0.03 0.03 0.03 0.03
Discontinued operations (1.36) (1.36) (1.36) (1.36)Transition and transaction costs (0.02) (0.02) (0.02) (0.02)Employee transitional services (0.01) (0.01) (0.01) (0.01)
Settlement of certain income tax positions 0.03 0.03 0.03 0.03Certain valuation allowances (0.01) (0.01) (0.01) (0.01)LKE acquisition‐related adjustment (0.01) (0.01) (0.01) (0.01)
0.06 (0.02) (0.03) (1.36) (1.35) (1.35) (1.35)$ 1.43 $ 0.51 $ 0.37 $ (0.11) $ $ 2.20 $ 2.25 $ 2.15
Forecast (per share ‐ diluted)2015 Midpoint
After‐Tax (Unaudited)
U.K. KY PA Corp. Disc. High LowTotal 2015 2015& Other Ops.(1)
Foreign currency‐related economic hedgesSpinoff of the Supply segment:
Other:
Total Special ItemsEarnings from Ongoing Operations
Reported Earnings (Loss)Less: Special Items (expense) benefit:
Reg. Reg. Reg.
35

© PPL Corporation 2015
Gross Margins Summary
$ 510 $ 460 $ 50 $ 0.05
Distribution $ 207 $ 194 $ 13 $ 0.01 Transmission 102 85 17 0.02
$ 309 $ 279 $ 30 $ 0.03 Total
Three Months Ended September 30, Per ShareDiluted
2015 2014 Change (after‐tax)
KY Gross Margins
PA Gross Delivery Margins
(Unaudited)(millions of dollars, except share data)
36
© PPL Corporation 2015
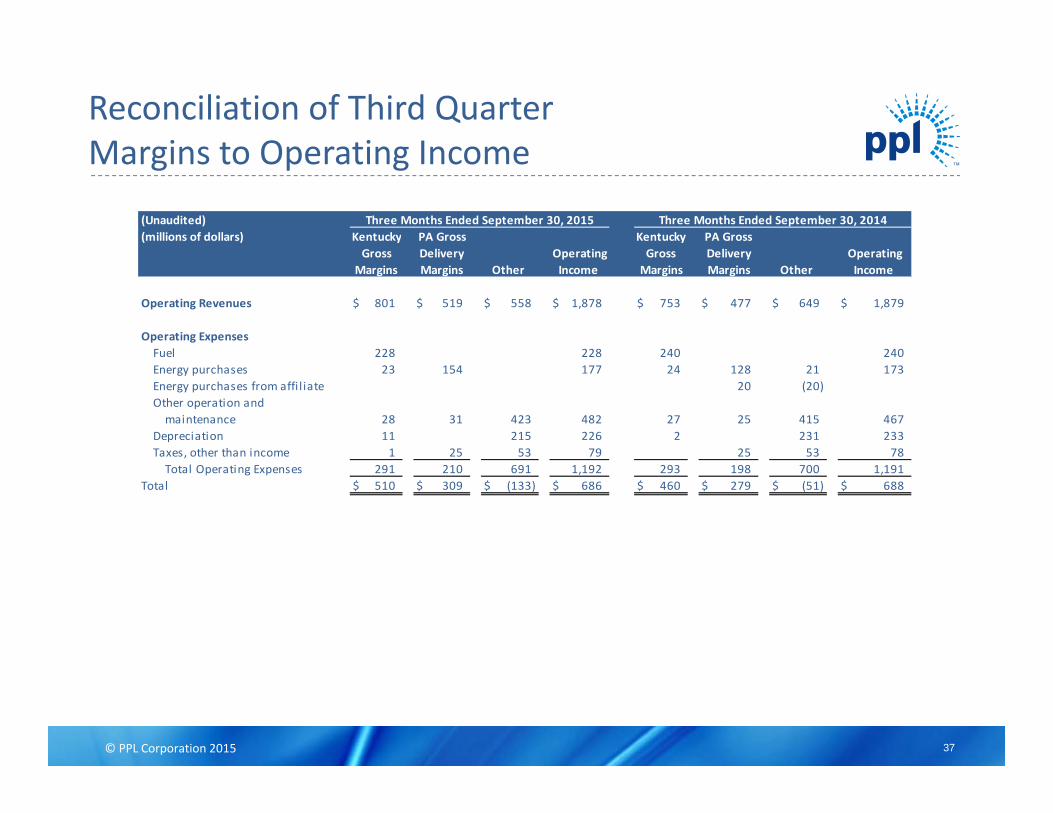
Reconciliation of Third QuarterMargins to Operating Income
$ 801 $ 519 $ 558 $ 1,878 $ 753 $ 477 $ 649 $ 1,879
228 228 240 240 23 154 177 24 128 21 173
20 (20)
28 31 423 482 27 25 415 467 11 215 226 2 231 233 1 25 53 79 25 53 78
Total Operating Expenses 291 210 691 1,192 293 198 700 1,191 $ 510 $ 309 $ (133) $ 686 $ 460 $ 279 $ (51) $ 688
Other Income Margins Other Income Margins Margins
Three Months Ended September 30, 2014(Unaudited)PA Gross
Gross Delivery Operating Gross DeliveryKentucky PA Gross Kentucky
Operating
Total
Three Months Ended September 30, 2015
Operating ExpensesFuelEnergy purchases
Other operation andmaintenance
DepreciationTaxes, other than income
Energy purchases from affi l iate
(millions of dollars)
Margins
Operating Revenues
37

© PPL Corporation 2015
Reconciliation of Domestic Cash Flows
Note: For 2015, due to the generalized and forward-looking nature of this information, the Company has not reconciled the presented non-GAAP financial measures to the most directly comparable GAAP financial measures.
(1) Primarily represents PPL Global, LLC items that eliminate in PPL's consolidation.
(2) Adjustment to exclude domestic change in cash and cash equivalents.
Year Ended December 2014 Additional(Millions of Dollars) Domestic Domestic Funding Sources PPL Consolidated
Cash from Cash Available Cash Available Growth for Domestic Statement ofOperations for Distribution for Reinvestment Capex Growth Capex PPL Global, LLC Other Cash Flows
Cash provided by (used in) operating activities 2,219$ 1,184$ 3,403$ Cash provided by (used in) investing activities (900)$ (1,816)$ 829$ (1,442) (3,329) Cash provided by (used in) financing activities (967)$ 1,451 (86) 185$ (1) 583 Effect of exchange rates on cash and cash equivalents (8) (8) Domestic (increase) decrease in cash and cash equivalents 277 (1,093) 816 (2)
2,219$ 2,219 1,596$ 1,596
Total 629$ (1,816)$ 1,187$ (352)$ 1,001$ 649$
Year Ended December 2013 Additional(Millions of Dollars) Domestic Domestic Funding Sources PPL Consolidated
Cash from Cash Available Cash Available Growth for Domestic Statement ofOperations for Distribution for Reinvestment Capex Growth Capex PPL Global, LLC Other Cash Flows
Cash provided by (used in) operating activities 1,707$ 1,150$ 2,857$ Cash provided by (used in) investing activities (861)$ (2,142)$ (13)$ (1,279) (4,295) Cash provided by (used in) financing activities (878)$ 1,779 534 196$ (1) 1,631 Effect of exchange rates on cash and cash equivalents 8 8 Domestic (increase) decrease in cash and cash equivalents 261 147 (408) (2)
1,707$ 1,707 1,107$ 1,107
Total 229$ (2,142)$ 1,913$ 413$ (212)$ 201$
Reconciling Items
Reconciling Items
38
© PPL Corporation 2015
Statements contained in this presentation, including statements with respect to future earnings, cash flows, financing, regulation and corporatestrategy are "forward‐looking statements" within the meaning of the federal securities laws. Although PPL Corporation believes that theexpectations and assumptions reflected in these forward‐looking statements are reasonable, these statements are subject to a number of risks anduncertainties, and actual results may differ materially from the results discussed in the statements. The following are among the important factorsthat could cause actual results to differ materially from the forward‐looking statements: market demand for energy in our service territories,weather conditions affecting customer energy usage and operating costs; the effect of any business or industry restructuring, including the abilityof PPL Corporation to realize all or a significant portion of the anticipated cost savings from the corporate restructuring following the Supplybusiness spinoff; the profitability and liquidity of PPL Corporation and its subsidiaries; new accounting requirements or new interpretations orapplications of existing requirements; operating performance of our facilities; the length of scheduled and unscheduled outages at our generatingplants; environmental conditions and requirements and the related costs of compliance; system conditions and operating costs; development ofnew projects, markets and technologies; performance of new ventures; asset or business acquisitions and dispositions; any impact of hurricanes orother severe weather on our business; receipt of necessary government permits, approvals, rate relief and regulatory cost recovery; capital marketconditions and decisions regarding capital structure; the impact of state, federal or foreign investigations applicable to PPL Corporation and itssubsidiaries; the outcome of litigation against PPL Corporation and its subsidiaries; stock price performance; the market prices of equity securitiesand the impact on pension income and resultant cash funding requirements for defined benefit pension plans; the securities and credit ratings ofPPL Corporation and its subsidiaries; political, regulatory or economic conditions in states, regions or countries where PPL Corporation or itssubsidiaries conduct business, including any potential effects of threatened or actual terrorism or war or other hostilities; British pound sterling toU.S. dollar exchange rates; new state, federal or foreign legislation, including new tax legislation; and the commitments and liabilities of PPLCorporation and its subsidiaries. Any such forward‐looking statements should be considered in light of such important factors and in conjunctionwith PPL Corporation's Form 10‐K and other reports on file with the Securities and Exchange Commission.
Forward‐Looking Information Statement
39

© PPL Corporation 2015
Definitions of Non‐GAAP Financial Measures "Earnings from ongoing operations," should not be considered as an alternative to reported earnings, or net income, which is an indicator of operating performance determined in accordance with U.S. generally accepted accounting principles (GAAP). PPL believes that "earnings from ongoing operations," although a non‐GAAP financial measure, is also useful and meaningful to investors because it provides management's view of PPL's earnings excluding the Supply segment, as the spinoff was completed June 1, 2015. Other companies may use different measures to present financial performance. "Earnings from ongoing operations" is adjusted for the impact of special items as described below, which includes the Supply segment's earnings now reflected in discontinued operations. Also included in special items is the loss on spinoff resulting from the fair value of the Supply segment being less than PPL's recorded value as of June 1, 2015, the date of the spinoff. "Earnings from ongoing operations (adjusted)" for 2014 also reflects, within the Corporate and Other category, the impact of spinoff dissynergies that would remain with PPL after the completion of the transaction, if left unmitigated.
"Earnings from ongoing operations" is adjusted for the impact of special items. Special items include: • Unrealized gains or losses on foreign currency‐related economic hedges.• Supply segment discontinued operations.• Loss on the spinoff of the Supply segment.• Gains and losses on sales of assets not in the ordinary course of business.• Impairment charges. • Workforce reduction and other restructuring effects.• Acquisition and divestiture‐related adjustments.• Other charges or credits that are, in management's view, not reflective of the company's ongoing operations.
40

© PPL Corporation 2015
Definitions of Non‐GAAP Financial MeasuresPPL utilizes the following non‐GAAP financial measures as indicators of performance for its businesses. These measures are not intended to replace"Operating Income," which is determined in accordance with GAAP, as an indicator of overall operating performance. Other companies may usedifferent measures to analyze and report their results of operations. Management believes these measures provide additional useful criteria tomake investment decisions. These performance measures are used, in conjunction with other information, by senior management and PPL's Boardof Directors to manage the operations and analyze actual results compared with budget.
"Kentucky Gross Margins" is a single financial performance measure of the electricity generation, transmission and distribution operations of theKentucky Regulated segment, LKE, LG&E and KU, as well as the Kentucky Regulated segment's, LKE's and LG&E's distribution and sale of naturalgas. In calculating this measure, fuel, energy purchases and certain variable costs of production (recorded as "Other operation and maintenance"on the Statements of Income) are deducted from revenues. In addition, certain other expenses, recorded as "Other operation and maintenance","Depreciation" and "Taxes, other than income" on the Statements of Income, associated with approved cost recovery mechanisms are offsetagainst the recovery of those expenses, which are included in revenues. These mechanisms allow for direct recovery of these expenses and, in somecases, returns on capital investments and performance incentives. As a result, this measure represents the net revenues from electricity and gasoperations.
"Pennsylvania Gross Delivery Margins" is a single financial performance measure of the electricity delivery operations of the PennsylvaniaRegulated segment and PPL Electric, which includes transmission and distribution activities. In calculating this measure, utility revenues andexpenses associated with approved recovery mechanisms, including energy provided as a PLR, are offset with minimal impact on earnings. Costsassociated with these mechanisms are recorded in "Energy purchases," "Other operation and maintenance," which is primarily Act 129 costs, and"Taxes, other than income," which is primarily gross receipts tax. This performance measure includes PLR energy purchases by PPL Electric fromPPL EnergyPlus, which are reflected in "Energy purchases from affiliate" in the reconciliation tables. As a result of the spinoff of the Supply segmentand creation of Talen Energy on June 1, 2015, PPL EnergyPlus (renamed Talen Energy Marketing) is no longer an affiliate of PPL Electric. PPLElectric's purchases from Talen Energy Marketing subsequent to May 31, 2015 are reflected in "Energy Purchases" in the reconciliation tables. Thismeasure represents the net revenues from the Pennsylvania Regulated segment's and PPL Electric's electricity delivery operations.
41