,3s fc l if^rf¥ii s w^t r - usgs · sium-argon whole-rock analyses for east-west-trending dikes...
TRANSCRIPT

rW^tsif^rf¥ii:*lfc ^rt Ju «liWiAjrv^ *vW**«^ ,3s 1JL
S *""%"» -*^K' 4^%"^ rf^l mpm$
* aV, ;N-f


Chemical and Isotopic Studies of Granitic Archean Rocks, Owl Creek Mountains, Wyoming
Geochemistry and Petrogenesis of an Archean Granite from the Owl Creek Mountains, Wyoming
By J. S. STUCKLESS, A. T. MIESCH, and D. B. WENNER
Geochronology of an Archean Granite, Owl Creek Mountains, Wyoming
By C. E. HEDGE, K. R. SIMMONS, and J. S. STUCKLESS
Uranium-Thorium-Lead Systematics of an Archean Granite from the Owl Creek Mountains, Wyoming
By J. S. STUCKLESS, I. T. NKOMO, and K. A. BUTT
U.S. GEOLOGICAL SURVEY PROFESSIONAL PAPER 1388-A, B, C
Isotopic and geochemical studies are usedto determine the age and origin of an Archeangranite in the Owl Creek Mountains, Wyoming
UNITED STATES GOVERNMENT PRINTING OFFICE, WASHINGTON : 1986

DEPARTMENT OF THE INTERIOR
DONALD PAUL MODEL, Secretary
U.S. GEOLOGICAL SURVEY
Dallas L. Peck, Director
Library of Congress Cataloging in Publication Data
Main entry under title:Chemical and isotopic studies of granitic Archean rocks, Owl Creek Mountains, Wyoming.(Geological Survey Professional Paper ; 1388)Bibliography: p.Supt. of Docs, no.: I 19.16:1388A-CContents: Geochemistry and petrogenesis of an Archean granite from the Owl Creek Mountains, Wyoming /
J.S. Stuckless, A. T. Miesch, D. B. Wenner Geochronology of an Archean granite, Owl Creek Mountains, Wyoming / C. E. Hedge, K. R. Simmons, J. S. Stuckless Uranium-thorium-lead systematics of an Archean granite from the Owl Creek Mountains, Wyoming / J. S. Stuckless, I. T. Nkomo, K. A. Butt.
1. Geology, Stratigraphic Precambrian. 2. Radioactive dating. 3. Geochemistry Wyoming Owl Creek Mountains. 4. Geology Wyoming Owl Creek Mountains. I. Stuckless, John S. II. Series.
QE653.C49 1986 551.7'1 85-600130
For sale by the Branch of DistributionBooks and Open-File Reports Section
U.S. Geological SurveyFederal Center
Box 25425 Denver, CO 80225

CONTENTS
[Letters designate the chapters.]
Page
(A) Geochemistry and Petrogenesis of an Archean Granite from the Owl Creek Mountains,Wyoming, by J. S. Stuckless, A. T. Miesch, and D. B. Wenner ........ 1
(B) Geochronology of an Archean Granite, Owl Creek Mountains, Wyoming, by C. E. Hedge,K. R. Simmons, and J. S. Stuckless ......................... 27
(C) Uranium-Thorium-Lead Systematics of an Archean Granite from the Owl Creek Moun tains, Wyoming, by J. S. Stuckless, I. T. Nkomo, and K. A. Butt ....... 39
ill


Geochemistry and Petrogenesis of an Archean Granite from the Owl Creek Mountains, Wyoming
By J. S. STUCKLESS, A. T. MIESCH, and D. B. WENNER
CHEMICAL AND ISOTOPIC STUDIES OF GRANITIC ARCHEAN ROCKS, OWL CREEK MOUNTAINS, WYOMING
U.S. GEOLOGICAL SURVEY PROFESSIONAL PAPER 1388-A


CONTENTS
Abstract ............................................. 1Introduction ........................................... 1Methods ............................................. 2
Analytical procedures .................................... 2Q-mode factor analysis .......................... 4
A Q-mode model for granites of the Owl Creek Mountains ................ 8Anomalous oxides and samples .............................. 8Determination of end members .............................. 9Evaluation of the model .................................. 13
Protolith considerations ............................ 14Magma genesis .......................................... 1?Summary and conclusions .................................... 18References ............................................ 20
ILLUSTRATIONS
FIGURE 1. Generalized geologic map and sample locations .......................2. Factor-variance diagram ....................................3. Stereographic projection of three-factor solution ......................4. Chondrite-normalized rare-earth-element diagram ......................5. Ternary diagram of normative quartz, albite, and orthoclase ...............6. Ternary diagram of normative feldspar compositions ...................7. Plot of whole-rock 5180 values versus percent of end member La in starting material
2101112151920
TABLES
PageTABLE 1. Original and computed chemical data and normative mineralogy ............................... 3
2. Chemical data and normative mineralogy for samples not used in the factor solution .................. g3. Miscellaneous chemical data not used in the factor solution ................................. 74. Oxygen isotope compositions ................................................... 75. Proportions of the variance of 37 oxides in 39 samples accounted for by factor models with 2 through 10 factors . . g6. Proportions of the variance of 29 oxides in 25 samples accounted for by factor models with 2 through 10 factors . . 97. Compositions of the end members for the factor model ................................... 138. Mixing proportions for the factor model ............................................ 149. Proportional differences between original chemical data and data represented by the factor solution .......... 15
10. Proportional differences between original chemical data and data derived by the factor solution for samples not used todevelop the factor solution ................................................... ig
VII


CHEMICAL AND ISOTOPIC STUDIES OF GRANITIC ARCHEAN ROCKS, OWL CREEK MOUNTAINS, WYOMING
GEOCHEMISTRY AND PETROGENESIS OF AN ARCHEAN GRANITE FROM THE OWL CREEK MOUNTAINS, WYOMING
By J. S. STUCKLESS, A. T. MIESCH, and D. B. WENNER
ABSTRACT
Analytical data consisting of 37 oxides in 39 samples of granite from the Owl Creek Mountains, Wyo., have been examined by ex tended Q-mode factor analysis. The results show that 25 samples are cogenetic and that 29 oxides in these samples have retained a mag- matically controlled distribution. For these samples and oxides, a five-factor model can account for most of the variance, and therefore the compositional data can be explained as the product of mixing (or unmixing) of five end members. The mixing (or unmixing) may have resulted entirely from fractional crystallization in two distinct stages, or alternatively, the first stage may have been mostly frac tional fusion. Either interpretation can be correlated with variations in whole-rock values of 818O. These variations reflect inhomogeneities in the protolith, which was probably similar to the highly diverse suite of metamorphic rocks intruded by the granite. The two-stage history indicated by either interpretation of the model is compatible with derivation of the granite or initial differentiation at approxi mately 3 kb and near water-saturated conditions, followed by dif ferentiation at a lower pressure of perhaps 1.0-0.5 kb. Although ex tended Q-mode factor analysis cannot uniquely identify the exact end members that controlled evolution of the granite, it has identified the types of processes necessary to explain the chemical complexities observed for the pluton, and the model presented here is compatible with all available data.
INTRODUCTIONThe major uranium deposits of Wyoming are located
within sedimentary rocks derived from the Archean granites of central Wyoming (Seeland, 1976, 1978). Isotopic studies have shown that most of these granites lost large quantities of uranium (Rosholt and Bartel, 1969; Rosholt and others, 1973; Nkomo and others, 1978; Stuckless and Nkomo, 1978; Nkomo and others, 1979) at about the same time that the uranium deposits were formed (Ludwig, 1978, 1979). The genesis of these granites is therefore of economic interest. The granite of the Owl Creek Mountains (fig. 1) not only is closely associated with uranium deposits in overlying Tertiary sediments, but locally hosts near-economic deposits of uranium (Yellich and others, 1978).
The Owl Creek Mountains consist of a discontinuous series of east-west-striking fault blocks that are com
posed of Archean metamorphic rocks, granites, and diabase dikes (Thaden, 1980a, b, and c). The metamor phic rocks are a multiply-folded and petrologically com plex assemblage of volcanic and sedimentary precursors that can be subdivided into three roughly east-west- striking groups (Hamil, 1971). The southern group is dominated by metasediments, with subordinate metavolcanic rocks that are preserved as biotite-musco- vite schists. The middle group consists of diverse lithologies, including schists that contain biotite, gar net, hornblende, cummingtonite, cordierite, sillimanite, andalusite, and sericite, as well as quartzite, iron- formation, and minor siliceous marble. The northern group has the largest metavolcanic component. Rock types here include hornblende or biotite quartz- plagioclase gneisses and small amounts of crossbedded quartzite. Uralatized gabbroic dikes also occur in this group (Condie, 1967). The highest metamorphic grade observed in the three zones is the sillimanite-cordierite- muscovite-almandine subfacies of the Abukuma type of metamorphism (Winkler, 1967). Metabasalts and metadacites, which are presumably part of the northern group, are exposed in the Wind River Canyon (near locality 24, fig. 1). These yield a rubidium-strontium whole-rock age of 2,755±100 Ma (Mueller and others, 1981).
The metamorphic sequence is intruded by granitic rocks and associated pegmatites which have reported ages of 2,645±60 Ma (lead-lead whole-rock, Nkomo and others, 1978) and 2,663 and 2,584 Ma (rubidium-stron tium for pegmatitic muscovite and microcline respec tively, Giletti and Gast, 1961). The contact between the intrusive and the metamorphic rocks commonly forms a wide mixed zone (fig. 1). Within the mixed zone the metamorphic rocks and xenoliths of these rocks are generally migmatitic (Thaden, 1980b). Modal analyses (Nkomo and others, 1978) show that the intrusive rock is a granite according to the IUGS classification (Strec- keisen, 1973).

439 108°10'
30' I
GRANITIC ARCHEAN ROCKS, OWL CREEK MOUNTAINS, WYOMING
______05'________ 108°DD'________________W_______ 107°50'
43° 22' 3D"
POST-PROTEROZOIC COVER
DIABASE DIKES
GRANITE
METAMORPHIC ROCKS
SAMPLE LOCALITY TDG13
TDG12, DP-1
DP-8
DP-2 GP-5
6 TDG44.TDG45
7 4343
8 DP-3
9 23432
10 58-66, 58-80, 58-98,58180,58188.58317 58392, 58398
11 TDG46, TDG47
12 41591,41596
13 30501,30511,29394,29467
14 32466,32496
15
16
17
18
19
20
21
22
23
24
25
GP-4
TD6GP-3
DKCH-1GP-1
GP-2
TD22
TDG21
TDG20
TDG16
TDG24
FIGURE 1. Generalized geologic map of the Owl Creek Mountains (modified from Thaden, 1980a, b, and c) showing sample localities. Locality numbers are used as identification numbers on subsequent plots, and where more than one sample were collected at a single locality, samples are distinguished by an alphabetic suffix that corresponds to the order shown on figure 1. For example, sample TDG12 has a plot identification of 2a.
The granite and metamorphic rocks are cut by diabase dikes that trend north to northeasterly. Potas sium-argon whole-rock analyses for east-west-trending dikes just west of the area shown on figure 1 yield ages of 1,900-2,100 Ma (Condie and others, 1969).
The crystalline rocks were uplifted and eroded during late Precambrian time. Topographic highs formed on this erosional surface protrude 60-100 m into the Paleo zoic sedimentary rocks (Nkomo and others, 1978). Periods of sedimentation continued through the Paleo- cene and attained a total thickness of more than 7000 m of shallow marine and coastal plain sediments. The Laramide orogeny, which began in Late Cretaceous time, was accompanied by faulting that uplifted the Owl Creek Mountains more than 5300 m (Keefer and Love, 1963) and caused a stratigraphic separation of more than 7000 m along the south side of the range (Nkomo and others, 1978). The faulting, which may have oc
curred along zones of weakness in the Precambrian basement, was probably responsible for the develop ment of brecciated zones along the southern side of the range (Yellich and others, 1978; Bramlett and others, 1982). Brecciation was particularly intense near the north Canning area (sample localities 4-14, fig. 1). This brecciated zone was mineralized with uranium during the Cenozoic (Nkomo and others, 1978). Most recently, the Owl Creek Mountains were partly buried by volcan ic detritus during the late Eocene and reexhumed dur ing the Quaternary.
METHODS
ANALYTICAL PROCEDURES
Major-element concentrations (reported in weight percent, tables 1, 2, and 3) were obtained by two methods. Most samples were analyzed by the single so-

GEOCHEMISTRY AND PETROGENESIS <
TABLE 1. Original chemical data and CIPW normative mineralogy (0) for 25 samples from the Owl Creek Mountains, Wyo., andcorresponding data represented by the factor solution (R)
Sample No. DP-3 23432 29394 29467 Plot I.D. 8 9 13c 13d
30501 30511 32466 32496 13a 13b 14a 14b
OROROROROROROROR
Weight percent
Si02 71.89 72.24 73.92 73.52 70.87 71.21 71.45 71
A1 20 3 14.88 14.77 14.38 14.52 14.94 14.87 15.01 14
FeO(t) 2.07 2.07 1.53 1.40 2.92 2.80 2.41 2
MgO .83 .59 .28 .35 1.01 .91 .78
CaO 1.90 1.71 1.31 1.53 2.12 2.09 1.91 1
Na 2 0 4.19 4.07 4.02 4.03 4.34 4.47 4.23 4
K 20 3.69 4.09 4.22 4.32 3.23 3.04 3.73 3
Ti0 2 .30 .25 .16 .14 .33 .36 .27
.61 72.81 72.69 72.29 72.36 73.24 72.94 73.34 73.44
.97 14.52 15.63 14.54 14.68 14.53 14.72 14.39 14.46
.31 1.89 1.93 2.24 2.14 1.65 1.58 1.53 1.52
.70 .68 .56 .67 .65 .30 .41 .25 .38
.93 1.73 1.72 1.92 1.82 1.60 1.59 1.60 1.49
.47 4.06 4.15 4.14 4.20 4.11 4.03 4.12 4.01
.53 3.86 3.89 3.74 3.68 4.21 4.37 4.43 4.36
.26 .24 .23 .26 .27 .17 .17 .15 .16
Parts per million
MnO 366 360 234 242 537 539 447 439
Rb 20 205 200 188 195 213 182 217 191
BaO 1137 931 797 785 693 818 722 802
SrO 314 267 233 233 281 309 276 296
Th0 2 43.80 41.15 28.05 26.91 48.55 45.68 29.03 31
La 2 03 64.87 60.74 22.37 25.81 82.64 79.67 41.53 48
Ce2 0 3 122.8 103.5 37.66 41.59 133.5 132 67.75 76
Nd 2 03 36.33 34.96 11.95 14.11 43.56 45.46 24.14 26
Sm 20 3 4.96 4.81 1.71 2.02 5.65 6.32 3.63 3
Eu 2 03 1.07 .866 .650 .707 .990 .979 .810
Gd 20 3 3.41 2.60 1.06 1.55 3.42 3.68 3.26 2
Tb 2 03 .44 .36 .16 .23 .48 .51 .44
Dy 2 03 2.36 1.89 .93 1.34 2.57 2.80 2.37 2
Tm203 .140 .099 .070 .083 .150 .148 .120
Yb 20 3 .81 .52 .42 .46 .80 .76 .60
Lu 20 3 .110 .066 .060 .062 .100 .095 .080
Ta 2 0 5 2.04 .78 .44 .53 .69 .80 .59
Hf02 4.62 4.59 4.15 3.57 4.77 5.73 4.43 4
Zr0 2 223 203 187 155 263 253 207 224
Sc 20 3 4.04 3.99 2.71 2.75 5.46 5.83 4.45 4
CoO 5.56 4.47 2.44 2.70 7.29 6.80 5.39 5
326 352 321 393 214 265 329 273
209 192 194 186 174 197 212 207
811 808 788 838 904 885 720 753
289 259 296 273 238 251 227 224
.44 39.29 35.49 41.97 40.16 27.48 30.58 27.84 28.85
.98 51.44 48.36 66.12 60.11 36.41 36.12 32.43 28.86
.80 81.80 80.25 105.7 101 55.96 59.94 53.56 46.79
.09 27.76 27.52 35.08 34.53 21.16 19.88 18.75 16.38
.70 3.86 3.87 4.57 4.75 3.03 2.71 2.52 2.56
.806 .780 .817 .880 .889 .650 .753 .620 .687
.87 1.84 2.41 2.33 2.62 1.94 1.71 2.15 2.14
.43 .29 .34 .36 .36 .27 .25 .32 .33
.50 1.73 1.90 2.07 1.92 1.35 1.36 1.80 1.91
.146 .120 .108 .110 .101 .060 .077 .110 .124
.78 .65 .57 .60 .52 .32 .41 .62 .69
.100 .090 .074 .070 .066 .040 .055 .090 .094
.63 .87 .67 .39 .68 .31 .57 .72 .73
.87 3.96 4.42 4.45 4.70 3.71 3.75 4.15 3.97
182 192 235 205 169 169 181 169
.99 4.85 3.89 4.24 4.20 2.95 2.99 2.87 3.29
.42 4.79 4.22 5.22 4.84 2.56 3.17 2.44 2.95
Norms (weight percent)
Q 26.58 26.88 30.00 28.71 25.02 25.67 25.49 25
C .53 .55 .82 .43 .45 .43 .54
Or 21.88 24.20 25.00 25.58 19.12 17.99 22.07 20
Ab 35.56 34.48 34.09 34.13 36.80 37.92 35.87 37
An 9.43 8.49 6.50 7.62 10.54 10.38 9.51 9
Wo .00 .00 .00 .00 .00 .00 .00
En 2.07 1.47 .70 .87 2.52 2.26 1.94 1
Fs 3.38 3.46 2.59 2.38 4.92 4.65 4.07 3
11 .57 .47 .31 .27 .63 .69 .52
lution technique (Shapiro and Brannock, 1962; Suhr and Ingamells, 1966). Stated accuracies in terms of percent of amount present are ±1 percent for Si02, ±2 percent for Al20s, and ±1 to 10 percent for the remaining major oxides. Sample numbers prefixed by TD were analyzed using high precision X-ray fluorescence spectrometry (Taggart and others, 1982), and ferrous/ferric ratios were determined by wet chemical methods (Peck, 1964). Precision for the X-ray fluorescence results is ±2 percent of the amount present (2a).
Minor- and trace-element concentrations (those re ported in parts per million, tables 1, 2, and 3, except for U, Th, Rb, Sr, and Zr) were determined by neutron activation analysis using methods modified from those of Gordon and others (1968). Estimated accuracies range from 5 to 20 percent of the amount present ex-
.21 28.33 27.71 27.16 27.46 28.13 27.59 27.50 28.54
.29 .52 .46 .20 .50 .30 .47 .00 .44
.87 22.84 23.00 22.11 21.76 24.91 25.86 26.20 25.78
.88 34.43 35.22 35.09 35.56 34.82 34.19 34.95 33.99
.61 8.58 8.55 9.53 9.03 7.97 7.88 7.68 7.41
.00 .00 .00 .00 .00 .00 .00 .13 .00
.75 1.70 1.39 1.66 1.61 .75 1.02 .63 .96
.89 3.13 3.24 3.74 3.57 2.80 2.68 2.63 2.60
.50 .46 .43 .50 .51 .32 .32 .29 .30
cept for a few samples for which high uranium contents produced large interferences for a few rare earth ele ments (REE). For these samples, the data reported in tables 1 and 2 were obtained by extrapolation be tween the chondrite normalized abundances of the actfa- cent REE. Chondrite values of Evensen and others (1978) are used for normalization throughout this paper.
Most uranium and thorium concentrations were ob tained by isotope dilution and mass spectrometry (Stuckless and others, this volume). These values were supplemented by delayed neutron determinations for uranium (Millard, 1976) and -y-ray spectrometry deter minations for thorium (Bunker and Bush, 1966). The general accuracy of reported uranium and thorium con centrations is ±2 percent (2cr).
Most rubidium and strontium concentrations were

4 GRANITIC ARCHEAN ROCKS, OWL CREEK MOUNTAINS, WYOMING
TABLE 1. Original chemical data and CIPW normative mineralogy (0) for 25 samples from the Owl Creek Mountains, Wyo., and corre sponding data represented by the factor solution (R) Continued
Sample No. GP-3 GP-5 4343 TDG12 Plot I.D. 17 5 7 2a
OROROROR
TD-13 TDG21 TD22 TDG47 58180 1 22 21 lib lOd
OROROROROR
Weight percent
Si02 74.89 74.85 75.55 75.86 73.76 73.72 74.16 74.33 74
A1 203 13.16 13.39 14.13 13.76 14.03 13.80 13.62 13.78 13
FeO(t) 1.17 1.39 .30 .61 1.71 2.06 2.11 1.58 1 MgO .21 .08 .10 .07 .32 .49 .20 .31
CaO .32 .08 1.39 1.18 1.21 .99 .96 .89
Na 20 2.49 2.73 3.68 3.67 3.13 3.13 3.03 3.31 3
K 2 0 7.48 7.26 4.68 4.67 5.35 5.33 5.63 5.46 5 Ti02 .08 .05 .05 .06 .23 .26 .12 .15
Parts per
MnO 134 229 96 98 351 337 342 271 320
Rb2 0 429 394 202 193 274 274 303 280 275 BaO 776 697 556 588 978 940 606 746 762
SrO 49 5 122 156 147 140 98 121 104
Th02 50.97 49.91 21.18 23.23 69.00 69.80 35.13 48.48 57
La2 03 45.61 36.82 6.11 2.78 96.21 94.88 50.57 50.79 66 Ce2 03 87.95 72.24 11,10 5.51 190.6 175.4 84.92 93.31 128
Nd2 03 35.13 29.23 3.81 3.09 75.18 62.08 30.93 34.40 43 Sm2 03 7.23 6.78 .66 .72 11.78 9.54 5.72 6.02 7
Eu 2 03 .300 .274 .730 .612 1.06 .873 .640 .627
Gd 2 03 7.36 6.85 .690 .746 4.18 4.93 4.16 4.36 4 Tb2 03 1.25 1.11 .13 .12 .66 .67 .59 .66
Dy2 03 7.60 6.54 .79 .69 3.89 3.48 3.18 3.70 3 Tm203 .575 .472 .070 .058 .250 .209 .200 .251 Yb2 03 3.34 2.77 .44 .35 1.44 1.16 1.14 1.44 1
Lu 203 .480 .389 .070 .053 .200 .158 .150 .199 Ta2 05 3.59 3.09 .96 .51 1.86 2.03 2.28 1.83 2
Hf02 7.20 6.25 2.68 2.69 7.23 5.91 4.68 5.21 5 Zr02 293 217 100 92.7 302 215 193 190 205
Sc 20 3 5.32 5.50 1.16 1.08 5.26 4.48 3.42 4.15 4 CoO 1.15 .63 .40 .39 3.02 3.40 2.17 2.21 1
.34 74.20 74.50 74.53 74.76 74.98 76.75 76.80 76.19 76.02
.92 13.76 14.08 13.83 13.72 13.59 12.69 12.83 12.95 13.19
.55 1.71 1.46 1.35 1.53 1.36 1.50 1.20 .89 1.21
.30 .35 .31 .21 .20 .24 .30 .35 .27 .26
.82 .88 .64 .78 .60 .80 1.25 1.23 .91 .98
.33 3.17 3.27 3.11 3.17 3.04 3.65 3.68 3.19 3.30
.40 5.53 5.45 5.89 5.75 5.64 3.57 3.62 5.08 4.73
.14 .19 .11 .13 .10 .15 .16 .19 .36 .16
mi 1 1 i on
281 190 199 163 205 329 279 299 221
280 279 282 232 268 169 191 231 229 844 909 879 726 840 263 203 682 545 123 88 116 85 109 136 107 130 104
.42 57.86 59.01 51.11 55.40 56.78 39.85 39.88 56.76 48.99
.71 68.78 57.59 53.23 48.85 62.30 29.66 29.64 47.96 46.07
.8 127.7 102.6 100.7 95.13 118.4 50.88 53.31 84.30 86.98
.54 45,93 32.96 36.18 36.55 42.64 22.21 23.01 28.24 33.08
.37 7.48 5.27 6.04 6.50 6.85 4.45 4.21 4.48 5.52
.640 .725 .570 .651 .650 .733 .720 .728 .740 .736
.56 4.53 3.40 3.78 4.38 3.72 3.51 2.96 2.96 3.18
.60 .65 .50 .55 .55 .52 .51 .44 .46 .45
.01 3.52 2.74 3.00 2.55 2.70 2.68 2.43 2.49 2.37
.190 .228 .220 .200 .120 .175 .190 .174 .180 .161
.06 1.30 1.29 1.16 .61 1.01 1.01 .98 1.08 .92
.140 .179 .190 .162 .080 .140 .140 .136 .160 .128
.07 1.94 1.63 1.79 .80 1.76 .93 1.06 2.29 1.40
.17 5.41 4.73 4.72 4.35 4.78 4.24 4.52 4.27 4.51 196 109 171 97.9 164 87.4 132 153 141
.39 4.10 3.00 3.24 2.93 3.01 2.38 3.07 3.46 2.77
.78 2.47 1.57 1.45 1.51 1.54 1.83 2.02 1.29 1.53
Norms (weight percent)
Q 29.90 29.82 32.90 33.58 30.80 30.81 31.00 30.60 30 C .39 .90 .48 .53 .89 1.10 .81 .80 1
Or 44.28 42.94 27.67 27.61 31.67 31.54 33.32 32.32 31 Ab 21.13 23.12 31.20 31.09 26.53 26.50 25.65 28.10 28
An 1.59 .42 6.92 5.85 6.02 4.91 4.76 4.42 4 Wo .00 .00 .00 .00 .00 .00 .00 .00 En .52 .19 .25 .18 .81 1.22 .50 .77
Fs 2.04 2.52 .48 1.05 2.84 3.43 3.74 2.70 2 11 .15 .09 .09 .11 .44 .49 .23 .29
measured by isotope dilution and mass spectrometry (Hedge and others, this volume). These determinations were supplemented by X-ray fluorescence analyses, which have a general accuracy of ± 5 percent. All zirco nium concentrations were obtained by X-ray fluores cence for which the estimated precision is ±5 percent (2a).
Oxygen isotopic compositions (table 4) were deter mined according to the methods of Taylor and Epstein (1962). Results are reported relative to SMOW (stan dard mean ocean water) and are accurate to ±0.1 per thousand (2a).
Q-MODE FACTOR ANALYSIS
The mathematical method used to develop the pet- rogenetic model for the granites of the Owl Creek
.96 30.90 31.71 30.94 31.53 32.63 37.56 37.55 35.42 35.37
.12 .96 1.65 .93 1.19 1.02 .54 .63 .56 .86
.94 32.73 32.26 34.86 34.00 33.38 21.13 21.40 30.06 27.99
.21 26.90 27.68 26.34 26.90 25.79 30.95 31.14 27.01 27.95
.06 4.38 3.19 3.86 3.00 4.00 6.20 6.10 4.50 4.87
.00 .00 .00 .00 .00 .00 .00 .00 .00 .00
.75 .88 .76 .52 .51 .60 .76 .87 .67 .65
.68 2.89 2.54 2.32 2.67 2.29 2.55 1.95 1.11 1.99
.27 .36 .21 .24 .19 .29 .31 .36 .68 .31
Mountains is the extended form of Q-mode factor analy sis (Miesch, 1976a, b, 1981). The main difference be tween conventional Q-mode factor analysis and the ex tended form is that the extended method allows conver sion of the scaled analyses back to the original metric so that the final model can be more easily interpreted in petrologic terms.
For extended Q-mode factor analysis, the analytical data for each oxide variable are scaled so that each variable has the same mean and variance; this assures that the major oxides, especially Si02 and A1203, will have no greater influence than the minor constituents in model development. The scaled analytical data are conceptually represented as N vectors in M- dimensional space, where N is the number of samples

GEOCHEMISTRY AND PETROGENESIS
TABLE 1._Original chemical data and CIPW normative mineralogy (0) for 25 samples from the Owl Creek Mountains, Wyo., and corresponding data represented by the factor solution (R) Continued
Sample No. 41591 41596 OP-8 DP-2 Plot I.D. 12a 12b 3 4
0 R 0 R 0 R 0
Weight
TD646 58-66 58-80 58-98 lla lOa lOb
ROROROROR
percent
Si02 71.36 71.88 74.65 74.50 73.25 73.09 73.83 73.71 75.36 75.19 76.21 76.46 77.29 76.84 76.38 76.44
A1 2 03 15.00 14.87 14.10 14.32 14.87 14.44 14.43 14.41 13.62 13.73 13.07 13.35 12.95 12.99 13.51 13.29 FeO(t) 2.26 2.25 1.11 .89 1.23 1.78 1.04 1.38 1.50 1.16 .90 .64 .66 .89 .72 .83 MgO .70 .68 .16 .14 .37 .46 .30 .32 .30 .28 .10 .05 .25 .19 .14 .19
CaO 2.01 1.87 1.26 1.28 1.32 1.50 1.39 1.40 1.10 1.28 .87 .93 1.10 1.02 1.19 1.22 Na20 4.33 4.26 3.57 3.76 4.45 4.16 3.98 3.85 3.73 3.80 3.42 3.43 3.41 3.41 3.77 3.71
K 2 0 3.82 3.70 4.94 4.88 4.15 4.23 4.68 4.61 4.20 4.29 5.23 4.97 4.12 4.42 4.07 4.09 Ti02 .28 .27 .05 .07 .18 .17 .17 .14 .06 .13 .08 .06 .10 .13 .12 .11
Parts per million
MnO 465 409 166 127 347 349 209 229 230 228 136 114 111 179 130 176
Rb 2 0 208 188 205 202 188 226 172 209 193 205 253 222 216 207 181 187 BaO 897 894 793 800 677 629 937 814 553 515 466 493 414 396 309 377 SrO 300 288 260 198 203 217 184 214 131 162 112 105 113 97 119 133
Th02 36.65 39.79 23.72 24.19 28.44 25.79 30.13 31.52 33.25 29.93 33.27 29.95 33.27 40.44 29.71 29.06 La 203 71.58 62.43 11.76 12.45 21.39 24.35 27.66 31.26 12.28 19.45 7.10 8.11 30.62 27.33 11.73 11.38
Ce2 03 112.5 104.2 20.29 21.29 38.16 35.63 49.30 53.36 17.24 32.93 14.25 17.35 63.96 52.65 23.71 20.47
Nd 203 38.33 35.22 7.39 7.10 16.12 13.52 19.38 18.38 8.26 13.44 7.25 8.59 29.03 21.69 10.38 9.93 Sm2 03 4.83 4.79 1.47 1.06 3.57 2.63 2.67 2.74 1.86 2.50 1.74 2.03 4.61 3.87 2.14 1.99
Eu 2 03 .990 .894 .610 .637 .650 .599 .740 .704 .630 .648 .570 .564 .730 .695 .580 .658
Gd 2 03 2.76 2.68 1.16 .854 3.70 3.20 2.02 1.87 1.47 2.19 1.72 1.87 2.70 2.39 1.45 1.62
Tb 203 .41 .37 .17 .13 .61 .52 .31 .28 .23 .34 .28 .30 .39 .35 .21 .25 Dy2 03 2.37 1.99 .95 .75 3.60 3.19 1.75 1.54 1.44 1.97 1.68 1.70 2.11 1.83 1.15 1.39
Tm2 03 .120 .103 .060 .052 .220 .218 .100 .097 .120 .140 .140 .134 .140 .134 .090 .107 Yb2 03 .62 .53 .31 .31 1.23 1.23 .58 .54 .70 .80 .82 .80 .82 .77 .52 .62
Lu2 03 .080 .066 .040 .045 .160 .167 .070 .074 .100 .111 .110 .115 .120 .109 .070 .088 Ta205 .90 .68 .26 .51 .69 .99 .61 .74 .62 .84 1.08 1.00 .83 1.09 .59 .69
Hf02 45.11 4.77 2.30 2.83 3.89 4.69 4.55 3.72 5.83 3.87 2.22 3.35 4.00 3.92 3.65 3.43 Zr02 189 215 107 118 164 198 154 156 131 139 89.4 103 144 112 126 106
Sc 203 4.06 4.43 1.08 1.52 6.08 4.60 2.97 2.74 2.27 2.76 1.88 1.67 2.06 2.07 2.12 1.88 CoO 5.63 5.16 1.17 1.12 3.10 3.61 2.40 2.44 1.89 1.88 .72 .15 1.11 .91 .81 1.06
Norms (weight percent)
Q 24.51 26.31 31.21 30.32 27.22 27.46 28.64 29.15 33.59 32.67 33.63 34.97 38.50 37.04 35.59 35.72 C .08 .47 .61 .51 .67 .30 .29 .53 .94 .51 .20 .64 .87 .75 .72 .55
Or 22.64 21.88 29.21 28.90 24.55 25.01 27.68 27.30 24.83 25.36 30.93 29.39 24.35 26.13 24.08 24.22
Ab 36.69 36.07 30.22 31.86 37.72 35.27 33.73 32.65 31.62 32.20 28.96 29.03 28.91 28.84 31.96 31.40
An 10.00 9.28 6.26 6.37 6.53 7.43 6.92 6.96 5.46 6.36 4.34 4.62 5.48 5.07 5.92 6.05 Wo .00 .00 .00 .00 .00 .00 .00 .00 .00 .00 .00 .00 .00 .00 .00 .00
En 1.76 1.69 .40 .36 .93 1.16 .74 .80 .75 .69 .25 .14 .63 .46 .35 .47 Fs 3.78 3.77 2.00 1.54 2.02 3.06 1.67 2.34 2.70 1.97 1.55 1.11 1.07 1.46 1.14 1.38
11 .54 .52 .10 .14 .35 .32 .32 .27 .12 .25 .15 .11 .19 .25 .23 .22
and M is the number of oxide variables. Dividing each scaled analysis by the square root of the sum of the squared values adjusts each vector to unit length. The M-reference axes for the vector system (each repre senting one of the oxide variables) are then replaced by the principal-component axes. The first principal- component axis represents the average composition of all samples and lies at the center of the sample-vector cluster. The second principal-component axis lies at a right angle to the first and is oriented so that the sam ple vectors have as high a projection on it as possible. Similarly the third principal-component axis lies at right angles to the first two, but again is so oriented that the sample vectors have as high a projection on it as possible. There are M principal-component axes in all, the same as the number of oxide variables.
The coordinates (projections) of the sample vectors with respect to the principal-component axes constitute a new data set that describes the composition of sam ples in terms of the principal components rather than in terms of the M oxides. The advantage here is that the successive principal components are of decreasing importance in terms of explaining compositional varia tion in the sample set. Commonly the compositional variability represented by the first few principal com ponents (denoted by m) is almost as great as that rep resented by all M components. Consequently, elimina tion of all but the first several principal components will yield a data set that is not drastically different from that represented by all the principal components. The simplification thus attained greatly facilitates the development of a petrogenetic model that will account

GRANITIC ARCHEAN ROCKS, OWL CREEK MOUNTAINS, WYOMING
TABLE 2. Chemical data and CIPW normative mineralogy for 14 samples not accounted for by the factor solution
Sample No. Plot I.D.
58188 lOe
58317 lOf
58392 10g
58398 lOh
DP-1 2b
GP-1 GP-2 GP-4 19 20 15
TD-6 16
TDG16 24
TDG20 23
TDG24 25
TDG44 6a
TDG45 6b
Weight percent
Si0 2A1 203FeO(t)MgOCaONa20K20Ti02
71.0615.052.62
1.32
3.56
3.76
2.13
.30
76.35
13.29
.59
.15
1.20
3.80
4.50
.06
49.90
15.38
11.44
8.05
9.57
2.65
1.32
1.43
52.82
15.30
10.38
8.06
7.75
2.89
1.65
.86
75.22
14.20
.49
.04
.87
4.60
4.50
.02
75.79 70.54 71.35
14.92 18.21 17.33
.51 .36 .89
.04 .04 .20
.23 .14 6.05
5.81 10.31 3.53
2.50 .29 .42
.01 0.00 .09
74.10
14.11
.29
.05
.03
2.32
9.00
.01
76.09
14.00
.64
.05
.91
4.26
4.0D
.01
73.69
15.08
1.20
.05
.32
4.42
4.96
.01
74.58
14.11
1.29
.20
.73
4.13
4.84
.05
75.55
12.96
1.34
.20
.34
2.41
6.94
.07
50.97
13.46
14.68
5.90
10.91
1.83
.84
1.13
Parts per million
MnORb20BaOSrO
Th02La203Ce203Nd203
Sm203Eu 20 3Gd203Tb2°3Dy203Tm203Yb203Lu 203Ta 20 5Hf02Zr02Sc 203CoO
416
131
801
345
13.30
23.52
36.98
12.65
2.19
.616
1.61
.25
1.35
.104
.65
.097
.56
3.38
189
5.84
7.57
86
227
112
69
30.16
3.95
8.80
5.23
1.36
.471
1.59
.29
1.93
.183
1.14
.173
.81
2.24
65.7
.98
.51
1630
62
356
236
1.75
12.24
25.10
13.87
3.64
1.30
3.44
.59
3.74
.326
2.02
.301
.45
2.73
155
28.7
70.7
1706
86
570
175
2.18
9.44
19.67
11.27
2.95
1.04
3.29
.63
4.33
.472
3.10
.482
.38
2.01
105
64.6
52.8
147
217
40
12
9.30
5.31
10.04
3.59
.72
.059
.807
.14
.92
.081
.50
.075
.32
3.00
76.2
.97
.08
898 940 125
725 22 37
131 6 136
9 8 703
5.94 3.23 44.03
1.71 .53 34.51
4.49 1.41 67.52
3.34 1.04 23.04
1.06 .34 3.63
.042 .037 .445
1.37 .438 2.24
.25 .08 .41
1.69 .54 2.59
.155 .051 .219
.96 .33 1.32
.139 .050 .188
58.2 23.6 1.60
1.46 2.83 4.33
42.7 59.5 183
1.03 .08 4.03
.25 .10 .94
57
598
142
29
2.44
2.48
5.03
2.70
.63
.175
.965
.21
1.43
.127
.88
.138
2.14
.24
27.0
.34
.63
71
148
77
44
6.04
5.18
6.78
2.91
.67
.197
1.23
.30
2.35
.233
1.50
.226
.52
.69
49.7
1.12
.71
2042
403
114
19
8.27
2.22
4.39
2.53
.56
.100
.811
.25
1.67
.155
.98
.147
17.4
4.87
75.6
.40
.96
104
191
296
56
19.01
20.67
35.15
13.72
2.65
.289
2.55
.39
2.36
.150
.83
.108
.87
2.45
17.6
3.23
1.13
841
521
273
52
33.26
9.99
20.04
9.48
2.19
.291
2.43
.49
3.54
.557
4.16
.754
8.58
4.24
28.1
6.91
1.56
2379
26
162
135
2.40
9.30
19.20
11.40
3.12
.909
3.66
.63
4.15
.431
2.88
.450
.30
2.40
47.2
61.2
46.4
Norm (weight percent)
QCOrAbAnWoEnFsFoFa11
29.47
.08
12.63
31.88
17.68
.00
3.30
4.39
.00
.00
.58
33.82
.00
26.59
32.15
5.94
.00
.37
1.00
.00
.00
.11
0.00
.00
7.83
22.43
26.19
8.91
6.26
5.92
9.67
10.08
2.71
0.00
.00
9.78
24.52
23.89
6.10
12.14
10.86
5.58
5.50
1.63
28.91
.18
26.61
38.95
4.32
.00
.10
.90
.00
.00
.04
31.42 8.74 35.32
2.24 .69 .08
14.81 1.71 2.50
49.19 87.22 29.88
1.14 .70 30.04
.00 .00 .00
.10 .10 .50
1.09 .84 1.50
.00 .00 .00
.00 .00 .00
.02 .00 .17
25.80
.50
53.24
19.64
.15
.00
.13
.53
.00
.00
.02
33.45
1.00
23.63
36.07
4.53
.00
.13
1.17
.00
.00
.02
27.07
1.85
29.30
37.45
1.60
.00
.13
2.57
.00
.00
.02
29.15
.76
28.61
34.99
3.60
.00
.50
2.30
.00
.00
.10
32.82
.86
41.06
20.42
1.70
.00
.50
2.50
.00
.00
.13
0.00
.00
4.94
15.53
26.02
11.74
13.80
23.96
.63
1.21
2.15
for suitably large proportions of the variations in all M oxides.
Retention of only the first m principal components projects the sample vectors from an M-dimensional space into an m-dimensional space (where M is greater than m). Because projection moves vectors, the sample
vectors will represent slightly different compositions before and after projection. Methods described in re ports cited previously can be used to derive the compo sitions represented by the vectors after projection, and comparison of these recomputed compositions with the original compositions is used to judge the degree to

GEOCHEMISTRY AND PETROGENESIS
TABLE 3. Miscellaneous chemical data for 39 samples from the Owl Creek Mountains, Wyo.
Sample No. Fe2 0 3 H 20 P 2 05 C02 U Cs Sb Cr
58-66 0.95 1.06 0.07 0.02 5.29 4.82 0.058 0.89 58-80 .62 1.46 .05 .01 11.80 3.25 .071 1.76 58-98 .69 .67 .08 .01 5.37 2.90 .038 1.28 58180 .42 .65 .10 .02 160.5 2.16 .050 1.50 58188 .86 2.60 .13 .43 5.77 3.03 .030 11.6
58317 .50 .66 .07 .11 2008 4.73 .090 .50 58392 2.70 1.61 .16 .06 1.87 .61 .030 181 58398 2.60 2.65 .15 .02 1.09 1.79 .030 247 DP-1 .46 .57 .07 .02 2.87 3.00 .048 .71 DP-2 .83 .76 .11 .01 14.58 2.47 .020 3.21
DP-3 1.50 .91 .15 .01 3.39 6.41 .050 18.8 6P-1 .30 .94 .16 .02 .99 46.9 .380 1.90 6P-2 .09 .57 .14 .02 .29 1.62 .950 1.90 6P-3 .80 .83 .10 .01 9.22 11.4 .020 1.83 6P-4 .80 1.24 .11 .01 17.00 1.72 .020 .35
6P-5 .11 .56 .06 .01 3.45 12.70 .220 .67 23432 .47 .37 .09 .04 21.88 1.96 .103 23.9 29394 .88 .68 .16 .02 11.94 4.54 .100 41.5 29467 .77 .46 .17 .05 8.42 3.81 .115 34.7 30501 .40 .50 .12 .04 9.30 2.72 .103 30.0
30511 .24 .53 .13 .04 9.16 2.82 .102 34.3 32466 .50 .40 .08 .06 6.15 1.77 .020 25.9 32496 .36 .33 .09 .06 14.44 2.68 .118 24.7 41591 .61 .49 .12 .04 11.90 3.94 .103 35.741596 1.23 .21 .05 .03 12.80 1.68 .098 19.5
4343 .11 .74 .12 .02 16.80 5.74 .082 2.90 DP-8 .46 .61 .12 .02 4.16 1.83 .020 6.11 TD-6 .32 .04 .05 .00 .40 34.30 .176 32.1 TD612 2.32 .24 .05 .00 11.54 5.10 .248 57.4 TD-13 1.71 .49 .05 .00 3.72 3.21 .106 20.9
TD616 .70 .30 .05 .00 3.77 1.95 .086 23.3 TD620 1.33 .08 .05 .00 2.42 3.60 .128 39.9 TD621 1.59 .75 .05 .00 2.29 5.18 .056 15.8 TD22 1.66 .66 .05 .00 2.44 2.02 .081 27.3 TD624 1.42 .22 .05 .00 4.68 1.84 .205 45.1
TDG44 1.48 .10 .05 .00 14.08 7.87 .214 5.78 TD645 16.00 .19 .05 .00 2.78 .42 .300 101 TD646 1.65 .20 .05 .00 71.79 2.29 .275 14.8 TDG47 1.64 .02 .05 .00 78.41 1.74 .197 5.47
which the projection distorts the data. The effect of projections for different m's is examined on factor-var iance diagrams. If large proportions of the variances in the oxide variables can be retained only by setting ra to some value near M, little reduction in the com plexity of the problem is possible; however, if the re computed data derived for small ra's are nearly the same as the original data, the problem may be greatly simplified. By convention, the value of ra is referred to as the number of factors and is equal to the number of end members that must be mixed and (or) unmixed in a petrologic mixing model.
Commonly, ra end members will be sufficient to ac count for the variation in all but a few of the oxide variables or in all but a few of the samples. It is always possible to account for the remaining unexplained var iance in the oxides or samples by increasing ra, but doing so may also obscure a simple underlying composi tional structure and greatly complicate the process of developing an acceptable mixing model that accounts for most of the oxides or samples or both.
TABLE 4. Oxygen isotope compositions for granitic and metamorphic rocks from the Owl Creek Mountains, Wyo.
[Values reported in parts per thousand relative to standard mean ocean water]
Sample S I8 0 Sample S I80
DP-3 6.9 4343 7.4 23432 7.5 TDG13 8.1 29394 7.7 TDG21 7.5 29467 8.2 TD22 7.2 30501 7.6 TDG47 8.1 30511 7.8 58180 7.6
32466 7.5 58188 5.2 32496 7.9 58317 8.1 41591 8.0 58392 7.8 41596 7.4 58398 4.9 DP-8 7.8 TD-6 6.5 DP-2 7.3 DP-1 5.8
TDG46 8.6 GP-2 7.3 58-66 7.6 DKCH-167 6.7 58-80 8.0 DKCH-207 5.1 58-98 8.0 DKCH-263 6.9 GP-3 7.8 DKCH-274 6.4 GP-5 7.8 DKCH-279 6.5
The oxide variables not adequately accounted for by ra end members are easily identified on the factor-var iance diagram. Samples not well accounted for are iden tified by comparatively large values of a badness-of-fit measure which is here defined as equal to the average absolute value of (Xcomp-Xobs)/Xobs across the M oxide variables, where Xobs is the observed (raw) oxide value and Xcomp is the corresponding value after projection of the sample vectors into ra-dimensional space.
The badness-of-fit measure has a second application, which is used in the current study. Methods described in the reports cited previously can be used to project sample vectors not included in the original analysis into the ra-dimensional vector system. After projection, the badness-of-fit measure can be used to test samples of doubtful relation to the main body or sequence for com positional compatibility with the main sequence.
Once the ra-dimensional system of sample vectors has been established, the task is then to select ra reference vectors that represent ra petrologic phases that are thought to have been involved in the processes of mix ing and (or) unmixing (precipitation). Methods that can be used to find ra petrologically meaningful reference axes have been summarized previously (Miesch, 1981), but they consist in general of either using compositions represented by hypothetical vectors in selected posi tions within the vector cluster, or using compositions of actual sample vectors providing that the composi tions are adequately represented in the ra-dimensional cluster. One of the reference (end-member) vectors used in the current study is an actual sample vector. The others were hypothetical, and therefore it is

GRANITIC ARCHEAN ROCKS, OWL CREEK MOUNTAINS, WYOMING
improbable that they represent the exact compositions that controlled evolution of the granite. The hypotheti cal vectors do, however, represent the types of compo sitions needed to explain the observed data.
Finally, the derived model consists of m end-member compositions, each composition represented by one of the selected reference axes, and N sets of m mixing proportions. The end-member compositions are in the metric of the original data (weight percent), and the m mixing proportions for each of the N samples sum to unity. Positive mixing proportions indicate addition of the respective end member to the compositional sys tem, whereas negative proportions indicate subtraction (fractionally crystallized solidus or residuum of frac tional fusion). Mathematical mixing of the end-member compositions in the quantities indicated by the mixing proportions yields an approximation of the original data; the closeness of the approximation for each oxide and for a given value of m is given by the factor-var iance diagram.
A Q-MODE MODEL FOR GRANITES OF THE OWL CREEK MOUNTAINS
Q-mode factor analysis was used for two different purposes. The first purpose was to identify cogenetic samples and oxides in these samples that had been little affected by postmagmatic processes. Non-cogenetic samples and oxides known to have been affected by postmagmatic events were included as a test to insure that the method correctly identified misfit data. The second purpose was to develop a petrogenetic model. It should be pointed out that end members used in the model are not unique, but are analogous to describing plagioclase compositions in terms of An5 and An95 . Such compositions would be as mathematically accurate as conventionally used end members and could be used if the true end members were unknown.
ANOMALOUS OXIDES AND SAMPLES
The total data set available for the study consisted of analyses for 37 oxides in 39 samples. Although it was known beforehand that a few of the oxide concen trations were controlled in large part by late-magmatic and weathering processes, that some of the samples were hydrothermally altered, and that others were of doubtful relation to the main bodies of granite, the en tire data set was used to derive a factor-variance dia gram. The data for the diagram (not shown) are given in table 5 and indicate that although most of the oxides can be accounted for by five or six factors, there are at least nine notable exceptions (Fe203 , FeO, H20, P205, C02, U02 , Sb203 , Cr203 and Cs20). H20 and C02 contents and the oxidation state of iron are known to
TABLE 5. Proportions of the variances of 37 oxides in 39 samples accounted for by factor 'models with 2 through 10 factors
Number of factors
Oxide 3 7 10
Si02
A1 203
Fe203FeO
MgO
CaO
Na 20
K 20
H 20
Ti02
P 2°5
C02
MnO
Rb20
BaO
SrO
Th02
U02
La20 3
Ce203
Nd 20 3
Sm203
Eu 20 3
6d 203
Tb20 3
Dy203
Tm20 3
Yb 20 3
Lu 203
Cs 20
Ta 20 5Hf02
Zr02
Sb203
Sc20 3
Cr203
CoO
0.16
.09
.08
.03
.15
.10
.08
.15
.01
.04
.00
.00
.31
.00
.58
.10
.84
.01
.74
.75
.72
.63
.20
.31
.16
.06
.01
.04
.05
.09
.21
.57
.57
.24
.15
.12
.14
0.92
.07
.43
.55
.93
.91
.30
.35
.23
.88
.08
.01
.58
.32
.62
.25
.85
.02
.78
.79
.78
.72
.73
.50
.38
.31
.25
.24
.22
.30
.39
.58
.65
.34
.89
.73
.92
0.93
.54
.53
.60
.93
.92
.64
.72
.32
.88
.38
.18
.60
.60
.66
.57
.87
.03
.79
.79
.78
.77
.77
.72
.71
.69
.74
.74
.70
.35
.39
.58
.72
.35
.92
.72
.91
0.94
.74
.60
.59
.92
.93
.89
.81
.38
.88
.41
.38
.72
.61
.66
.58
.87
.18
.85
.86
.86
.85
.79
.80
.79
.76
.77
.76
.71
.35
.53
.71
.73
.74
.92
.71
.91
0.96
.75
.61
.76
.96
.91
.89
.84
.44
.90
.63
.39
.74
.90
.72
.57
.88
.41
.87
.80
.81
.81
.78
.78
.76
.72
.78
.72
.71
.77
.75
.93
.80
.95
0.96
.82
.70
.79
.97
.90
.89
.87
.73
.90
.76
.56
.74
.91
.73
.63
.88
.44
.87
.88
.87
.86
.86
.86
.91
.94
.95
.91
.85
.79
.75
.73
.82
.77
.93
.83
.95
0.95
.83
.69
.86
.99
.90
.94
.86
.78
.92
.82
.56
.73
.91
.73
.81
.88
.74
.89
.90
.91
.92
.88
.90
.94
.95
.95
.91
.86
.81
.79
.74
.83
.80
.92
.86
.98
0.96
.83
.80
.90
.99
.98
.97
.92
.78
.93
.82
.60
.73
.92
.78
.95
.89
.82
.90
.92
.93
.93
.88
.90
.94
.95
.95
.91
.86
.94
.84
.77
.83
.80
.93
.87
.98
0.96
.88
.95
.95
.99
.99
.97
.95
.85
.94
.83
.84
.78
.92
.79
.96
.89
.85
.91
.92
.93
.94
.88
.91
.94
.95
.95
.91
.86
.94
.90
.78
.83
.81
.94
.90
.98
be strongly affected by postmagmatic processes in most igneous rocks; therefore, H20 and C02 were eliminated as variables, and ferrous and ferric iron were combined as total FeO (FeO(t)). Similarly, many of the samples used in this study either gained or lost uranium (Stuck- less and others, this volume); therefore, U02 was elimi nated from the data. Cs20 has been found to be poorly explained in at least one other study (Stuckless and Miesch, 1981) and was readily removed in leaching ex periments of the Proterozoic Sherman Granite (Zielinski and others, 1981). It is apparently also lost during devitrification of volcanic rocks (Zielinski and others, 1977). Cs20 was therefore not used in further factor analyses. Also eliminated were P205 , Sb203 , and

GEOCHEMISTRY AND PETROGENESIS
Cr203. Variations in content of these oxides are fairly well accounted for by five- and six-factor models; how ever, many of the determinations were at or slightly below the detection limits of the analytical methods.
Of the 39 samples, 14 had badness-of-fit measures that were distinctly poorer than the other 25 and were not used in derivation of the final model. For geologic reasons 12 of the 14 samples were suspected of having little or no genetic relationship to the main granite body. Samples 58392, 58398, and TDG45 are banded, mafic drill-core samples and, on the basis of the Q-mode factor analysis, are interpreted to be xenoliths of the older metamorphic sequence rather than mafic segre gates. Samples GP-2 and GP-4 are albitized and silicified-epidotized granite respectively. They have ap parently been too severely altered to preserve any rec ognizable genetic relationship to the granite. Samples DP-1, GP-1, and TDG20 are garnetiferous and show metamorphic textures; sample TD-6 is a graphic gran ite; sample TDG16 is a tourmaline-bearing granite; sample 58188 is a gneissic granite; and sample 58317 is a mineralized aplite. Samples TDG24 (the only seem ingly normal sample from the Wind River Canyon) and TDG44 (a drill-core sample for which the REE pattern is similar to that of the garnetiferous samples) were eliminated solely on the basis of factor-analysis results. The combined adjustments to the original data set re sulted in a matrix of 29 oxides by 25 samples. This matrix was used to develop the petrogenetic model.
DETERMINATION OF END MEMBERS
Although the factor-variance diagram (fig. 2) shows that three factors account for much of the variance in the 29 oxides in the 25 samples, five factors are re quired to account for the variance in some of the minor elements. (See also table 6.) The approach used was therefore to first derive a plausible three-factor (end- member) model and then refine it into the final five-fac tor model. Consequently, the sample vectors were first projected from the original 29-dimensional space (Af=29) into a three-dimensional space. The three-di mensional vector cluster is represented by the stereo- graphic projection in figure 3.
The vector configuration (fig. 3) reveals two separate compositional trends, one that extends from the upper- right portion of the diagram to the lower-central part (trend A) and the other that extends from the lower- central to the upper-left part (trend B). Judging from the differentiation indices of Thornton and Tuttle (1960) calculated for the compositions represented by the vec tors, magma evolution proceeded along trend A to wards the lower-central part of the diagram and then towards the upper left along trend B. Therefore, the composition of the initial parent material, liquid or
TABLE 6. Proportions of the variances of 29 oxides in 25 samples accounted for by factor models with 2 through 10 factors
Number of factors
Oxide 10
SiO,
A1 203
FeO(t)
MgO
CaO
Na 2 0
K 20
Ti02
MnO
Rb 20
BaO
SrO
Th02
La203
Ce203
Nd 20 3
Sm203
Eu 20 3
Gd 20 3
Tb203
Dy 203
Tm203
Yb203
Lu 20 3
Ta 20 5Hf02
Zr02
Sc 203
CoO
0.56
.69
.31
.47
.87
.84
.65
.29
.33
.47
.14
.89
.17
.02
.00
.01
.11
.37
.26
.31
.29
.41
.44
.46
.43
.06
.03
.02
.56
0.81
.70
.79
.81
.92
.88
.74
.63
.76
.68
.30
.88
.79
.92
.90
.88
.92
.62
.78
.73
.65
.63
.63
.63
.66
.60
.54
.65
.91
0.93
.90
.79
.83
.93
.89
.96
.70
.80
.78
.82
.89
.79
.92
.90
.88
.92
.68
.78
.74
.66
.64
.64
.64
.67
.60
.57
.65
.91
0.98
.92
.82
.86
.92
.92
.96
.70
.85
.86
.84
.89
.88
.96
.96
.93
.93
.80
.91
.94
.93
.92
.90
.68
.71
.64
.67
.85
.95
0.99'.93
.84
.88
.92
.92
.96
.75
.87
.88
.84
.90
.88
.96
.95
.93
.93
.79
.92
.94
.93
.91
.90
.88
.75
.91
.71
.84
.96
0.99
.93
.95
.88
.93
.94
.97
.91
.87
.89
.91
.89
.90
.97
.98
.95
.94
.87
.92
.95
.96
.96
.95
.95
.86
.92
.82
.91
.96
0.99
.95
.98
.89
.95
.97
.97
.91
.87
.96
.91
.90
.90
.97
.98
.96
.95
.88
.94
.96
.96
.96
.96
.95
.93
.95
.91
.95
.96
0.99
.95
.99
.89
.98
.97
.97
.97
.88
.97
.94
.90
.94
.98
.99
.99
.98
.91
.95
.97
.97
.96
.96
.95
.93
.97
.94
.95
.97
0.99
.98
.99
.91
.98
.98
.97
.97
.89
.97
.94
.92
.94
.98
.99
.99
.98
.95
.95
.97
.97
.96
.96
.95
.96
.98
.99
.95
.97
solid, is probably represented best by a vector near the upper-right portion of trend A, possibly near the vector that represents sample 29394 (13c on fig. 3), which has the lowest differentiation index of all 25 sam ples.
Compositional changes along trend A could have re sulted by subtraction of a primary solid (S) from the parent material (L). Possible compositions of this solid can be represented by vectors near the intersection of trend A with the dashed line (fig. 3) that outlines the area of entirely positive compositions. If the parent ma terial were a liquid, the material would have had to have been subtracted by fractional crystallization and settling, but if the parent material were solid crust, then the subtraction could have been by partial fusion and residual accumulation of more mafic phases. The mathematical model provides no means for distinguish ing between these two possible processes. In either case, differentiation could have proceeded along trend A until a liquid evolved with a composition near that of a vector at the intersection of trends A and B.
Differentiation along trend B could have been

PR
OP
OR
TIO
N O
F V
AR
IAN
CE
AC
CO
UN
TE
D F
OR
*t
I
o O K O O c-1
o o g % C

GEOCHEMISTRY AND PETROGENESIS 11
brought about by fractional crystallization of this liquid and separation of a material for which the composition would be like that of sample GP-5 represented by the vector S3 on figure 3. Sample GP-5 has a low REE content and a strongly positive europium anomaly (fig. 4) and may represent a cumulate from the magma.
The three-end-member process just outlined accounts for the observed compositional data to the degree indi cated in the factor-variance diagram (fig. 2) for a three- factor model. In order to account for some of the minor oxide constituents, however, two additional end mem bers must be used. Inasmuch as the three-end-member process accounts for the observed data in at least a
general way, we decided to derive the two additional end members by simply modifying the three-end-mem ber model. The most realistic modification that could be introduced was to allow some variability in the com positions of the initial parent material (L), liquid or solid, and in the compositions of the materials sepa rated from it (S). The vector representing the parent material (L) was then replaced by vectors L^ and L2 , which represent two extremes in a range of parent ma terials. The vector representing the material sub tracted from the parent material (S) was replaced by vectors Si and 82, which represent the extremes in a range of separated materials. (For illustration purposes
FIGURE 3. Stereographic projection of the three-factor Q-mode vector solution derived from the data for 29 oxides in 25 samples from the Owl Creek Mountains. The dashed line outlines the area within which the vectors represent compositions that are entirely positive. Also shown are the projected positions for the starting liquids (L! and L.2), the initial crystallizing solids (Si and 82), and the final crystallizing solid (83). Samples are identified by Plot I.D. (table 1 and fig. 1).

12 GRANITIC ARCHEAN ROCKS, OWL CREEK MOUNTAINS, WYOMING
500
100
50
10
500
100
50
10
D
La Ce Nd Sm Eu Gd Tb Dy Tm Yb Lu La Ce
REE ATOMIC NUMBER
Nd Sm Eu Gd Tb Dy Tm Yb Lu
FIGURE 4. Chondrite-normalized, rare-earth-element diagrams for the 25 granite samples used in the factor analysis. Diagrams A and B show the patterns of trend A (fig. 2): A, steep patterns with little or no europium anomaly (samples 41591, DP-3, DP-2, 30511, 30501, and 32466), and B, steep patterns with minor europium anomalies (23432, TDG46, 41596, 32496, 39294, and 39467, and DP-8). Diagrams C and D show patterns of trend B (fig. 2): C, strongly positive through weakly negative europium anomalies (GP-5, TDG47, 58180, 58-80, 58-98, and 58-66), and D, moderately to strongly negative europium anomalies (4343, TDG13, TDG12, TDG21, TD22, and GP-3).
GEOCHEMISTRY AND PETROGENESIS 13
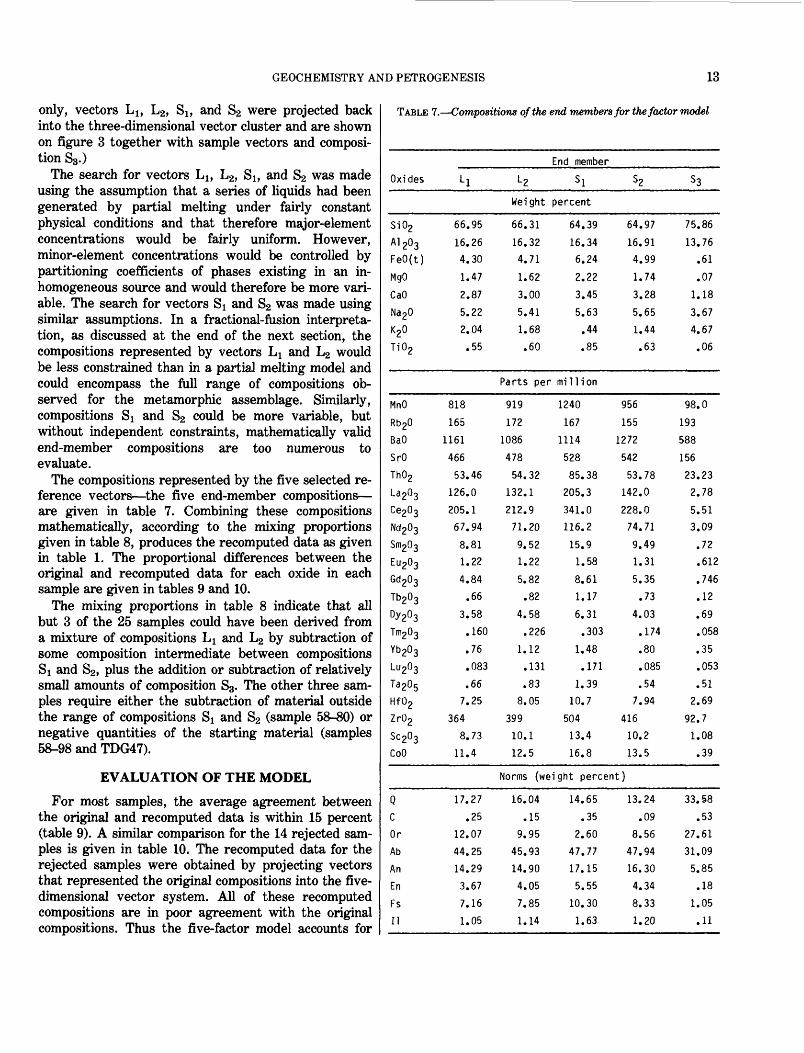
only, vectors L x , L2 , Si, and S2 were projected back into the three-dimensional vector cluster and are shown on figure 3 together with sample vectors and composi tion S3.)
The search for vectors LI, L2, Si, and S2 was made using the assumption that a series of liquids had been generated by partial melting under fairly constant physical conditions and that therefore major-element concentrations would be fairly uniform. However, minor-element concentrations would be controlled by partitioning coefficients of phases existing in an in- homogeneous source and would therefore be more vari able. The search for vectors Si and S2 was made using similar assumptions. In a fractional-fusion interpreta tion, as discussed at the end of the next section, the compositions represented by vectors LI and L2 would be less constrained than in a partial melting model and could encompass the full range of compositions ob served for the metamorphic assemblage. Similarly, compositions Si and 82 could be more variable, but without independent constraints, mathematically valid end-member compositions are too numerous to evaluate.
The compositions represented by the five selected re ference vectors the five end-member compositions are given in table 7. Combining these compositions mathematically, according to the mixing proportions given in table 8, produces the recomputed data as given in table 1. The proportional differences between the original and recomputed data for each oxide in each sample are given in tables 9 and 10.
The mixing proportions in table 8 indicate that all but 3 of the 25 samples could have been derived from a mixture of compositions LI and L2 by subtraction of some composition intermediate between compositions Si and 82, plus the addition or subtraction of relatively small amounts of composition S3. The other three sam ples require either the subtraction of material outside the range of compositions Si and S2 (sample 58-30) or negative quantities of the starting material (samples 58-98 and TDG47).
EVALUATION OF THE MODEL
For most samples, the average agreement between the original and recomputed data is within 15 percent (table 9). A similar comparison for the 14 rejected sam ples is given in table 10. The recomputed data for the rejected samples were obtained by projecting vectors that represented the original compositions into the five- dimensional vector system. All of these recomputed compositions are in poor agreement with the original compositions. Thus the five-factor model accounts for
TABLE 7. Compositions of the end members for the factor model
End memberOxides L l L 2 Si S2 S3
Weight percent
Si02A1 20 3FeO(t)
MgO
CaONa 2 0K20Ti0 2
MnO
Rb 20BaO
SrOTh0 2
La 2 0 3Ce2 0 3
Nd 2 0 3Sm2 0 3
Eu 2 0 3Gd 2 0 3
Tb 2 0 3Dy 2 0 3
Tm2 0 3
Yb 20 3
Lu 2 0 3
Ta 20 5Hf0 2
Zr02
Sc 2 0 3CoO
66.95
16.264.30
1.47
2.875.222.04.55
818
1651161
46653.46
126.0
205.167.94
8.811.22
4.84.66
3.58.160
.76
.083
.667.25
3648.73
11.4
66.31
16.324.71
1.62
3.005.411.68.60
Parts per
919
1721086
47854.32
132.1212.971.20
9.521.22
5.82.82
4.58.226
1.12.131.83
8.05
39910.112.5
64.39
16.346.24
2.223.45
5.63.44.85
million
1240
1671114
528
85.38205.3
341.0116.2
15.91.58
8.611.17
6.31.303
1.48.171
1.3910.7
50413.416.8
64.97
16.914.991.74
3.28
5.651.44.63
956
1551272
54253.78
142.0
228.074.71
9.491.31
5.35.73
4.03.174
.80
.085
.547.94
41610.213.5
75.86
13.76.61
.071.18
3.674.67.06
98.0
193588
15623.232.78
5.513.09
.72
.612
.746
.12
.69
.058
.35
.053
.512.69
92.71.08.39
Norms (weight percent)
QCOrAbAnEnFs11
17.27.25
12.0744.2514.293.677.161.05
16.04.15
9.9545.9314.904.057.851.14
14.65.35
2.6047.7717.155.55
10.301.63
13.24.09
8.5647.9416.304.348.331.20
33.58.53
27.6131.095.85.18
1.05.11

14 GRANITIC ARCHEAN ROCKS, OWL CREEK MOUNTAINS, WYOMING
TABLE 8. Mixing proportions for the factor model
End member
Sample
DP-323432293942946730501
3051132466324964159141596
DP-8DP-2TDG4658-66GP-3
GP-54343TDG12TD-13TDG21
TD225818058-8058-98TDG47
4.91931.9963
.0782
.45171.8175
1.6091844996784510
3.8435
2.63324.6932
.00012.8789
27.5097
.000017.218413.756115.952916.6719
15.00545.3650
.1490-3.7071-5.3798
0.8773.8379.0645
1.3172.5829
.0000
.96781.8039
.3367
.9832
3.89471.54431.12581.8496
14.6323
-.0000 4.4041 6.0112
-0.7261-.5650
.2909-.3913-.2887
-.0443-.8382-.8156-.2966-.9080
-1,
-6
,19089658,00004870,1028
-3.6972-1.5585
.0000-.7226
-1.4031
-.9482-2.8440-2.9294-1.6225-2.9256
-4.0625-3.9800-.9262
-3.5200-28.8249
.4194
.6296
.0000 -.0000-2.2856 -15.3472-2.5642 -13.6872-2.5629 -14.9546-2.9129 -15.3889
-0.3733 .2892 .5663 .3451 .2914
.3833-.1305-.0267
.1315
.0069
-.2747-.2918
.8003
.2786-6.2143
1.00009896516085489997
4.12471.5566
.1230-.6311-.6756
-2.1754-.2858
.6220
.98661.6794
-13.5233-5.4684 -.9745 2.4947 3.1401
-2 4316 -.1673 1.0805 1.8570 2.2358
most of the variance in all of the 25 samples and dis criminates against altered and unrelated samples.
The five-factor model also accounts for more than 64 percent of the variance in all 29 oxides used and more than 80 percent of the variance in all but four oxides (table 5 and fig. 2). All four of the oxides that show low percentages of variance accounted for are sus pected to have large analytical errors relative to geologic variation and are therefore poorly explained.
Standard petrologic diagrams and isotopic data can be used to evaluate the petrogenetic model. The pro nounced break in differentiation trend indicated by Q- mode factor analysis suggests a marked change in phys ical conditions during crystallization. A different crys tallization pressure for samples from trends A and B is suggested by a plot of the normative data in both the Q-Ab-Or (fig. 5) and the An-Ab-Or systems (fig. 6). If the whole-rock compositions are interpreted as equilibrium liquids, both ternary systems indicate crys tallization at lower water pressure for trend B.
Three samples (58-80, 58-98, and TDG47) that plot near the junction of trends A and B (fig. 3, points lOb, lOc, and lla) and that are not explained by the pe trologic model as simple differentiates plot as a group above the polybaric minimum (fig. 5). These composi
tions cannot be derived by equilibrium crystal frac- tionation if a probable starting liquid from trend A is assumed as parental to these samples. The position of these data points on figure 5 is probably due to a small amount of alteration during which potassium was lost, or quartz and albite were gained. Because the shift from a probable equilibrium liquid is small and may only involve a few elements, these samples still fit the five-factor model reasonably well (that is, the average difference between the original and recomputed data is less than 15 percent).
The interpretation of the five-factor model reveals a surprising relationship to oxygen isotopic data, even though these data were not used in the development of the model. Figure 7 shows a plot of whole-rock 8180 values versus percent of composition LI in the total starting material (lOOL^I^+Lg) for each sample. The very good correlation between these two variables for all but three samples suggests that the starting magma is well represented by a mixture of two materials. A similar correspondence between oxygen isotopic and elemental compositions has been noted for the Carbon iferous Elberton Granite, Georgia (Wenner, 1980). However, in that granite the trace-element and oxygen isotopic data yield a geographic pattern that is inter preted to reflect a similar pattern in the protolith. No geographic pattern is noted for the granite of the Owl Creek Mountains. However, if the protolith for the granite is as lithologically complex as the metamorphic sequence intruded by the granite, a simple geographic pattern for variables that preserve a protolith imprint would be unlikely.
Although the interpretation of the five-factor model is reasonable in light of petrologic data, the same end members could be interpreted differently. The data permit the generation of trend A as a series of frac tional melts. In this interpretation, end members Lj and L2 would represent a series of protolith composi tions and end members Si and S2 would represent a series of residuum compositions. In the alternate hypothesis, the difference in pressures suggested for trends A and B represents derivation at an inter mediate pressure followed by differentiation at a slightly lower pressure. The generation of trend A by fractional fusion would also account for the correlation between starting liquid compositions and 8180 values.
PROTOLITH CONSIDERATIONSThe wide range of 8180 values, which appears to be
a primary magmatic feature; the apparent range in in itial ^Sr/^Sr ratios (Hedge and others, this volume) and 2°8pb/204Pb ratiog (gtuckless and others, this vol-

GEOCHEMISTRY AND PETROGENESIS
Q
15
FIGURE 5. Normative data for quartz, albite, and orthoclase for granite samples from the Owl Creek Mountains, Wyo. Trend-A samples indicated by circles; trend-B samples indicated by squares; polybaric, water-saturated minimum (Tuttle and Bowen, 1958; Luth and others, 1964) indicated by solid dots. The expanded portion of the diagram (shown on the inset) is bounded by quartz 25 to 60 percent, albite 20 to 55 percent, and orthoclase 20 to 55 percent.
ume); and the correlation of these variables with one another all suggest that the magma genesis involved some sort of mixing process that did not proceed to homogenization. Although the isotopic data could be explained by assimilation and contamination of a homogeneous magma, chemical data favor derivation from a heterogeneous protolith. This conclusion is based on the facts that the samples from trend A indi cate a higher pressure history than those from trend B and that samples from trend A exhibit the entire range of 8180 values. Furthermore, the samples from trend A are less evolved than those of trend B. In con trast, a contamination-assimilation model would most reasonably predict increasing contamination with in creasing degree of magma evolution and increasing con tamination with decreasing pressure because assimila
tion is most likely to occur during intrusion or final crystallization. Thus the isotopic data seem to reflect protolithic characteristics, which became primary fea tures of the initial magma.
Oxygen isotope data provide some constraints on the nature of the protolith. Few 8180 values are greater than 8.0 per mil (table 4), which by comparison to Pa leozoic source regions suggests a low pelitic component in the protolith (O'Neil and Chappell, 1977). This sug gestion is supported by both the low values for norma tive corundum (generally less than 1.1 percent, table 1) and the low pelitic component in the metamorphic complex intruded by the granite (Hamil, 1971). The few metamorphic rocks analyzed yield low 8180 values (table 4, samples with prefix DKCH). The isotopic frac tion for oxygen at the temperature required for granite

16 GRANITIC ARCHEAN ROCKS, OWL CREEK MOUNTAINS, WYOMING
TABLE 9. Proportional differences between the original chemical data and the data represented by the factor solution for the 25 samplesused to develop the solution
[Average is the average of the absolute values]
Sample No.
Si02
A1 203
FeO(t)
MgO
CaO
Na 20
K20
Ti02
MnO
Rb20
BaO
SrO
Th02
La 203
Ce203
Nd 203
Sm20 3
Eu 203
Gd 20 3
Tb203
Dy20 3
Tm203
Yb20 3
Lu 20 3
Ta 20 5
Hf02
Zr02
Sc 20 3CoO
Average:
DP-3
0.00
.01
.00
.29
.10
.03-.11
.18
.02
.03
.18
.15
.06
.06
.16
.04
.03
.19
.24
.19
.20
.29
.36
.40
.62
.01
.09
.01
.20
.14
23432
0.01-.01
.09-.25
-.17
.00-.02
.10-.03
-.04
.02
.00
.04-.15
-.10
-.18
-.18
-.09
-.46
-.46
-.44
-.18
-.09
-.03
-.21
.14
.17-.01
-.11
.13
29394
0.00
.00
.04
.10
.02-.03
.06-.09
.00
.15-.18
-.10
.06
.04
.01-.04
-.12
.01-.08
-.07
-.09
.01
.05
.05-.16
-.20
.04-.07
.07
.07
29467
0.00
.00
.04
.10-.01
-.06
.05
.04
.02
.12-.11
-.07
-.08
-.18
-.13
-.08
-.02
.00
.12
.02-.06
-.22
-.30
-.25
-.08
-.10
-.09
-.12
-.01
.09
30501
0.00
-.01
-.02
.18
.00-.02
-.01
.06-.08
.08
.00
.11
.10
.06
.02
.01
.00-.05
-.31
-.19
-.10
.10
.12
.17
.23-.12
-.05
.20
.12
.09
30511
0.00
-.01
.04
.03
.05-.01
.02-.02
-.22
.04-.06
.08
.04
.09
.04
.02-.04
-.01
-.12
.00
.07
.08
.13
.06-.75
-.06
.13
.01
.07
.08
32466
0.00-.01
.04-.35
.01
.02-.04
.02-.24
-.13
.02-.05
-.11
.01-.07
.06
.11-.16
.12
.09
.00-.28
-.30
-.37
-.85
-.01
.00-.01
-.24
.13
32496
0.00-.01
.01-.53
.07
.03
.02-.03
.17
.02-.05
.02-.04
.11
.13
.13-.02
-.11
.00-.03
-.06
-.12
-.12
-.04
-.01
.04
.07-.15
-.21
.08
41591
-0.01
.01
.00
.04
.07
.02
.03
.03
.12
.10
.00
.04-.09
.13
.07
.08
.01
.10
.03
.10
.16
.14
.14
.17
.25
.07-.14
-.09
.08
.08
41596
0.00-.02
.20
.11-.02
-.05
.01-.42
.23
.01-.01
.24-.02
-.06
-.05
.04
.28
-.04
.26
.22
.21
.13
.00-.12
-.98
-.23
-.10
-.40
.04
.15
DP-8
0.00
.03-.45
-.24
-.14
.07-.02
.07
.00-.20
.07
-.07
.09-.14
.07
.16
.26
.08
.13
.14
.12
.01
.00-.04
-.43
-.20
-.21
.24-.16
.13
DP-2
0.00
.00-.32
-.07
.00
.03
.01
.17-.10
-.22
.13
-.16
-.05
-.13
-.08
.05-.03
.05
.07
.11
.12
.03
.06
-.06
-.21
.18-.02
.08-.02
.09
TDG46
0.00-.01
.22
.09-.17
-.02
-.02
-1.18
.01-.06
.07-.23
.10-.58
-.91
-.63
-.34
-.03
-.49
-.48
-.37
-.17
-.14
-.11
-.36
.34-.05
-.21
.00
.26
melting is expected to be small (O'Neil and others, 1977), such that the melt fraction should have the same or slightly greater 8180 values than the source rock. Thus, at least a part of the exposed metamorphic com plex could be similar to one end member in the pro- tolith.
Either a fractional-crystallization or fractional-fusion interpretation as an explanation for trend A (fig. 3) can provide constraints on magma genesis because both in terpretations indicate a starting liquid that can be used to estimate a minimum pressure for magma genesis.
A unique starting liquid (or series of liquids) cannot be defined in a fractional crystallization interpretation, but presumably a series of liquids could have been found that included the composition of the least evolved sample (29394). In a fractional-fusion interpretation, this sample and others along trend A suggest a mini mum pressure of 3 kb and approximately water-satu rated conditions (fig. 5). A pressure of 3 kb and a tem perature near that required for granite melting ap proach conditions indicated by the grade of metamor- phism observed for the volcanic-sedimentary sequence.

GEOCHEMISTRY AND PETROGENESIS 17
TABLE 9. Proportional differences between the original chemical data and the data represented by the factor solution forthe 25 samples used to develop the solution Continued
Sample No. 58-66 58-80 58-98 GP-3 GP-5 4343 TDG12 TD-13 TOG21 TD22 TDG47 58180
Si02 0.00 0.01 0.00 0.00 0.00 0.00 0.00 0.00 0.00 0.00 0.00 0.00
A1 2 0 3 -.02 .00 .02 -.02 .03
FeO(t) .29 -.35 -.16 -.19 -1.06 -
MgO .46 .26 -.36 .63 .27
CaO -.06 .08 -.02 .73 .15
Na 2 0 .00 .00 .02 -.09 .00
K 20 .05 -.07 -.01 .03 .00
Ti02 .27 -.31 .05 .41 -.13 -
MnO .16 -.61 -.35 -.72 -.03
Rb20 .12 .04 -.03 .08 .05
BaO -.06 .04 -.22 .10 -.06
SrO .06 .14 -.12 .91 -.28
Th02 .10 -.22 .02 .02 -.10
La 203 -.14 .11 .03 .19 .55
Ce203 -.22 .18 .14 .18 .50
Nd 2 03 -.18 .25 .04 .17 .19
Sm2 03 -.17 .16 .07 .06 -.09
Eu 2 0 3 .01 .05 -.13 .09 .16
Gd 2 03 -.09 .12 -.11 .07 -.08
Tb 2 0 3 -.06 .11 -.18 .12 .07
Dy 2 03 -.01 .13 -.21 .14 .13
Tm 2 03 .04 .05 -.18 .17 .17
Yb 2 03 .03 .06 -.19 .17 .20
Lu 2 0 3 -.04 .09 -.25 .19 .25
Ta2 05 .07 -.31 -.17 .14 .47
Hf02 -.51 .02 .06 .13 .00
Zr02 -.15 .22 .16 .26 .08
Sc203 .11 -.01 .11 -.03 .07
CoO .79 .18 -.31 .46 .01
Average: .15 .14 .13 .22 .18
MAGMA GENESIS
The initial liquids from which the granite may havebeen derived were probably formed at approximately3 kb pressure and near water-saturated conditions. (Asomewhat higher pressure would be possible for a fractional-crystallization interpretation because of the unconstrained composition of the initial liquids.) The pro-tolith was heterogeneous in composition, most likelysimilar to the observed metamorphic sequence, but ata greater depth than currently exposed. Metamorphism
.02 -.01 .01 .02 .01 -.01 -.02
-.20 .25 -.10 .07 .11 .20 -.35
-.52 -.53 -.17 .32 -.16 -.14 .03
.18 .07 -.08 -.21 -.33 .02 -.08
.00 -.10 .05 .05 .04 -.01 -.04
.00 .03 -.02 -.08 .02 -.01 .07
-.11 -.27 -.32 -.11 -.50 -.17 .54
.04 .21 .12 -.05 -.26 .15 .26
.00 .08 -.02 -.01 -.16 -.13 .01
.04 -.23 -.11 .03 -.16 .23 .20
.05 -.23 -.18 -.31 -.28 .21 .20
-.01 -.38 -.01 .13 -.02 .00 .14
.01 .00 -.03 .08 -.28 .00 .04
.08 -.10 .01 .02 -.25 -.05 -.03
.17 -.11 -.05 -.10 -.17 -.04 -.17
.19 -.05 -.02 -.15 -.05 .05 -.23
.18 .02 -.13 -.14 -.13 -.01 .01
-.18 -.05 .01 -.11 .15 .16 -.07
-.02 -.11 -.09 -.10 .05 .14 .02
.11 -.16 -.17 -.09 -.06 .09 .05
.17 -.25 -.20 .09 -.46 .09 .11
.19 -.26 -.22 .10 -.65 .03 .15
.21 -.33 -.28 .15 -.75 .03 .20
-.09 .20 .07 -.10 -1.20 -.14 .39
.18 -.11 -.05 .00 -.10 -.07 -.06
.29 .01 .04 -.57 -.67 -.51 .08
.15 -.21 .07 -.08 -.03 -.29 .20
-.13 -.02 -.39 .07 -.02 -.10 -.19
.12 .15 .10 .11 .25 .10 .13
apparently predates granite intrusion (Mueller andothers, 1981; Hedge and others, this volume). Therefore at the time of intrusion, the currently exposedmetamorphic rocks were probably under less pressurethan that indicated by maximum metamorphic grade.Thus for a fractional-crystallization interpretation, thecompositional variations along trend A would be theresult of differentiation prior to intrusion. Followingthe generation of the compositions along trend A (byeither fractional crystallization or fractional fusion), themagma was intruded to its current level of exposure,

18 GRANITIC ARCHEAN ROCKS, OWL CREEK MOUNTAINS, WYOMING
TABLE 10. Proportional differences between the original chemical data and the data represented by the factor solution, for the 14 samplesnot used to develop the solution
[Average is the average of the absolute values. Leaders (--) indicate indeterminate value due to division by zero]
Sample No. 58188 58317 58392 58398 DP-1 GP-1 GP-2 GP-4 TD-6 TDG16 TDG20 TDG24 TDG44 TDG45
Si0 2 0.01 -0.01 0.83 38.16 -0.01 -0.02 -0.06 -0.03 -0.03 -0.01 -0.02 -0.01 -0.01 -2.85
A1 20 3 -.03 .02 -1.14 -37.17 .05 .13 .23 .15 .02 .05 .10 .03 -.01 2.35
FeO(t) .01 .08 -1.56 -80.35 -.28 .53 -1.76 -.88 .79 .12 .02 .18 .31 4.57
MgO .33 .58 -.48 -40.09 -1.13 5.93 -4.89 -1.73 8.01 -.22 -3.14 .05 .89 4.60 CaO .30 .17 -.95 -56.93 -.31 -.32 -9.36 .66 -4.83 -.16 -1.96 -.46 -.06 3.53
Na 20 -.37 .06 -8.17 -197.68 .16 .50 .59 -.33 -.21 .10 .16 .11 -.31 18.72
K 20 -.09 .02 24.16 517.33 .02 -1.53 -12.58 -5.81 .17 -.09 .00 .01 .12 -75.60 Ti02 .00 -.01 -1.65 -113.60 -1.00 4.83 -1.19 13.36 -2.07 -6.85 -.73 .78 6.70
MnO -.26 -.53 -3.06 -111.20 .00 .98 .76 -1.80 2.25 -1.11 .88 -1.01 .77 6.11
Rb 20 -.06 .10 8.27 79.39 .05 .60 -7.77 -2.79 .46 -.43 .34 -.24 .36 -30.78
BaO .12 -1.28 .62 19.96 -7.18 -2.70 -63.60 -2.91 -5.02 -1.61 -2.34 -.65 -.21 -17.03
SrO -.10 -.31 11.28 -414.84 -10.24 -.43 -21.80 .59 -.59 -1.43 -4.66 -1.33 .73 32.63
Th0 2 -.27 .19 19.11 994.57 -.50 -4.34 -1.44 .68 -8.84 -1.11 -1.92 -.41 .08 -53.95 La 2 0 3 -.53 2.21 -38.38 >999.99 4.22 3.19 34.08 .66 6.50 5.51 -.08 .56 1.07 85.39
Ce20 3 -.23 1.84 -22.43 -685.59 4.35 .71 29.10 .88 4.23 7.59 .75 .58 .95 47.89 Nd 2 0 3 -.14 .74 -12.66 -386.18 3.43 -.28 12.14 .87 2.61 4.98 -.59 .44 .40 27.39
Sm 20 3 .26 .12 -5.04 -207.82 1.45 -1.15 3.70 .92 -.28 1.67 -2.86 .19 -.50 14.55 Eu 20 3 -.36 -.13 -1.77 -44.67 -6.64 -7.59 -10.83 -.68 -.27 -1.05 -2.98 -.77 .21 4.27
Gd 20 3 -.24 -.14 -7.30 -326.26 -.90 -1.14 -2.53 .51 -1.35 -.50 -3.71 -.09 -1.14 19.25 Tb 20 3 -.27 -.06 -6.74 -283.64 -1.09 -.97 -2.85 .54 -.94 -.18 -1.61 -.18 -.81 18.47 Dy 20 3 -.48 .05 -6.76 -265.09 -1.08 -.73 -2.88 .53 -.77 .02 -1.41 -.18 -.54 17.94
Tm20 3 -.07 .15 -3.51 -141.29 -1.00 -.49 -2.32 .65 -.63 .16 -1.02 -.38 .26 10.40
Yb 20 3 .18 .21 -2.52 -110.61 -.89 -.50 -1.92 .70 -.49 .24 -.79 -.45 .41 8.19 Lu 2 0 3 .37 .24 -1.61 -87.01 -.68 -.49 -1.69 .74 -.37 .29 -.64 -.53 .54 6.56
Ta 20 5 1.12 -.07 10.98 73.88 -1.10 .97 .98 1.03 .20 -.50 .91 -.32 .73 -9.18 Hf0 2 -.36 -.49 -12.37 -551.06 -.05 -1.44 -.18 .17 -10.81 -3.76 .04 -.65 -.22 29.34
Zr0 2 -.24 -.39 -13.15 -637.81 -.37 -1.24 -1.22 .10 -2.59 -1.04 -1.20 -7.19 -4.93 85.80 Sc 2 0 3 .07 -.78 -.82 -33.63 -1.15 -.60 -35.63 .14 -2.16 -1.02 -9.41 .04 .36 3.27 CoO .09 .83 -.33 -49.25 -5.29 7.81 -17.00 -3.45 4.89 .63 -.58 -.18 .95 4.62
Average: .24 .41 7.86 271.11 1.90 1.78 9.87 1.11 2.89 1.30 1.75 .62 .64 22.48
where pressure may have been as low as 0.5-1.0 kb (fig. 5), and compositions along trend B were generated by the separation of the feldspar-dominated solid (S3). Compositions along trend A were modified by minor addition or subtraction of this solid. Minor modifications of some sample compositions may have occurred as a result of deuteric or post-crystallization hydrothermal alteration. Such alterations may explain the 2-20 per cent of the variance in the oxides not accounted for by the five-factor solution (table 6) and are supported by isotopic data in the rubidium-strontium and thorium- lead systems (Hedge and others, this volume; Stuckless and others, this volume).
SUMMARY AND CONCLUSIONS
Q-mode factor analysis has been used to identify 25 granitic samples from the Owl Creek Mountains, Wyo., for which 29 oxide variables can be well represented by a five-factor model. The five-factor model serves to identify samples of doubtful geologic relation to the main granite intrusion, including suspected xenoliths and rocks that have been strongly affected by hydro- thermal alteration. The model also identifies oxide vari ables (H20, C02, U02 , Cs20, and the oxidation state of iron) that have been controlled in large part by post- magmatic effects. The model presented here explains

GEOCHEMISTRY AND PETROGENESIS 19
more than 80 percent of the observed variance for 25 of the 29 oxides (table 6) and yields excellent agree ment between recomputed and original (adjusted to 100 percent) compositions for all 25 samples.
End members that provide an explanation for the ob served compositional variations were identified within the five-dimensional space defined by the sample com positions. These end members can be used in either a purely fractional-crystallization interpretation or a fractional-fusion and fractional-crystallization interpre tation. According to either interpretation, the protolith is similar to the inhomogeneous metamorphic sequence that the granite intrudes, and the final compositions reflect a polybaric history. Both interpretations can also be reconciled with the wide range of whole-rock 8180 values (6.9-8.6).
Two of the five end members in the model represent either the extremes in a range of starting liquids gener ated at a pressure equal to or greater than 3 kb, or the extremes in a series of protolith compositions. Two additional end members may represent either the ex tremes in a series of early separated solids at a pres sure of approximately 3 kb, or the extremes in a series of residuum compositions from fractional fusion. The fifth end member is a feldspar-dominated solid that is either subtracted or added to account for minor varia tions in the least evolved compositions and major varia tions along a second trend defined by the most evolved compositions. This solid is interpreted to have crystal lized at pressures of approximately 1.0-0.5 kb. The five- end-member model and the selected end members do not explain all of the observed variances in the 29
FIGURE 6. Normative An-Ab-Or for granites from the Owl Creek Mountains, Wyo. Samples of trend A are shown by circles; samples of trend B shown by squares; 2- and 8-kb eutectic curves from Whitney (1975). The expanded portion of the diagram (shown on the inset) is bounded by anorthite 0 to 45 percent, albite 30 to 75 percent, and orthoclase 25 to 70 percent.

20 GRANITIC ARCHEAN ROCKS, OWL CREEK MOUNTAINS, WYOMING
8.8
8.4
8.0
7.6
7.2
6.8
13bo
20 40 60 80
PERCENT L! IN STARTING LIQUID
100
FIGURE 7. Plot of whole-rock 8180 values versus percent of end member LI in the total starting material. The best-fit line showing data correlation was determined using data points plotted as solid dots.
oxides. Although analytical error may account for some of the unexplained variance, hydrothermal or deuteric alteration probably redistributed some elements to a small extent such that variance within the data set is no longer purely magmatic.
REFERENCES
Bramlett, L. B., Reyher, S. L., and Southard, G. G., 1982, Uranium geology and geochemistry, Copper Mountain, Wyoming: Transac tions of the American Institute of Mining Engineers, v. 272, p. 1891-1901.
Bunker, C. M., and Bush, C. A., 1966, Uranium, thorium, and radi um analyses by gamma-ray spectrometry (0.184-0.352 million electron volts), in Geological Survey Research 1966: U.S. Geological Survey Professional Paper 550-B, p. B176-B181.
Condie, K. C., 1967, Petrologic reconnaissance of the Precambrian rocks in Wind River Canyon, central Owl Creek Mountains, Wyoming: University of Wyoming Contributions to Geology, v. 6, p. 123-129.
Condie, K. C., Leech, A. P., and Baadsgaard, H., 1969, Potassium- argon ages of Precambrian mafic dikes in Wyoming: Geological Society of America Bulletin, v. 80, p. 899-906.
Evensen, N. M., Hamilton, P. J., and O'Nions, R. K., 1978, Rare earth abundances in chondritic meteorites: Geochimica et Cos- mochimica Acta, v. 42, p. 1199-1212.
Giletti, B. J., and Cast, P. W., 1961, Absolute age of Precambrian rocks in Wyoming and Montana, in Kulp, J. L., ed., Geochronol- ogy of rock systems: Annals of the New York Academy of Sci ences, v. 91, p. 454-458.
Gordon, G. E., Randle, K., Goles, G., Corliss, J., Beeson, M., and Oxley, S., 1968, Instrumental activation analysis of standard rocks with high resolution gamma-ray detectors: Geochimica et Cosmochimica Acta, v. 32, p. 369-396.
Hamil, M. M., 1971, Metamorphic and structural environment of Cop per Mountain, Wyoming: Columbia, Mo., University of Missouri Ph.D. thesis, 121 p.
Keefer, W. R., and Love, J. D., 1963, Laramide vertical movements in central Wyoming: University of Wyoming Contributions to Geology, v. 2, p. 47-56.
Ludwig, K. R., 1978, Uranium daughter migration and U-Pb isotope apparent ages of uranium ores, Shirley Basin, Wyoming: Economic Geology, v. 73, p. 29-49.
1979, Age of uranium mineralization in the Gas Hills and Crooks Gap districts, Wyoming, as indicated by U-Pb isotope apparent ages: Economic Geology, v. 74, p. 1654-1668.
Luth, W. C., Jahns, R. H., and Tuttle, 0. F., 1964, The granite system at pressures of 4 to 10 kilobars: Journal of Geophysical Research, v. 69, p. 759-773.
Miesch, A. T., 1976a, Interactive computer programs for petrologic modeling with extended Q-mode factor analysis: Computers and Geosciences, v. 2, p. 439-492.
1976b, Q-mode factor analysis of geochemical and petrologic data matrices with constant row-sums: U.S. Geological Survey Professional Paper 574-G, 47 p.
-1981, Computer methods for geochemical and petrologic mixing problems, in Merriam, D. F., ed., Computer applications in the earth sciences: New York, Plenum Publishing Corporation, p. 243-265.
Millard, H. T., Jr., 1976, Determinations of uranium and thorium in USGS standard rocks by the delayed neutron technique: U.S. Geological Survey Professional Paper 840, p. 61-65.
Mueller, P., Peterman, Z. E., and Granath, J., 1981, An Archean bimodal volcanic series, Owl Creek Mountains, Wyoming: Geological Society of America Abstracts with Programs, v. 13, p. 515-516.
Nkomo, I. T., Rosholt, J. N., and Dooley, J. R., Jr., 1979, U-Th-Pb systematics in surface and drill core samples of a Precambrian basement rock from Laramie, Wyoming: Earth Science Bulletin, v. 12, p. 1-14.
Nkomo, I. T., Stuckless, J. S., Thaden, R. E., and Rosholt, J. N., 1978, Petrology and uranium mobility of an early Precambrian granite from the Owl Creek Mountains, Wyoming: Wyoming Geological Association Guidebook, 30th annual field conference, p. 335-348.
O'Neil, J. R., and Chappell, B. W., 1977, Oxygen and hydrogen isotope relations in the Berridal batholith: Journal of the Geologi cal Society of London, v. 133, p. 559-571.
O'Neil, J. R., Shaw, S. E., and Flood, R. H., 1977, Oxygen and hydrogen isotope compositions as indicators of granite genesis in the New England Batholith, Australia: Contributions to Mineralogy and Petrology, v. 62, p. 313-328.
Peck, L. C., 1964, Systematic analysis of silicates: U.S. Geological Survey Bulletin 1170, 89 p.
Rosholt, J. N., and Bartel, J. A., 1969, Uranium, thorium and lead systematics in the Granite Mountains, Wyoming: Earth and Planetary Science Letters, v. 7, p. 141-147.
Rosholt, J. N., Zartman, R. E., and Nkomo, I. T., 1973, Lead isotope systematics and uranium depletion in the Granite Moun tains, Wyoming: Geological Society of America Bulletin, v. 84, p. 989-1002.
Seeland, D. A., 1976, Relationship between early Tertiary sedimenta tion patterns and uranium mineralization in the Powder River Basin, Wyoming: Wyoming Geological Association Guidebook, 28th annual field conference, p. 53-64.
1978, Sedimentology and stratigraphy of the lower Eocene Wind River Formation, central Wyoming: Wyoming Geological Association Guidebook, 30th annual field conference, p. 181-198.

GEOCHEMISTRY AND PETROGENESIS 21
Shapiro, Leonard, and Brannock, W. W., 1962, Rapid analysis of silicate, carbonate, and phosphate rocks: U.S. Geological Survey Bulletin 1144-A, 56 p.
Streckeisen, A. L., 1973, Plutonic rocks, classification and nomencla ture recommended by the IUGS Subcommission on the Systema- tics of Igneous Rocks: Geotimes, v. 18, p. 26-30.
Stuckless, J. S., and Miesch, A. T., 1981, Petrogenetic modeling of a potential uranium source rock, Granite Mountains, Wyoming: U.S. Geological Survey Professional Paper 1225, 34 p.
Stuckless, J. S., and Nkomo, I. T., 1978, Uranium-lead isotope sys- tematics in uraniferous alkali-rich granites from the Granite Mountains, Wyoming: Implications for uranium source rocks: Economic Geology, v. 73, p. 427-441.
Suhr, N. H., and Ingamells, C. 0., 1966, Solution technique for anal ysis of silicates: Analytical Chemistry, v. 38, p. 730-734.
Taggart, J. E., Jr., Lichte, F. E, and Wahlberg, J. S., 1982, Analysis of samples using X-ray fluorescence and induction coupled pksma spectroscopy, in The 1980 eruptions of Mount St. Helens, Washington: U.S. Geological Survey Professional Paper 1250, p. 683-687.
Taylor, H. P., Jr., and Epstein, S., 1962, Principles and experimental results, part 1 of Relationship between 018/016 ratios in coexist ing minerals of igneous and metamorphic rocks: Geological Soci ety of America Bulletin, v. 73, p. 46H80.
Thaden, R. E., 1980a, Geologic map of the De Pass quadrangle, Fre- mont and Hot Springs Counties, Wyoming: U.S. Geological Sur vey Geologic Quadrangle Map GQ-1526, scale 1:24,000.
1980b, Geologic map of the Guffy Peak quadrangle, showing chromolithofacies in the Wind River Formation, Fremont and Hot Springs Counties, Wyoming: U.S. Geological Survey Geologic Quadrangle Map GQ-1527, scale 1:24,000.
1980c, Geologic map of the Birdseye Pass quadrangle, showing chromolithofacies and coal beds in the Wind River Formation, Fremont and Hot Springs Counties, Wyoming: U.S. Geological Survey Geologic Quadrangle Map GQ-1537, scale 1:24,000.
Thornton, C. P., and Tuttle, 0. F., 1960, Differentiation index, in Chemistry of igneous rocks: American Journal of Science, v. 258, p. 664-684.
Tuttle, 0. F., and Bowen, N. LM 1958, Origin of granites in the light of experimental studies in the system NaAlSiaOg-KAlSiaOg- CaAl2Si208-H20: Geological Society of America Memoir 74, 153P-
Wenner, D. B., 1980, Oxygen isotope variations within the Elberton Pluton, in Stormer, J. C., Jr., and Whitney, J. A., eds., Guidebook 19, Geological, geochemical, and geophysical studies of the Elberton Batholith, eastern Georgia: A guidebook to ac company the 15th annual Georgia Geological Society field trip, p. 31^3.
Whitney, J. A., 1975, The effects of pressure, temperature and XH^ on phase assemblages in four synthetic rock compositions: Jour nal of Geology, v. 83, p. 1-27.
Winkler, H. G. F., 1967, Petrogenesis of metamorphic rocks, rev. 2d ed.: New York, Springer-Verlag, 237 p.
Yellich, J. A., Cramer, R. J., and Kendall, R. G., 1978, Copper Mountain, Wyoming, Uranium deposit rediscovered: Wyoming Geological Association Guidebook, 30th annual field conference, p. 311-327.
ZielinsW, R. A., Lipman, P. W., and Millard, H. T., Jr., 1977, Minor- element abundances in obsidian, perlite, and felsite of calc-alkalic rhyolites: American Mineralogist, v. 62, p. 426-437.
Zielinski, R. A., Peterman, Z. E., Stuckless, J. S., Rosholt, J. N., and Nkomo, I. T., 1981, The chemical and isotopic record of rock- water interaction in the Sherman Granite, Wyoming and Col orado: Contributions to Mineralogy and Petrology, v. 78, p. 209- 219.

Geochronology of an Archean Granite, Owl Creek Mountains, Wyoming
By C. E. HEDGE, K. R. SIMMONS, and J. S. STUCKLESS
CHEMICAL AND ISOTOPIC STUDIES OF GRANITIC ARCHEAN ROCKS, OWL CREEK MOUNTAINS, WYOMING
U.S. GEOLOGICAL SURVEY PROFESSIONAL PAPER 1388-B


CONTENTS
Page
Abstract ............................................. 27Introduction ........................................... 27Analytical methods ....................................... 27Data and discussion ....................................... 28Conclusions ............................................ 32References ............................................ 33
ILLUSTRATIONS
Page
FIGURE 1. Rubidium-strontium isochron diagram for unaltered granite samples ............................. 282. Plot showing correlation of initial ^Sr/^Sr with whole-rock 8180 values .......................... 293. Rubidium-strontium isochron diagram for altered granite samples .............................. 294. Concordia plot for uranium-lead data from zircons ...................................... 315. Concordia plot for uranium-lead data from zircons assuming the added complexity of 600-Ma lead loss ........ 32
TABLES
PageTABLE 1. Rubidium-strontium data for whole-rock samples ........................................ 28
2. Uranium-lead isotopic data for zircons .............................................. 30
25


CHEMICAL AND ISOTOPIC STUDIES OF GRANITIC ARCHEAN ROCKS, OWL CREEK MOUNTAINS, WYOMING
GEOCHRONOLOGY OF AN ARCHEAN GRANITE, OWL CREEK MOUNTAINS, WYOMING
By C. E. HEDGE, K. R. SIMMONS, and J. S. STUCKLESS
ABSTRACT
Rubidium-strontium analyses of whole-rock samples of an Archean granite from the Owl Creek Mountains, Wyo., indicate an intrusive age of 2640± 125 Ma. Muscovite-bearing samples give results suggest ing that these samples were altered about 2300 Ma. This event may have caused extensive strontium loss from the rocks as potassium feldspar was altered to muscovite. Alteration was highly localized in nature as evidenced by unaffected rubidium-strontium mineral ages in the Owl Creek Mountains area. Furthermore, the event prob ably involved a small volume of fluid relative to the volume of rock because whole-rock 8180 values of altered rocks are not distinct from those of unaltered rocks. In contrast to the rubidium-strontium whole-rock system, zircons from the granite have been so severely affected by the alteration event, and possibly by a late-Precambrian uplift event, that the zircon system yields little usable age informa tion.
The average initial ^Sr/^Sr (0.7033 ±0.0042) calculated from the isochron intercept varies significantly. Calculated initial ^Sr/^Sr ratios for nine apparently unaltered samples yield a range of 0.7025 to 0.7047. These calculated initial ratios correlate positively with whole-rock 8180 values; and, therefore, the granite was probably de rived from an isotopically heterogeneous source. The highest initial 87gr/86gr ra^io js iower than the lowest reported for the metamorphic rocks intruded by the granite as it would have existed at 2640 Ma. Thus, the metamorphic sequence, at its current level of exposure, can represent no more than a part of the protolith for the granite.
INTRODUCTIONThe Owl Creek Mountains are located near the center
of an extensive area of Archean rocks that includes most of Wyoming, much of southern Montana, and ad jacent parts of Utah and South Dakota. Throughout this region, older gneiss and greenstone terranes were intruded by granitic rocks between 2500 and 2800 Ma. In the Teton Range to the west, Reed and Zartman (1973) assigned an age of metamorphism of 2820 Ma to the Webb Canyon Gneiss. Several studies of metasedimentary rocks (up to granulite grade) in the Beartooth Mountains to the northwest have provided an age of 3000-3400 Ma (Nunes and Tilton, 1971; Henry
and others, 1981; Wooden and others, 1981). Ages of 2800-3000 Ma have been reported for the rocks of the Big Horn Mountains to the east (Arth and others, 1980). An amphibolite-grade sedimentary-volcanic se quence in the Granite Mountains to the south has a reported rubidium-strontium whole-rock age of 2860 Ma (Peterman and Hildreth, 1978); this age probably repre sents the most recent period of metamorphism, as other isotopic studies suggest that at least the original sedi ments are as old as 3200 Ma (L. B. Fischer and J. S. Stacey, unpub. data, 1982). Granites that intrude the metamorphic complex of the Granite Mountains have been dated by uranium-lead zircon at 2640 and 2595 Ma (Ludwig and Stuckless, 1978). Two plutons in the Wind River Range (southwest of the Owl Creek Mountains) yield uranium-lead zircon ages of 2640 and 2560 Ma (Naylor and others, 1970).
Previous geochronology of the Precambrian rocks of the Owl Creek Mountains is rather limited. Giletti and Gast (1961) presented rubidium-strontium ages for peg- matitic muscovite and microcline of 2663 Ma and 2584 Ma, respectively. Lead-lead whole-rock data for the granites, reported by Nkomo and others (1978), indi cate an age of 2645 ±60 Ma. Metamorphic rocks from Wind River Canyon gave a whole-rock rubidium-stron tium age of 2755 ±100 Ma (Mueller and others, 1981). Diabase dikes are common throughout the Precambrian of Wyoming, and Condie and others (1969) reported po tassium-argon whole-rock ages of 1900-2100 Ma for six dikes in the Owl Creek Mountains.
ANALYTICAL METHODS
Rubidium and strontium concentrations were mea sured on separate aliquots of whole rock using 87Rb and ^Sr tracers. All ^Sr/^Sr ratios (table 1) have been normalized to a 86Sr/88Sr of 0.1194, and the mass spec trometer used in this study yielded a value of
27

28 GRANITIC ARCHEAN ROCKS, OWL CREEK MOUNTAINS, WYOMING
0.70802 ±0.00006 (2a) for the Eimer and Amend SrC03 standard. Replicate analyses of granitic samples indi cate an analytical accuracy of ±1.0 percent (2a) for concentrations and ±0.02 percent (2<r) for the stron tium isotopic composition. These errors were used for data regression because they include splitting errors that can be significant for granitic materials.
Zircon separates were sized and magnetically sepa rated. Before dissolution, the separates were leached first in 8N HC1 and then in 7N HN03. The attack pro cedure is similar to that given in Krogh (1973), and the extraction procedure is that described by Ludwig and others (1981). Lead was run on a single rhenium filament using H3P04-silica gel. Uranium and thorium were run together on a single filament using H3P04 and aquadag. Analytical uncertainties for zircon ages were calculated according to the methods of Ludwig (1980). The determination of best-fit lines was made using the methods of Ludwig (1979), and the decay con stants used are those recommended by the IUGS Sub- commission on Geochronology (Steiger and Jager, 1977).
DATA AND DISCUSSION
The rubidium-strontium analytical data are presented in table 1. On the basis of field evidence, petrography, and Q-mode analyses of chemical data (Stuckless and others, this volume), the first nine samples listed in the table are deemed to represent unaltered and cogenetic samples of the main granitic intrusion. These samples are from the North Canning area. The nine unaltered granite samples give a rubidium-strontium age of 2640 ±125 Ma and an initial ^Sr/^Sr of 0.7033 ±0.0042 (all errors 2a). The scatter of data points (fig. 1) is greater than would be expected from analytical uncertainty alone, and the age and initial 87Sr/86Sr are calculated from a model-3 fit to the data (Ludwig, 1979).
A possible cause for the observed scatter in the rubidium-strontium data, as suggested by the model-3 fit, might be variable initial 87Sr/86Sr ratios. To test this hypothesis, we calculated initial 87Sr/86Sr ratios (assuming an age of 2640 Ma) and plotted them against the 8180 values for those samples for which both types of data were available. A positive correlation results (fig. 2). The variable initial 87Sr/®6Sr ratios cannot be an artifact of assuming the wrong age because the two samples with the highest and lowest apparent initial ratios (29467 and 41596, respectively) have nearly iden tical rubidium-strontium ratios. Similar correlative var iations between initial 87Sr/86Sr values and whole-rock 8 180 values have been noted for Paleozoic granites of
the southeastern Piedmont (Wenner, 1980), and the ob served variability in these two parameters has been in terpreted as reflecting variations within the source re gion of the granite (Wenner, 1981). By analogy, we con clude that the age of 2640 ±125 Ma is correct (to the
TABLE 1. Rubidium-strontium data for whole-rock samples from the Owl Creek Mountains, Wyo.
Sample number
Rb (ppm)
Sr (ppm) Sr 7Sr/ 86Sr
Unaltered granite
415962939423432415912946730511234963050132466
185.9193.2171.3188.8196.6175.6193.3187.5159.0
218.0235.3190.2252.3232.1247.7190.8241.2201.2
2.4912.3962.6302.1842.4742.0672.9642.2672.307
0.7982.7947.8030.7871.7993.7820.8166.7898.7916
Altered granite
TDG12TDG4758-8058-6658-98GP-1GP-4
292.1144.9196.7230.1166.5735.034.3
79.5116.895.493.6101.3
8.58590.1
11.0493.6376.0877.2934.839
1807.5.1682
1.1068.8339.9162.9649.8780
65.04.7104
Metamorphic rocks
DKCH-207DKCH-254DKCH-26358188
88.098.194.3
117.6
193.699.2
132.5286.7
1.3222.8942.0761.193
0.7582.8246.7932.7580
0.82
0.80 -
0.78 -
0.76 -
0.74
0.72 -
0.70
Age = 2640 ± 125 Ma I = 0.7033 ± 0.0042
FIGURE 1. Rubidium-strontium isochron diagram for unaltered gran ite samples from the North Canning area, Owl Creek Mountains, Wyo. Symbol size corresponds to ±2tr analytical error.

GEOCHRONOLOGY 29
extent that the data fit the mathematical assumptions of model 3) and that the scatter of the rubidium-stron tium data for the granite of the Owl Creek Mountains (fig. 1) is a function of variable 87Sr/86Sr caused by melting of an isotopically heterogeneous source and crystallization prior to homogenization of the magma. Assimilation of metasedimentary wall rock might also explain the variable initial 87Sr/86Sr; however, the 8180 values of the metamorphic rocks are low, and the 87Sr/ 86Sr ratios of the metamorphic rocks at the time of in trusion were high. Hence, assimilation of these rocks would produce a negative trend of 8180 versus initial 87Sr/86Sr. Also, such a mechanism would be incompati ble with the Q-mode analyses of the chemical data (Stuckless and others, this volume).
The remaining seven granite samples in table 1 show various types of evidence for alteration. Sample GP-4 is a silicified-epidotized granite, sample GP-1 is an al- bitized and garnetiferous granite, and the other five samples contain abundant (secondary?) muscovite. These seven samples do not define a precise rubidium- strontium isochron (fig. 3) but give an apparent age of 2463 Ma. For reasons that are not totally under stood, rubidium-rich and strontium-poor samples like GP-1 frequently yield low apparent rubidium-strontium ages relative to samples of lower Rb/Sr from the same rock unit. For geologic (Gilluly, 1933) and isotopic reasons (Stuckless and others, 1981), albitized samples such as GP-1 are thought to be the product of postmag- matic hydrothermal alteration. Samples similar to GP-4 have been interpreted to have been altered hydrother- mally after crystallization of a granite (Peterman and Hildreth, 1978; Stuckless and others, 1981). The re maining five samples, which are all from the North
8.4
8.2
8.0
7.8
7.6
7.4
7.2
7.0
29467
0.701 0.702 0.703 0.704 INITIAL 87Sr/86Sr
0.705 0.706
FIGURE 2. Plot showing correlation of initial ^Sr/^Sr with whole- rock 8180 values for unaltered granite samples from the Owl Creek Mountains, Wyo. Symbol sizes correspond to ±2a.
Canning area, seem to represent an event that is sepa rate from the two types of hydrothermal alteration noted for samples GP-1 and GP-4.
The altered samples from the North Canning area have distinctly different rubidium-strontium systema- tics relative to the unaltered samples from the same area. The unaltered samples have very limited ranges of rubidium and strontium contents (rubidium range from 159 to 197, average 183; strontium range from 190 to 252, average 223). The altered samples from this same area have similar rubidium contents (range from 145 to 230, average 185) but markedly lower strontium contents (range from 94 to 116, average 102). The alter ation process appears, therefore, to have had little ef fect on the rubidium, but to have lowered the strontium contents to something less than half of the original val ues. This postulated expulsion of strontium is consis tent with the petrographic observation that, during alt eration, potassium feldspar was partially transformed to muscovite. Potassium feldspar accepts appreciable strontium, whereas muscovite does not. Assuming that such is indeed the mechanism of strontium loss and that the altered samples originally had strontium contents like those of the unaltered samples, we can calculate that the time of alteration was approximately 2300 Ma. According to this interpretation, the "age" of 2463 Ma, shown in figure 2, results either from multiple types of alteration that may be of different ages or from scat ter indicative of a resetting process that was less than perfect.
The mechanism and driving force needed to locally transform potassium feldspar to muscovite are not un-
1.1 -
4 687Rb/86Sr
10
FIGURE 3. Rubidium-strontium isochron diagram for altered granite samples. Data for sample GP-1 (indicated by arrow) plot well beyond the boundaries of the diagram, but on the isochron. Symbol size corresponds to ±2<r except data for GP-4 which plot as a dot in the center of the square.

30 GRANITIC ARCHEAN ROCKS, OWL CREEK MOUNTAINS, WYOMING
derstood, but it is noteworthy that the alteration was patchy and that samples separated by less than 100 m could exhibit very different rubidium-strontium whole- rock systematics. The event was probably not accom panied by regional heating (as documented for granites approximately 80 km to the south by Peterman and Hildreth, 1978) because rubidium-strontium ages for pegmatitic minerals were not reset (Giletti and Gast, 1961). It also appears that the alteration did not affect whole-rock 8180 values because values for four of the altered samples from North Canning are within the range of values for unaltered samples from the same area (Stuckless and others, this volume). This similarity in 8180 suggests that the volume of fluid was small rela tive to the volume of rock. Alternatively, the fluid had a fortuitously appropriate isotopic composition relative to temperature of alteration, or possibly alteration oc curred at too high a temperature to cause isotopic frac- tionation. The latter seems unlikely in view of the evi dence against significant regional heating. Finally, even the whole-rock chemistry of samples identified as al tered by rubidium-strontium systematics and supported by petrographic observations is apparently unaffected because at least some of the altered samples are well accounted for by Q-mode factor analysis (Stuckless and others, this volume). Although the specifics of altera tion are not understood, the conclusion that subtle changes in mineralogic assemblages can indicate large effects on rubidium-strontium systematics of individual, closely spaced samples without concomitant evidence from major-element chemistry or oxygen isotope data has significant implications for rubidium-strontium geochronology.
Six zircon fractions from two hydrothermally altered rocks and one apparently unaltered rock were analyzed for uranium and lead isotopic compositions (table 2). The results yield little information about the age of the granite. The data fail to define a unique line on a con- cordia diagram (fig. 4), and all that can be said with complete certainty is that the zircons indicate an age in excess of 2514 Ma (the oldest observed lead-lead age).
If the intrusive age for the granite is 2640 Ma, as indicated by the rubidium-strontium data for the unal tered samples, the zircon data points should lie along a line whose upper intercept is 2640 Ma and whose lower intercept approximates the time of the Tertiary uplift (for example, the heavy solid line on fig. 4). By assuming that only one Precambrian event has affected the samples since crystallization, we can place some limits on when that event occurred. It must have hap pened after 2393 Ma, because this is the youngest lead- lead age, but before 1700 Ma, which is the age calcu lated by passing a line from 2640 Ma through the data
TABLE 2. Uranium-lead isotopic data for zircon separates from granites of the Owl Creek Mountains, Wyo.
ConcentrationsAtomic ratios Ages
Sample number
GP-5-1GP-5-2GP-5-358-80-158-80-241596
U (ppm)
31242701396541284562719
Pb(ppm)
21611321277614681733204
238J
0.4033.2970.4264.3024.3182.1482
235J
9.2116.6429.35616.4946.7663.226
206p b
0.1657.1622.1591.1558.1542.1579
238J
21841676229017031789891
235 0
235920652375204520811463
206y
251424792446241023932433
point for the zircon closest to concordia (GP-5-3). The former case requires that the Precambrian event totally reset sample 58-80-2, whereas the latter requires that no lead has been lost recently from GP-5-3. Neither extreme seems particularly appealing, and the second case is the more unlikely. We, therefore, conclude that the resetting of the zircons occurred between 2393 and 1700 Ma, and perhaps nearer the upper than the lower part of the range. In other words, the zircons may have been partly reset at the same time as the rubidium- strontium systems of the altered rocks (about 2300 Ma), and the zircons may also have been disturbed during the Tertiary uplift or mineralization event.
In addition to an early and recent lead loss, there may have been a lead loss from the zircons during the late-Precambrian unroofing. Lead loss at that time would not greatly alter the above interpretation, but the upper limit for the earlier Proterozoic event would be increased to about 2460 Ma. A lead loss during the late Precambrian eliminates the paradox of a zircon (41596) that was affected by the 1700- to 2300-Ma event in a sample for which the rubidium-strontium whole- rock system was unaffected (fig. 5).
The mechanism by which most of the zircons were reset is not clear, but some of the salient features are noteworthy. The alteration event was local and not re gional. No Early Proterozoic resetting was encountered for zircons in the studies (cited in the introduction) of the surrounding Precambrian exposures except for small hydrothermally altered outcrops (Ludwig and Stuckless, 1978).
The zircon data are unusual in that the common-lead and uranium contents of these zircons are exceptionally high. Uranium analyses for 963 zircons from granitic rocks yield a geometric mean of 636 ppm with a stan dard deviation of +934 and -379 ppm (Stuckless and VanTrump, 1982). All of the uranium contents for zir cons from the altered rock are more than two standard deviations greater than this mean, and three of the five are more than three standard deviations greater than this mean. In contrast, the uranium content for the one zircon from an apparently unaltered granite is indistin guishable from that of an average granitic zircon. Also

GEOCHRONOLOGY 31
0.5
207pb/235U
FIGURE 4. Concordia plot for uranium-lead data from zircons. Symbol sizes represent analytical error at the 2a level. The point labeled A represents the intrusive age, and B represents the time of alteration as indicated by the rubidium-strontium data. The possible limits for B are indicated by B'and B". The line from A to near the origin indicates where the data would have plotted if they had not been affected by the event at time B'. According to this interpretation, at time B data points were displaced from A towards B and would have plotted along line A-B had no further lead loss occurred. In response to the Tertiary uplift and uncovering, the zircons again lost lead such that data points were displaced from line A-B to their current positions along paths indicated by the dashed lines.
exceptional is the fact that the frequently observed re lationships of increasing degree of discordance with in creasing uranium content of the zircons is only partly true for the zircons from the altered rock. If all the data are considered, no such correlation is seen because the zircon with the lowest uranium content is the most discordant. Whether these features represent cause or effect of the zircon resetting is unknown, but the prob lem merits further study.
No real effort was made to determine the age of the metamorphic complex; however, a few drill-core sam ples were analyzed in order to test the possibility that the granitic magma was derived from the metamorphic complex. Mueller and others (1981) reported an initial 87Sr/86Sr for metadacite of the Owl Creek Mountains
of 0.7037 ±0.0015 at 2755 Ma; they pointed out that al though the age was probably applicable to all of the metavolcanic rocks, the initial ratio need not be. The average metadacite would have been too radiogenic at 2640 Ma to account for all but the highest calculated initial ^Sr/^Sr of the granite. At 2640 Ma, the 87Sr/ 86Sr ratios calculated for three metagraywackes andone granitic gneiss analyzed as part of this study (table 1, the last four samples) range from 0.7077 to 0.7140. These analyzed metamorphic rocks were, therefore, too radiogenic to have been a source material for a granite for which calculated initial 87Sr/86Sr ratios range from 0.7025 to 0.7047. This conclusion is valid even though our samples of the metamorphic sequence do not yield an isochronal relationship if it is assumed that these

32 GRANITIC ARCHEAN ROCKS, OWL CREEK MOUNTAINS, WYOMING
12 14207pb/235(J
FIGURE 5. Concordia plot for uranium-lead data from zircons assuming the added complexity of lead loss at 600 Ma. Symbol sizes represent analytical error at the 2o- level. Points A and B represent the time of intrusion and alteration, respectively, and B' and B" represent the maximum limits of B. In this alternate interpretation, data for all of the zircons except 41596 would plot along the line A-B at time B. All of the zircons would have then responded to the late Precambrian uplift and unroofing such that data points were displaced along the dot-dash vectors. Finally, data points were moved along the dash lines in response to the Tertiary uplift event.
samples behaved as a closed system from 2640 Ma ago to the present. Thus, the metamorphic sequence as presently exposed is not a suitable source for the grani tic magma. A suitable protolith would have lower rubidium-strontium ratios and consequently lower 87Sr/ ^Sr values. Such a protolith may have been more mafic than the exposed metamorphic sequence. Alternatively, the protolith could be similar to the metamorphic se quence if rubidium-strontium ratios were lowered at least 300 Ma before generation of the granite.
Earlier depletion of rubidium in deeper parts of the metamorphic sequence by granulite fades metamor- phism (Heier, 1960; Lambert and Heier, 1968) could have created a source for the granite of the Owl Creek Mountains that had low and inhomogeneous ^Sr/^Sr ratios of 2640 Ma. A source region that had experienced granulite facies metamorphism could also account for
the relatively low 8180 whole-rock values for a granite as evolved as the granite of the Owl Creek Mountains (Hoefs, 1980) and for such low initial ^Pb/^Pb ratios which could persist as a result of uranium depletion (Gray and Oversby, 1972).
CONCLUSIONSRubidium-strontium analyses of whole-rock samples
of an Archean granite from the Owl Creek Mountains indicate an age of 2640 Ma. Results for altered samples can be interpreted as indicating an alteration age of about 2300 Ma and further suggest extensive strontium loss during alteration. Zircons from the granite were so severely affected that they give little usable age in formation. The resetting of the zircons may have oc curred about 2300 Ma, but a second resetting in re-

GEOCHRONOLOGY 33
sponse to unroofing at the end of the Precambrian can not be ruled out. Measured and published strontium isotopic data for the intruded metamorphic complex in dicate that the granite could not have been derived by melting of these rocks at their current level of expo sure. However, if the same or similar rocks exist at depth and were metamorphosed to granulite facies at 3000 Ma or earlier, they could account for the low and variable initial 87Sr/86Sr ratios observed for the granite.
REFERENCESArth, J. B., Barker, Fred, and Stern, T. W., 1980, Geochronology
of Archean gneisses in the Lake Helen area, southwestern Big Horn Mountains, Wyoming: Precambrian Research, v. 11, p. 11-22.
Condie, K. C., Leech, A. P., and Baadsgaard, Halfdan, 1969, Potassi um-argon ages of Precambrian mafic dikes in Wyoming: Geologi cal Society of America Bulletin, v. 80, p. 899-906.
Giletti, B. J., and Gast, P. W., 1961, Absolute age of Precambrian rocks in Wyoming and Montana, in Kulp, J. L., ed., Geochronol ogy of rock systems: Annals of the New York Academy of Sci ences, v. 91, p. 454-458.
Gilluly, James, 1933, Replacement origin of albite granite near Sparta, Oregon: U.S. Geological Survey Professional Paper 175- C, p. 65-81.
Gray, C. M., and Oversby, V. M., 1972, The behavior of lead isotopes during granulite facies metamorphism: Geochimica et Cos- mochimica Acta, v. 36, p. 939-952.
Heier, K. S., 1960, Petrology and geochemistry of high-grade metamorphic and igneous rocks on Langoy, northern Norway: Norge Geologiska Undersokelse, v. 207, 246 p.
Henry, D. J., Mueller, P. A., and Wooden, J. L., 1981, Early Arche an granulite supracrustal assemblages, eastern Beartooth Moun tains, Wyoming: Geological Society of America Abstracts with Programs, v. 13, p. 471.
Hoefs, J., 1980, Stable isotope geochemistry, 2d ed.: Berlin, Springer-Verlag, 218 p.
Krogh, T. E., 1973, A low-contamination method for hydrothermal decomposition of zircon and extraction of U and Pb for isotopic age determinations: Geochimica et Cosmochimica Acta, v. 37, p. 485-494.
Lambert, I. B., and Heier, K. S., 1968, Geochemical investigations of high grade regional metamorphic and associated rocks in the Australian shield: Lithos, v. 1, p. 30-53.
Ludwig, K. R., 1979, A program in Hewlett-Packard BASIC for X-Y plotting and line-fitting of isotopic and other data: U.S. Geological Survey Open-File Report 79-1641, 33 p.
1980, Calculations of uncertainties of U-Pb isotope data: Earth and Planetary Science Letters, v. 46, p. 212-220.
Ludwig, K. R., Nash, J. T., and Naeser, C. W., 1981, U-Pb isotope systematics and age of uranium mineralization, Midnite Mine, Washington: Economic Geology, v. 76, p. 89-110.
Ludwig, K. R., and Stuckless, J. S., 1978, Uranium-lead isotope sys tematics and apparent age of zircons and other minerals in Pre cambrian granitic rocks, Granite Mountains, Wyoming: Contribu tions to Mineralogy and Petrology, v. 65, p. 243-254.
Mueller, P. A., Peterman, Z. E., and Granath, J., 1981, An Archean bimodal volcanic series, Owl Creek Mountains, Wyoming: Geological Society of America Abstracts with Programs, v. 13, p. 515-516.
Naylor, R. S., Steiger, R. H., and Wasserburg, G. J., 1970, U-Th-Pb and Rb-Sr systematics of 2700 xlO6 year old plutons from the southern Wind River Range, Wyoming: Geochimica et Cos mochimica Acta, v. 34, p. 1133-1159.
Nkomo, I. T., Stuckless, J. S., Thaden, R. E., and Rosholt, J. N., 1978, Petrology and uranium mobility of an early Precambrian granite from the Owl Creek Mountains, Wyoming: Wyoming Geological Association Guidebook, 30th annual field conference, p. 335-348.
Nunes, P. D. and Tilton, G. R., 1971, Uranium-lead ages of minerals from the Stillwater igneous complex and associated rocks, Mon tana: Geological Society of America Bulletin, v. 82, p. 2231-2250.
Peterman, Z. E., and Hildreth, R. A., 1978, Reconnaissance geology and geochronology of the Precambrian of the Granite Mountains, Wyoming: U.S. Geological Survey Professional Paper 1055, 22 p.
Reed, J. C., Jr., and Zartman, R. E., 1973, Geochronology of the Precambrian rocks of the Teton Range, Wyoming: Geological So ciety of America Bulletin, v. 84, p. 561-582.
Steiger, R. H. and Jager, E., 1977, Subcommission geochronology: Convention on the use of decay constants in geo- and cosmo- chronology: Earth and Planetary Science Letters, v. 36, p. 359-362.
Stuckless, J. S., Nkomo, I. T., and Doe, B. R., 1981, U-Th-Pb sys tematics in hydrothermally altered granites from the Granite Mountains, Wyoming: Geochimica et Cosmochimica Acta, v. 45, p. 635-645.
Stuckless, J. S. and VanTrump, George, Jr., 1982, An evaluation of uranium contents in zircons from igneous rocks of the contigu ous United States as an aid to exploration and resource assess ment: Proceedings of the IAEA/OECD Symposium on Uranium Exploration Methods, Paris, June 1-4, 1982, p. 369-384.
Wenner, D. B., 1980, Oxygen isotope variations within the Elberton pluton, in Stormer, J. C., Jr., and Whitney, J. A., eds., Geologi cal, geochemical and geophysical studies of the Elberton Batholith, eastern Georgia: A Guidebook to accompany the 15th annual Georgia Geological Society field trip, p. 31-43.
-1981, Oxygen isotopic compositions of the late erogenic granites in the southern Piedmont of the Appalachian Mountains, U.S.A., and their relationship to subcrustal structures and lithologies: Earth and Planetary Science Letters, v. 54, p. 186-199.
Wooden, J. L., Muellers, P. A., and Bowes, D. R., 1981, Archean crustal evolution in the Beartooth Mountains, Montana-Wyom ing: Geological Society of America Abstracts with Programs, v. 13, p. 585.

Uranium-Thorium-Lead Systematics of an Archean Granite from the Owl Creek Mountains, Wyoming
By J. S. STUCKLESS, I. T. NKOMO, and K. A. BUTT
CHEMICAL AND ISOTOPIC STUDIES OF GRANITIC ARCHEAN ROCKS, OWL CREEK MOUNTAINS, WYOMING
U.S. GEOLOGICAL SURVEY PROFESSIONAL PAPER 1388-C


CONTENTS
Page
Abstract ............................................. 39Introduction ........................................... 39Analytical procedures ...................................... 40Results .............................................. 40Discussion ............................................ 41
Sample selection ...................................... 41Age relationship ...................................... 41Uranium mobility ...................................... 44
Conclusions ............................................ 47References ............................................ 48
ILLUSTRATIONS
FIGURE 1. Plot of 2S2Th/2MPb versus ^Pb/^Pb .............................................. 412. Plot of whole-rock 8180 values versus initial ^Pb/^Pb ratios ............................... 423. Lead-lead isochron plot ...................................................... 424. Concordia diagram ......................................................... 435. Photomicrograph and fission-track maps ............................................. 446. Ternary diagrams for uranium, thorium, and potassium contents .............................. 47
TABLE
TABLE 1. Uranium, thorium, and lead concentrations and the isotopic composition of lead ...................... 40
37


CHEMICAL AND ISOTOPIC STUDIES OF GRANITIC ARCHEAN ROCKS OWL CREEK MOUNTAINS, WYOMING
URANIUM-THORIUM-LEAD SYSTEMATICS OF AN ARCHEAN GRANITE FROM THE OWL CREEK MOUNTAINS, WYOMING
By J. S. STUCKLESS, I. T. NKOMO, and K. A. BUTT
ABSTRACT
Isotopic analyses of apparently unaltered whole-rock samples of a granite from the Owl Creek Mountains, Wyo., yield a lead-lead iso- chron age of 2,730 ±35 Ma, which is somewhat older than the age obtained by the rubidium-strontium whole-rock method. Thorium- lead data for the same samples deviate markedly from an isochronal relation; however, calculated initial 208Pb/204Pb ratios correlate with whole-rock 8180 values and lead to the conclusion that the 232Th-208Pb data are not colinear because of an originally heterogeneous granitic magma. This conclusion also has been drawn on the basis of chemical and other isotopic data and attributed to inhomogeneities in the pro- tolith. Although the protolith apparently had a wide range in 232Th/ ^Pb ratios, the range for ^U/^Pb ratios (|x) was small. The (x values for the protolith are high relative to an average orogene, and thus the source region for the granite was anomalously uraniferous.
Relationships in the mPbP*U-SMPbP*U system show that ura nium was mobilized during early Laramide time or shortly before, such that most surface and shallow drill-core samples lost 60-80 per cent of their uranium, and some fractured, deeper drill-core samples gained from 50 to 10,000 percent uranium. Fission-track maps show that much uranium is located along edges and cleavages of biotite and magnetite where it is readily accessible to oxidizing ground water. Furthermore, qualitative comparisons of uranium distribution in samples with excess radiogenic lead and in samples with approxi mately equilibrium amounts of uranium and lead suggest that the latter contain more uranium in these readily accessible sites.
Unlike other granites that have uranium distributions and isotopic systematics similar to those observed in this study, the granite of the Owl Creek Mountains is not associated with economic uranium deposits. We attribute this to the small areal extent of the granite, the shallow depth of leaching, and the timing of uranium mobilization, which apparently predated the deposition of sediments that else where in central Wyoming host uranium ore.
INTRODUCTIONThe granite of the Owl Creek Mountains is overlain
by Tertiary sedimentary rocks that contain uranium- mineralized areas, and the granite hosts moderate-sized areas of mineralized fractures (Yellich and others, 1978). The study of uranium-thorium-lead isotope sys tematics in the Granite Mountains to the south has proved useful in demonstrating a probable connection
between Archean granite and Tertiary uranium de posits (Rosholt and others, 1973; Stuckless and Nkomo, 1978). A preliminary isotopic study of the granite of the Owl Creek Mountains has suggested that this gran ite may also be related to uranium mineralization (Nkomo and others, 1978).
Uranium-thorium-lead systematics can yield informa tion on uranium gain or loss from a granite, the timing of uranium movement (including multiple events in cer tain circumstances), the age of the granite, and con straints on the source of the granite (Rosholt and others, 1973; Stuckless and Nkomo, 1978). The method consists of determining the concentrations of uranium, thorium, and lead and the isotopic composition of lead for cogenetic samples that were isotopically homogene ous at the time of crystallization. Isochronal relation ships are examined in the 232Th-208Pb and 208Pb-207Pb systems for linear fits within the limits of analytical error and agreement of calculated ages. Internally pre cise isochrons and agreement between ages calculated from the two isochrons indicate that uranogenic lead concentrations can be used as a measure of uranium gain or loss. If the isotopic composition of lead at the time of intrusion can be measured or closely estimated, relationships within the 207Pb/235U-206Pb/238U system can be used to place limits on the amount and timing of uranium mobility.
Results reported in this study build on information gained from chemical and other isotopic studies. Oxy gen and strontium isotopic studies and uranium-lead analyses in zircons (Stuckless and others, this volume; Hedge and others, this volume) show that the granite of the Owl Creek Mountains was isotopically in- homogeneous at the time of intrusion and that isotopic systems in at least some samples have been affected by one or more postmagmatic events. Furthermore, not all of the spatially associated granitic samples are genetically related. These results indicate that many samples will not fit a simple interpretation of the ura-
39

40 GRANITIC ARCHEAN ROCKS, OWL CREEK MOUNTAINS, WYOMING
TABLE 1. Uranium, thorium, and lead concentrations and the isotopic compositions of lead for samplesfrom the Owl Creek Mountains, Wyo.
Sample
234324159629394DP-232496
30511DP-329467GP-3TD22
4343TDG2158180TD-13TDG46
GP-5TDG47TDG1258-6658-80
58-98DP-1TDG16TDG2058317
TDG45TDG24TD-6TDG44
Plot I.D.
912b13c
414b
13b8
13d1721
722
lOd1
lla
5lib2alOalOb
lOc2b2423
lOf
6b25166a
U (ppm)
21.8812.8011.9414.5814.44
9.163.398.429.222.44
16.082.29
160.53.72
71.79
3.0978.4112.895.29
11.80
5.372.873.772.42
1994
2.784.68.40
14.50
Th (ppm)
24.5120.6942.2626.6124.32
36.5338.5525.3244.9247.54
59.4950.8250.0950.0328.97
20.2234.5034.4429.0829.13
26.298.175.237.23
26.35
2.0716.582.13
35.02
Pb (ppm)
52.8345.4746.0956.9350.99
51.2046.4138.1275.6156.51
61.4154.9291.2767.0160.66
42.575.2138.2656.3344.65
46.4162.4541.228.15
81.11
10.9436.0342.2670.48
2 oepb/2 .* Pb
27.64523.57322.24426.09722.748
22.06722.16322.12626.38522.337
22.72320.11359.28522.98031.268
22.79577.35228.30726.17228.465
26.09117.15923.26134.81154.263
17.23019.55115.20023.199
207pb/20itpb
17.57016.83716.56817.30316.683
16.53316.54216.52017.35016.604
16.66916.15823.15216.74118.102
16.70126.30717.61617.29917.666
17.29915.67316.54719.19121.700
15.68116.07015.38916.745
a.»Pb/2 o,Pb
38.24537.45142.82437.69838.070
40.34441.22940.28339.45141.184
42.86142.18642.01141.13139.140
36.00142.54441.24836.31038.088
36.75434.33835.30639.50137.491
36.00537.11934.47037.291
mum-thorium-lead systematics. Thus, for isotopic pur poses, the data are considered as three subsets: (1) the main granite intrusion, which is subdivided into (la) samples apparently unaffected by postmagmatic hydro- thermal alteration and (Ib) hydrothermally altered samples, and (2) samples not genetically related to the main intrusion.
ANALYTICAL PROCEDURESUranium, thorium, and lead concentrations for 29
whole-rock samples were determined by isotope dilu tion and mass spectrometry. Compositions and concen trations were determined on separate dissolutions, and therefore a minimum of 1-g splits of 200 mesh powder was used for each sample in order to minimize splitting errors. Most samples were analyzed in duplicate and average results are reported in table 1. Examination of duplicate analyses indicates a precision of ±0.5 per cent for elemental ratios (2a) and ±0.2 percent for isotopic composition ratios (2a). Details of chemical and
mass spectrometric procedures are nearly the same as those described by Rosholt and others (1973) except that lead was analyzed using the silica gel-H3P04 method.
Regression analysis of the data used the methods of York (1969). Decay and isotopic constants used are those recommended by the IUGS Subcommission on Geochronology (Steiger and Jager, 1977). Reported er rors are at the 95 percent confidence limit.
RESULTSData for the granite of the Owl Creek Mountains
exhibit extremely large ranges in both elemental con centrations and isotopic compositions. Uranium concen trations range from 0.40 to 1,994 ppm. Exclusion of four obviously mineralized samples (TDG46, 58180, TDG47, and 58314) still leaves an upper limit of 21.88 ppm (sample 23432) and eight other samples that con tain more than 10 ppm uranium. Thus the granite of the Owl Creek Mountains is anomalously uraniferous

URANIUM-THORIUM-LEAD SYSTEMATICS 41
relative to the typical range of 0.5-5.0 ppm uranium for silicic plutonic rocks (Rogers and Adams, 1969a). Thorium contents can be anomalously large and range from 2.07 to 59.49 ppm, which compares to a typical range of 10-20 ppm (Rogers and Adams, 1969b). Lead contents vary from 8.15 to 91.27 ppm and are generally greater than 40 ppm. These values contrast with an arithmetic mean lead content for granites of 23.6 ppm (Wedepohl, 1974) and reflect a large radiogenic lead component in the total lead.
The isotopic composition of lead shows a wide range of values (^Pb/^Pb, 15.200 to 77.352; and 208Pb/204Pb, 34.338 to 42.861). Most compositions are generally much more radiogenic than that of the average modern orogene. Its composition isotopically approximates that of the average mantle, upper crust, and lower crust (Doe and Zartman, 1979), and is given as 18.70 for206pb/204pb and 3g gg for 208pb/204pb (Stacey and K^.
ers, 1975). This radiogenic tendency is reasonable in view of the Archean age and high uranium and thorium contents. However, three samples (DP-1, TDG45, and TD-6) are less radiogenic than the average erogenic lead.
DISCUSSION
SAMPLE SELECTION
Results of extended Q-mode factor analyses have shown that several of the analyzed samples are not re lated chemically to the main granite intrusion (Stuck- less and others, this volume). Therefore, these samples (the last eight on table 1) were not used in the construc tion of isochron diagrams. Likewise, the rubidium- strontium system has been largely reset by a postmag matic, hydrothermal alteration for five samples (Hedge and others, this volume). These samples (TDG47 through 58-98, table 1) were also not used in isochron regressions. Ten of the remaining sixteen samples could not be evaluated by this criterion because they were not analyzed isotopically for rubidium and strontium. However, three of these samples (TD-13, TDG46, and GP-5) are nearly colinear with the hydrothermally al tered samples on a log-log plot of rubidium and stron tium concentration data and, therefore, may be reset samples. The first 13 samples in table 1 are thought to be cogenetic and are apparently unaltered.
AGE RELATIONSHIPS
A plot of the thorium-lead isotopic data (fig. 1) for the 21 samples for which a probable genetic relationship has been established by extended Q-mode factor analy sis reveals a marked deviation from linearity that is well in excess of that predicted by analytical error. Fif-
43
41
| 39
CM
£837
35
33
2a
20 40 232Th/204Pb
60 80
FIGURE 1. Plot of 232Th/204Pb versus ^Pb/^Pb for apparently cogenetic samples from the granite of the Owl Creek Mountains. Reference line corresponds to an age of 2,700 Ma. Samples that are suspected to have been affected by postmagmatic alteration are shown by x's. Other samples are shown by crosses that corre spond to ±2er analytical error.
teen of the samples scatter about a trend with a slope that corresponds to an age of 2,700 Ma. Four of five hydrothermally altered samples (lOa, lOb, lOc, and 2a, fig. 1) as defined by the rubidium-strontium system (Hedge and others, this volume) are displaced towards higher 282Th/204Pb values and form a second trend. A fifth sample (5, fig. 1) lies along this second trend and therefore was most likely affected by the postmagmatic hydrothermal alteration. Displacements from the first to the second trend are probably due to radiogenic lead loss as discussed later in this section. One sample (lib, fig. 1) that plots with the hydrothermally altered sam ples in the rubidium-strontium system has an anoma lously high 208pb/232Th yalue reiatjve to either Of ^trends, which suggests that this sample may have gained some radiogenic lead long after crystallization of the granite.
Analysis of oxygen and strontium isotopic data has shown that the granite was isotopically inhomogeneous at the time of intrusion and that variations in oxygen and initial strontium isotopic compositions are correla tive (Hedge and others, this volume). Figure 2 shows a similar correlation for 8180 and calculated initial 2ospb/204pb ratjos Tne good correlation between calcu lated initial-lead composition and S180 suggests (1) that the excess scatter about the reference 2,700-Ma iso chron on figure 1 can be explained by isotopic in- homogeneities in the magma at the time of intrusion, and (2) that, for most samples, the thorium-lead system has remained closed throughout the history of the gran ite.
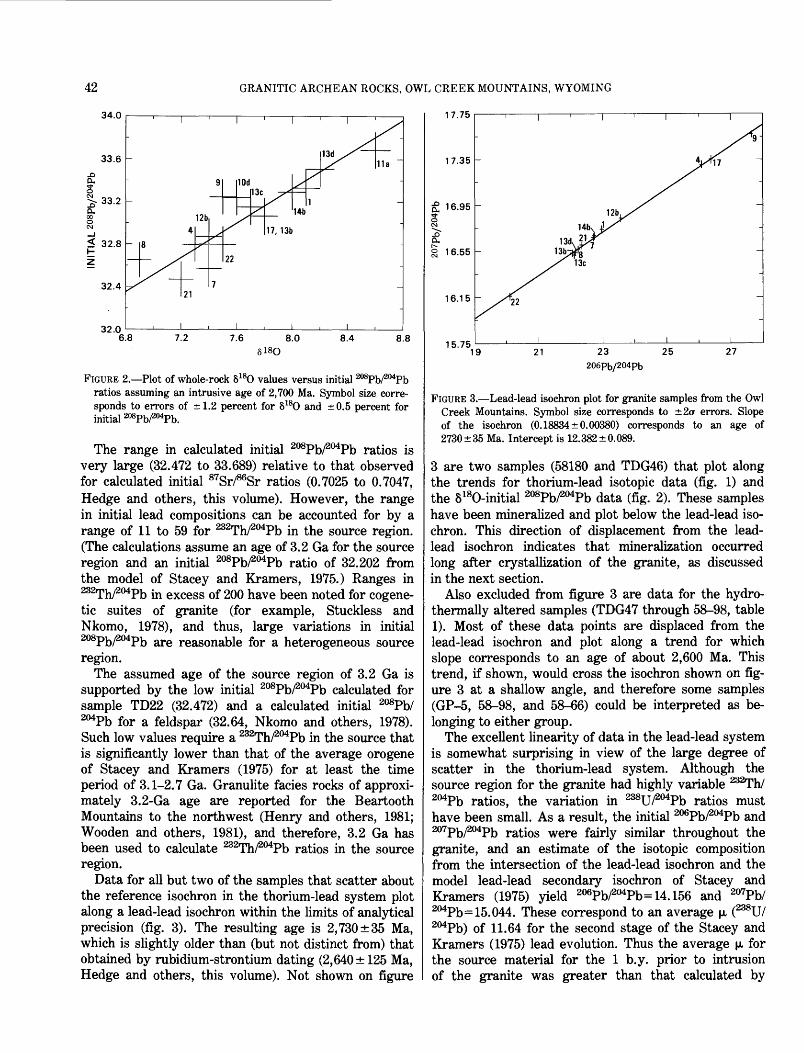
42
34.0
33.6 -
33.2 -
< 32.8
32.4 ^
32.0
GRANITIC ARCHEAN ROCKS, OWL CREEK MOUNTAINS, WYOMING
17.75
818Q
FIGURE 2. Plot of whole-rock 8180 values versus initial ratios assuming an intrusive age of 2,700 Ma. Symbol size corre sponds to errors of ±1.2 percent for 8180 and ±0.5 percent for initial **Pbf**Pb.
The range in calculated initial 208Pb/204Pb ratios is very large (32.472 to 33.689) relative to that observed for calculated initial 87Sr/86Sr ratios (0.7025 to 0.7047, Hedge and others, this volume). However, the range in initial lead compositions can be accounted for by a range of 11 to 59 for 232Th/204Pb in the source region. (The calculations assume an age of 3.2 Ga for the source region and an initial ^Pb/^Pb ratio of 32.202 from the model of Stacey and Kramers, 1975.) Ranges in 232Th/204Pb in excess of 200 have been noted for cogene- tic suites of granite (for example, Stuckless and Nkomo, 1978), and thus, large variations in initial 208Pb/204Pb are reasonable for a heterogeneous source region.
The assumed age of the source region of 3.2 Ga is supported by the low initial 208Pb/204Pb calculated for sample TD22 (32.472) and a calculated initial 208Pb/ 204Pb for a feldspar (32.64, Nkomo and others, 1978). Such low values require a 232Th/204Pb in the source that is significantly lower than that of the average orogene of Stacey and Kramers (1975) for at least the time period of 3.1-2.7 Ga. Granulite facies rocks of approxi mately 3.2-Ga age are reported for the Beartooth Mountains to the northwest (Henry and others, 1981; Wooden and others, 1981), and therefore, 3.2 Ga has been used to calculate 28aTh/204Pb ratios in the source region.
Data for all but two of the samples that scatter about the reference isochron in the thorium-lead system plot along a lead-lead isochron within the limits of analytical precision (fig. 3). The resulting age is 2,730 ±35 Ma, which is slightly older than (but not distinct from) that obtained by rubidium-strontium dating (2,640 + 125 Ma, Hedge and others, this volume). Not shown on figure
17.35
16.95
S 16.55
16.15
15.75
13c
'22
19 21 23 206pb/204pb
25 27
FIGURE 3. Lead-lead isochron plot for granite samples from the Owl Creek Mountains. Symbol size corresponds to ±2cr errors. Slope of the isochron (0.18834 ±0.00380) corresponds to an age of 2730 ±35 Ma. Intercept is 12.382 ±0.089.
3 are two samples (58180 and TDG46) that plot along the trends for thorium-lead isotopic data (fig. 1) and the 8 180-initial 208Pb/204Pb data (fig. 2). These samples have been mineralized and plot below the lead-lead iso chron. This direction of displacement from the lead- lead isochron indicates that mineralization occurred long after crystallization of the granite, as discussed in the next section.
Also excluded from figure 3 are data for the hydro- thermally altered samples (TDG47 through 58-98, table 1). Most of these data points are displaced from the lead-lead isochron and plot along a trend for which slope corresponds to an age of about 2,600 Ma. This trend, if shown, would cross the isochron shown on fig ure 3 at a shallow angle, and therefore some samples (GP-5, 58-98, and 58-66) could be interpreted as be longing to either group.
The excellent linearity of data in the lead-lead system is somewhat surprising in view of the large degree of scatter in the thorium-lead system. Although the source region for the granite had highly variable ^^h/ 204Pb ratios, the variation in ^U/^Pb ratios must have been small. As a result, the initial 206Pb/204Pb and 207Pb/204Pb ratios were fairly similar throughout the granite, and an estimate of the isotopic composition from the intersection of the lead-lead isochron and the model lead-lead secondary isochron of Stacey and Kramers (1975) yield 206Pb/204Pb=14.156 and 207Pb/ 204Pb=15.044. These correspond to an average JJL (238U/ 204Pb) of 11.64 for the second stage of the Stacey and Kramers (1975) lead evolution. Thus the average jx for the source material for the 1 b.y. prior to intrusion of the granite was greater than that calculated by

URANIUM-THORIUM-LEAD SYSTEMATICS 43
2.8
2.4
2.0
1.6
1.2
0.8
0.4
0.68
0.64 -
060
0.56
0.52
0.48
20 40
207pb/235U
60 80
FIGURE 4. Concordia diagram for all granitic samples from the Owl Creek Mountains. Data for genetically related samples (as defined by extended Q-mode analysis) are shown by squares. Data for apparently unrelated samples are shown by circles. The regressed chord uses data for the first 15 samples in table 1 (those that fit a trend in the thorium-lead system) and intersects concordia at 2,695 ±20 Ma and 120 ±40 Ma. The chord is marked to show data positions for Tertiary uranium losses of 40, 60, 70, and 80 percent. Inset shows detail around the upper intercept.
Stacey and Kramers (1975) for an average orogene (9.64). Furthermore, a JJL of 11.64 is a minimum value if the metamorphic sequence (which is much less than 1 b.y. older than the granite) is the protolith for the granite. Therefore, the protolith for the granite must have been more strongly enriched in uranium than the average orogene.
The common-lead composition can be used to calcu late the radiogenic component of the lead, and a concor dia diagram (fig. 4) can then be constructed. Regression of the data for the apparently unaltered samples yields intercept ages of 2,695 ±20 and 120 ±40 Ma. Inclusion of data for samples that have been affected by the post- magmatic hydrothermal alteration changes the inter cept ages to 2,680 ±30 and 120 ±100 Ma. Most of the data for the altered samples plots to the left of the
chord for the unaltered samples and indicates at least a partial resetting some time after 2600 Ma.
The lower intercept ages calculated with or without the hydrothermally altered samples are distinctly older than the 20 ±10 Ma for whole-rock samples from the Granite Mountains (Stuckless and Nkomo, 1978). This difference suggests that the main episode of uranium mobility occurred prior to burial by volcanic detritus in early Tertiary time and prior to formation of the large uranium deposits of the Gas Hills district to the south which formed about 35 Ma (Ludwig, 1979). How ever, a-activity ratios for three drill-core samples (Nkomo and others, 1978) show marked disequilibrium within the uranium decay chain, which indicates that uranium or its daughter products or both have been mobile within the last hundred thousand years.

44 GRANITIC ARCHEAN ROCKS, OWL CREEK MOUNTAINS, WYOMING
FIGURE 5 (above and facing page). Photomicrograph (A) and fission-track detector (B) pairs for granite samples from the Owl Creek Mountains. Mica detectors, directly below corresponding photomicrographs, were photographed from the back side so that correspondence is not mirror image. Mineral abbreviations are M=magnetite, B=biotite, P=plagioclase, I=ilmenorutile, A=allanite, E=epidote, and H=hematite. Samples were irradiated with a total neutron dose of approximately 2xl016/cm2. Ura nium concentrations in excess of 30 ppm appear as black areas.
URANIUM MOBILITY
Figure 4 shows that most of the samples gained or lost some uranium during or just, before earliest Laramide time, and that most samples approximated closed-system behavior from the time of intrusion until the Laramide disturbance. These conclusions are sup ported both by the fit of the data (for the unaltered samples) to a chord within the limits of analytical preci
sion, and by general agreement of the upper intercept age with that determined by rubidium-strontium and lead-lead methods.
Data for samples that are presumed to have been affected by the postulated hydrothermal alteration plot to the left of the chord on figure 4. This displacement can be caused by uranium gain or lead loss at the time of hydrothermal alteration (approximately 2,300 Ma ago, Hedge and others, this volume). The position of

URANIUM-THORIUM-LEAD SYSTEMATICS 45
5mm5mm
these samples relative to the thorium-lead reference isochron (fig. 1) can be explained by either lead loss or thorium gain. Many studies have shown that thorium is generally immobile in granitic rocks and that lead can be mobilized under many conditions (Manton, 1973; Zielinski and others, 1977; Stuckless and Nkomo, 1978; Doe and Delevaux, 1980; Stuckless, Nkomo and Doe, 1981; Zielinski and others, 1981; Doe and others, 1982). Furthermore, potassium feldspar, which forms a major site for lead in granite, has been altered in the hydro- thermal event (Hedge and others, this volume). Thus, all lines of evidence suggest that the altered samples lost lead in response to postmagmatic hydrothermal ac tivity.
The uranogenic portion of the lead and measured ura nium contents can be used to estimate the amount and timing of uranium mobility (Stuckless and Nkomo, 1978). The apparent immobility of lead in the thorium- lead system for the unaltered samples (as suggested by the correlation between calculated initial 208Pb/204Pb ratios and 8180 values) indicates that estimates of ura nium mobility should be fairly accurate (± 10 percent), with most of the error attributed to the uncertainty in the initial ^Pb/^Pb and 207Pb/204Pb ratios. Because lead loss from the altered rocks probably occurred not too long after the time of intrusion (relative to the age of the granite), reasonable inferences about uranium mobility can be made for these samples; however, esti-

46 GRANITIC ARCHEAN ROCKS, OWL CREEK MOUNTAINS, WYOMING
mates of uranium loss will be slightly low, and esti mates of uranium gain will be slightly high. Estimates of uranium mobility have also been made for the eight samples that do not have a cogenetic relationship to the main granite intrusion on the assumptions that the common lead compositions and ages for these samples are not very different from the parameters used to cal culate radiogenic leads for the other samples. Interpre tation of uranium mobility for these samples is there fore much less certain.
The chord on figure 4 is marked for percent uranium loss. Nine of the data points suggest uranium loss in excess of 60 percent during Laramide time or later. Seven of these points are for surface samples and two are for drill-core samples from a depth of less than 30 m. In contrast, four drill-core samples from depths in excess of 60 m are mineralized and suggest uranium enrichments of 50 to nearly 10,000 percent. The fact that the data points both above and below concordia are colinear indicates that uranium loss from the sur face and shallow drill-core samples occurred at the same time as uranium mineralization. Thus, the granite was the most likely source for, as well as host to, the uranium deposit. Samples that lost uranium are con fined to the surface and near-surface environment, which suggests oxidizing ground water as a likely medium for uranium transport.
Both postulated uranium gain and loss for specific samples are consistent with the observed uranium dis tribution within the samples. Figure 5 shows uranium sites for samples that apparently gained or lost varying amounts of uranium. In general, the same primary and secondary uranium sites are present within samples that lost little or no uranium (such as DP-2, figs. 5-1 and 5-4) and those that lost considerable uranium (such as DP-3, fig. 5-3). Most of the uranium is located with in zircon, apatite, allanite, and ilmenorutile. These min erals probably constitute the primary or magmatic ura nium sites. Epidote, which is commonly enclosed within biotite or allanite (figs. 5-3 and 5-4), generally contains very little uranium. Epidote is paragenetically late, but is nonetheless considered to be a primary site for ura nium. Secondary sites include uranium intimately as sociated with hematite and microscopic opaque inclu sions that are titanium-rich. Secondary uranium also oc curs along edges, cleavage traces, and fractures in mag netite and biotite. Qualitatively, there appears to be less uranium in secondary sites in samples that show isotopic evidence for more than 50 percent uranium loss (figs. 5-3 and 5-4) than in samples that contain near equilibrium amounts of uranium and radiogenic lead.
Samples for which there is isotopic evidence for ura nium gain reveal the same primary and secondary sites for uranium as other samples; but, in addition, secon dary uranium occurs along fractures and grain bound aries of felsic minerals (fig. 5-2). There is also a ten dency towards replacement of biotite by iron oxides that are highly uraniferous. Leaching experiments of mineralized granite from the Owl Creek Mountains (Maysilles and others, 1977) show that most if not all of the secondary uranium is rapidly removed by either strong acids or bases.
The primary and secondary sites for uranium noted for the granite of the Owl Creek Mountains are similar to those noted for granites that are associated with ura nium deposits. Uranium associated with biotite and magnetite has been postulated as a source for the de posits in central Wyoming (Stuckless and others, 1977) and at the Midnite Mine, Wash. (Nash, 1979). A signifi cant difference in uranium distribution for samples from the Owl Creek Mountains is that epidote from the gran ite of the Granite Mountains has been shown to be uraniferous and to have lost much uranium in the near- surface environment (Stuckless and Nkomo, 1980).
Although both the results of Q-mode factor analysis and uranium-thorium-lead systematics indicate uranium mobility for the granite of the Owl Creek Mountains, comparison of radioelement ratios with those of granite from the Granite Mountains suggests a generally lesser degree of uranium mobility for the former (fig. 6). Both granites are enriched in thorium relative to potassium if compared to an average of 2,500 granites from the contiguous United States (Stuckless and VanTrump, 1982), but the granite of the Granite Mountains is de pleted in uranium relative to thorium whereas the gran ite of the Owl Creek Mountains is enriched. This re flects, in part, the large proportion of drill-core samples for the latter, but Stuckless and Nkomo (1978) reported as much as 80 percent uranium loss for samples from as deep as 400 m for the Granite Mountains, and the deepest sample used in the current study is from 156 m. Thus, uranium in the granite of the Owl Creek Mountains seems to be less labile than that in the gran ite of the Granite Mountains, both in terms of depth of leaching and in amount of leaching from surface sam ples.
The lesser degree of uranium mobility, shallower depth of leaching, and smaller outcrop area may explain why the granite of the Owl Creek Mountains is not associated with large, economic uranium deposits. In addition, uranium mobilization for the granite of the Owl Creek Mountains probably predates formation of

URANIUM-THORIUM-LEAD SYSTEMATICS 47
GRANITE U MOUNTAINS (ppm)
OWL CREEK MOUNTAINS
(ppm) 20 40 60 80
KX10-4
(ppm) 80
,KX10-4
(ppm)
FIGURE 6. Ternary diagrams for uranium, thorium, and potassium contents for granites from the Owl Creek and Granite Mountains(modified from Stuckless, Bunker, and others, 1981).
the Tertiary sedimentary rocks that host the uranium ore deposits of central Wyoming. As a result, the gran ite may provide a reasonable uranium source for only those mineralized zones that are located within the frac tured portion of the granite.
CONCLUSIONS
Uranium-thorium-lead systematics for granite from the Owl Creek Mountains show that samples unaffected by hydrothermal alteration yield a lead-lead age of 2,730 ±35 Ma. Large variations in the initial ^Pb/^Pb ratio preclude obtaining an age in the thorium-lead sys tem. These variations, like those in initial 87Sr/86Sr, can be correlated with whole-rock 8180 values. Hydrother- mally altered samples are displaced from both the lead- lead isochron and thorium-lead reference isochron. The direction of displacement is consistent with lead loss that may have occurred during alteration of potassium feldspar to muscovite. A maximum age of 2,600 Ma is indicated for alteration. This age, in combination with the minimum age of 2,300 obtained by the rubidium- strontium whole-rock isochron method, indicates the existence of a previously unknown Early Proterozoic event.
The large variations in initial 208Pb/204Pb ratios indi cate a large but reasonable variation in 2saTh/204Pb ratios in the source region of the granite. In contrast, jx values for the source region were fairly uniform such that initial ^Pb/^Pb and ^Pb/^Pb ratios can be cal
culated. A minimum jx value of 11.64 indicates a ura nium-enriched protolith for the granite.
A concordia plot for the unaltered granite samples yields intercepts of 2,695 ±20 and 120 ±40 Ma. The upper intercept agrees with the age obtained by lead- lead and rubidium-strontium whole-rock isochron methods, and the data are colinear within the limits of analytical precision. Therefore, the uranium-lead sys tem appears to have remained closed from the time of intrusion to approximately Laramide time. During early Laramide time or shortly before, mineralized samples gained 50-10,000 percent uranium, and at the same time, most surface and shallow drill-core samples lost 60-80 percent of their uranium. Thus the granite is interpreted to be both source and host for uranium mineralization.
The high degree of uranium mobility in the granite of the Owl Creek Mountains is reasonable in view of the uranium sites within the granite. Much uranium is located along cleavages and grain boundaries of biotite and magnetite where it would be readily accessible to oxidizing ground water. A similar distribution has been noted for uranium in granite associated with large ura nium deposits (Stuckless and others, 1977; Nash, 1979). Furthermore, leached granite samples appear to have less uranium associated with biotite and magnetite than samples that contain near-equilibrium amounts of ura nium and radiogenic lead.
In spite of the fact that there is much evidence for uranium mobility for the granite of the Owl Creek
48 GRANITIC ARCHEAN ROCKS, OWL CREEK MOUNTAINS, WYOMING
Mountains from results of uranium-thorium-lead sys- tematics, Q-mode factor analysis, and petrographic ob servations, this granite is not associated with large economic deposits. The lack of economic association is thought to be due to the relatively small area of leached granite, the limited depth of leaching, and the fact that mobilization of uranium appears to predate formation of Tertiary sediments that host most of the uranium deposits of central Wyoming.
REFERENCES
Doe, B. R., and Delevaux, M. H., 1980, Lead-isotope investigations in the Minnesota River Valley Late-tectonic and post-tectonic granites: Geological Society of America Special Paper 182, p. 105-112.
Doe, B. R., Stuckless, J. S., and Delevaux, M. H., 1982, The possible bearing of the granite of the UPH deep drill holes, northern Illinois, on the origin of Mississippi Valley ore deposits: Journal of Geophysical Research, v. 88, p. 7335-7345.
Doe, B. R., and Zartman, R. E., 1979, Plumbotectonics I, the Phanerozoic, in Barnes, H. L., ed., Geochemistry of hydrother- mal ore deposits: New York, John Wiley and Sons, p. 22-70.
Henry, D. J., Mueller, P. A., and Wooden, J. L., 1981, Early Arche- an granulite supracrustal assemblages, eastern Beartooth Moun tains, Wyoming: Geological Society of America Abstracts with Programs, v. 13, p. 471.
Ludwig, K. R., 1979, Age of uranium mineralization in the Gas Hills and Crooks Gap Districts, Wyoming, as indicated by U-Pb isotope apparent ages: Economic Geology, v. 74, p. 1654-1668.
Manton, W. L, 1973, Whole rock Th-Pb age for the Masuke and Dembe-Divula complexes, Rhodesia: Earth and Planetary Sci ence Letters, v. 19, p. 83-89.
Maysilles, J. H., Nichols, I. L., and Seidel, D. C., 1977, Extracting uranium from a Wyoming granite: U.S. Bureau of Mines Report of Investigations 8219, 15 p.
Nash, J. T., 1979, Uranium and thorium in granitic rocks of north eastern Washington and northern Idaho, with comments on ura nium resource potential: U.S. Geological Survey Open-File Re port 79-233, 39 p.
Nkomo, I. T., Stuckless, J. S., Thaden, R. E., and Rosholt, J. N., 1978, Petrology and uranium mobility of an early Precambrian granite from the Owl Creek Mountains, Wyoming: Wyoming Geological Association Guidebook, 30th annual field conference, p. 335-348.
Rogers, J. J. W., and Adams, J. A. S., 1969a, Uranium, in Wedepohl, K. H., ed., Handbook of geochemistry, v. 2, no. 4: Berlin, Springer-Verlag, p. 92-B to 92-0.
1969b, Thorium, in Wedepohl, K. H., ed., Handbook of geochemistry, v. 2, no. 4: Berlin, Springer-Verlag, p. 90-1 to 90-0.
Rosholt, J. N., Zartman, R. E., and Nkomo, I. T., 1973, Lead isotope systematics and uranium depletion in the Granite Moun tains, Wyoming: Geological Society of America Bulletin, v. 84, p. 989-1002.
Stacey, J. S., and Kramers, J. S., 1975, Approximation of terrestrial lead isotope evolution by a two-stage model: Earth and Planetary Science Letters, v. 26, p. 207-221.
Steiger, R. H., and Jager, E., 1977, Subcommission geochronology Convention on the use of decay constants in geo- and cosmo- chronology: Earth and Planetary Science Letters, v. 36, p. 359- 362.
Stuckless, J. S., Bunker, C. M., Bush, C. A., Doering, W. P., and Scott, J. H., 1977, Geochemical and petrologic studies of a uraniferous granite from the Granite Mountains, Wyoming: U.S. Geological Survey Journal of Research, v. 5, p. 61-81.
Stuckless, J. S., Bunker, C. M., Bush, C. A., and VanTrump, George, Jr., 1981, Radioelement concentrations in Archean gran ites of central Wyoming: U.S. Geological Survey Open-File Re port 81-948, 40 p.
Stuckless, J. S., and Nkomo, I. T., 1978, Uranium-lead isotope sys tematics in uraniferous alkali-rich granites from the Granite Mountains, Wyoming: Implications for uranium source rocks: Economic Geology, v. 73, p. 427-441.
1980, Preliminary investigations of U-Th-Pb systematics on uranium-bearing minerals from two granitic rocks from the Gran ite Mountains, Wyoming: Economic Geology, v. 75, p. 289-295.
Stuckless, J. S., Nkomo, I. T., and Doe, B. R., 1981, U-Th-Pb sys tematics in hydrothermally altered granites from the Granite Mountains, Wyoming: Geochimica et Cosmochimica Acta, v. 45, p. 635-645.
Stuckless, J. S., and VanTrum'p, George, Jr., 1982, A compilation of radioelement concentrations in granitic rocks of the contiguous United States: Proceedings of the IAEA/OECD Symposium on Uranium Exploration Methods, p. 191-208.
Wedepohl, K. H., 1974, Lead abundance in common magmatic rock types Crustal abundance, in Wedepohl, K. H., ed., Handbook of geochemistry, v. 2: Berlin, Springer-Verlag, p. 82-E-l to 82- E-18.
Wooden, J. L., Muellers, P. A., and Bowes, D. R., 1981, Archean crustal evolution in the Beartooth Mountains, Montana-Wyo ming: Geological Society of America Abstracts with Programs, v. 13, p. 585.
Yellich, J. A., Cramer, R. T., and Kendall, R. G., 1978, Copper Mountain, Wyoming, uranium deposit rediscovered: Wyoming Geologic Association Guidebook, 30th annual field conference, p. 311-327.
York, Derek, 1969, Least-squares fitting of a straight line with corre lated errors: Earth and Planetary Science Letters, v. 5, p. 320- 324.
Zielinsto, R. A., Lipman, P. W., and Millard, H. T., Jr., 1977, Minor- element abundances in obsidian, perlite, and felsite of calc-alkalic rhyolites: American Mineralogist, v. 62, p. 426-437.
ZielinsW, R. A., Peterman, Z. E., Stuckless, J. S., Rosholt, J. N., and Nkomo, I. T., 1981, The chemical and isotopic record of rock- water interaction in the Sherman Granite, Wyoming and Col orado: Contributions to Mineralogy and Petrology, v. 78, p. 209- 219.
*U.S. GOVERNMENT PRINTING OFFICE:1986-6?6-04?:26031


5N*;
~^f-\