3uhsduhg iru 6kdurq m. $ehocradpdf.drdc-rddc.gc.ca/pdfs/unc203/p802684_a1b.pdf · semble indiquer...
TRANSCRIPT

INTELLIGIBILITY AND SOUND QUALITY OF RADIO MESSAGES IN NOISE OVER TACTICAL COMMUNICATIONS DEVICES:
EFFECTS OF HEARING LOSS AND NON-FLUENCY
FINAL REPORT FOR
PWGSC CONTRACT NO. W7719-135196/001/TOR
by
Christian Giguère, Ph.D., P.Eng., Chantal Laroche, Ph.D., M.O.A., and
Véronique Vaillancourt, M.Sc.S.
Audiology and Speech-Language Pathology Program School of Rehabilitation Sciences
Faculty of Health Sciences University of Ottawa
September 30th 2015
M.

i
AbstractHearing loss and language proficiency are key factors which may impact oral communications between military personnel during tactical operations. To investigate such factors, three groups of participants (control, non-fluent, hearing-impaired) were paired with a standard individual (fluent normal hearing) of the same gender in a task of word discrimination using the Modified Rhyme Test (MRT). This was carried out over the radio channel of two in-ear tactical communication devices with integrated hearing protection at two different operational settings (talk-through ON or OFF), while immersed in an 85-dBA simulated military noise. Each participant and standard individual acted in turn as listener and talker. Performance on the MRT was similar with the control and hearing-impaired groups. Significantly lower scores were found, however, in many situations when the non-fluent group of participants acted as listeners or talkers, compared to the two other groups. MRT scores were also consistently lower with the device configured with an in-ear voice pick-up microphone compared to the other device using an external mouth microphone, particularly for females. In contrast, the talk-through setting had little effect on the results. Overall, the study indicated that language fluency/proficiency and the method of sensing the talker’s voice are key issues affecting the intelligibility of tactical radio communications. These findings are critical in the context of Canadian military and multi-country deployments.
Résumé La perte auditive et les compétences linguistiques sont deux facteurs importants qui peuvent avoir un impact significatif sur les communications orales entre les membres du personnel militaire lors des opérations tactiques. Afin d’évaluer l’impact de ces facteurs, trois groupes de participants (contrôle, non-fluent, et avec perte auditive) ont été jumelés avec un individu standard (fluent avec audition normale) du même genre lors d’une tâche de discrimination de mots (Modified Rhyme Test-MRT) présentés via le canal radio de deux systèmes de communication avec protection auditive intégrée, opérant dans deux modes distincts (option de restauration sonore activée et désactivée). Submergés dans un bruit militaire simulé de 85 dBA, chaque participant et chaque individu standard ont agi à tour de rôle comme locuteur et interlocuteur. Des performances similaires ont été notées au MRT pour le groupe contrôle et le groupe d’individus avec perte auditive. Inversement, les résultats au MRT étaient significativement moins élevés dans plusieurs conditions d’écoute où les individus non-fluents agissaient comme locuteurs ou interlocuteurs, comparativement aux deux autres groupes. Les performances étaient également constamment plus faibles avec le système muni d’un microphone situé directement à l’intérieur du conduit auditif externe pour capter la voix du locuteur comparativement à celui jumelé avec un microphone externe situé près de la bouche, et ce, particulièrement chez les femmes. Cependant, le mode d’opération des systèmes de communication n’a eu que peu d’effet sur les résultats. Dans son ensemble, la présente étude semble indiquer que les compétences linguistiques ainsi que la méthode utilisée pour capter la voix sont des facteurs-clés pouvant influencer l’intelligibilité des communications radio lors des opérations tactiques, particulièrement dans le contexte de l’armée canadienne et lors de déploiements du personnel militaire pour des missions impliquant de nombreux pays.
ii
Executive Summary
Background: In the Canadian Forces, two common situations can contribute to the challenge of communicating in high noise levels during tactical operations: fluency with the language used and hearing loss among the service personnel. Few studies have addressed the impact of fluency and hearing loss, as talker or as listener, particularly during two-way radio communications. Furthermore, little is known about the effects of different tactical devices or operational settings in this context, such as the method of picking up the talker’s voice, the listener radio volume and the impact of the talk-through setting on the surround noise entering the device and masking the received speech. Methodology: Using the Modified Rhyme Test (MRT), three groups of participants (fluent English speakers with normal hearing, non-fluent English speakers with normal hearing, and fluent English speakers with hearing loss) took part in speech tests performed through the radio channel of two in-ear tactical communication devices (Threat4, QuietPro), while immersed in an 85-dBA simulated military noise. Each device was tested with the talk-through set to OFF, which provided maximal attenuation of the background noise, and set to ON, which simulated a surround listening situation at a neutral gain position. Participants were paired with a standard individual of the same gender. Each female (or male) participant and the standard female (or male) acted in turn as listener and talker. The listener had control over the radio volume to achieve optimal communications during practice trials before each experimental condition. Following a 50-word MRT set, the listener was asked to rate the quality of the speech communication on the Mean Opinion Score (MOS) and the radio volume was noted. In each of four experimental conditions (2 devices x 2 talk-through settings), talker-listener roles were reversed using a new word list. Results: Performance on the MRT was similar between the control and hearing-impaired groups when they acted as talkers or listeners. As listeners, however, it was noted that participants with hearing loss set the radio to higher volume levels, likely to compensate for reduced audibility or supra-threshold deficits. In contrast, significantly lower MRT scores were found in many situations when the non-fluent group of participants acted as listeners or talkers, compared to the two other groups. It was noted that the non-fluent and control groups listened at similar radio volume settings and had similar MOS ratings for the quality of the speech transmission, thereby indicating that reduced language proficiency rather than sensory issues were likely at stake. MRT scores and MOS ratings were consistently lower with the QuietPro, which was configured with an in-ear voice pick-up microphone, than the Threat, which used an external mouth microphone; the effect was more pronounced with females. Reduced sensitivity to higher frequencies with an ear canal microphone may account for such differences. In contrast, the talk-through setting (OFF vs ON) had little effect on the results.
iii
Significance and future plans: Hearing loss was found to have a lesser impact than fluency on the intelligibility of radio communications in noise. While hearing loss can in part be offset by radio volume adjustments and other processing features, fluency effects are much more difficult to compensate for from a technological perspective, if at all possible. Valid and reliable language proficiency screening standards and/or use of other means of communication may be required when native and non-native service personnel interact during military operations. Further investigations into the effect of voice pick-up technology, speech material, and divided attention are warranted. Assessment of the combined effect of hearing loss and reduced language proficiency is also important in the context of noise-exposed military personnel deployed in multi-country operations.

iv
Sommaire
Introduction: Au sein des Forces de l’armée canadienne, deux situations courantes peuvent poser un défi lors des communications effectuées dans le cadre des opérations tactiques, en présence de niveaux élevés de bruit: le niveau de compétence linguistique dans la langue utilisée et la perte auditive chez les membres du personnel militaire. Peu d’études ont abordé l’impact des compétences linguistiques et de la perte auditive, tant chez le locuteur que l’interlocuteur, particulièrement lors des communications radio bidirectionnelles. Par ailleurs, dans un tel contexte, on connaît peu l’effet de différents systèmes de communication et de leurs paramètres opérationnels, tels que la méthode utilisée pour capter la voix du locuteur et le volume auquel l’interlocuteur ajuste la radio, ainsi que l’effet du mode opérationnel de restauration sonore sur le bruit ambiant qui peut entrer dans le système et masquer la parole reçue. Méthodologie : Trois groupes de participants (individus fluents en anglais avec audition normale, individus non-fluents en anglais avec audition normale, et individus fluents en anglais avec perte auditive) ont participé à une tâche de discrimination de mots ((Modified Rhyme Test – MRT) présentés via le canal radio de deux systèmes de communication avec protection auditive intégrée (Threat4 et QuietPro) alors qu’ils étaient submergés dans un bruit militaire simulé de 85 dBA. Chacun des systèmes de communication a été utilisé avec le mode de restauration sonore désactivé, offrant une atténuation maximale du bruit ambiant, et avec le mode de restauration sonore activé, simulant une situation d’écoute omnidirectionnelle en position de gain neutre. Les participants étaient jumelés avec un individu standard du même genre. Chaque participant féminin (ou masculin) et la femme (ou l’homme) standard ont agi à tour de rôle comme locuteur et interlocuteur. Lors de la familiarisation qui précédait chaque condition d’écoute, l’interlocuteur pouvait régler le volume de la radio afin d’atteindre une communication optimale. Suivant chaque condition d’écoute (liste de 50 mots du test MRT), l’interlocuteur devait évaluer la qualité de la transmission sonore à l’aide d’une échelle (Mean Opinion Scale) et le volume de la radio était également noté. Dans chacune des quatre conditions d’écoute (2 systèmes de communication x 2 modes opérationnels de restauration sonore), les rôles de locuteur et d’interlocuteur ont été inversés en utilisant une nouvelle liste de mots. Résultats : Des performances similaires ont été notées au MRT pour le groupe contrôle et pour le groupe d’individus avec perte auditive lorsqu’ils agissaient en tant que locuteurs ou interlocuteurs. Par contre, dans leur rôle d’interlocuteur, il a été noté que les participants avec perte auditive ont ajusté le volume de la radio à un niveau plus élevé que celui utilisé par le groupe contrôle, probablement pour compenser l’effet d’une audibilité réduite ou de déficits supraliminaires. Inversement, les résultats au MRT étaient significativement moins élevés dans plusieurs conditions d’écoute où les individus non-fluents agissaient comme locuteurs ou interlocuteurs, comparativement aux deux autres groupes. Il a par ailleurs été noté que les individus non-fluents et ceux du groupe contrôle ont réglé le volume de la radio à des niveaux similaires et ont porté des jugements comparables sur la qualité de la transmission sonore, indiquant que

v
des compétences linguistiques limitées sont probablement en jeu plutôt qu’une diminution des habiletés sensorielles. Les performances au MRT et l’évaluation subjective étaient constamment plus faibles avec le QuietPro (muni d’un microphone situé directement à l’intérieur du conduit auditif externe pour capter la voix de l’interlocuteur) qu’avec le Threat4 (système qui utilise un microphone externe situé près de la bouche); cet effet était particulièrement prononcé chez les femmes. La sensibilité réduite aux hautes fréquences d’un microphone à l’intérieur de l’oreille pourrait expliquer ces différences. Pour sa part, le mode opérationnel de restauration sonore n’a eu que peu d’effet sur les résultats. Importance et recherches futures: La perte auditive semble avoir un impact moins important sur l’intelligibilité des communications radio en présence de bruit que le niveau de compétences linguistiques. Quoique l’on puisse en partie compenser pour la perte auditive par des ajustements du volume de la radio et par d’autres options de traitement du signal, il est beaucoup plus difficile, voire même impossible, de contrer l’effet de compétences linguistiques limitées d’un point de vue technologique. Un protocole valide et fiable d’évaluation des compétences linguistiques et/ou l’utilisation d’autres moyens de communication pourraient s’avérer nécessaires lorsque des membres du personnel militaire dont la langue maternelle est la langue utilisée lors des opérations militaires doivent interagir avec d’autres membres dont les compétences linguistiques dans cette langue sont plus faibles. Des recherches sur l’effet de la technologie du microphone utilisé pour capter la voix, du matériel vocal utilisé lors des tâches d’écoute et de l’attention divisée, sont également de mises. Il est également important d’explorer l’effet combiné d’un niveau limité de compétences linguistiques en présence d’une perte auditive, particulièrement dans le contexte de déploiements des membres du personnel militaire exposé au bruit lors d’opérations impliquant plusieurs pays.

vi
Table of contents
Abstract ………………………………………………………………………………….. i Executive summary ………………………………………………………………………. ii Table of contents …………………………………………………………………………. vi Acknowledgments ……………………………………………………………………….. viii
1.0 Introduction ………………………………………………………………………….. 1
1.1 Noise and the military …………….…………………………….…………….… 1 1.2 Hearing loss prevention ………….……..…………………………………….…. 1 1.3 Auditory situational awareness …..………….…………..………………….…… 3 2.0 Auditory perception with hearing protective and communication equipment …..….. 6 2.1 Passive devices …………………….…………………………….…………….… 6
2.1.1 Effects on situational awareness at close range ………….……………..... 7 2.1.2 HPD selection and modelling…….……………………….…………….… 7 2.1.3 User acceptance……. …………….……………………….…………….… 8
2.2 Active devices ……………………………………….………………………..…. 8 2.2.1 Effects on situational awareness at close range ……….………………….. 9 2.2.2 Effects on situational awareness at far range ………….….…………….… 10 2.2.3 User acceptance……. …………….……………………….…………….… 11
2.3 Outlook ………………………. …..………….………….……………….…… 11 3.0 Rationale ….………………………………………………………………………….. 12 4.0 Methods ……..……………………………………………………………………….. 13
4.1 General ………………………………………………………………………..… 13 4.2 Participants …………………………….…………….………………………..… 14 4.3 Noise .…………………………………………………………………………… 16 4.4 Headsets ……... ………………………..……………………………………..…. 17 4.5 Two-way radio ….…...……….…………………………………………………. 19 4.6 Electroacoustic testing…………………………………………………………... 20 4.7 Experimental set-up and material …..………….………….……………….…… 21 4.8 Experimental protocol ……..………………………….……………………..…. 22 4.9 Data analysis …....………….…………………………..………………….…… 23 5.0 Results ……..……………………...…………………………….……….………….. 24
5.1 Noise analyses ………...………………………………………………………… 24 5.2 Electroacoustic measurements …..…………………………….……………..…. 28
5.2.1 Threat X62000 …………….…………………..………….…………….… 28 5.2.2 QuietPro QP400 …………………………………..………………………. 29
5.3 Data collection with human participants ……………………………………..… 31 5.3.1 Description of participants ….……………………………….………….… 31
5.3.2 Experimental data …………….………………………………………..…. 33 6.0 Discussion ….………………..……………………………………………….. 40
6.1 Effect of listener characteristics ……………………………………………....… 40 6.2 Effect of talker characteristics …..…………………………….……………..…. 41 6.3 Summary effects by factors …………….………………………………………. 42 6.4 Significance and further work …………………………..…………………….… 43
vii
References ……..……..………………………………………………………………….. 46 Appendix A ...…………………………………………………………………………….. 59 Appendix B ...…………………………………………………………………………….. 60 Appendix C ...…………………………………………………………………………….. 62
viii
Acknowledgements
This research was funded by Defence Research and Development Canada. The authors are grateful to Dr. Sharon Abel (Defence Scientist, DRDC – Toronto Research Centre) who acted as scientific authority on this contract and provided valuable expertise and feedback throughout this project. The authors would like also to thank Gilles Lamothe, Professor in the Department of Mathematics and Statistics at the University of Ottawa for his help in performing the statistical analyses. The authors appreciated the dedication of two Ph.D. students who acted as the standard male and standard female talkers involved in this study. Finally, the authors are thankful to the many participants for their contribution to the advancement of knowledge in the field of speech perception in noise with advanced hearing protective devices.

1
1.0 Introduction 1.1 Noise and the military Noise is omnipresent in the military environment (Pelausa et al., 1991; Gasaway, 1994; Dancer et al., 1998; Humes et al., 2006). High noise levels are associated with the operation of military weapons and artillery, combat vehicles, fixed and rotary wing aircrafts, ships, vessels, and much industrial equipment (Gasaway, 1994; Department of the Army USA, 1998). For example, A-weighted noise levels inside military land vehicles and aircrafts can reach, and sometimes exceed, 115 dBA (van Wijngaarden and James, 2004). Noise can also be used as a weapon to surprise and disorient the enemy, and to make other sounds undetectable to the enemy by masking (Scharine and Letowski, 2005). Military personnel therefore regularly face a wide range of noisy situations, many of which are seldom encountered in other work environments. Hearing abilities are of utmost importance in offensive and defensive military operations (Department of the Army USA, 1998). Notwithstanding information overload and divided auditory attention in already adverse listening conditions (Abel, 2008; Abel et al. 2012), military personnel must maintain good awareness of the acoustic environment to ensure effective and safe operations (Scharine and Letowski, 2005). Localization of snipers, determination of enemy position, understanding verbal radio messages, and small arms identification are only a few examples of military tasks for which hearing is crucial. These tasks, which rely on speech communication, warning sound perception and sound localization, must often be carried out in high noise levels and despite the presence of noise-induced hearing loss among service members in many military trades (Pelausa et al., 1991, 1995; Henselman et al., 1995; Bohnker et al., 2002; Abel, 2004, 2005; Humes et al., 2006) and the possible use of hearing protectors, communications devices or other safety gear (Abel et al., 2002, 2009). It is widely known that exposure to high noise levels can cause permanent hearing loss in those exposed if no noise control is instituted or if hearing protectors are not worn when required. In addition, high noise levels can cause temporary loss of hearing and compromise speech communication, the localization of sound sources and the detection of warning sounds and thus, can jeopardize life or safety of the military and civilian personnel. Other physiological and psychological effects of noise exposure include sleep interference, increased stress and fatigue, and inability to concentrate (Berglund et al., 2000; Goelzer et al., 2001), all of which negatively impact work performance and quality of life (Suter, 2012). The short and long-term deleterious effects of noise may therefore seriously compromise health, safety and operations in the military setting (Pelausa et al., 1991; Abel, 2005, 2008). 1.2 Hearing loss prevention The first step towards a safer and more efficient military workplace is a comprehensive hearing loss prevention program addressing all major issues pertaining to noise hazard assessment, mitigation, audiometric screening, and education of the personnel. The Canadian military introduced hearing conservation procedures into its preventive medicine program in
2
the early 1950s (Neely, 1959; Rylands and Forshaw, 1988), and has had a full program in place since 1968 (Pelausa et al., 1991). Despite periodic reviews and assessments of the program (e.g. Forshaw, 1970; Rylands and Forshaw, 1988, Pelausa et al., 1995; Giguère and Laroche, 2005), the prevalence of hearing loss among members in active duty progresses significantly with age, and the proportion of individuals over 45 years of age with hearing thresholds exceeding 36 dB HL is at least twice the proportion that is expected from published norms for otologically normal persons (Abel, 2005) as defined in ISO 7029. Indeed, in the Canadian Forces, 42% of service members show at least a mild hearing loss and 26% develop a moderate to severe hearing loss by midlife, with some military trades such as infantry, artillery and flight engineers being the most at risk (Abel, 2005). There is also a wide range of susceptibility to noise among members, and hearing status ranges broadly from normal to severe hearing loss (Abel, 2005).
The preferred method to minimize the adverse effects of noise in the workplace is the use of engineering noise control and abatement measures (Driscoll and Royster, 2000; Suter, 2002). No other solution to the problem of noise can match the long-term health, safety and workplace communication efficiency benefits of a quieter environment achieved through such measures (Suter, 2012). However, there are many instances where noise control measures are not technically possible, practical or economical (Berger, 2000; Sheen and Hsiao, 2007), or do not reduce noise to safe levels. In these cases, supplementary methods such as the use of personal hearing protection become necessary. For the past 50 years, hearing protection devices (HPDs) have played an important role in hearing loss prevention programs and it is likely to continue into the foreseeable future (Gerges and Casali, 2007; Canetto, 2009), especially in the military environment. Broadly speaking, hearing protectors can be classified as active or passive devices, whether or not powered electronic circuitry is incorporated into the design. Conventional protectors are of the passive type and are still the most commonly used. They provide a fixed attenuation irrespective of the noise level in all but the most extreme noise situations. Conventional passive hearing protectors are generally suitable when properly selected and fitted, but they may interfere with aural communication tasks and impede work performance and safety, especially in the presence of workers with hearing loss (Abel, 2008; Canetto, 2009; Casali, 2010; Giguère et al., 2010). Hence, a compromise in the amount of attenuation provided must be established for optimal protection, safety and work efficiency. The proper selection, fit and use of hearing protectors have been extensively studied (Berger, 1991, 2000) and are the object of national and international standards. In Canada, standard CSA Z94.2 covers the sound attenuation performance and testing requirements for HPDs, as well as the selection, care, and use of protectors for an effective hearing conservation program. The standard recommends that the attenuation provided by hearing protectors for a particular individual and noise field must be such that the resulting exposure is 5-10 dB below the regulatory limit (87 dBA for federal employees) for optimal or ideal selection taking into account protection and communication needs. The same provision is recommended in European standard EN 458. As such, overprotection is to be avoided since the worker may feel isolated from the surrounding environment. This may be the case, in particular, for individuals with hearing loss due to aging or noise exposure. In these individuals, the combined effects of
3
the hearing loss and HPD attenuation may be such that sounds to attend to are no longer audible (Abel et al., 1985, 1993, 2008; Giguère et al., 2010). Active hearing protection devices are rapidly being introduced into the market for industrial, law enforcement and military applications (Casali, 2010; Giguère et al., 2011a). These devices hold promise for achieving the dual objectives of adequate protection and situational awareness of auditory events in the surrounding environment, especially for individuals with hearing loss (Dolan and O’Loughlin, 2005; Giguère et al., 2011b). They offer considerably more fitting options and listening configurations than conventional passive devices; however, detailed selection methods and standardized fitting rules to ensure protection and situational awareness are lacking. Furthermore, some devices have integrated radio capabilities for remote communications, which increase the range of auditory task demands. A current focus of research is on the effects of such devices on speech intelligibility, warning sound perception and sound localization (e.g. Abel et al., 2007, 2009, 2011, 2012; Casali et al., 2007; 2009; Nakashima and Abel, 2009; Alali and Casali, 2011, 2012; Giguère et al., 2011b, 2012; Casto and Casali, 2012). 1.3 Auditory situational awareness
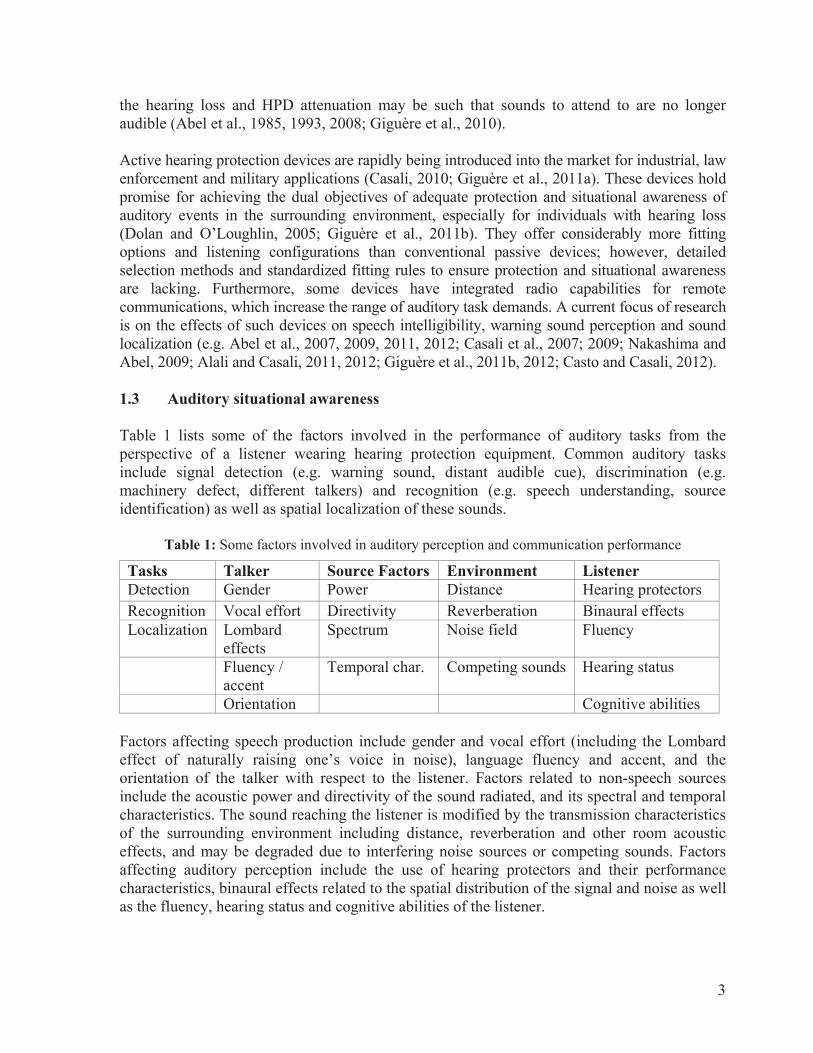
Table 1 lists some of the factors involved in the performance of auditory tasks from the perspective of a listener wearing hearing protection equipment. Common auditory tasks include signal detection (e.g. warning sound, distant audible cue), discrimination (e.g. machinery defect, different talkers) and recognition (e.g. speech understanding, source identification) as well as spatial localization of these sounds.
Table 1: Some factors involved in auditory perception and communication performance
Tasks Talker Source Factors Environment Listener Detection Gender Power Distance Hearing protectors Recognition Vocal effort Directivity Reverberation Binaural effects Localization Lombard
effects Spectrum Noise field Fluency
Fluency / accent
Temporal char. Competing sounds Hearing status
Orientation Cognitive abilities Factors affecting speech production include gender and vocal effort (including the Lombard effect of naturally raising one’s voice in noise), language fluency and accent, and the orientation of the talker with respect to the listener. Factors related to non-speech sources include the acoustic power and directivity of the sound radiated, and its spectral and temporal characteristics. The sound reaching the listener is modified by the transmission characteristics of the surrounding environment including distance, reverberation and other room acoustic effects, and may be degraded due to interfering noise sources or competing sounds. Factors affecting auditory perception include the use of hearing protectors and their performance characteristics, binaural effects related to the spatial distribution of the signal and noise as well as the fluency, hearing status and cognitive abilities of the listener.
4
Many factors can contribute to increasing speech intelligibility from the talker’s perspective, including a slower speech rate, increased vocal intensity, increased pitch, and increased high-frequency spectral content (Pichora-Fuller et al., 2010). While some studies show that female speech is more intelligible than male speech (Bradlow et al., 1996; Markham and Hazan, 2004), Nixon et al. (1997) found female speech produced in some high aircrafts noise levels to be somewhat less intelligible than male produced speech. This male-female difference increased with noise levels. When in a noisy environment, talkers naturally raise their voices by about 1 to 6 dB for each 10 dB increase in the overall noise level; a phenomenon coined the Lombard effect (Lane and Tranel, 1971). While raised speech levels contribute to improving the signal-to-noise ratio (SNR) for effective communications, this advantage is altogether eliminated when passive HPDs are worn. Indeed, talkers wearing passive HPDs tend to produce lower speech levels by 1 to 6 dB in noisy backgrounds relative to an open-ear condition (Kryter, 1946; Howell and Martin, 1975; Martin et al., 1976; Hormann et al., 1984; Casali et al., 1987), thereby resulting in lower speech intelligibility. In engine noise levels ranging from 75 to 105 dB SPL, Kryter (1946) reported 1-2 dB drops in speech levels with earplugs, resulting in lower speech intelligibility for monosyllabic words. For monosyllabic words in a 93 dB SPL background noise, Howell and Martin (1975) found that talkers produced lower speech levels relative to an open-ear condition, by about 2.7 dB when wearing earmuffs and 4.2 dB when wearing earplugs, resulting in 15% and 26% decrements in intelligibility scores, respectively, for the listeners. In a lower background noise (54 dB SPL), however, intelligibility scores were near perfect and the difference in speech levels produced with and without HPDs were not as important, with a negligible reduction of 0.3 dB for earmuffs and 1.8 dB for earplugs. In another study, Martin et al. (1976) demonstrated that in noise levels ranging from 67 to 95 dBA, overall speech levels produced were 2-3 dB lower when wearing HPDs, which resulted in lower phoneme recognition, particularly when listeners also wore HPDs. When speech is produced in background noises, changes in speech spectra also occur relative to speech production in quiet, such as a shift in fundamental frequency and speech energy towards higher frequencies (Summers et al., 1988; Bond et al., 1989; Junqua, 1993; Letowski et al., 1993; Giguère et al., 2006). To investigate the effect of HPDs on the level and spectra of speech produced by men and women, Tufts et al. (2003) measured both the overall and one-third octave band levels of speech produced by 32 normally hearing participants in quiet and in pink noise (ranging from 60 to 100 dB SPL), in an open-ear condition and while wearing one of two different types of passive earplugs. Attenuation and occlusion effects provided by the HPDs were also measured. Analyses using the Speech Intelligibility Index (SII) (ANSI S3.5) were also performed to determine any gains or deficits in the accessibility of speech cues by listeners when the talkers wore earplugs. In quiet, overall speech levels were similar with and without earplugs. In noise, overall speech levels increased by 5 to 13 dB across the various ear conditions as noise increased from 60 to 100 dB SPL, yet not enough to maintain favourable SNRs. When wearing earplugs in noisy backgrounds, talkers produced significantly lower speech levels, and hence lower SNRs, by 4 to 11 dB relative to the open-ear condition. With increases in noise levels, talkers also produced greater high-frequency speech energy, although this effect was more pronounced without earplugs than with earplugs and in women compared to men. Finally, SII values were close to 1.0 (all speech cues

5
accessible) with and without earplugs in quiet, dropping to near zero values (no speech cue available) at the highest noise level (100 dB SPL). In noise levels ranging from 60 to 90 dB SPL, SII values were lower with than without earplugs. In summary, compared to an open-ear condition, talkers using earplugs in noisy environments produce lower speech levels, SNRs and SII values, and less high-frequency speech energy, factors which may all contribute to render their speech less intelligible. Speech produced by a non-native talker is less intelligible than speech produced by a native talker (Bürki-Cohen et al., 2001; van Wijngaarden et al., 2002; Rogers et al., 2004; Lecumberri and Cooke, 2006; Dame, 2013). For example, Dame (2013) showed that normal-hearing native speakers of American English had more difficulty understanding English sentences spoken by Chinese-Mandarin speakers, followed by Spanish speakers, and then German speakers, compared to American English speakers; and more so in a multitalker babble noise than in quiet. The degree of fluency with the language used at work can also impede speech communications as fluent/native listeners outperform non-fluent/non-native listeners on speech intelligibility measures. For example, in a task involving repetition of monosyllabic words by listeners with normal hearing or hearing impairment, both with and without HPDs, non-fluency resulted in about 10-20% decrements in speech intelligibility in comparable listening conditions (Abel et al., 1982). Relative to the performance of native listeners, van Wijngaarden (2003) demonstrated that non-native listeners required, on average, a 1 to 7 dB higher SNR for 50% correct sentence recognition. Fluency not only affects the SNR for 50% correct, but also the slope of the psychometric function relating speech intelligibility and SNR, making it shallower in non-native listeners. Overall, the detrimental effect of non-native listeners exposed to speech produced by native talkers is greater than the effect of native listeners exposed to speech produced by non-native talkers (van Wijngaarden, 2003; van Wijngaarden et al., 2004). This finding can be related to the ability to use contextual cues, which are particularly important when listening in noisy environments (Versfeld et al., 2000; Bronkhorst et al., 2002). It would therefore appear that native listeners exposed to speech produced by a non-native talker can make use of contextual cues to counteract the perceptual effects associated with poor speech production by the non-native talker (Bradlow and Pisoni, 1999; van Wijngaarden, 2003). However, non-native listeners cannot make as effective use of contextual cues as native listeners (Florentine et al., 1984; Mayo et al., 1997; Shimizu et al., 2002; van Wijngaarden, 2003, Lecumberri and Cooke, 2006). For example, Florentine (1985) showed that differences in speech intelligibility between native and non-native listeners were greater for high-predictability sentences (making use of contextual cues) than for low-predictability sentences. It is also generally accepted that the speech signal is optimized when talkers face listeners since both visual and auditory information are enhanced. However, the position of the talker relative to that of other sound sources is also critical, with speech intelligibility being optimal in conditions where target speech comes from a location in space that is distinct from that of competing signals (either other speech or noise) (e.g., Hirsh, 1950; Carhart et al., 1969; Dirks and Wilson, 1969; Plomp, 1976; Plomp and Mimpen, 1981; Bronkhorst and Plomp, 1988, 1992; Nilsson et al., 1994; Koehnke and Besing, 1996; Yost et al., 1996; Noble et al.,1997; Hawley et al., 1999; Freyman et al., 1999; Shinn-Cunningham et al., 2001; Vaillancourt et al.,
6
2005). The improvement in speech understanding, or spatial release from masking, is dependent on the spectrotemporal characteristics of the masker, its informational content (informational vs energetic masking) and listener characteristics such as age and hearing status (e.g. Arbogast et al., 2002, 2005; Best et al., 2005; Johnstone and Litovsky, 2006). Communication with hearing protection is a complex situation that can be influenced by most of the factors listed in Table 1. Hearing protectors can influence speech intelligibility by having effects on both talkers and listeners. A listening situation in which many contributing factors come into play to render speech communication difficult can be illustrated by a scenario in which a native talker wearing HPDs must communicate in high noise levels with a non-native listener with hearing loss also wearing HPDs. In addition, the specific contribution of the Lombard effect to speech communication in noise could vary significantly depending on the actual type of HPD used (passive vs active). The Lombard effect has been shown to be less pronounced with passive hearing protectors compared to an open-ear condition, a finding that is most likely attributable to the modified perception of the background noise and that of one’s voice related to both the occlusion effect and the attenuation provided by the HPD. It could however be anticipated that active HPDs with level-dependent amplification may help restore, at least to a certain degree, the amount of Lombard effect. The effects of both passive and active HPDs on speech perception and situational awareness are described separately in Section 2. Some active HPDs have radio capabilities. Communications carried over radio are affected by most of the factors above, but also include the characteristics and features of the pick-up microphone at the talker’s end, the quality of the radio transmission (especially distortions), and the acoustical characteristics of the communication signals presented to the listener in interaction with the environmental sounds passing through the passive or active hearing protection headset.
2.0 Auditory perception with personal hearing protective and communication equipment
This section reviews the effects of passive and active HPDs on situational awareness and communication at close range and far range. Close range refers to face-to-face speech communication and the detection or localization of surrounding sounds reaching the listener by acoustic propagation. Far range refers to speech communication through radio transmission or other non-acoustical transmission means between a remote talker and the listener.
2.1 Passive devices Passive HPDs block the sound reaching the listener’s ears by mechanical means. They attenuate sound through static passive means and provide a fixed amount of attenuation irrespective of the background noise level (except for a few specialized devices for impulse noise protection). The three main types (earmuffs, earplugs and helmets) can be combined to provide double protection, the most common being earmuff/earplug and helmet/earplug combinations.
7
2.1.1 Effects on situational awareness at close range Conventional passive HPDs may compromise auditory detection, sound localization, and speech understanding, particularly in individuals with a pre-existing hearing loss or under conditions of low signal levels and/or high attenuation.
Signal detection: In normal-hearing individuals, signal detection is generally not hindered when passive HPDs are worn (Wilkins and Martin, 1981, 1987; Casali et al. 2004); detection thresholds may even improve by 3-6 dB (Abel et al. 1985; Wilkins and Martin, 1987; Letowski and McGee, 1993; Vaillancourt et al., 2012). On the other hand, hearing-impaired individuals may experience decreased signal detection (Abel et al., 1985; Robinson and Casali, 1995; Lazarus, 2005). Sound localization: Passive HPDs generally have a detrimental effect on sound localization (Atherley and Noble, 1970; Noble and Russell, 1972; Russell, 1977; Noble, 1981; Noble et al., 1990; Abel and Armstrong, 1993; Abel and Hay, 1996; Berger and Casali, 1997; Nixon and Berger, 1998; Vause and Grantham, 1999; McKinley, 2000; Bolia et al., 2001; Simpson et al., 2005; Takimoto et al., 2007; Vaillancourt et al., 2012), resulting mostly from errors in the front/back dimension. Although earplugs have been demonstrated to be equally detrimental as earmuffs in some studies (Mershon and Lin, 1987; Alali and Casali, 2011), earmuffs generally yield significantly greater errors in localization than earplugs (Russel, 1976; Vaillancourt et al., 2012). By disrupting important pinnae cues, earmuffs interfere with localization in the vertical plane and in both the contralateral (left-right) and ipsilateral (front/back) dimensions of the horizontal plane, whereas earplugs seem to cause localization problems limited to the front/back dimension (Suter, 1989). Speech recognition: For noise levels greater than 80 dBA, properly selected passive HPDs do not generally affect speech perception in normal-hearing individuals, and may even yield some improvements (Kryter, 1946; Coles and Rice, 1965; Howell and Martin, 1975; Lindeman, 1976; Acton, 1977; Rink, 1979; Abel et al., 1982; Hormann et al., 1984; Suter, 1989; Berger, 2000; Starrs, 2001; Casali and Gerges, 2006; Casali, 2010a). However, earmuffs and earplugs can compromise speech communication in individuals with hearing impairment (e.g. Lindeman, 1976; Chung and Gannon, 1979; Abel et al., 1982; Suter, 1989; Suter, 2002; Giguère et al., 2010; Casali, 2010a), and in conditions of lower background noise levels for all users (e.g. Suter, 1989; Berger and Casali, 1997; Verbsky, 2002; Casali, 2010a). 2.1.2 HPD selection and modelling Some standards (CSA Z94.2; EN 458) recommend selecting HPDs so that protected levels fall 5-10 dB below the occupational limit. This goal is however often difficult to achieve in practice as HPD attenuation varies widely across individuals (ear geometry, fitting proficiency, motivation, etc.) and is poorly related to current HPD performance ratings and labelling (Williams, 2009), and because workplace noise is rarely constant over time or

8
uniform spatially, resulting in possible periods of overprotection and of insufficient protection within a given day. McBride et al. (2009) assessed the effectiveness of HPDs using various indices other than the usual Noise Reduction Rating (NRR). Progress has also been made towards the development of predictive models of speech intelligibility in noise applicable to normally-hearing and hearing-impaired individuals wearing passive HPDs, most of which use some objective measure such as the Speech Interference Level (ANSI S3.14-1977) (Kotarbinska and Kozlowski, 2005), the Articulation Index (ANSI S3.5-1969) (Wilde and Humes, 1990) and the Speech Intelligibility Index (ANSI S3.5-1997) (Giguère et al., 2010). In general, good prediction of speech recognition in noise with HPDs requires both audibility and supra-threshold effects (e.g. SNR loss) to be taken into account. 2.1.3 User acceptance There is generally a poor acceptance of passive HPDs among workers in industry (Suter, 1992; Morata et al., 2001, 2005; Prince et al., 2004; Neitzel and Seixas, 2005) and the military (Abel, 2004; Okpala, 2007; Abel, 2008). HPDs are sometimes incompatible with other protective equipment, difficult to fit, uncomfortable, and often judged to be impeding communications by interfering with sound detection, sound localization and speech understanding (Prince et al., 2004; Abel, 2008). Workers generally view HPDs as an inconvenience, and as a barrier to information exchange and work performance, especially in the presence of a pre-existing hearing loss (Abel, 2008; Canetto, 2009; Casali, 2010a). 2.2 Active devices
To counteract some of the shortcomings of conventional HPDs, new devices have been designed and marketed. Following the terminology introduced by Casali (2010a,b), they broadly fall into two distinct classes: passive and active augmented HPDs. The term “augmented” refers to features, options or fittings not found in conventional HPDs. Passive augmentations to HPDs (such as flat attenuation curves or selectable filters) do not rely on powered electronics, while active devices do. Active augmentations to HPDs are of special interest here since they lend themselves to advanced communications devices with integrated hearing protection. Active HPDs aim to achieve one or more of the following objectives: increase the protection afforded over the passive attenuation of the device by means of active noise reduction (ANR) or phase-cancellation technology, enhance awareness of sounds in the surrounding environment through level-dependent attenuation, and incorporate radio channel capabilities for remote communications. Design considerations related to ANR capability, level-dependent attenuation and integrated communication devices are detailed in Giguère et al. (2011a).
9
2.2.1 Effects on situational awareness at close range Most reports on active HPDs have focussed on attenuation characteristics, with relatively few, independent, field and laboratory studies assessing their benefits or drawbacks on auditory tasks and operational performance compared to conventional HPDs or unprotected listening.
Sound detection and identification: Active level-dependent HPDs can provide benefits over conventional HPDs for sound detection and distance detection in quiet and in low background noise levels (Abel et al., 1991, 1993; Casali et al., 2009; Alali and Casali, 2012; Giguère et al., 2012), as expected due to their lower attenuation at low levels. When used at high amplification settings, they may even result in improved hearing thresholds compared to unprotected listening for hearing-impaired listeners (Abel et al., 1993), a benefit somewhat limited by the amount of audible masking hum from the device electronics for normal-hearing listeners (Abel and Giguère, 1997). This advantage over conventional HPDs does not seem to occur in high background noise levels or with devices, such as ANR without level-dependency, that provide increased sound attenuation (Abel and Spencer, 1997; Casali et al., 2004; Nakashima et al., 2007). In high noise levels, active HPDs yield similar detection thresholds to those measured unoccluded or with passive HPDs (Casali and Wright, 1995; Giguère et al., 2012). Sound identification may also, in some situations, be superior with active level-dependent HPDs compared to passive HPDs (Lindley et al., 1997). Sound localization: Generally speaking, sound localization abilities are best unoccluded (Abel and Armstrong, 1993; Abel and Hay, 1996; Abel and Paik, 2005; Brungart et al, 2007; Borg et al., 2008; Giguère et al., 2012; Talcott et al., 2012), with decrements in performance with active HPDs being largely due to front/back reversal errors (Noble et al., 1990; Abel et al., 2007; Abel et al., 2009; Borg et al., 2008; Talcott et al., 2012; Abel et al., 2015) and errors in the vertical plane (Noble et al., 1990). For example, Abel et al. (2015) measured sound localization in the horizontal plane in normal-hearing individuals using the passive (OFF) and active (ON) modes of three level-dependent communication devices with integrated hearing protection. While means scores were greater than 90% unoccluded, performance dropped to below 50% with the devices in the OFF mode, with errors mainly consisting of front/back confusions. In the ON mode, an improvement of 21% to 33% was noted. Moreover, no effect of volume was found. Reaction times can also be longer with active devices compared to unprotected listening, particularly with active earmuffs (Carmichel et al., 2007; Talcott et al., 2012). When assessing spatial awareness compared to conventional HPDs and ANR devices, active level-dependent devices have been shown to be less detrimental (Abel et al., 2007; Abel et al., 2009; Talcott et al., 2012), more detrimental (Brungart et al., 2007), or equally effective (Alali and Casali, 2011; Giguère et al., 2012). Diotic earmuffs are especially disruptive to sound localization, owing to the loss of binaural cues when feeding a single microphone signal to both ears (Noble et al., 1990; Alali and Casali, 2011). Substantial differences noted across studies may be largely due to methodological aspects (stimuli, speaker array, head movements, tested devices etc.). For example, head movements
10
seem to reduce front/back confusions (Giguère et al., 2012), sometimes yielding no sizeable decrements in localization performance compared to unprotected listening (Casali and Alali; 2010; Alali and Casali; 2011). All in all, only few studies have found that some active HPDs, particularly earplugs, seem to preserve sound localization performance or restore it to unprotected values (Borg et al., 2008; Casali and Alali, 2010). Speech recognition: The effect of active HPDs on speech recognition is highly dependent on the hearing status of the individual, the background noise levels and the volume setting of the device. For listeners with normal hearing exposed to quiet or low noise levels (55-75 dB SPL), active level-dependent HPDs can provide improved speech intelligibility over conventional HPDs (Arlinger, 1992; Abel et al., 1993; Bockstael et al., 2011), even yielding performance similar to (Maxwell et al., 1987; Abel et al., 1993; Norin et al., 2011) or better than (Arlinger, 1992) that obtained unprotected. Moreover, lower levels of amplification may prove more beneficial than higher levels of amplification (Azman et al., 2011; Bockstael et al., 2011; Giguère et al., 2011b), possibly due to distortion effects. Passive protectors can however outperform active HPDs (Abel et al., 1993; Plyler and Klumpp, 2003; Bockstael et al., 2011), particularly in louder noise levels (Bockstael et al., 2011). In one study, this finding was attributed to greater masking of high-frequency information by residual low-frequency noise with the active HPD (Plyler and Klumpp, 2003). Few studies have examined short range communication by hearing-impaired listeners using active HPDs. Abel et al. (1993) found that word recognition was negatively impacted compared to unprotected listening with active level-dependent earmuffs and their conventional counterparts, in quiet and in noise, but to a lesser degree in quiet with the active level-dependent earmuffs. Giguère et al. (2011b) measured speech intelligibility in normally-hearing and hearing-impaired individuals with level-dependent HPDs in their passive and active modes. Normal-hearing participants were unaffected by the passive attenuation of the device, but participants with hearing loss were negatively affected by an amount dependent on the degree of the loss. When the device was used at a low gain setting, performance was better than unprotected for all subject groups except the one with the most severe hearing loss. At a higher gain setting, all subject groups showed performance matching that unprotected, indicating that the level-dependent gain function restored speech perception for a very wide range of hearing profiles.
2.2.2 Effects on speech communication at far range Speech transmitted directly through the communication channel of a communications device reaches the ear unmodified, while the external background noise undergoes passive, ANR and/or level-dependent attenuation. Research in this area has primarily focused on the potential benefits of ANR circuitry and on optimal volume settings in communication headsets to achieve superior speech intelligibility and clarity while minimizing overall sound exposure for the user. While no effects (Bolia, 2003) or only small benefits (Nixon et al., 1992; Williams et al., 1995; Anderson and Garinther, 1997; Rogers, 1997; McKinley, 2000) on speech recognition

11
have been reported for ANR ON compared to ANR OFF, in general performance with ANR devices is superior to standard communication headsets (Anderson and Garinther, 1997; Mozo and Murphy, 1997; McKinley, 2000; Ribera et al., 2004). ANR was also found to reduce the number of transmissions required for correct command read-backs and to decrease perceived mental workload (Valimont et al., 2006). More importantly, ANR devices at the ON position can significantly reduce at-ear levels compared to ANR OFF and to standard aviation/combat helmet configurations (Anderson and Garinther, 1997; Rogers, 1997; Simpson and King, 1997; McKinley, 2000; James, 2005), and lead to lower preferred listening volumes (Anderson and Garinther, 1997; James, 2005). Better performance for radio communications has also been reported with communications earplugs over standard helmets (Mozo and Murphy, 1997; Ribera et al., 2004). All in all, many factors can contribute to improved communication through the radio channel of active HPDs and communications devices, including increased radio volume (Abel et al., 2011), visual cueing (Abel et al., 2012) and spatial audio presentation of the signals (Abouchacra et al., 2001; Bolia, 2003). 2.2.3 User acceptance It is generally believed that by improving communications and situational awareness, active HPDs would be preferred over passive HPDs. In three studies addressing user acceptance (Ong et al., 2004; Tufts et al., 2011; Williams, 2011), active devices were indeed rated higher on items of perceived communications and situational awareness, and judged more effective in reducing unwanted noise. Inconsistencies across these studies were, however, noted in relation to perceived usability and comfort, two factors which can highly impact the use of any advanced active HPD device. Practical issues related to radio communications were also raised (Tufts et al., 2011), for example shutdown of the talk-through mode during radio transmissions and need for ear piece to be inside the ear to communicate for some types of devices. 2.3 Outlook Technologies found in active HPDs and communications devices are rapidly evolving and rely progressively more on advancements in the fields of digital signal processing and hearing aids. New HPD technologies are targeting better noise reduction/cancellation algorithms (Lin et al., 2005; Chung, 2007; Chung et al., 2009; Schumacher et al., 2011; Pawelczyk et al., 2011a,b; Pawelczyk and Mielcarek, 2012), binaural technology to enhance divided listening attention (Giguère et al., 2000; Abouchacra et al., 2001; Bolia, 2003), the use of bone conduction communication systems for tactical operations (McBride et al., 2008a,b, 2011), and even frequency-specific latency times to enhance sound localization (Evelkin and Cohen, 2012). New algorithms have also been developed to automatically detect alarm signals (Carbonneau et al., 2012) and to automatically adjust the gain within the communication channel based on measured in-ear sound levels to yield adequate SNRs while limiting noise exposure (Bernstein et al., 2012). While progress is being made in a number of areas, to our knowledge, no device is yet sufficiently engineered to restore reliably situational awareness equivalent to that unprotected in
12
all situations and for all individuals. This is further complicated by the need for HPDs and communications devices to be compatible with communication over short distances and radio communications. Subjective impression by users is generally favorable to active level-dependent and ANR devices over passive protectors (Casali et al., 2007, Williams, 2011; Tufts et al., 2011). However, only a limited subset of the factors listed in Table 1 has been investigated thus far, often for very specific listening situations or work occupations, and it has been difficult to generalize outcomes over different or even similar test conditions. One impediment to future progress is the sparse and widely disparate disclosure of electro-acoustic technical data by manufacturers of active HPDs and communications devices, in sharp contrast to hearing aid manufacturers. Some progress is expected since the promulgation of standard ANSI/ASA S12.42-2010; however, this new standard only focuses on the noise attenuation characteristics of the devices. Important parameters for situational awareness, such as the directional characteristics of microphones, compression parameters, internal noise, and harmonic distortion of pass-through and communication channels, are not addressed. Hence, it remains difficult to associate listening outcomes to specific technical parameters of the devices. This is needed to develop predictive models and tools to assist in the selection of the most appropriate device for specific situations of noise or hearing loss, as may be done, for example, for conventional HPDs (Giguère et al., 2010).
3.0 Rationale
The design and evaluation of advanced hearing protection devices with integrated communication capabilities have largely been driven by the military field. By and large, such research was conducted using fluent listeners with normal or near-normal hearing profiles. In the Canadian Forces, two common situations can contribute to the challenge of communicating in high noise levels during tactical operations: fluency with the language used, and hearing loss among the service personnel. According to the Statistics Canada July 2008 issue of Perspectives on Labour and Income (http://www.statcan.gc.ca/pub/75-001-x/2008107/article/10657-eng.htm#Sudom), the proportion of Canadian Forces personnel that are bilingual is about twice that found in the general working population, with more than 40% speaking both official languages. Despite such encouraging news, the fact remains that a large proportion of the personnel are monolingual, primarily English speakers. As in any other workplace environment where one language is more frequently used, communications in the Canadian Forces, particularly during tactical operations, are therefore likely to occur in English. Furthermore, Canadian Forces often participate in NATO operations and other multi-country deployments where the issue of language fluency is omnipresent. Non-fluency with the language used in the workplace can impede speech communications as fluent/native listeners consistently outperform non-fluent/non-native listeners in laboratory experiments (e.g. Abel et al., 1982; Florentine, 1985; Shimizu et al., 2002; van Wijngaarden, 2003). While sampling noise-induced hearing loss among the Canadian Forces personnel, Abel (2005) found hearing thresholds exceeding 20 dB at 4 and 6 kHz in 15% of the youngest individuals (16-25 years old) and in 60% of those older than 45 years old. Of importance, the

13
proportion of individuals over 45 years of age with hearing thresholds exceeding 36 dB HL was at least twice the proportion that is expected from published norms for otologically normal persons. Furthermore, 42% of service members showed at least a mild hearing loss and 26% developed a moderate to severe hearing loss by midlife. In addition to signal audibility issues, hearing loss is often associated with supra-threshold deficits directly impacting on speech communication in noise. As hearing loss and non-fluency can reduce speech intelligibility, potentially leading to reduced performance and efficacy, and even miscommunications, particularly in high noise levels and when using hearing protection equipment, both factors must be taken into consideration in research studies aimed at the Canadian Forces. A previous study (Giguère et al., 2011b) investigated the effects of hearing loss on speech perception with active level-dependent hearing protectors using a wide range of listeners from normal hearing to moderately-severe hearing losses. However, only a few studies investigated the effects of hearing loss in conjunction with radio communication equipment (Ribera et al., 2004; Casto and Casali, 2012). Also, apart from the earlier study of Abel et al. (1982), language fluency seems to have been given little attention in the wider hearing protection literature. The present study extends the work performed by Abel et al. (2011) on the effects of volume control on speech understanding over two integrated HPD communication devices. In that study, talker-listener pairs of English speakers with normal hearing participated in a speech communication task involving the recognition of consonant-vowel-consonant words (CVCs) at several radio volume settings while exposed to a babble noise adjusted at 85 dBA in surround/talk-through ON listening. To control for the effects of fluency and gender, only participants proficient in speaking and understanding North American English were tested in same gender pairs. In addition to participants with normal hearing and highly proficient in English, the present study also comprises individuals with hearing loss or with varying levels of fluency in English. 4.0 Methods 4.1 General This research builds on our previous studies and contract reports DRDC Toronto CR 2008-178 and CR 2011-101 on the effects of passive conventional (Giguère et al., 2008) and powered level-dependent hearing protection devices (Giguère et al., 2011b) on speech perception in noise. The focus of that work was on face-to-face speech communication at close range through the protection devices, with individuals with normal hearing or with hearing loss. The present work is carried out through the radio channel of integrated hearing protection and communication devices, and involves individuals with varying degrees of hearing loss or English language proficiency. As in Abel et al. (2011), participants were tested in pairs to establish a two-way radio transmission between a talker and a listener. Three groups of individuals participated. In the first group (control), both members of each pair were native English-speaking individuals with normal hearing. In the second group (fluency), one member of each pair was a native English-speaking individual with normal
14
hearing, while the second member had normal hearing but English as a second or third language. In the third group (hearing loss), all the individuals were native English-speaking, but one pair member had hearing loss while the other had normal hearing. In all three groups, only same gender pairs (male-male, female-female) were tested to limit the number of conditions. As noted, across all groups one member of each pair was a native English-speaking individual with normal hearing. To limit the total number of participants and increase consistency for group comparisons, one female English-speaking individual with normal hearing (referred to as Standard Female – SF) and one male English-speaking individual with normal hearing (referred to as Standard Male – SM) acted as standard participants and interacted with all other participants of the same gender. The experiment was carried out in English and involved both objective speech intelligibility measurements and a subjective assessment of the quality of the radio communication in each condition. Two different integrated hearing protector headsets with radio communication capabilities were tested. The same external radio was used with both headsets to reduce confounding factors. To investigate the effects of noise on the talker’s speech production levels (Lombard effect) and the effects of noise on speech perception by the listener (masking), both talk-through ON and OFF conditions were investigated with the headsets. Both these conditions are likely to be used in tactical radio communications, depending on whether or not auditory awareness is also required in the immediate surroundings of the user. For the present experiment, the radio volume was left under the control of the participants to emulate typical conditions of use in the field where military personnel have control over the radio reception. The effect of only a single background noise was tested in order to limit the total number of experimental conditions to a practical size while concentrating on the variables of greatest interest: fluency or hearing loss in interaction with the talk-through settings for two devices. The effects of noise type have been extensively considered in two previous contracts on conventional and level-dependent hearing protectors (Giguère et al., 2008; 2011b). Furthermore, recent research indicates that the effect of different noises can be predicted with good accuracy using objective methods, such as the speech intelligibility index (Giguère et al., 2010) for mostly steady-state noises or the extended speech intelligibility index (Rhebergen et al., 2008) for fluctuating noises. 4.2 Participants The research protocol was approved by the Research Ethics and Integrity at the University of Ottawa (File Number: H04-13-11B). Participant recruitment was carried out by means of posters displayed at various locations, including the University of Ottawa, audiology clinics, community centres, medical centres, and Department of National Defence (DND) offices in Ottawa. Prior to their participation, individuals were required to read an information letter, sign a consent form and fill out a hearing history questionnaire. Participants were tested in same gender pairs, each member serving in turn as the talker and listener during a speech communication task to assess the intelligibility and sound quality of radio messages over tactical communications devices. As previously stated, a standard female and male participant (SF or SM) was paired with all other participants of the same gender.

15
Overall, the study was carried out using three groups, for a total of 38 participants (18 females, 18 males, one SF and one SM) as shown in Table 2. Half the pairs within each group were males and the other half were females. The SF/SM interacted with each participant of the same gender in separate testing sessions, acting first as talker then as listener. Results were analyzed separately for the situation where the F/M participants (those making up the three experimental groups) acted as listeners (with SF/SM as talkers) and for the situation where they acted as talkers (with SF/SM as listeners). In this study, normal hearing was defined as hearing thresholds 15 dB HL in the speech frequency range (0.5-4 kHz) and 25 dB HL at 0.25 and 6-8 kHz. Hearing loss was defined as a hearing impairment of sensorineural origin ranging from mild to moderate, with a five-frequency (0.5, 1, 2, 3, 4 kHz) pure-tone average (PTA) between 25 dB HL and 55 dB HL in the better ear. The extent of asymmetrical hearing configurations was limited in the study. The exclusion criteria were an interaural difference of at least 15 dB HL at two frequencies or a difference of at least 25 dB at one frequency (Schlauch and Nelson, 2009). All individuals were required to have normal results for otoscopy and tympanometry (static compliance = 0.30 – 1.70 cm3; ear canal volume = 0.9–2.0 cm3; gradient = 51–114 daPa; pressure = -150 to +50 daPa) (Martin and Clark, 2003).
Table 2: Participants in each group
Group Characteristics Standard Female – SF (Normal-hearing, Fluent)
Standard Female – SM (Normal-hearing, Fluent)
Con
trol
Normal-hearing, Fluent participants 6 females (F) 6 males (M)
Non
-flu
ent
Normal-hearing, Non-fluent participants 6 females (F) 6 males (M)
Hea
ring
loss
Hearing-impaired, Fluent participants 6 females (F) 6 males (M)
Selection criteria for participants designated as fluent in English were: (1) having learned English before the age of 11 years, and (2) obtaining a score of 36 or more on the Skylark School Test of English Fluency (http://www.skylarkmalta.com/en/online-tests.htm). The Skylark test is an online test consisting of 40 statements (e.g. “My Father is ____ doctor”) for each of which individuals must select the correct alternative from among four multiple choice answers (in this case: “a, an, the, one”). The test must be completed within 20 minutes. A score of 36 or more corresponds to an advanced level of fluency. Selection criteria for non-fluent participants were: (1) having learned English after the age of 11 years, and (2) obtaining a score of 28 or less on the Skylark test. A score of 28 or less covers beginners up to individuals with an intermediate level of fluency in English. Individuals scoring between 29 and 35 on the Skylark (upper intermediate) were not included in the study to ensure a sufficient gap in fluency between the two groups.
16
Speech testing was also performed in the Noise Front condition of the English version of the clinical HINT (Nilsson et al., 1994). The HINT protocol consists of sentences presented in a continuous speech-spectrum noise. Performance on the HINT is compared to normative data (Vermiglio, 2008) to document basic speech perception abilities. Scores falling outside of the normal range of results is indicative of either hearing loss or non-fluency in English. Results on the HINT speech test were not used for participant selection purposes, but to further characterize the participant groups. 4.3 Noise As discussed in Section 4.1, the effect of only one background noise was investigated. The noise file was constructed to embody the complexity of military acoustic environments where integrated hearing protection and communication headsets may be deployed. Such devices can be used in-vehicle, which is typically characterized by continuous-type background noises, as well as on the battlefield, which is typically characterized by transient and impulse sounds. To include both classes of noise into a single noise file for the experiment, two different recordings were mixed in equal proportions. The first recording was a continuous noise (Bison vehicle in idling engine mode), available from previous projects (Noise 2 in DRDC Toronto CR 2008-178 and CR 2011-101). This noise is very stable and is a good representation of continuous noise when the personnel are in and around a light armoured vehicle. The second recording was meant to combine explosions, gun shots and other military noises representing the battlefield a distance away from the vehicle. Such a recording was not available to the researchers and requests within the Canadian Forces only uncovered time-amplitude traces (but not audio format) of individual weapons at close range. Individual impulses from military equipment can reach very high peak levels exceeding 150 dB SPL and are unsuitable for audio reproduction in a laboratory, given the technical demands on the loudspeakers and the ethical considerations of testing with human participants. Also, the mixing of such individual impulses from different weapons into a realistic representation of the complexity of the battlefield is not easy to achieve. Instead, several databases of military noises accessible online were searched to uncover a recording that would be suitable to convey a rich blend of military impulse sounds. The most extensive set was found at the Sounddogs website (http://sounddogs.com). It supplies a wide array of military noises, including noises from blended operations involving gunfire, explosions and airplane flyover. Four candidate recordings are listed in Table 3.

17
Table 3: Candidate recordings for the transient/impulsive component of the combined noise
Filename Description Time (s)
Battelfield01 BATTLE, MILITARY - WAR SCENE: HEAVY GUNFIRE, EXPLOSIVE BACKGROUND 121
Battelfield021 WAR - AIRPLANES - STUKAS - EXPLOSIONS - CHAOS (V2) 128
Battelfield03 BATTLE, MILITARY - MILITARY BATTLE AMBIENCE: GUNFIRE, EXPLOSIONS 119
Battelfield042 BATTLE MILITARY MILITARY BATTLE- GUNFIRE MORTAR AND ARTILLERY EXPLOSIONS 49
1 Battelfield02 is the second segment of a dual recording (2 recordings separated by a 1-second segment of silence in the original file). The first segment includes a continuous tonal sound in the background (perhaps an alarm sound), which results in pronounced spectral harmonics. Only the second segment of the recording is considered.
2 Battelfield04 has been trimmed to 49 seconds. The 10 seconds at the end of the original recording includes a long fade-out effect.
The acoustical characteristics of the continuous Bison vehicle noise and the candidate transient noises are reported in Section 5.1. Battlefield 3 was selected for the transient/impulsive noise, and the combined Bison-Battlefield3 noise is presented at a sound field level of 85 dBA at the position of the participants. The noise is a 119-s long segment looped continuously and seamlessly during the experiment. 4.4 Headsets The headsets used in this study had to be compatible with two-way radio communication, either through a built-in interface or via a connection to an external radio (military PRR or commercial radio). The volume level of the radio channel had to be adjustable. The devices also had to be rated for sound attenuation, in accordance with national or international standards, and allow talk-through mode listening (ON/OFF), preferably with a device-adjustable gain. The devices also had to be designed for tactical or military applications.
The candidate devices listed in Table 4 were considered for selection for the study. Sales representatives were contacted to obtain more information on the devices in order to identify the two best candidates. The Sensear SM1 earmuff and Sensear SP1 earplug devices were eliminated because their primary application is industrial not military. The Peltor Ora Tac and Phonak Primero in-the-ear devices were suitable for industrial/tactical applications, but also unlikely to be used in military battlefield operations. The Peltor PowerCom Plus earmuff has a built-in radio which adds a confounding factor and is based on older analog technology. As outlined in Section 4.1, the plan was to use the same radio unit with both integrated communications devices to be tested. Questions arose as to whether the Peltor PowerCom Plus would be suitable in the battlefield, since it was not profiled to fit under military helmets. The Silynx Micro C40PS was also discarded due to unfavorable results in a previous study (DRDC Toronto TR 2009-074).

18
By comparison, the Threat4 X-62000 in-the-ear communications device was specifically designed for military applications and has recently received a 3.9/4.0 rating for battle readiness in a recent August 2013 report prepared by the U.S. Army Evaluation Center http://www.threat4.com/AEWE_Spiral_H_Analysis_Report_Signed.pdf. Threat4 is a Canadian-based company (Markham, Ontario) seeking to focus future developments on the needs of individuals with noise-induced hearing loss. The X-62000 is itself closely based on hearing aid technologies, making it suitable to include prescriptive gain functions in the future to address individual needs. Furthermore, the X-62000 device includes talk-through (five available gain settings from 0 dB to +12 dB plus muted OFF mode) and two-way radio capabilities (no built-in volume control, volume must be controlled through the external radio unit). It is compatible with a wide range of commercial and military radios. The device is typically used with Comply™ (Oakdale, Minnesota) foam canal tips, available in three sizes. Based on these features and capabilities, the Threat4 X-62000 was selected as one of the two devices for the study. The certified attenuation with foam canal tips has a Noise Reduction Statistics for A-weighting (NRSA) of 32-39 dB (ANSI/ASA S12.68-2007 R2012). The second device for inclusion was the QuietPro QP400 by Honeywell Safety Products, a successor to the NACRE QuietPro QP+, a reference in the field of tactical communication headsets. Speech perception in noise through the level-dependent talk-through circuitry (Giguère et al., 2011b) and the two-way radio transmission (Abel et al., 2011) has been investigated with good success in precursor studies, and selecting this device provides a natural continuity in the research program. The QP400 device offers independent control of the talk-through circuitry (10 available gain settings plus muted OFF mode) and two-way radio volume reception. One problem with the original QP+ product was the difficulty experienced in fitting the canal tips in many individual ear canals and/or lack of comfort, which led to wide variations in the passive attenuation achieved (Giguère et al., 2011b). Of note, the canal tips have been redesigned with the launch of the new QP400 device. The new foam tips, available in four sizes, are softer and deemed easier to fit over a wider range of individual ear canals. The manufacturer-rated noise reduction rating (NRR) with these canal tips is 27 dB (ANSI S3.19-1974).
Table 4: Candidate devices
Device Primary application Type
Talk-throughlistening
Com
Honeywell QuietPro Tactical/Military In-ear Yes Ext radio Sensear SM1 Industrial In-ear Yes Ext radio Sensear SP1 Industrial Earmuff Yes Ext radio
Peltor PowerCom Plus Industrial/Tactical Earmuff Yes
Ext radio or Built-in radio
Peltor Ora Tac Industrial/Tactical In-ear Yes Ext radio Phonak Primero
DCP+ Tactical In-ear Yes Ext radio
Threat 4 X-62000 Tactical/Military In-ear Yes Ext radio Silynx Micro C40PS Tactical/Military In-ear Yes Ext. radio

19
The two devices are illustrated in Figure 1. While both devices are in-ear units, there is an important difference in the way the talker’s voice is picked up before radio transmission. Voice pick-up with the Threat4 X-62000 is through an external directional boom microphone placed in front of the mouth, while the voice is picked up with a miniature microphone inside the talker’s ear canals in the case of the QuietPro QP400. Both methods have pros and cons. A boom microphone generally provides the best speech quality, but may be subject to external noise contamination. Speech recorded inside the ear canals arises from the vibration of the structures of the vocal apparatus transmitted via bone conduction, which produces muffled speech due to a gradual loss of high frequency information above 1000 Hz, but the attenuation provided by the canal tips is such that the speech signal is less contaminated by the external noise. Selection of two in-the-ear devices, as proposed above, provided the opportunity to compare the effects of both methods of voice pick-up on speech communication in noise through radio transmission.
Figure 1: Selected in-ear devices. Left: Threat4 X62000, Right: QuietPro QP400
4.5 Two-way radio
A single pair of radio units was used for the experiment, i.e., the same pair for the two selected headset devices, to minimize confounding factors. Unfortunately, no radio could be found to have discrete volume steps or a numbered scale, which would have been ideal from an experimental perspective in order to track down the preferred volume setting used by the participants in each condition. After discussion with communication radio distributors and sales representatives from Threat4 and Honeywell, the Motorola XPR6550 was selected. This radio is a high-end commercial radio used in security/enforcement applications and is compatible with both the Threat4 X62000 and QuietPro QP400 headset devices. The XPR 6550 radio can be operated in either analog or digital modes. The digital mode was used in this experiment. The Motorola XPR 6550 radio is illustrated in Figure 2. The volume button is continuous. A bar display of the volume level is shown on screen (Figure 2 middle panel); however, the bar display appears for too short a time to be noted accurately. Instead, for this experiment, the volume setting was noted in terms of the rotation of the volume button from the lowest position at power off (0) to full volume (6) in steps of 0.5, the dents and grooves on the actual radio volume button serving as references (Figure 2 right panel).

20
Figure 2: The Motorola XPR 6550 radio. Left: full unit, Middle: radio volume bar display, Right: radio volume button 4.6 Electroacoustic testing An objective method using a standardized manikin (ANSI S3.36-1985 R2006) was employed to obtain accurate gain estimates of the headsets at different talk-through and radio volume settings. A similar approach was taken in a previous study (Giguère et al., 2011b). Electroacoustic gain was measured objectively using a Head And Torso Simulator (HATS) (Type 4128; Brüel & Kjaer Sound & Vibration Measurement A/S, Naerum, Denmark) connected to a microphone power supply (Type 2804; Brüel & Kjaer Sound & Vibration Measurement A/S, Naerum, Denmark) and sound level meter (Type 2250; Brüel & Kjaer Sound & Vibration Measurement A/S, Naerum, Denmark). The latter was equipped with the Frequency Analysis Software module BZ 7223, allowing third-octave and one-octave band measurements.
Figure 3: Setup for gain and frequency response measurements of the headsets on the manikin

21
Speech spectrum noise was used to test level-gain functions at incident levels ranging from 40 dBA to 95 dBA for different talk-through settings. Pink noise was used to obtain frequency-gain functions. These stimuli were presented directly in front of the manikin at a 1-m distance, as shown in Figure 3. Sound measurements were made at the ear-simulator microphone in the right ear of the manikin without (open ear) and with each communication device in place (occluded ear). These measurements enabled characterization of the talk-through circuitry of the headsets, and were useful for determining suitable talk-through settings for the experiment. 4.7 Experimental set-up and material Testing took place at the Research Unit on Noise and Communication at the University of Ottawa. A Welch Allyn otoscope and a Grason-Stadler (GSI 38 Auto tymp) impedance meter were used to assess the integrity of the external ear canal and middle ear function. Audiometric measurements were carried out using an Interacoustics AC40 Audiometer, EARTONE 3A insert earphones and a Radioear B-71 bone conductor. The HINT screening protocol was administered using the HINT for Windows software, a PC connected to an external sound interface and TDH earphones. These tests were carried out in a standard IAC audiometric room. Speech communication testing through the radio channel of two communications devices was performed in a versatile acoustic simulation room (Figure 4). Full details of the test facilities, equipment and calibration procedures can be found in technical report DRDC Toronto CR 2008-178 (Giguère et al., 2008).
Figure 4: Layout of the simulation room and loudspeakers (S1-S7) for the background noise

22
Both participants (listener and talker) were submerged in the same diffuse background noise described in Section 4.3, each using the communications device under test. During the testing session, one member of each pair started by reading speech material from the Modified Rhyme Test (MRT) test, while the other member reported what was heard through the radio communication channel, by circling the correct word on a score sheet displaying the six possible word options for each utterance. Talker and listener roles were then reversed. The two members of a pair were seated near one another but facing away, as shown in Figure 4. Prior tests with the listener’s radio turned off showed that the listener was unable to understand the acoustically-transmitted speech from the talker in any experimental condition, given the masking effect of the background noise at a level of 85 dBA. This confirmed that speech communications occurred through radio transmission only. The MRT uses 300 English CVCs organized into 50 sets of six words differing only in the initial (25 sets) or final consonant (25 sets) sound. Listeners are shown a six-word list (6-alternative forced-choice) and must identify the word spoken by the talker within a carrier sentence “Mark the word _____ now” (ANSI/ASA S3.2-2009). Scoring is based on correct target word identification and can also include the frequency of particular confusions of consonant sounds. An example MRT score sheet, modelled after Kreul et al. (1968) and made available through the Project Authority, is shown in Appendix B. For the purposes of this experiment, four different word lists were constructed using the 300 CVCs. For each list, six different versions were used, so that each target word within a given block of six words was selected only once. 4.8 Experimental protocol
The experimental protocol was split into two parts: (1) screening and (2) tests of speech communication to assess the intelligibility and sound quality of radio messages in noise over tactical communications devices. The first part, the screening, included: (1) a self-assessed fluency questionnaire, (2) completion of the Skylark School Test of English Fluency, (3) otoscopy, (4) tympanometry, (5) measurement of hearing thresholds, and (6) speech testing in the Noise Front condition of the English HINT. During threshold measurements, pure tones of different frequencies were presented using insert earphones or a bone vibrator and participants were required to say “yes” (or press a button) each time a signal is heard. During HINT testing, participants were instructed to repeat sentences presented over headphones in a 65-dBA noise in a simulated condition of frontal incidence. The second part consisted of the listening tests performed through the radio channel of the two selected communications devices. The same procedures were used across all pairs (F/M participant and SF/SM) making up the three groups listed in Table 2. A total of four experimental conditions were presented (2 device units x 2 talk-through operational modes). For each experimental condition, the participant always acted first as the listener, and the SF/SM acted as the talker, with roles being reversed after a completed 50-word list. Talkers were instructed to speak at the most natural vocal effort in the noise/headset scenarios to which they were exposed. The talker uttered the target words (one CVC for each of the 50 six-

23
word sets comprising the MRT), within the carrier sentence over the radio channel, and the listener was required to circle the word perceived, among a closed set of six phonemically similar CVCs differing in initial or final consonant. Each listener was initially asked, during practice items (usually five items), to set the radio volume to a level deemed appropriate for optimal radio communications in the presence of the background noise. Practice was repeated until the listener was satisfied with the chosen radio volume and was ready to start, at which point no further adjustments in volume settings were allowed. Practice also allowed the talker to practice consistency in vocal output and timing. At the end of the list, the listener was asked to rate the quality of the speech communication using the mean opinion score (MOS), a 5-level scale commonly used in the telecommunication industry (ITU-T Recommendation P.800, 1998). The experimenter also noted the radio volume (0-6) set by the listener, and the talker-listener roles were reversed using a new word list. As this procedure was repeated for two talk-through operational settings (muted OFF, ON at neutral gain) for each of the two tested headsets (4 experimental conditions), and that both members of the pair acted alternately as talker and listener, speech communication was assessed using a total of eight lists for each pair. The MRT lists and order of conditions were randomized across participant pairs. 4.9 Data Analysis Following each of the four experimental conditions (2 device units x 2 talk-through operational settings), the radio volume (0 to 6) and subjective quality rating (1 to 5) were noted and the CVC response sheet was scored (words correct out of 50) by the experimenter, for each member of the pair (F/M participant and SF/SM) acting in turn as the listener. An example of the summary of results sheet is shown in Appendix C. Descriptive statistics on the preferred volume, the mean opinion score and the word correct scores are presented in Section 5.3 for each experimental condition. The speech intelligibility scores were also subjected to ANOVAs or MANOVAs, as appropriate, to determine the effects of fluency (as a talker or listener) and hearing loss (as a talker or listener) in interaction with gender and the device condition.

24
5.0 Results 5.1 Noise analyses Figure 5 (left) presents a 120-s noise segment of the Bison armoured vehicle in idle mode and hatch open, extracted from a longer recording supplied by Defence Research and Development Canada – Toronto Research Centre to the researchers for a previous study (Giguère et al., 2008). The overall level of the noise is scaled to 85 dBA. In addition to the signal waveform, the short-time evolution of the sound level calculated over 125-ms time frames (LAeq,125ms) is also illustrated. The latter is similar to a FAST time response tracing on a sound level meter. As shown, the sound level is quite stable over time, as expected from a continuously-running idle engine. The 1/3-octave band spectrum of the noise over the entire recording is also provided. The bottom panel in Figure 5 (left) shows standard (SII) and extended (ESII) speech intelligibility index calculations for this noise for a normal, raised, loud and shouted talker voice. The SII is computed from ANSI S3.5-1997 (R2012) based on the overall spectrum of the noise (21-critical band procedure) and the standard band importance function. The ESII is computed using variable-length short-time windows (from 35 ms at 150 Hz to 9.4 ms at 8000 Hz) as specified in Rhebergen and Versfeld (2005). Both versions express the proportion of audible cues (from 0 to 1) that are available to a listener with normal hearing. As expected, both indexes are progressively higher with increasing talker vocal effort. The SII is strictly valid only for continuous noises, while the ESII is valid for both continuous and fluctuating noises. A good correspondence between SII and ESII, as shown in Figure 5 (left) for the Bison noise, indicates that the noise can be considered continuous from a speech perception perspective. Figure 6 presents similar analyses for the four candidate battlefield transient/impulsive noises introduced in Table 3. As shown by the time evolution of the sound level over 125-ms time frames, transient excursions of 5-10 dB are seen for Battlefield 1, 10-20 dB for Battlefield 2 and 4, and in excess of 30 dB for Battlefield 3. These temporal fluctuations are reflected in the SII/ESII analyses. All Battlefield recordings show higher ESII than SII values, indicating that speech perception is made easier by the temporal fluctuations in these noises. This confirms that the battlefield noises are not continuous from a speech perception perspective. Battlefield 3 shows the largest difference between ESII and SII values at all levels of vocal effort, and is therefore the best candidate to retain to represent the effects of transient noise characteristics on speech perception. Finally, Figure 5 (right) shows the acoustical analysis for the combined Bison-Battlefield 3 noise, mixed in equal proportions and scaled to a final overall level of 85 dBA for the listening experiments. As expected, the short-term sound level excursions and the SII/ESII difference lay in-between those for the continuous Bison noise (Figure 5 left) and transient-rich Battlefield 3 noise (Figure 6).

25
Figure 5: Acoustical analysis of the Bison noise (left) and the combined noise consisting of the Bison and Battlefield 3 noises (right). From top to bottom: signal waveform and sound level fluctuations, third-octave band spectrum, and speech intelligibility index calculations for four vocal efforts, respectively. Noises are scaled to 85 dBA.
-0.1
-0.05
0
0.05
0.1S
igna
l
BISON
0 20 40 60 80 100 12020
40
60
80
100
LAeq
125m
s (dB
A)
Time (s)
100 1000 1000045
50
55
60
65
70
75
80
85
1/3-
OB
leve
l (dB
SP
L)
1/3-OB centre frequency (Hz)
-0.1
-0.05
0
0.05
0.1
Sig
nal
BISON+Battlefield03
0 20 40 60 80 10020
40
60
80
100
LAeq
125m
s (dB
A)
Time (s)
100 1000 1000045
50
55
60
65
70
75
80
85
1/3-
OB
leve
l (dB
SP
L)
1/3-OB centre frequency (Hz)
normal raised loud shout0
0.1
0.2
0.3
0.4
0.5
0.6
0.7
0.8
0.9
1
Vocal effort
SII/
ES
II
SIIESII
normal raised loud shout0
0.1
0.2
0.3
0.4
0.5
0.6
0.7
0.8
0.9
1
Vocal effort
SII/
ES
II
SIIESII
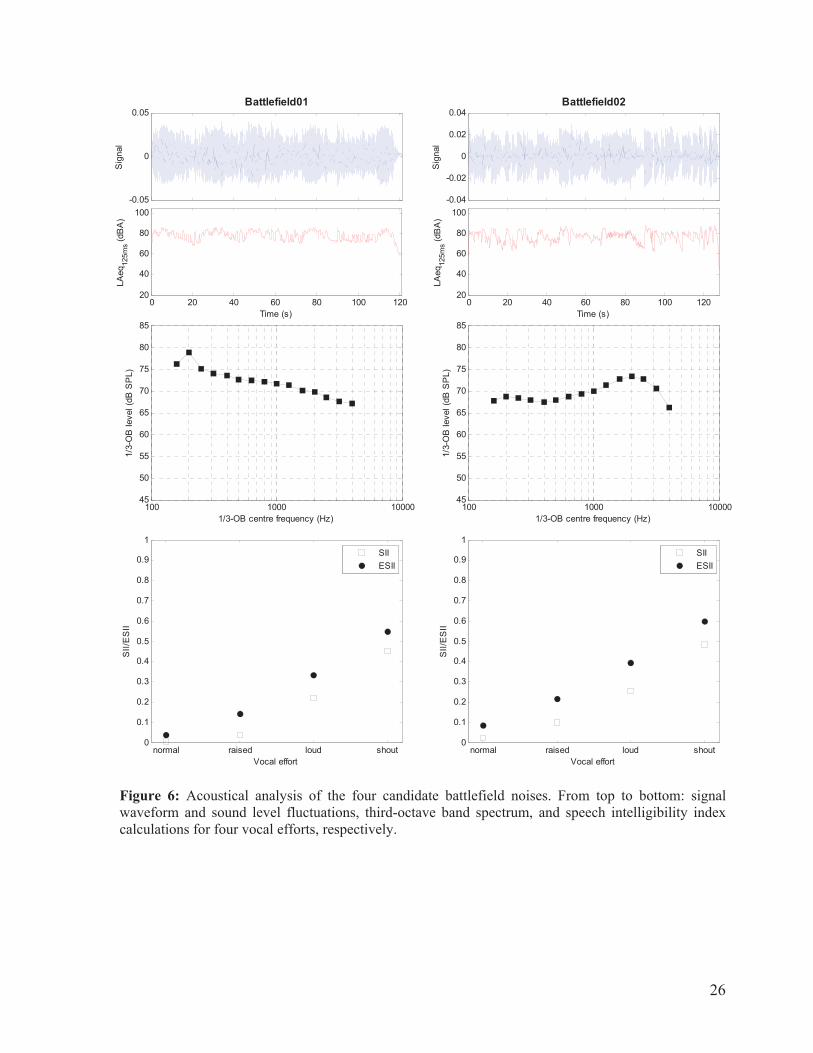
26
Figure 6: Acoustical analysis of the four candidate battlefield noises. From top to bottom: signal waveform and sound level fluctuations, third-octave band spectrum, and speech intelligibility index calculations for four vocal efforts, respectively.
-0.05
0
0.05S
igna
l
Battlefield01
0 20 40 60 80 100 12020
40
60
80
100
LAeq
125m
s (dB
A)
Time (s)
100 1000 1000045
50
55
60
65
70
75
80
85
1/3-
OB
leve
l (dB
SP
L)
1/3-OB centre frequency (Hz)
-0.04
-0.02
0
0.02
0.04
Sig
nal
Battlefield02
0 20 40 60 80 100 12020
40
60
80
100
LAeq
125m
s (dB
A)
Time (s)
100 1000 1000045
50
55
60
65
70
75
80
85
1/3-
OB
leve
l (dB
SP
L)
1/3-OB centre frequency (Hz)
normal raised loud shout0
0.1
0.2
0.3
0.4
0.5
0.6
0.7
0.8
0.9
1
Vocal effort
SII/
ES
II
SIIESII
normal raised loud shout0
0.1
0.2
0.3
0.4
0.5
0.6
0.7
0.8
0.9
1
Vocal effort
SII/
ES
II
SIIESII

27
Figure 6: (continued)
-0.1
-0.05
0
0.05
0.1S
igna
l
Battlefield03
0 20 40 60 80 10020
40
60
80
100
LAeq
125m
s (dB
A)
Time (s)
100 1000 1000045
50
55
60
65
70
75
80
85
1/3-
OB
leve
l (dB
SP
L)
1/3-OB centre frequency (Hz)
-0.2
-0.1
0
0.1
0.2
Sig
nal
Battlefield04
0 10 20 30 4020
40
60
80
100
LAeq
125m
s (dB
A)
Time (s)
100 1000 1000045
50
55
60
65
70
75
80
85
1/3-
OB
leve
l (dB
SP
L)
1/3-OB centre frequency (Hz)
normal raised loud shout0
0.1
0.2
0.3
0.4
0.5
0.6
0.7
0.8
0.9
1
Vocal effort
SII/
ES
II
SIIESII
normal raised loud shout0
0.1
0.2
0.3
0.4
0.5
0.6
0.7
0.8
0.9
1
Vocal effort
SII/
ES
II
SIIESII
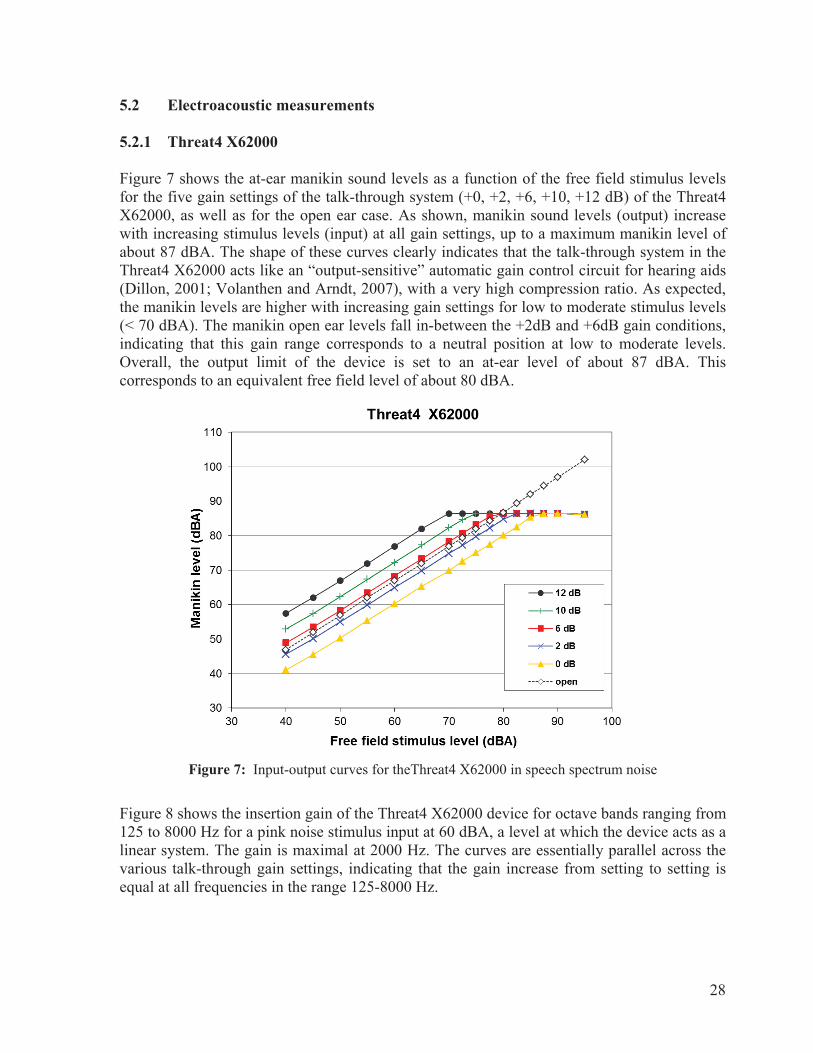
28
5.2 Electroacoustic measurements 5.2.1 Threat4 X62000 Figure 7 shows the at-ear manikin sound levels as a function of the free field stimulus levels for the five gain settings of the talk-through system (+0, +2, +6, +10, +12 dB) of the Threat4 X62000, as well as for the open ear case. As shown, manikin sound levels (output) increase with increasing stimulus levels (input) at all gain settings, up to a maximum manikin level of about 87 dBA. The shape of these curves clearly indicates that the talk-through system in the Threat4 X62000 acts like an “output-sensitive” automatic gain control circuit for hearing aids (Dillon, 2001; Volanthen and Arndt, 2007), with a very high compression ratio. As expected, the manikin levels are higher with increasing gain settings for low to moderate stimulus levels (< 70 dBA). The manikin open ear levels fall in-between the +2dB and +6dB gain conditions, indicating that this gain range corresponds to a neutral position at low to moderate levels. Overall, the output limit of the device is set to an at-ear level of about 87 dBA. This corresponds to an equivalent free field level of about 80 dBA.
Figure 7: Input-output curves for theThreat4 X62000 in speech spectrum noise
Figure 8 shows the insertion gain of the Threat4 X62000 device for octave bands ranging from 125 to 8000 Hz for a pink noise stimulus input at 60 dBA, a level at which the device acts as a linear system. The gain is maximal at 2000 Hz. The curves are essentially parallel across the various talk-through gain settings, indicating that the gain increase from setting to setting is equal at all frequencies in the range 125-8000 Hz.

29
Figure 8: Insertion gain of the Threat4 X62000 as a function of frequency in pink noise at 60 dBA
5.2.2 QuietPro QP400 Note: Results in this section are from the predecessor model, the NACRE QuietPro. Figure 9 shows the at-ear manikin sound levels as a function of the free field stimulus levels for eight of the eleven gain settings of the talk-through system (TT2, TT3, TT4, TT5, TT6, TT8, TT10, TT11) of the NACRE QuietPro, as well as for the open ear case. Manikin sound levels (output) increase with increasing stimulus levels (input) in all volume setting conditions, up to a manikin level of about 90 dBA. The shape of these curves for gain settings TT6 and above shows that the talk-through system in the NACRE QuietPro acts like an “output-sensitive” automatic gain control circuit for hearing aids (Dillon, 2001; Volanthen and Arndt, 2007). As expected, the manikin levels are higher with increasing TT volume setting (TT11 > TT10 > TT8 > TT5 > TT2) for low to moderate stimulus levels (< 70 dBA). The manikin open ear levels are in-between the TT4 and TT5 conditions, indicating that this range of settings corresponds to a neutral position at low to moderate levels. Other features include “input-sensitive” compression characteristics at a free field threshold of 80-dBA with a compression ratio of about 4:1. Overall, the output limit of the device is set to an at-ear level of about 92-93 dBA. This corresponds to an equivalent free field level of approximately 85 dBA.
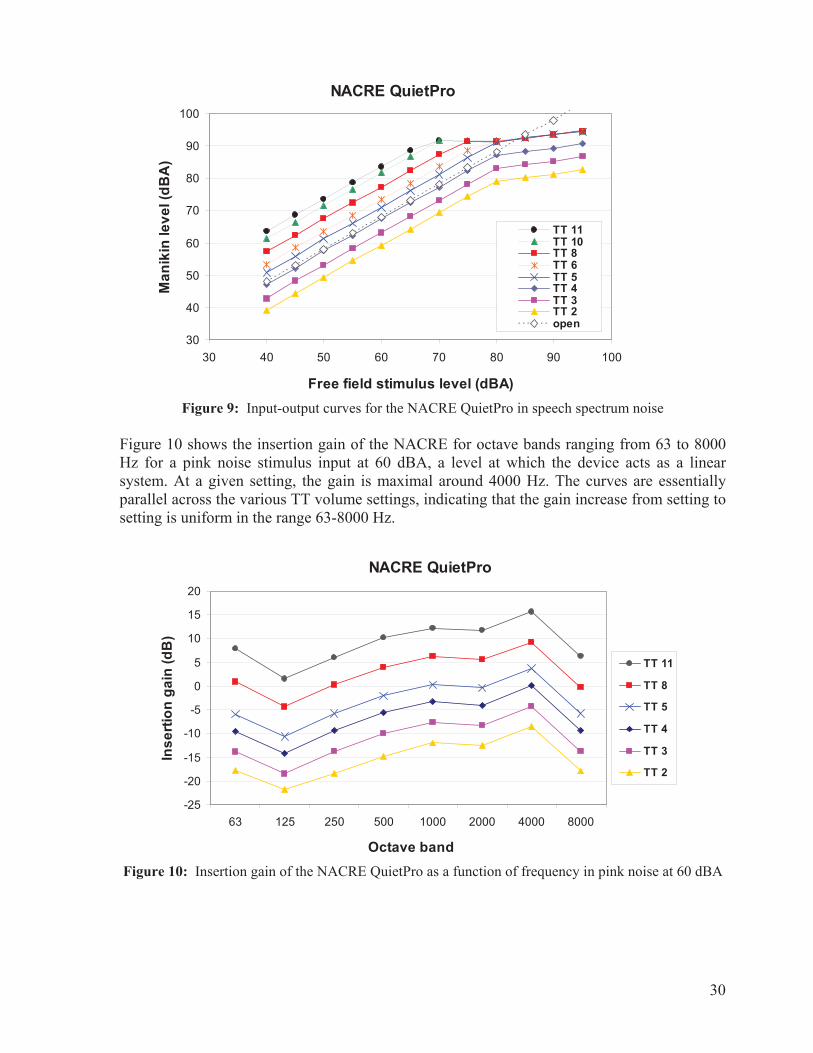
30
Figure 9: Input-output curves for the NACRE QuietPro in speech spectrum noise Figure 10 shows the insertion gain of the NACRE for octave bands ranging from 63 to 8000 Hz for a pink noise stimulus input at 60 dBA, a level at which the device acts as a linear system. At a given setting, the gain is maximal around 4000 Hz. The curves are essentially parallel across the various TT volume settings, indicating that the gain increase from setting to setting is uniform in the range 63-8000 Hz.
Figure 10: Insertion gain of the NACRE QuietPro as a function of frequency in pink noise at 60 dBA
NACRE QuietPro
30
40
50
60
70
80
90
100
30 40 50 60 70 80 90 100
Free field stimulus level (dBA)
Man
ikin
leve
l (dB
A)
TT 11TT 10TT 8TT 6TT 5TT 4TT 3TT 2open
NACRE QuietPro
-25
-20
-15
-10
-5
0
5
10
15
20
63 125 250 500 1000 2000 4000 8000
Octave band
Inse
rtion
gai
n (d
B)
TT 11
TT 8
TT 5
TT 4
TT 3
TT 2

31
5.3 Data collection with human participants 5.3.1 Description of participants The standard female (SF) and the standard male (SM) were recruited among PhD students in Rehabilitation Sciences at the University of Ottawa. They grew up in Canada with English as their mother tongue. Both met the inclusion criteria for normal hearing (Section 4.2) at all frequencies in both ears. The standard female was 27 years old at the time of testing. She scored 37 on the Skylark test of English Fluency and obtained a score of -4.1 dB SNR on the Noise Front condition of the English version of the HINT speech test. The standard male was 33 years old; he scored 39 on the Skylark test and obtained a score of -3.7 dB SNR on the HINT. The normative value for the Noise Front condition of the HINT is -2.6 dB SNR (Vermiglio, 2008), thus both the standard female and male had slightly better speech recognition abilities in noise than the average normal-hearing English-speaking individual. Table 5 provides summary statistics for the three groups of participants. Participants in the normal-hearing fluent group (control) all met the inclusion criteria for normal hearing, except for one female with a hearing threshold of 20 dB HL at 3000 Hz in the left ear. The average score on the Skylark test was 38.1 (females 38.2, males 38.0) with all participants meeting the inclusion criterion score of 36 or more, except for one male scoring 35. The participant was retained in view of a HINT score (-3.0 dB SNR) slightly better than the normative value for this test. The average score on the HINT for the control group was identical to the normative value for this test at -2.6 dB SNR (females -2.7 dB SNR, males -2.6 dB SNR), and all participants were within normal range. Participants in the normal-hearing non-fluent group (fluency) also all met the inclusion criteria for normal hearing, except for one male with a hearing threshold of 20 dB HL at 3000 Hz in the left ear. The average score on the Skylark fluency test was 21.1 (females 20.2, males 22.0) with individual scores ranging from 10 (beginner level) to 28 (intermediate level). These participants also required a much higher signal to noise ratio on the HINT test than the participants in the control group; the average score was 5.1 dB SNR (females 5.6 dB SNR, males 4.6 dB SNR) or 7.7 dB above the normative value for the HINT Noise Front. Given that the participants in the non-fluent group all have normal hearing, the HINT score elevation is likely indicative of a SNR loss arising from reduced English proficiency. Participants in the hearing-impaired fluent group (hearing loss) scored 37.8 on the Skylark test (females 38.7, males 36.8), almost identical to the control group, with all participants meeting the criterion score of 36 or more. The average five-frequency PTA in the better ear was 40 dB HL (females 37 dB HL, males 43 dB HL), with all participants in the inclusion criterion range from 25 to 55 dB HL. Average hearing thresholds by gender, frequency and ear are reported graphically in Figure 11. Females had 1-12 dB better hearing thresholds than males at all frequencies tested. Males had slightly better thresholds in the right ear than the ear left ear above 4000 Hz. On average, participants in the hearing loss group scored 0.5 dB SNR on the HINT test (females 0.9 dB SNR, males 0.1 dB SNR) or 3.1 dB above the normative value for the HINT Noise Front. Given that this group is fully fluent in English, the HINT score elevation is indicative of a SNR loss arising from supra-threshold hearing deficits.

32
The hearing-impaired group was about 26 years older than the controlgroup and 34 years older than the non-fluent group.
Table 5: Summary statistics for the age, Skylark and HINT test results by group of participants
GroupsAge (years) Skylark (out of 40) HINT (dB SNR)
Min Average Max Min Average Max Min Average Max
Con
trol Female
(n=6) 25 31 37 36 38 40 -2.3 -2.7 -3.1
Male (n=6) 19 28 34 35 38 40 -1.4 -2.6 -3.0
Non
-flu
ent Female
(n=6) 18 20 29 10 20 28 9.3 5.6 2.9
Male (n=6) 18 24 33 10 22 28 10.6 4.6 1.4
Hea
ring
loss
Female (n=6) 48 58 68 37 39 40 3.4 0.9 -1.6
Male (n=6) 46 54 63 36 37 38 1.2 0.1 -1.2
Figure 11: Mean hearing thresholds by gender and ear for the hearing loss group

33
5.3.2 Experimental data
Summary statistics: Table 6 presents the mean discrimination scores on the MRT by group, gender and device condition (Threat ON, Threat OFF, QuietPro ON, QuietPro OFF). The total number of words correctly identified (out of 50) is indicated, as well as the mean MOS score (out of 5) and mean radio volume setting (out of 6). Note that for each gender and group, the scores are shown separately for the situation when the standard female/male was talking to the participants and when the participants were talking to the standard female/male. Figure 12 shows the mean MRT score and standard deviation for all experimental conditions. As two different situations are captured in this experimental protocol, separate statistical analyses were performed, one for the situation when the F/M participants acted as listeners (with SF/SM as talkers) and the other when the SF/SM acted as listeners (with F/M participants as talkers).
Figure 12: Mean MRT scores and standard deviation by device and group for the four same-gender talker-listener pairs (SF-F = standard female talking to female listeners; F-SF = female participants talking to standard female; SM-M = standard male talking to male listeners; M-SM = male participants talking to standard male)

34
Table 6: Mean MRT and MOS scores and radio volume setting by device and group for the four same-gender talker-listener pairs
Group Talker Listener Threat ON Threat OFF
MRT(/50)
MOS(1-5)
Vol. (0-6)
MRT(/50)
MOS(1-5)
Vol.(0-6)
Con
trol SF F (n=6) 41.0 3.5 2.0 43.7 3.7 2.0
F (n=6) SF 39.2 3.9 3.3 39.2 4.0 3.6 SM M (n=6) 42.2 4.2 2.1 43.7 4.3 2.1
M (n=6) SM 41.5 4.3 2.3 45.3 4.5 2.3
Non
-flu
ent SF F (n=6) 37.2 3.8 2.0 38.5 4.0 2.0
F (n=6) SF 33.0 3.7 2.9 32.8 3.8 3.3 SM M (n=6) 38.7 3.7 2.3 42.8 4.2 2.7
M (n=6) SM 40.7 4.2 2.7 40.7 4.0 2.7
Hea
ring
loss
SF F (n=6) 36.3 3.8 3.3 41.3 3.9 3.2 F (n=6) SF 42.5 4.1 3.8 39.7 4.0 3.9
SM M (n=6) 38.8 4.5 3.3 39.2 4.5 3.3 M (n=6) SM 43.8 4.5 2.8 45.5 5.0 2.8
Group Talker Listener QuietPro ON QuietPro OFF
MRT(/50)
MOS(1-5)
Vol. (0-6)
MRT(/50)
MOS(1-5)
Vol.(0-6)
Con
trol SF F (n=6) 29.5 2.2 4.4 29.8 2.4 4.3
F (n=6) SF 32.0 2.3 6.0 32.5 2.5 6.0 SM M (n=6) 33.0 3.0 4.7 34.7 3.3 4.4
M (n=6) SM 32.3 2.2 4.9 32.8 2.7 4.8
Non
-flu
ent SF F (n=6) 25.0 2.2 5.3 24.0 2.7 4.8
F (n=6) SF 29.7 1.8 6.0 27.3 2.3 6.0 SM M (n=6) 28.2 2.4 4.8 31.2 3.3 3.8
M (n=6) SM 35.2 2.6 5.4 36.3 2.8 4.9
Hea
ring
loss
SF F (n=6) 27.3 2.7 5.7 27.8 2.5 6.0 F (n=6) SF 34.8 2.6 6.0 35.3 2.9 6.0
SM M (n=6) 28.7 2.8 5.8 31.7 3.1 5.7 M (n=6) SM 37.0 2.5 5.4 36.7 2.8 5.0
Analysis of results for F/M participants acting as listeners: A multivariate linear model was considered to analyse data for this repeated measures design with two between-subject factors [Gender (F/M) and Group (control/non-fluent/hearing loss)] and one within-subject factor (Device condition: Threat ON, Threat OFF, QuietPro ON, QuietPro OFF). However, the condition of sphericity for univariate analysis was met [Mauchly test: p = 0.545]. As such, a univariate type III repeated-measures ANOVA assuming sphericity was used to determine significant effects and interactions. Using a 0.05 alpha value, results indicated significant main effects for all three factors of Gender [F(1,30) = 4.592, p = 0.040], Group [F(2,30) = 6.739, p = 0.004] and Device [F(3,90) = 105.051, p < 0.001], as well as a significant interaction between the between-subject factor Gender and the within-subject factor Device [F(3,90) = 4.162, p = 0.008].

35
A significant main effect was found for Group, but it did not interact with any other factor. Figure 13 is a comparative Box plot that allows graphic comparison between the three levels of this factor. Each box contains the median performance value and covers half of the data (between the 1st and 3rd quartile). The error bars illustrate extreme values (min, max). The control group seems to outperform the non-fluent and hearing-impaired groups, the latter exhibiting similar responses. Indeed, across gender and device conditions, measured mean word recognition scores (out of a possibility of 50 words) were 37.2 for the control group, 33.2 for the non-fluent group and 33.9 for the hearing-impaired group. A multivariate analysis of variance using the Pillai statistic was used to test significance. A statistically significant difference was found only between the control group and the non-fluent group [F(4,29) = 3.449, p = 0.020] with a difference in performance of 4 words (or 8%). Differences in performance between the control group and the hearing-impaired group could have reached statistical significance using a larger sample as a p-value of 0.144 was obtained.
MR
T w
ord
scor
e sc
ore
(/50)
Group
Figure 13. Comparative box plot for the three levels of the Group factor for the situation describing the F/M participants acting as listeners Significant main effects were found for the factors Gender and Device, and they interacted. Figure 14 shows a comparative Box plot describing performance according to Gender (2 levels) and Device (4 levels). Across all groups, mean performance in each device condition was as follows for females and males, respectively: 38.2 vs 39.9 words for Threat ON, 41.2 vs 41.9 words for Threat OFF, 27.3 vs 29.9 words for QuietPro ON and 27.2 vs 32.5 words for QuietPro OFF. Some differences in performance are apparent between males and females, with males outperforming females in all device conditions. To determine statistical significance in each device condition, we used a two-factor additive ANOVA model with Gender and Group. Results for the corresponding t-tests confirm the higher performance for males compared to females only in the QuietPro OFF condition [t(32) = -3.495, p = 0.001], the effect amounting to a 5-word (or 10%) difference. There is also a trend for superior performance in males in the QuietPro ON condition, with a p-value of 0.082, which could reach statistical significance in a larger sample. No gender effects or trends were found with the Threat ON or Threat OFF.

36
Threat OFF QuietPro ON QuietPro OFFThreat ON
MR
T w
ord
corr
ect s
core
(/50
)
Gender Gender Gender Gender
Figure 14. Comparative box plot for the two levels of the Gender factor and the four levels of the Device factor for the situation describing the F/M participants acting as listeners Figure 14 also suggests differences in performance when comparing device units (Threat vs QuietPro), but not between the two operational modes (talk-through ON and OFF). A multivariate ANOVA confirmed these observations. There was no significant difference in results when comparing ON and OFF modes within the same device unit, but there were differences between the two devices. In the ON mode, mean word recognition was significantly higher when using the Threat compared to the QuietPro [F(1,30) = 170.455, p < 0.001], by 10 words (or 20%) across all groups and gender. In the OFF mode, performance between the Threat and QuietPro also differed significantly [F(1,30) = 127.998, p <0.001], but this effect interacted with Gender [F(1,30) = 9.617, p = 0.004]. While performance was higher with the Threat device compared to the QuietPro device, the difference in mean recognition score was larger in females than in males (by 14 words or 28% in females and by 9 words or 18% in males). This can be explained by the significantly lower performance of females than males in the QuietPro OFF condition, as indicated earlier, while both genders performed similarly in the Threat OFF condition.
Analysis of results for SF/SM participants acting as listeners: A multivariate linear model was used to analyse data for this repeated measures design with two between-subject factors [Gender (F/M) and Group (control/non-fluent/hearing loss)] and one within-subject factor (Device condition: Threat ON, Threat OFF, QuietPro ON, QuietPro OFF). The condition of sphericity for univariate analysis was not met [Mauchly test: p = 0.036].
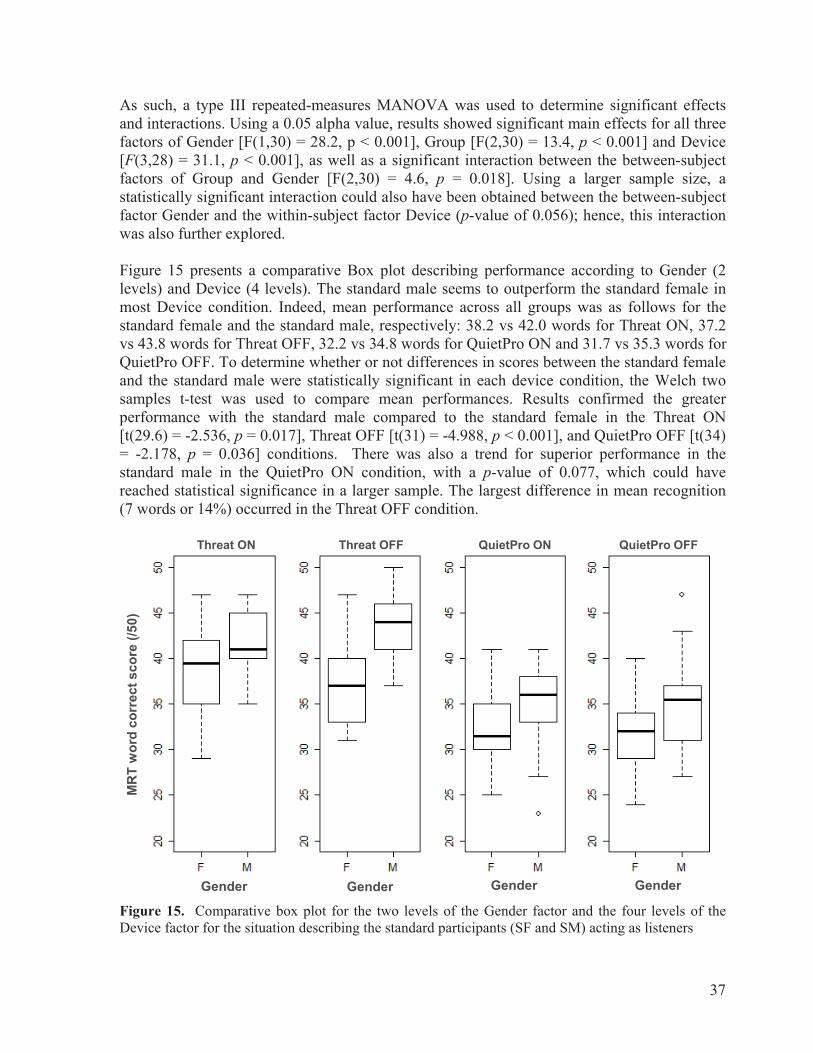
37
As such, a type III repeated-measures MANOVA was used to determine significant effects and interactions. Using a 0.05 alpha value, results showed significant main effects for all three factors of Gender [F(1,30) = 28.2, p < 0.001], Group [F(2,30) = 13.4, p < 0.001] and Device [F(3,28) = 31.1, p < 0.001], as well as a significant interaction between the between-subject factors of Group and Gender [F(2,30) = 4.6, p = 0.018]. Using a larger sample size, a statistically significant interaction could also have been obtained between the between-subject factor Gender and the within-subject factor Device (p-value of 0.056); hence, this interaction was also further explored. Figure 15 presents a comparative Box plot describing performance according to Gender (2 levels) and Device (4 levels). The standard male seems to outperform the standard female in most Device condition. Indeed, mean performance across all groups was as follows for the standard female and the standard male, respectively: 38.2 vs 42.0 words for Threat ON, 37.2 vs 43.8 words for Threat OFF, 32.2 vs 34.8 words for QuietPro ON and 31.7 vs 35.3 words for QuietPro OFF. To determine whether or not differences in scores between the standard female and the standard male were statistically significant in each device condition, the Welch two samples t-test was used to compare mean performances. Results confirmed the greater performance with the standard male compared to the standard female in the Threat ON [t(29.6) = -2.536, p = 0.017], Threat OFF [t(31) = -4.988, p < 0.001], and QuietPro OFF [t(34) = -2.178, p = 0.036] conditions. There was also a trend for superior performance in the standard male in the QuietPro ON condition, with a p-value of 0.077, which could have reached statistical significance in a larger sample. The largest difference in mean recognition (7 words or 14%) occurred in the Threat OFF condition.
Threat OFF QuietPro ON QuietPro OFFThreat ON
MR
T w
ord
corr
ect s
core
(/50
)
Gender Gender Gender Gender
Figure 15. Comparative box plot for the two levels of the Gender factor and the four levels of the Device factor for the situation describing the standard participants (SF and SM) acting as listeners

38
Figure 15 also suggests differences when comparing device units (Threat vs QuietPro), but not necessarily between the two operational modes (talk-through ON and OFF). To verify these observations, a multivariate ANOVA was used to compare the device conditions pairwise. No significant difference in performance was found between the ON and OFF modes of the QuietPro device. For the Threat, an interaction between ON-OFF status and Gender [F(1,30) = 4.234, p = 0.048] was found. To describe this interaction, two paired t-tests were used to compare performances according to the ON-OFF status within both genders. A significant difference was found only for the standard male [t(17) = -2.140, p = 0.047], a small 2-word (4%) advantage in mean recognition score in the OFF condition over the ON condition. Regarding performance between device units, mean word recognition was significantly higher (by 7 words or 14%) across all groups and genders when using the Threat compared to the QuietPro [F(1,30) = 42.808, p < 0.001] in the ON mode. In the OFF mode, mean recognition was also significantly higher (by 7 words or 14%) with the Threat than the QuietPro [F(1,30) = 86.616, p <0.001], but there was also a trend for this effect to interact with Gender [F(1,30) = 4.093, p = 0.052]. While performance was higher using the Threat device compared to the QuietPro device in this mode, the difference in mean recognition score was larger in the standard male (by 9 words or 18%) than in the standard female (by about 6 words or 12%). The interaction plots in Figure 16 allow a good visual representation of the interaction of the two between-subject factors (Gender and Group). The standard female appears to perform significantly lower when listening to the non-fluent group of talkers than to the control and hearing impaired groups, while the standard male seems to exhibit more similar performances across the three groups of talkers. To confirm this observation, a multivariate linear model with two categorical factors with interactions was used, more specifically a MANOVA using the Pillai test statistic. Pairwise comparisons showed that the standard female performed significantly better when listening to the control (by 5 words or 10%) [F(4,27) = 4.674, p = 0.005] and the hearing-impaired (by 7 words or 14%) [F(4,27) = 9.226, p < 0.001] groups of female talkers than to the non-fluent group. However, there was no significant difference between listening to the control or hearing-impaired group. For the standard male listener, all pairwise comparisons were found to be significant: control vs non-fluent male talkers [F(4,27) = 2.750, p = 0.049], control vs hearing-impaired male talkers [F(4,27) = 4.814, p = 0.005], and hearing-impaired vs non-fluent male talkers [F(4,27) = 6.239, p = 0.001], but by only up to 3 words (or 6%) between the groups. Figure 16 suggests that the group and gender differences reported above depend on the level of the within-subject factor Device. To better describe these effects, a Tukey’s Honestly Significant Differences test was used to compare the levels of the Group factor within each combination of the levels of Gender and the levels of Device Condition. Results are summarized in Table 7. For the standard female, performance when listening to the non-fluent female group was significantly lower than when listening to the control or hearing impaired groups of female talkers with Threat device in ON or OFF modes. In the QuietPro ON condition, no statistically significant difference was found when listening to the three different talkers groups. In the QuietPro OFF condition, performance was only significantly different when listening to the hearing-impaired group compared to non-fluent groups of female talkers, although a trend was also found (p = 0.070) when comparing the non-fluent and control groups. For the standard male, listening performance was significantly different only in the
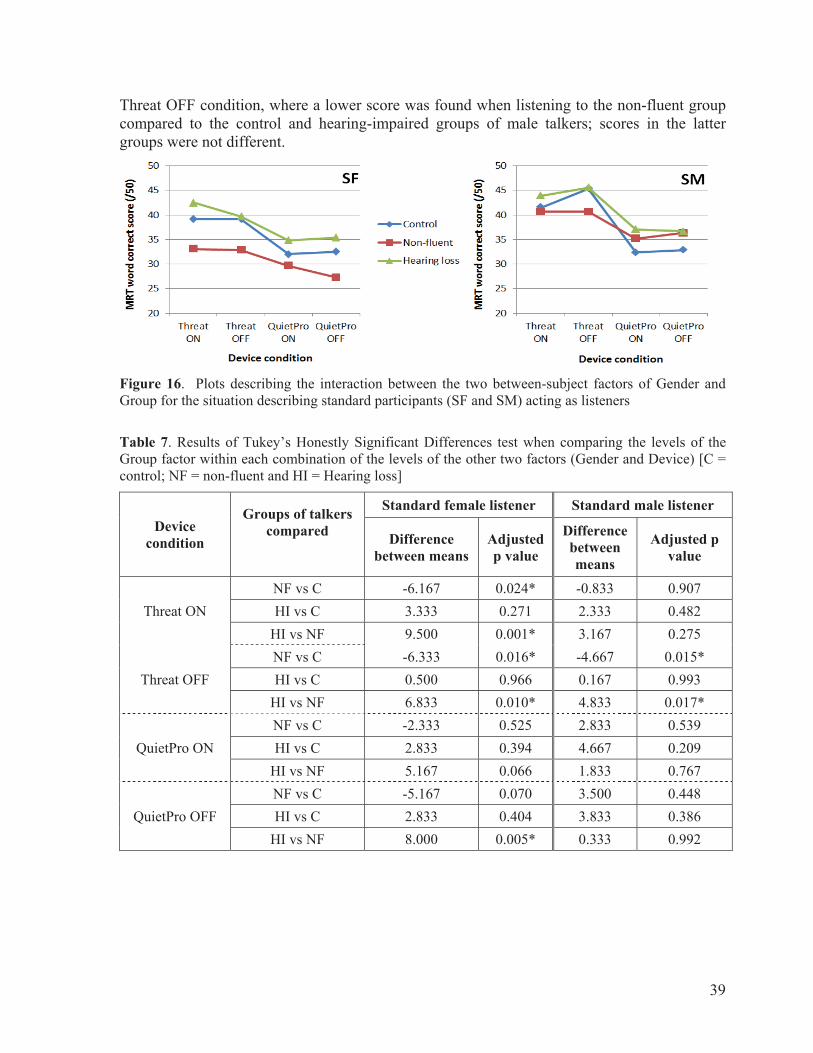
39
Threat OFF condition, where a lower score was found when listening to the non-fluent group compared to the control and hearing-impaired groups of male talkers; scores in the latter groups were not different.
Figure 16. Plots describing the interaction between the two between-subject factors of Gender and Group for the situation describing standard participants (SF and SM) acting as listeners
Table 7. Results of Tukey’s Honestly Significant Differences test when comparing the levels of the Group factor within each combination of the levels of the other two factors (Gender and Device) [C = control; NF = non-fluent and HI = Hearing loss]
Devicecondition
Groups of talkers compared
Standard female listener Standard male listener
Differencebetween means
Adjustedp value
Differencebetweenmeans
Adjusted p value
Threat ON NF vs C -6.167 0.024* -0.833 0.907 HI vs C 3.333 0.271 2.333 0.482
HI vs NF 9.500 0.001* 3.167 0.275
Threat OFF NF vs C -6.333 0.016* -4.667 0.015* HI vs C 0.500 0.966 0.167 0.993
HI vs NF 6.833 0.010* 4.833 0.017*
QuietPro ON NF vs C -2.333 0.525 2.833 0.539 HI vs C 2.833 0.394 4.667 0.209
HI vs NF 5.167 0.066 1.833 0.767
QuietPro OFF NF vs C -5.167 0.070 3.500 0.448 HI vs C 2.833 0.404 3.833 0.386
HI vs NF 8.000 0.005* 0.333 0.992

40
6.0 Discussion The present study examined the intelligibility and sound quality of speech communications carried out through the radio channel of two integrated hearing protection and communication devices for individuals with varying degrees of hearing loss and English language proficiency. Thirty-six participants (18 males and 18 females) took part in a radio communication task using the Modified Rhyme Test administered in an 85 dBA simulated military noise. One male and one female native English-speaking individuals with normal hearing (Standard Female – SF and Standard Male – SM) interacted with each of the 18 individuals of the same gender. The latter were split evenly into three groups (control = fluent English-speaking individuals with normal-hearing; non-fluent = non-fluent individuals with normal hearing; hearing loss = fluent English-speaking individuals with hearing loss). For each experimental condition, the SF (or SM) uttered a target word and the participant was required to circle the word perceived, among a closed set of six phonemically similar words, with the talker-listener roles being reversed after a 50-word list. This procedure was repeated for a total of four experimental conditions [2 devices (Threat4 X62000 and QuietPro QP400) × 2 talk-through operational modes (ON/OFF)]. Before each condition, the listener was required to set the radio volume to a level deemed appropriate for optimal radio communications using practice trials. After each condition, the listener was asked to judge the sound quality of the transmission on the MOS scale and the radio volume was noted by the experimenter.
6.1 Effect of listener characteristics
Listener characteristics were investigated when the standard female or male (SF/SM) talked to the three groups of same-gender F/M participants (control, non-fluent and hearing loss). A main effect of group was found, with the control group outperforming the non-fluent group by 4 words (or 8%) but not the hearing-impaired group. It is interesting to note from Table 6 that all groups rated similarly the subjective quality of the radio transmission (MOS score), but that both groups of individuals with normal hearing (control and non-fluent) listened at similar radio volume levels while the hearing loss group used, on average, a higher volume setting. Higher radio volume may indicate a need for the hearing-impaired individuals to increase the speech level to compensate for hearing loss deficits, either elevated hearing thresholds (Figure 11) or speech-recognition thresholds (Table 5). During the experiment, it was also noted that the standard male and female tended to speak louder to individuals with hearing loss compared to individuals with normal hearing in the control and non-fluent groups, which may also have contributed to the similar performance of the control and hearing-impaired groups of listeners. The non-fluent group, on the other hand, did not appear to use any compensatory radio volume strategy to compensate for reduced language proficiency, despite requiring a higher SNR on the HINT test than the control group (Table 5). The fact that this group chose a similar radio volume setting than the control group may indicate that the speech task was not limited by overall signal-to-noise ratio issues, but by language proficiency per se. The factors Gender and Device also produced main statistical effects and they were found to interact together. Differences in performance were found between the two device units (Threat vs QuietPro), but not across the two operational modes (ON vs OFF) within the same device.
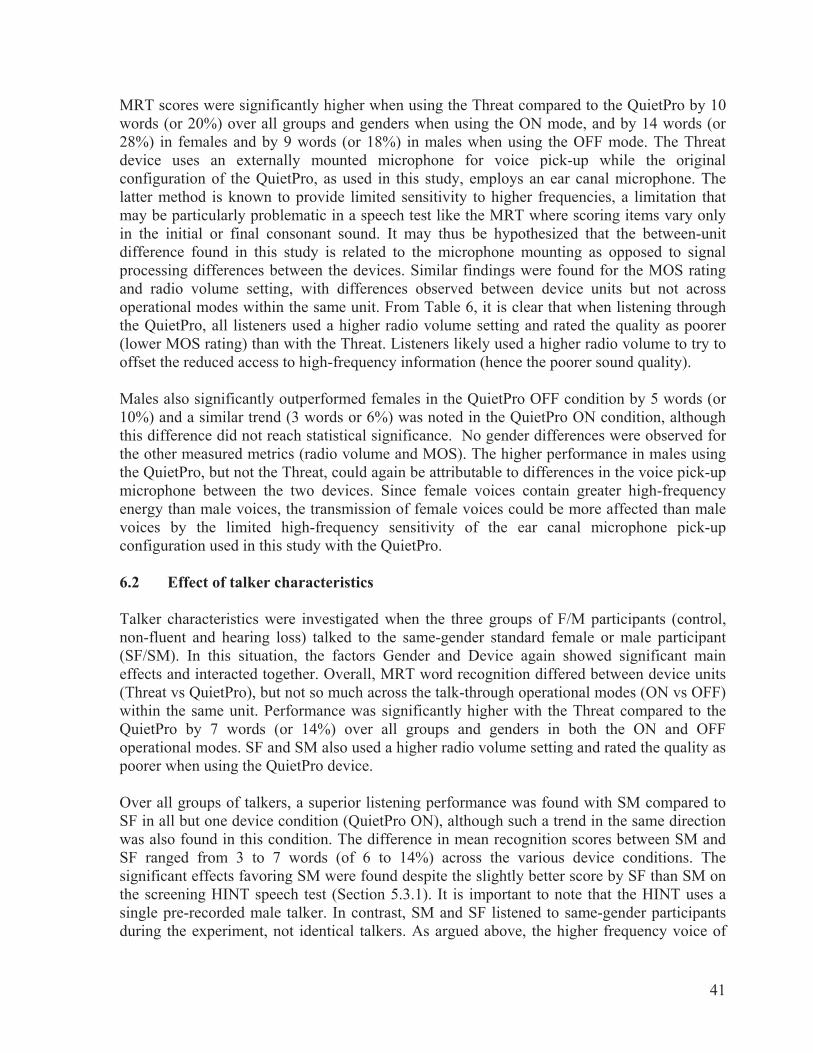
41
MRT scores were significantly higher when using the Threat compared to the QuietPro by 10 words (or 20%) over all groups and genders when using the ON mode, and by 14 words (or 28%) in females and by 9 words (or 18%) in males when using the OFF mode. The Threat device uses an externally mounted microphone for voice pick-up while the original configuration of the QuietPro, as used in this study, employs an ear canal microphone. The latter method is known to provide limited sensitivity to higher frequencies, a limitation that may be particularly problematic in a speech test like the MRT where scoring items vary only in the initial or final consonant sound. It may thus be hypothesized that the between-unit difference found in this study is related to the microphone mounting as opposed to signal processing differences between the devices. Similar findings were found for the MOS rating and radio volume setting, with differences observed between device units but not across operational modes within the same unit. From Table 6, it is clear that when listening through the QuietPro, all listeners used a higher radio volume setting and rated the quality as poorer (lower MOS rating) than with the Threat. Listeners likely used a higher radio volume to try to offset the reduced access to high-frequency information (hence the poorer sound quality). Males also significantly outperformed females in the QuietPro OFF condition by 5 words (or 10%) and a similar trend (3 words or 6%) was noted in the QuietPro ON condition, although this difference did not reach statistical significance. No gender differences were observed for the other measured metrics (radio volume and MOS). The higher performance in males using the QuietPro, but not the Threat, could again be attributable to differences in the voice pick-up microphone between the two devices. Since female voices contain greater high-frequency energy than male voices, the transmission of female voices could be more affected than male voices by the limited high-frequency sensitivity of the ear canal microphone pick-up configuration used in this study with the QuietPro. 6.2 Effect of talker characteristics
Talker characteristics were investigated when the three groups of F/M participants (control, non-fluent and hearing loss) talked to the same-gender standard female or male participant (SF/SM). In this situation, the factors Gender and Device again showed significant main effects and interacted together. Overall, MRT word recognition differed between device units (Threat vs QuietPro), but not so much across the talk-through operational modes (ON vs OFF) within the same unit. Performance was significantly higher with the Threat compared to the QuietPro by 7 words (or 14%) over all groups and genders in both the ON and OFF operational modes. SF and SM also used a higher radio volume setting and rated the quality as poorer when using the QuietPro device. Over all groups of talkers, a superior listening performance was found with SM compared to SF in all but one device condition (QuietPro ON), although such a trend in the same direction was also found in this condition. The difference in mean recognition scores between SM and SF ranged from 3 to 7 words (of 6 to 14%) across the various device conditions. The significant effects favoring SM were found despite the slightly better score by SF than SM on the screening HINT speech test (Section 5.3.1). It is important to note that the HINT uses a single pre-recorded male talker. In contrast, SM and SF listened to same-gender participants during the experiment, not identical talkers. As argued above, the higher frequency voice of

42
females in conjunction with ear canal microphone pick-up may have been contributing factors favoring SM in case of the QuietPro; however, it could not explain SF-SM differences when using the Threat. For the non-fluent group, it may be that despite similar scores by female and male participants on the Skylark test (Table 5), this written test does not necessary reflect possible voice production differences between these two non-fluent gender sub-groups which may have favored SM over SF. It was also observed during the experiment that some males seemed to talk louder than their female counterparts (in the same groups). More control over the quality and level of the voice production is warranted in future experiments to shed more light on such gender differences. Finally, an interaction was also found between factors Gender and Group. SF performed significantly better when listening to the control (by 5 words or 10%) and hearing-impaired (by 7 words or 14%) groups of female talkers than to the non-fluent group. In the case of SM, all pairwise comparisons between groups of male talkers were significant, but the maximum effect size only reached 3 words (or 6%). However, larger effects favoring the control and hearing-impaired groups over the non-fluent group were found when factoring in Device condition, particularly with the Threat OFF (Table 7). Since the volume settings and MOS ratings by SF and SM were similar across the different groups of talkers and device conditions, these differences are most likely due to a greater difficulty in understand speech spoken by non-fluent individuals. 6.3 Summary effects by factors Results of the study revealed some interesting main effects and interactions relative to all factors: Gender, Group and Device. Effect of device: MRT scores rarely differed across the two talk-through operational modes (ON vs OFF) within the same device unit. Furthermore, participants selected very similar radio volume settings in both modes. Together these two findings indicate that the masking effect of the external noise did not intervene in the experiment or that the talker compensated for the external noise through the Lombard effect. On the other hand, between-device-unit effects were prominent. An advantage in MRT scores with the Threat over the QuietPro was noted with all groups of participants, irrespective of gender and group. High-frequency response limitations from the ear canal microphone used in this study for the QuietPro may account for its lower performance compared to the Threat, which uses an external mouth microphone. This is supported by the fact that subjective speech quality was always judged higher with the Threat device than the QuietPro. To compensate for lower speech quality, individuals listened at higher radio volume settings when using the latter device. However, this did not fully compensate for the reduced speech information, as indicated by lower MRT word recognition scores. Effect of gender: Gender effects were evident when the F/M participants listened to the standard participants, with males outperforming females when using the QuietPro device. No gender differences were however observed for the other measured metrics (radio volume setting and MOS score). Again, this may be due to the use of an ear canal microphone in this study with this device. Reducing access to high-frequency information would have a greater
43
negative impact when listening to a female voice because of the richer high-frequency content. The SM also outperformed the SF in most experimental conditions when they acted as listeners. However, the explanation for this observation remains unclear since both SF and SF performed similarly on the screening HINT speech test. In addition to voice pick-up issues described above for the QuietPro, there was a tendency for some males to talk louder than females when using communications devices in background noise. In the case of the non-fluent group of talkers, which generated large SF-SM differences, it may be that a written test like the Skylark did not reflect actual differences in oral production between the two gender sub-groups despite similar screening scores. Effect of hearing loss: When acting as listeners, F/M participants with hearing loss had similar MRT word discrimination performance scores than the control group. Interestingly, individuals with hearing loss listened at higher radio volume settings. It was also observed that the SF and SM tended to speak louder to those individuals, although no voice output measurements were made to confirm this observation. It therefore seems that hearing loss could be largely compensated by increases in the received speech level or SNR. This highlights the importance of user-adjustments for optimal communications with tactical devices when individuals with a wide range of hearing abilities are interacting. It should be noted that while the degree of hearing loss of the participants (reaching 40-60 dB HL over the frequency range 2000-8000 Hz – Figure 11) did not cover the full range seen clinically, it sampled all the operational hearing categories (H1-H4) in used in the Canadian Forces. No negative effect was noted when the F/M participants with hearing loss acted as talkers to SF or SM, as expected, since these participants were fluent English speakers. Effect of fluency: Non-fluency in English had a greater impact on MRT word discrimination scores than hearing loss. As listeners, participants in the non-fluent group performed significantly worse than the two fluent groups (control and hearing loss groups). Furthermore, the SF and SM performed better when listening to fluent talkers (control and hearing loss groups) than when listening to non-fluent talkers, in several device conditions. There was however no apparent trend in MOS scores or radio volume setting differences due to fluency. While non-fluent participants required a much higher SNR on the screening HINT speech test than the control group, they did not increase the radio volume setting. The fact that they chose a similar radio volume setting than the control group indicate that the speech task was not limited by overall signal-to-noise ratio issues, but rather by limitations stemming directly from reduced language proficiency. 6.4 Significance and future work Despite the limited number of participants making up each experimental group, the obtained results are interesting from a military perspective where individuals with varying degrees of fluency and hearing loss must communicate in noisy environments through the radio channel of in-ear communications devices. Results indicate that hearing loss may have a lesser impact than fluency on the intelligibility of radio communications. Indeed, hearing loss can in part be offset by radio volume adjustments in order to improve audibility and increase listening SNR, as needed. While the two

44
communication devices used in this experiment did not provide any special-purpose features for hearing-impaired individuals, it is expected that further integration of hearing aid signal processing strategies (e.g. individualized gain-frequency functions) into in-ear communications devices will further lessen the impact of hearing loss. In contrast, fluency effects are much more difficult to compensate for from a technological perspective, if at all possible. Alternative means of communication such as texting or visual displays may be more suitable in some situations, where appropriate. When aural communications are required, language proficiency screening standards may be needed when native and non-native service personnel interact through communications devices in critical operational tasks. However, caution must be exerted when defining fluency/proficiency. In this study, categorization was made using scores on a written test of English fluency. However, some individuals scoring low on the test rated themselves fairly high on the two questions of the self-assessed questionnaire of English fluency when required to rate their abilities in understanding what people say in English and being able to communicate what they want to say in English in all situations. Oral, rather than written, fluency testing should be favored. The study also uncovered a significant difference in recognition scores across the two in-ear communications devices (Threat4 X62000 and Honeywell QuietPro QP400), which was hypothesized to be related to differences in the way the talker’s voice was being picked up: an external mouth microphone in the case of the Threat and an ear canal microphone behind the earplug in the case of the QuietPro. While in-canal microphone technology is promising because it picks up the voice signal without as much of the external background noise compared to an external microphone, the tradeoff appears to be a reduced sensitivity to the high-frequency content of the talker’s voice. In this study, this led to lower recognition scores and perceived speech quality. This should be addressed, especially when female talkers are involved, given the higher frequency content of female voices versus male voices. It should be noted that the QuietPro is also available with an external microphone mounting. Additional experimentation using this device with both the ear canal and the mouth microphone pick-up options may shed further light on this issue. On the other hand, switching between the two talk-through operational modes (ON vs OFF) within each device did not uncover large effects for radio communications in noise. In a previous study (Giguère et al., 2011b), it was found that the ON mode provided better recognition scores than the OFF mode in face-to-face listening situations, especially with individuals with hearing loss. Taken together, these two studies indicate that talk-through ON is the setting of choice when awareness of the immediate surroundings and need for radio communications are both at play. Neither study, however, investigated the potential for information overload or divided attention issues when different aural communication tasks are carried out simultaneously through acoustical and radio transmission means. From an experimental standpoint, the chosen speech test (MRT) uses closed sets of simple words and therefore provide no contextual information on which listeners can rely on to fill in the blanks when some information is missing because of hearing loss, reduced fluency or radio signal transmission issues. Sentences, on the other hand, have greater contextual information, and thus may be more realistic. To investigate the effect of contextual information in interaction with hearing loss and fluency, the speech material could consist of sentences with

45
varying degrees of context (high vs low-predictability), as used in the SPIN test. Indeed, fluency effects were recently found to be dependent on the speech test used (Nakashima et al., 2015). While participants had greater difficulty understanding non-native talkers compared to native talkers, the latter outperformed non-native listeners on the SPIN, but not on the MRT. For the SPIN, individuals must correctly recognize the final word of the sentence, for which no alternatives are provided. As suggested by the authors, the alternative word options presented with the MRT might make the task less difficult, thereby making the MRT a less sensitive measure of differences in fluency. Finally, the assessment of the combined effects of hearing loss and reduced language proficiency/fluency was not investigated in this study. Such a situation is expected to become more common and is a realistic outcome for older and noise-exposed military personnel deployed within Canada and in multi-country operations.

46
References Abel SM (2004). Risks factors for the development of noise-induced hearing loss in Canadian Forces personnel. Defence R&D Canada – Toronto, External Client Report ECR 2004-116, 180 p. Abel SM (2005). Hearing loss in military aviation and other trades: Investigation of prevalence and risk factors. Aviat Space Environ Med, 76(12):1128-1135. Abel SM (2008). Barriers to hearing conservation programs in combat arms occupations. Aviat Space Environ Med, 79: 591-598. Abel SM, Alberti PW, Haythornthwaite C, Riko K (1982). Speech intelligibility in noise: Effects of fluency and hearing protector type. J Acoust Soc Am, 71(3):708-15. Abel SM, Armstrong NM (1993). Sound localization with hearing protectors. J Otolaryngol 22:357-363. Abel SM, Armstrong NM, Giguère C (1993). Auditory perception with level-dependent hearing protectors: the effects of age and hearing loss. Scand Audiol, 22(2):71-85. Abel SM, Boyne S, Roesler-Mulroney H (2009). Sound localization with an army helmet worn in combination with an in-ear advanced communications system. Noise & Health, 11(45):199-205. Abel SM, Burrell C, Saunders D (2015). The effect of integrated hearing protection surround levels on sound localization. Scientific Report DRDC-RDDC-2015-R012. Defence Research and Development Canada, 32pp. Abel SM, Krever EM, Giguère C, Alberti PW (1991). Signal detection and speech perception with level-dependent hearing protectors. J Otolaryngol, 20(1):46-53. Abel SM, Kunov H, Pichora-Fuller MK, Alberti PW (1985). Signal detection in industrial noise: Effects of noise exposure history, hearing loss, and the use of ear protection. Scand Audiol, 14(3):161-173. Abel SM, Giguère C (1997). A review of the effect of hearing protective devices on auditory perception: The integration of active noise reduction and binaural technologies. Final report Contract W7711-6-7316/001 SRV. National Defence, Canada, 50pp. Abel SM, Hay VH (1996). Sound localization: The interaction of aging, hearing loss, and hearing protection. Scand Audiol, 25:3-12. Abel SM, Nakashima A, Saunders D (2011). Speech understanding in noise with integrated in-ear and muff-style hearing protection systems. Noise & Health, 13(55):378-384. Abel SM, Nakashima A, Smith I (2012). Divided listening in noise in a mock-up of a military command post. Mil Med, 177(4):436-443. Abel SM, Paik JE (2005). Sound source identification with ANR earmuffs. Noise & Health, 7:1-10. Abel, SM, Sass-Kortsak A, Kielar A (2002). The effect on earmuff attenuation of other safety gear worn in combination. Noise & Health 5: 1-13. Abel SM, Spencer DL (1997). Active noise reduction versus conventional hearing protection. Relative benefits for normal-hearing and impaired listeners. Scand Audiol, 26:155-67. Abel SM, Tsang S, Boyne S (2007). Sound localization with communication headsets: Comparison of passive and active systems. Noise & Health, 9(37):101-107.

47
Abouchacra KS, Breitenbach J, Mermagen T, Letowski T (2001). Binaural Helmet: Improving Speech Recognition in Noise with Spatialized Sound. Hum Factors, 43(4):584–594. Acton WI (1977). Problems Associated with the Use of Hearing Protection. Ann Occup Hyg, 20:387-395. Alali KA, Casali JG. (2011). The challenge of localizing vehicle backup alarms: effects of passive and electronic hearing protectors, ambient noise level, and backup alarm spectral content. Noise & Health, 13(51):99-112. Alali KA, Casali JG (2012). Auditory backup alarms: distance-at-first detection via in-situ experimentation on alarm design and hearing protection effect. Work, 41:3599-3607. Anderson BW, Garinther GR (1997). Effects of active noise reduction in armor crew headsets. In AGARD Conference Proceedings 596 (pp. 20-1–20-6). Neuilly-sur-Seine, France: Advisory Group for Aerospace Research and Development. Retrieved from: ftp://ftp.rta.nato.int//PubFullText/AGARD/CP/AGARD-CP-596///AGARDCP596.pdf [Accessed February 27, 2013]. ANSI/ASA S3.2 (2009). American National Standard Method for Measuring the Intelligibility of Speech over Communication Systems. Melville NY: Acoustical Society of America. ANSI S3.5-1997 (R2012). American National Standard: Methods for Calculation of the Speech Intelligibility Index. New York: American National Standards Institute. ANSI S3.14-1977 (R1997). American National Standard: Rating Noise With Respect to Speech Interference. New York: American National Standards Institute. ANSI S3.19-1974 (R1990). American National Standard Method for the Measurement of Real-Ear Protection of Hearing Protectors and Physical Attenuation of Ear-muffs – WITHDRAWN. New York: American National Standards Institute. ANSI S3.36-1985 (R2006). American National Standard Specification for a Manikin for Simulated in-situ Airborne Acoustic Measurements. New York: American National Standards Institute. ANSI/ASA S12.68-2007 (R2012). American National Standard Methods of Estimating Effective A-Weighted Sound Pressure Levels When Hearing Protectors are Worn. Melville NY: Acoustical Society of America. ANSI/ASA S12.42 (2010). American National Standard Methods for the measurement of insertion loss of hearing protection devices in continuous or impulsive noise using microphone-in-real-ear or acoustic test fixture procedures. Melville NY: Acoustical Society of America. Arbogast TL, Mason CR, Kidd G (2002). The effect of spatial separation on informational and energetic masking of speech. J Acoust Soc Am, 112:2086–2098. Arbogast TL, Mason CR, Kidd G (2005). The effect of spatial separation on informational masking of speech in normal-hearing and hearing-impaired listeners. J Acoust Soc Am, 117(4), Pt. 1:2169-2180. Arlinger S (1992). Speech recognition in noise when wearing amplitude-sensitive ear-muffs. Scand Audiol, 21:123-126.
Atherley GRC, Noble WG (1970). Effect of Ear - Defenders (ear muffs) on the Localization of Sound. Brit J Industr Med, 27:260-265. Azman AS, Hudak RL (2011). An evaluation of sound restoration hearing protection devices and audibility issues in mining. Institute of Noise Control Engineering, 9pp. Retrieved from http://www.cdc.gov/niosh/mining/UserFiles/works/pdfs/aeosr.pdf [Accessed February 27, 2013].

48
Berger EH (1991). Flat-response, moderate-attenuation, and level-dependent HPDs: How they work, and what they can do for you. Spectrum, 8(Suppl 1): 1-17. Berger EH (2000). Hearing protection devices. In EH Berger, LH Royster, JD Royster, DP Driscoll, M. Layne (Eds.), The Noise Manual (Fifth Edition) (pp.379-454). Fairfax, VA: American Industrial Hygiene Association. Berger EH, Casali JG (1997). Hearing protection devices. In: MJ Crocker (Ed.), Encyclopedia of acoustics (First Edition) (pp.967-981). New-York, NY: John Wiley and Sons. Berglund B, Lindvall T, Schwela DH, Goh K-T (Eds.) (2000). Guidelines for Community Noise. Institute of Environmental Epidemiology (Singapore) and World Health Organisation (Geneva), 138 pp. Bernstein ER, Brammer AJ, Gongqiang Y (2012). Improving speech understanding in communication headsets: Simulation of adaptive subband processing for speech in noise. Int J Ind Ergonom, xxx (in press): 1-10. Best V, Ozmeral E, Gallun FJ, Sen K, Shinn-Cunningham B (2005). Spatial unmasking of birdsong in human listeners: Energetic and informational factors. J Acoust Soc Am, 118:3766–3773. Bockstael A, De Coensel B, Botteldooren D, D’Haenes W, Keppler H, Maes L, Philips B, Swinnen F, Bart V (2011). Speech recognition in noise with active and passive hearing protectors: A comparative study. J Acoust Soc Am, 129(6):3702-3715. Bohnker BK, Page JC, Rovig G, Betts LS, Muller JG, Sack DM (2002). U.S. Navy and Marine Corps hearing conservation program 1995-1999: mean hearing thresholds for enlisted personnel by gender and age group. Mil Med, 167(2):132-135. Bolia RS (2003). Effects of spatial intercoms and active noise reduction headsets on speech intelligibility in an AWACS environment. Proceedings of the Human Factors and Ergonomics Society 47th Annual Meeting, Denver, Colorado (October 13-17): 100-104. Bolia RS, D’angelo WR, Mishler PJ, Morris LJ (2001). Effects of hearing protectors and auditory localization in azimuth and elevation. Hum Factors, 43:122-128. Bond ZS, Moore TJ, Gable B (1989). Acoustic-phonetic characteristics of speech produced in noise and while wearing an oxygen mask. J Acoust Soc Am, 85:907–912. Borg E, Bergkvist C, Bagger-Sjoback D (2008). Effect on directional hearing in hunters using amplifying (level dependent) hearing protectors. Otol Neurotol, 29:579-585. Bradlow AR, Torretta GM, Pisoni DB. (1996). Intelligibility of normal speech I: Global and fine-grained acoustic-phonetic talker characteristics. Speech commun 20:255-272. Bronkhorst AW, Brand T, Wagener K (2002). Evaluation of context effects in sentence recognition. J Acoust Soc Am, 111:2874-2886. Bronkhorst AW, Plomp R (1988). The effect of head-induced interaural time and level differences on speech intelligibility in noise. J Acoust Soc Am, 83:1508-1516. Bronkhorst AW, Plomp R (1992). Effect of multiple speech-like maskers on binaural speech recognition in normal and impaired hearing. J Acoust Soc Am, 92:3132–3139. Brungart DS, Hobbs BW, Hamil JT (2007). A comparison of acoustic and psychoacoustic measurements of pass-through hearing protection devices. Proceedings of IEEE Workshop on Applications of Signal Processing to Audio and Acoustics. New Paltz, NY, USA (October 21-24): 70-73. Retrieved from: http://www.ee.columbia.edu/~dpwe/papers/BrunHH07-passthrough.pdf [Accessed February 27, 2013]. Bürki-Cohen J, Miller JL, Eimas PD (2001). Perceiving non-native speech. Lang Speech, 44:149-169.

49
CAN/CSA Z94.02 (R2007). Hearing protection devices – Devices, performance, selection, and use. Toronto: Canadian Standards Association. Canetto P (2009). Hearing protectors: Topicality and research needs. Int J Occup Saf Ergon, 15(2):141-153. Carbonneau M-A, Lezzoum N, Voix J, Gagnon G (2012). Detection of alarms and warning signals on an digital in-ear device. Int J Ind Ergonom, xxx (in press):1-9. Carhart R, Tillman TW, Greetis ES (1969). Perceptual masking in multiple sound backgrounds. J Acoust Soc Am, 45:694–703. Carmichel EL, Harris FP, Story BH (2007). Effects of binaural electronic hearing protectors on localization and response time to sounds in the horizontal plane. Noise & Health, 9:37, 83-95. Casali JG (2010a). Passive augmentations in hearing protection technology circa 2010 including flat-attenuation, passive level-dependent, passive wave resonance, passive adjustable attenuation, and adjustable-fit devices: Review of design, testing, and research. Int J Acoust Vibr, 15(4): 187-195. Casali JG (2010b). Powered electronic augmentations in hearing protection technology circa 2010 including active noise reduction, electronically-modulated sound transmission, and tactical communications devices: review of design, testing, and research. Int J Acoust Vibr, 15(4):168-186. Casali JG, Ahroon WA, Lancaster JA (2009). A field investigation of hearing protection and hearing enhancement in one device: For soldiers whose ears and lives depend upon it. Noise & Health, 11(42):69-90. Casali JG, Alali KA (2010). Etymotic EB-15 (Lo Position) BlastPLG Evaluation: Backup Alarm Localization Appended Experiment. Blacksburg, Virginia, USA: Virginia Tech, Audio Lab Report No. 6/9/10-2-HP, ISE Dept. Report No. 201002: 32 pp. Retrieved from: http://www.etymotic.com/download/Casali&Alali2010.pdf [Accessed February 27, 2013]. Casali JG, Gerges S (2006). Protection and enhancement of hearing in noise. In RC Williges (Ed.) Reviews of Human Factors and Ergonomics. Vol. 2 (pp.195-240). Santa Monica, CA: Human Factors and Ergonomics Society Casali JG, Horylev MJ, Grenell JF (1987). A pilot study on the effects of hearing protection and ambient noise characteristics on intensity of uttered speech. In SS Asfour (Ed.) Trends in Ergonomics/Human Factors IV (pp. 303–310). North Holland: Elsevier Science. Casali JG, Lancaster JA, Valimont RB, Gauger D (2007). Headset in light aircraft cockpits : Speech intelligibility, PELs, and flight performance. Proceedings of the International Congress on Noise Control Engineering, Reno NV, USA (October 22-25): Paper No. 129. Casali JG, Robinson GS, Dabney EC Gauger D (2004). Effect of electronic ANR and conventional hearing protectors on vehicle backup alarm detection in noise. Hum Factors, 46(1): 1-10. Casali JG, Wright WH (2005). Do amplitude-sensitive hearing protectors improve detectability of vehicle backup alarms in noise? Proceedings of the Human Factors and Ergonomics Society 39th Annual Meeting, San Diego, California (October 9-13): 994-998. Retrieved from: http://pro.sagepub.com/content/39/15/994.full.pdf [Accessed February 27, 2013]. Casto KL, Casali JG (2012). Effects of headset, flight workload, hearing ability, and communications message quality on pilot performance. Hum Factors, published online 28 September 2012. Retrieved from http://hfs.sagepub.com/content/early/2012/10/22/0018720812461013 [Accessed February 27, 2013].

50
Chung K (2007). Effective compression and noise reduction configurations for hearing protectors. J Acoust Soc Am, 121(2):1090-1101. Chung DY, Gannon RP (1979). The effect of ear protectors on word discrimination in subjects with normal hearing and subjects with noise-induced hearing loss. J Am Auditory Soc, 5:11-16. Chung K, Tufts J, Nelson L (2009). Modulation-based digital noise reduction for application to hearing protectors to reduce noise and maintain intelligibility. Hum Factors, 51(1):78-89 Coles RRA, Rice CG (1965). Earplugs and Impaired Hearing. J Sound Vib, 3(3):521-523. Dame MA, Patra H, Vaz PC, Ray B (2013). Effects of speakers’ language background on speech perception in adults. J Acoust Soc Am, 134(5):4063. Dancer A, Buck K, Parmentier, G, Hamery P (1998). The specific problem of noise in military life. Scand Audiol, 27(Suppl 48): 123-130. Department of the Army USA (1998). Hearing Conservation Program. DA Pamphlet 40-501 (10 December 1998), 17 pp. Retrieved from: http://www.apd.army.mil/pdffiles/p40_501.pdf [Accessed February 27, 2013]. Dillon, H. (2001). Hearing Aids, 1st Edition (Thieme Boomerang Press).
Dirks DD, Wilson RH (1969). The effect of spatially separated sound sources on speech intelligibility. J Speech Hear Res, 12:650–664. Dolan TG, O’Loughlin D (2005). Amplified earmuffs: Impact of speech intelligibility in industrial noise for listeners with hearing loss. Am J Audiol, 14: 80-85. Driscoll DP, Royster LH (2000). Noise control engineering. In EH Berger, LH Royster, JD Royster, DP Driscoll, M Layne (Eds.), The Noise Manual, Fifth Edition (Chapter 9). Fairfax, VA: American Industrial Hygiene Association. EN 458 (2004). Hearing protectors – recommendations for selection, use, care and maintenance – Guidance document. Brussels: European Committee for Standardization. Evelkin V, Cohen I (2012). Effect of latency time in high frequencies on sound localization. Proceedings of the 2012 IEEE 27th Convention of Electrical and Electronics Engineers, Eilat, Israel (November 14-17): 4 pp. Retrieved from: https://sipl.technion.ac.il/siglib/IEEE/ieeei2012_submission_166.pdf [Accessed February 27, 2013]. Florentine M (1985). Non-native listeners’perception of American-English in noise. Proceedings of Internoise, 1021-1024. Florentine M, Buus S, Scharf B, Canevet G (1984). Speech reception thresholds in noise for native and non-native listeners. J Acoust Soc Am, 75(S1): 84. Forshaw SE (1970). Guide to Noise-Hazard Evaluation. DRET Review Paper No. 771. Defence Research Board, Department of National Defence Canada, 40 pp. Freyman RL, Helfer KS, McCall DD, Clifton RK (1999). The role of perceived spatial separation in the unmasking of speech. J Acoust Soc Am, 106:3578–3588. Gasaway DC (1994). Occupational hearing conservation in the military. In DM Lipscomb (Ed.), Hearing Conservation in Industry, Schools and the Military (pp. 243-262). San Diego, CA: Singular Publishing Group.
51
Gerges S, Casali JG (2007). Hearing protectors. In M Crocker (Ed.) Handbook of Noise and Vibration Control (Chapter 3). New York: John Wiley. Giguère C, Abel SM, Arrabito GR (2000). Binaural technology for application to active noise reduction communication headsets: Design considerations. Canadian Acoustics, 28(1):3-13. Giguère C, Laroche C (2005). Hearing loss prevention program in the military environment. Canadian Acoustics, 33(4), 21-30. Giguère C, Laroche C, Brammer AJ, Vaillancourt V, Yu G (2011a). Advanced hearing protection and communication: Progress and challenges. Proceedings of the 11th International Congress on Noise as a Public Health Problem, London, England (July 24-28): 8pp. Giguère C, Laroche C, Brault É, Ste-Marie J-C, Brosseau-Villeneuve M, Philippon B, Vaillancourt V (2006). Quantifying the Lombard effect in different background noises. 4th Joint Meeting of the Acoustical Society of America and the Acoustical Society of Japan, Honolulu, 28 Nov-2 Dec., J Acoust Soc Am, 120: 3378. Giguère C, Laroche C, Vaillancourt V (2010). Modelling speech intelligibility in the noisy workplace for normal-hearing and hearing-impaired listeners using hearing protectors. Int J Acoust Vibr, 15(4): 156-167. Giguère C, Laroche C, Vaillancourt V (2011b). Research on Modelling the Effect of Personal Hearing Protection and Communications Devices on Speech Intelligibility in Noise. Final Report DRDC Toronto CR 2011-101. Giguère C, Laroche C, Vaillancourt V, Shmigol E, Vaillancourt T, Chiasson J, Rozon-Gauthier V (2012). A multidimensional evaluation of auditory performance in one powered electronic level-dependent hearing protector. Proceedings of the International Conference on Sound and Vibration, Vilnius, Lithuania (July 8-12): 8 pp. Giguère C, Laroche C, Vaillancourt V, Soli S (2008). Modelling the Effect of Personal Hearing Protection and Communications Devices on Speech Perception in Noise. Final Report DRDC Toronto CR 2008-178. Goelzer B, Hansen CH, Sehmdt GA (Eds.) (2001). Occupational Exposure to Noise: Evaluation, Prevention and Control. Federal Institute for Occupational Health and Safety (Dortmund) and World Health Organization (Geneva): 336 pp. Retrieved from: http://www.who.int/occupational_health/publications/occupnoise/en/index.html [Accessed February 27, 2013]. Hawley ML, Litovsky RY, Colbum HS (1999). Intelligibility and localization of speech signals in a multi-source environment. J Acoust Soc Am, 105:3436–3448. Henselman LW, Henderson D, Shadoan J, Subramaniam M, Saunders S, Ohlin D (1995). Effects of noise exposure, race, and years of service on hearing in U.S. army soldiers. Ear Hear, 16(4):382-391. Hirsh IJ (1950). Relation between localization and intelligibility. J Acoust Soc Am, 22:196–200. Hormann H, Lazarus-Mainka G, Schubeius M, Lazarus H (1984). The effect of noise and the wearing of ear protectors on verbal communication. Noise Control Eng J, 23(2):69–77. Howell K, Martin AM (1975). An investigation of the effects of hearing protectors on vocal communication in noise. J Sound Vib, 41(2):181–196. Humes LE, Joellenbeck LM, Durch JS (Eds.) (2006). Noise and Military Service: Implications for Hearing Loss and Tinnitus, Washington, DC: The National Academies Press, 339 p.

52
ISO 7029: 2000 (2000). Acoustics – Threshold of Hearing by Air Conduction as a Function of Age and Sex for Otologically Normal Persons. International Organization for Standardization, Geneva, Switzerland. ITU-T Recommendation P.800 (1998). Methods for subjective determination of transmission quality. International Telecommunication Union, Geneva, Switzerland. James S (2005). Defining the cockpit noise hazard, hearing damage risk and the benefits Active Noise Reduction headsets can provide. In Personal Hearing Protection Including Active Noise Reduction, NATO RTO Lecture Series HFM-111, 24 pages. Retrieved from: http://ftp.rta.nato.int/public//PubFullText/RTO/EN/RTO-EN-HFM-111///EN-HFM-111-05.pdf [Accessed February 27, 2013] Johnstone PM, Litovsky RY (2006). Effect of masker type and age on speech intelligibility and spatial release from masking in children and adults. J Acoust Soc Am, 120:2177–2189. Junqua J (1993). The Lombard reflex and its role on human listeners and automatic speech recognizers. J Acoust Soc Am, 93:510–524. Koehnke J, Besing JM (1996). A procedure for testing speech intelligibility in a virtual listening environment. Ear Hear, 17:211–217. Kotarbi ska E, Koz owski E (2005). Speech intelligibility in noise when wearing hearing protectors are used. Noise at Work, 8:29-31. Kreul JE, Nixon JC, Kryter KD, Bell DW, Lang J (1968). A proposed clinical test of speech discrimination. J Speech Hear Res, 11: 536-552. Kryter KD (1946). Effects of ear protective devices on the intelligibility of speech in noise. J Acoust Soc Am, 18:413–417. Lane H, Tranel B (1971). The Lombard sign and the role of hearing in speech. J Speech Hear Res, 14:677–709. Lazarus H (2005). Signal recognition and hearing protectors with normal and impaired hearing. JOSE, 11(3):233-250. Lecumberri MLG, Cooke M (2006). Effect of masker type on native and non-native consonant perception in noise. J Acoust Soc Am, 119:2445-2454. Letowski T, McGee L (1993). Detection of warble tones in wideband noise with and without hearing protection devices. Ann Occup Hyg, 37:607-614. Lin J-H, Li P-C, Tang S-T, Liu P-T, Young S-T (2005). Industrial wideband noise reduction for hearing aids using a headset with adaptive-feedback active noise cancellation. Med Biol Eng Comput, 43:739-745. Lindeman HE (1976). Speech Intelligibility and the Use of Hearing Protectors. Audiol, 15:348-356. Lindley GA, Palmer CV, Goldstein H, Pratt S (1997). Environmental awareness and level-dependent hearing protection devices. Ear Hear, 18(1):73-82. Markham D, Hazan V (2004). The effect of talker- and listener-related factors on intelligibility for a real-world, open-set perception test. J Speech Lang Res, 47:725-737. Martin N, Clark SG (2003). Introduction to Audiology. 8th Edition. Boston: Allyn et Bacon.

53
Martin AM, Howell K, Lower MC (1976). Hearing protection and communication in noise. In SDG Stephens (Ed.), Disorders of Auditory Function (pp. 47–62). New York: Academic. Mayo LH, Florentine M, Buus S (1997). Age of second-language acquisition and perception of speech in noise. JSpeech Hear Res, 40:686-693. McBride M, Hodges M, French J (2008a). Speech intelligibility differences of male and female vocal signals transmitted through bone conduction in background noise: implications for voice communication headset design. Int J Ind Ergon, 38:1038-1044. McBride M, Letowski T, Tran P (2008b). Bone conduction reception: head sensitivity mapping. Ergonomics, 51:702-718. McBride M, Tran P, Letowski T, Patrick R (2011). The effect of bone conduction microphone locations on speech intelligibility and sound quality. Appl Ergon, 42:495-502. McBride M, Weatherless R, Mermagen T, Letowski T (2009). Effects of hearing protection on speech communication. Proceedings of the Sixteenth International Congress on Sound and Vibration, Krakòw, Poland (July 5-9): 8pp. McKinley RL (2000). Communication and localization with hearing protectors. Paper presented at the RTO HFM Lecture Series on “Damage Risk from Impulse Noise”, held in Maryland, USA, 5-6 June 2000 and Meppen, Germany, 15-16 June 2000, and published in RTO EN-11. Retrieved from: http://ftp.rta.nato.int/public//PubFulltext/RTO/EN/RTO-EN-011///EN-011-04.pdf [Accessed February 27, 2013] Mershon DH, Lin LJ (1987). Directional localization in high ambient noise with and without the use of hearing protectors. Ergonomics, 30(8):1161–1173. Morata TC, Fiorini AC, Fischer FM, Krieg EF, Gozzoli L, Colacioppo S (2001). Factors affecting the use of hearing protectors in a population of printing workers. Noise & Health, 4(13):25-32. Morata TC, Themann CL, Randolph RF, Verbsky BL, Byrne DC, Reeves ER. (2005). Working in noise with a hearing loss: perceptions from workers, supervisors, and hearing conservation program managers. Ear Hear, 26:529-545. Mozo BT, Murphy, BA (1997). The assessment of sound attenuation and speech intelligibility of selected active noise reduction devices and the communications earplug when used with the HGU-56/P aviation helmet. USAARL report no. 97-08. Fort Rucker, AL. U.S. Army Aeromedical Research Laboratory, January 1997. Retrieved from: http://www.usaarl.army.mil/TechReports/97-08.PDF [Accessed February 27, 2013]. Nakashima A, Abel SM (2009). Effects of integrated hearing protection headsets on the quality of radio communications. Defence R&D Canada Technical Report DRDC Toronto TR 2009-074 July 2009, 36p. Retrieved from: http://www.dtic.mil/cgi-bin/GetTRDoc?AD=ADA514622 [Accessed February 27, 2013]. Nakashima A, Abel SM, Smith I (2015). Communication between native and non-native speakers of English in noise. Proceedings of the Acoustics Week in Canada, Nova Scotia, Canada (October 6-9): 2pp. Nakashima A, Abel SM, Duncan M, Smith D (2007). Hearing, communication and cognition in low-frequency noise from armoured vehicle. Noise & Health, 9:35-41. Neely KK (1959). Hearing conservation for the armed forces. Med. Ser. Jour. (Can.), 235-247. Neitzel R, Seixas N (2005). Use and effectiveness of hearing protectors in construction. J Acoust Soc Am, 117(4 Pt. 2):2479.

54
Nilsson M, Soli SD, Sullivan JA (1994). Development of the Hearing in Noise Test for the measurement of speech reception thresholds in quiet and in noise. J Acoust Soc Am, 95:1085-1099. Nixon CW, Berger EH (1998). Hearing protection devices. In CM Harris (Ed.), Handbook of acoustical measurements and noise control (3rd ed.) (pp. 21.1-21.24). Woodbury, NY: Acoustical Society of America Nixon CW, McKinley RL, Steuver JW (1992). Performance of active noise reduction headsets. In AL Dancer, D Henderson, RJ Salvi, RP Hamernik (Eds.), Noise-induced hearing loss (pp. 389-400). St. Louis: Mosby-Year Book. Nixon CW, Morris LJ, McCavitt AR, McDaniel P, Anderson TR, McKinley RL, Yeager DG (1997). Vulnerability of female speech produced in operational noises. AGARD Conference Proceedings 596, Neuilly-sur-Seine, France, Advisory Group for Aerospace Research and Development: pp. 27-1–27-12. Retrieved from: ftp://ftp.rta.nato.int//PubFullText/AGARD/CP/AGARD-CP-596///AGARDCP596.pdf[Accessed February 27, 2013]. Noble WG (1981). Earmuffs, exploratory head movements, and horizontal and vertical sound localization. J Aud Res, 21(1):1–12. Noble W, Byrne D, Ter-Horst K (1997). Auditory localization, detection of spatial separateness, and speech hearing in noise by hearing-impaired listeners. J Acoust Soc Am, 102:2343–2352. Noble W, Murray N, Waugh R (1990). The effects of various hearing protectors on sound localization in the horizontal and vertical planes. Am Ind Hyg Assoc J, 51:370-377. Noble WG, Russell G (1972). Theoretical and Practical Implications of the Effects of Hearing Protection Devices on Localization Ability. Acta Otolaryng, 74:29-36. Okpala NC (2007). Knowledge and attitude of infantry soldiers to hearing conservation. Mil Med, 172:520-522. Ong M, Choo JTL, Low E (2004). A self-controlled trial to evaluate the use of active hearing defenders in the engine rooms of operational naval vessels. Singapore Med J, 45(2):75-78. Pawelczyk M, Czyz K, Latos M, Michalczyk MI, Mazur K (2011a). Integrating noise control, speech enhancement and wireless communication in an active earplug. Proceedings of the 18th International Congress on Sound & Vibration, ICSV18, Rio de Janeiro, Brazil (July 10-14): 8p. Pawelczyk M, Latos M, Michalczyk MI, Czyz K, Mazur K (2011b). An efficient communication system for noisy environments. Proceedings of 2011 International Conference on Modelling, Identification and Control, Shanghai, China (June 26-29): 5p. Pawelczyk M, Mielcarek A (2012). Wavelet speech enhancement with reference signal based inference in application to personal active noise control systems. Proceedings of the 19th International Congress on Sound and Vibration, Vilnius, Lithuania (July 8-12), 7p. Pelausa EO, Abel SM, Simard J (1995). Prevention of noise-induced hearng loss in the Canadian military. JOtolaryngol, 24(5):271-280. Pelausa EO, Lamontagne P, Niquette F (1991). Noise and the Military Profession. Canadian Forces Hearing Conservation Program Evaluation (CFHCP-E), Phase I, 38 pp. Pichora-Fuller MK, Goy H, van Lieshout P (2010). Effect on Speech Intelligibility of Changes in Speech Production Influenced by Instructions and Communication Environments. Seminars in Hearing, 31(2):77-94.
55
Plomp R (1976). Binaural and monaural speech intelligibility of connected discourse in reverberation as a function of azimuth of a single competing sound source (speech or noise). Acustica, 34:200–211. Plomp R, Mimpen AM (1981). Effect of the orientation of the speaker’s head and the azimuth of a noise source on the speech reception threshold for sentences. Acustica, 48:325–328. Plyler PN, Klumpp ML (2003). Communication in noise with acoustic and electronic hearing protection devices. J Amer Acad Audiol, 14:260-268. Prince MM, Colligan MJ, Stephenson CM, Bischoff BJ. (2004). The contribution of focus groups in the evaluation of hearing conservation program (HCP) effectiveness. J Safety Res, 35:91-106. Rhebergen KS & Versfeld NJ (2005). A speech intelligibility index-based approach to predict the speech reception threshold for sentences in fluctuating noise for normal-hearing listeners. Journal of the Acoustical Society of America, 117:2181-2192. Rhebergen KS, Versfeld NJ, Dreschler WA (2008). Prediction of the intelligibility for speech in real-life background noises for subjects with normal hearing, Ear Hear., 29, 169-175. Ribera JE, Mozo BT, Murphy BA (2004). Speech intelligibility with helicopter noise: Tests of three helmet-mounted communication systems. Aviat Space Environ Med, 75(2):132-7. Rink TL (1979). Hearing Protection and Speech Discrimination in Hearing-Impaired Persons. Sound Vib,13(1):22-25. Robinson GS, Casali JG (1995). Audibility of reverse alarms under hearing protectors for normal and hearing-impaired listeners. Ergonomics, 38(11):2181-2299. Rogers IEC (1997). An assessment of the benefits active noise reduction systems provide to speech intelligibility in aircraft noise environments. Proceedings of the Fifth European Conference on Speech Communication and Technology, EUROSPEECH 1997, Rhodes, Greece (September 22-25): 4 p. Retrieved from: http://www.mirlab.org/conference_papers/International_Conference/Eurospeech%201997/pdf/wmb/a0805.pdf [Accessed February 27, 2013] Rogers CL, Dalby J, Nishi K (2004). Effects of noise and proficiency on intelligibility of Chinese-accented English. Lang Speech, 47:139-154. Russel G (1976). Effects of earmuffs and earplugs on azimuthal changes in spectral patterns: Implications for theories of sound localization. J Aud Res, 16:193-207. Russell G (1977). Limits to behavioral compensation for auditory localization in earmuff listening conditions. JAcoust Soc Am, 61:219-220. Rylands JM, Forshaw SE (1988). Future Efforts to Control Hearing Loss in the Canadian Forces. Defence and Civil Institute of Environmental Medicine (Toronto, Ontario). Technical Report DCIEM 88-TR-17, 8 pp. Scharine AA, Letowski TR (2005). Factors Affecting Auditory Localization and Situational Awareness in the Urban Battlefield. U.S. Army Research Laboratory Report #ARL-TR-3474, April 2005. Retrieved form: http://www.dtic.mil/cgi-bin/GetTRDoc?AD=ada431963 [Accessed February 27, 2013]. Schumacher T, Krüger H, Jeub M, Vary P, Beaugeant C (2011). Active noise control in headsets: A new approach for broadband feedback ANC. Proceedings of IEEE International Conference on Acoustics, Speech, and Signal Processing (ICASSP), Prague, Czech Republic (May 22-27): 417-420. Retrieved from: http://www.ind.rwth-aachen.de/fileadmin/publications/schumacher11.pdf [Accessed February 27, 2013].

56
Sheen SC, Hsiao YH (2007). On using multiple-jet nozzles to suppress industrial jet noise. J Occup Environ Hyg, 4:669-677. Shimizu T, Makishima K, Yoshida M, Yamagishi H (2002). Effect of background noise on perception of English speech for Japanese listeners. Auris Nasus Larynx, 29:121-125. Shinn-Cunningham BG, Schickler J, Kopco N, Litovsky R (2001). Spatial unmasking of nearby speech sources in a simulated anechoic environment. J Acoust Soc Am, 110:1118–1129. Simpson BD, Bolia RS, Mckinley RL, Brungart DS (2005). The impact of hearing protection on sound localization and orienting behavior. Hum Factors, 47:188-198. Simpson C, King R (1997). Active noise reduction flight tests in military helicopters. AGARD Conference Proceedings 596, Neuilly-sur-Seine, France, Advisory Group for Aerospace Research and Development: pp. 22-1–22-18. Retrieved from: ftp://ftp.rta.nato.int//PubFullText/AGARD/CP/AGARD-CP-596///AGARDCP596.pdf [Accessed February 27, 2013]. Starrs MB (2001). Effects of standard and high-fidelity earplugs on the speech recognition performance of normal-hearing and hearing-impaired listeners in noise. Department of Communication disorders. Central Michigan University, Mount Pleasant, MI, 61 pp. Summers WV, Pisoni DB, Bernacki RH, Pedlow RI, Stokes MA (1988). Effects of noise on speech production: Acoustic and perceptual analyses. J Acoust Soc Am, 84:917–928. Suter AH (1989). The effects of hearing protectors on speech communication and the perception of warning signals (AMCMS Code 611102.74A0011). Aberdeen Proving Ground, MD: U.S. Army Human Engineering Laboratory: 1–32. Retrieved from: http://www.dtic.mil/dtic/tr/fulltext/u2/a212521.pdf [Accessed February 27, 2013] Suter AH (1992). Communication and job performance in noise: A review. ASHA Monographs Number 28, 84 pp. Suter AH (2002). Hearing conservation Manual, Fourth Edition (Council for Accreditation in Occupational Hearing Conservation, Milwaukee USA), 312 pp. Suter AH (2012). Engineering controls for occupational noise exposure, Sound and Vibration, January issue, 24-31. Takimoto M, Nishino T, Itou K, Takeda K (2007). Sound localization under conditions of covered ears on the horizontal plane. Acoustical Science and Technology, 28:335-342. Talcott KA, Casali JG, Keady JP, Killion MC (2012). Azimuthal auditory localization of gunshots in a realistic field environment: Effects of open-ear versus hearing protection-enhancement devices (HPEDs), military vehicle noise, and hearing impairment. Int J Audiol, 51:S20–S30. Tufts JB, Frank T (2003). Speech production in noise with and without hearing protection. J Acoust Soc Am, 114(2): 1069-1080. Tufts JB, Hamilton MA, Ucci AJ, Rubas J (2011). Evaluation by industrial workers of passive and level-dependent hearing protection devices. Noise & Health, 13(50):26-36. Vaillancourt V, Laroche C, Mayer C, Basque C, Nali M, Eriks-Brophy A, Soli SD, Giguère C (2005). Adaptation of the HINT (hearing in noise test) for adult Canadian francophone populations. Int J Audiol, 44:358-369.
57
Vaillancourt V, Nélisse H, Laroche C, Giguère C, Boutin J, Laferrière P. (2012). Sécurité des travailleurs derrière les véhicules lourds – Évaluation de trois types d’alarmes sonores de recul. Rapport final, Institut de recherche Robert-Sauvé en santé et en sécurité du travail du Québec. Études et recherches / Rapport R-763, Montréal, IRSST, 2012, 105 pages. Retrieved from: http://www.irsst.qc.ca/-publication-irsst-securite-des-travailleurs-derriere-les-vehicules-lourds-evaluation-de-trois-types-d-alarmes-sonores-de-recul-r-763.html [Accessed February 27, 2013]. Valimont RB, Casali JG, Lancaster JA (2006). ANR vs passive communications headsets: Investigation of speech intelligibility, pilot workload, and flight performance in an aircraft simulator. Proceedings of the Human Factors and Ergonomics Society 50th Annual Meeting, San Francisco, California (October 16-20):2143-2147. Retrieved from: http://pro.sagepub.com/content/50/18/2143.full.pdf [Accessed February 27, 2013]. van Wijngaarden SJ (2003). The intelligibility of non-native speech. Doctoral thesis, Free University, Amsterdam. van Wijngaarden SJ, Bronkhorst AW, Houtgast T, Steeneken HJM (2004). Using the speech transmission index for predicting non-native speech intelligibility. J Acoust Soc Am, 115:1281-1291. van Wijngaarden SJ, James S (2004). Protecting Crew Members against Military Vehicle Noise. Paper presented at the RTO AVT Symposium on “Habitability of Combat and Transport Vehicles: Noise, Vibration and Motion” held in Prague, Czech Republic (October 4-7), and published in RTO-MP-AVT-110. Retrieved from: http://www.dtic.mil/cgi-bin/GetTRDoc?AD=ADA446747 [Accessed February 27, 2013]. van Wijngaarden SJ, Steeneken HJ, Houtgast T (2002). Quantifying the intelligibility of speech in noise for non-native talkers. J Acoust Soc Am, 112:3004-13. Vause NL, Grantham DW (1999). Effects of earplugs and protective headgear on auditory localization ability in the horizontal plane. Hum Factors, 41:282-294. Verbsky BL (2002). Effects of conventional passive earmuffs, uniformly attenuating passive earmuffs, and hearing aids on speech intelligibility in noise. Doctoral Dissertation, Ohio State University, 179 pages. Retrieved from: http://etd.ohiolink.edu/view.cgi?acc_num=osu1038964671 [Accessed February 27, 2013]. Vermiglio AJ (2008). The American English Hearing In Noise Test. International Journal of Audiology, 47:386-387. Versfeld NJ, Daalder L, Festen JM, Houtgast T (2000). Method for the selection of sentence materials for efficient measurement of the speech reception threshold. J Acoust Soc Am, 107:1671-1684. Volanthen, A. and Arndt, H. (2007). Hearing Instrument Technology, 3rd Edition (Thomson Delmar Learning). Wilde G, Humes LE (1990). Application of the articulation index to the speech recognition of normal and impaired listeners wearing hearing protection. J. Acoust. Soc. Am., 87, 1192-1199. Wilkins PA, Martin AM (1981). The effect of hearing protectors on the attention demand of warning sounds. Scand Audiol, 10:37-43. Wilkins PA, Martin AM (1987). Hearing protection and warning sounds in industry – A review. Appl Acoust, 21:267-293. Williams CE, Maxwell DW, Thomas GB (1995). Sound attenuation and speech intelligibility of a modified active noise reduction (ANR) headset for use by P3-C sensor operators. Naval Aerospace Medical Research Laboratory, Technical Memorandum 95-2, 28pp. Retrieved from: http://www.dtic.mil/dtic/tr/fulltext/u2/a297033.pdf [Accessed February 27, 2013].
58
Williams W (2009). Is it reasonable to expect individuals to wear hearing protectors for extended periods? Int J Occup Saf Ergon, 15(2):175-181. Williams W (2011). A qualitative assessment of the performance of electronic, level-dependent earmuffs when used on firing ranges. Noise & Health, 13(51):189-194. Yost WA, Dye RH, Sheft S (1996). A simulated ‘‘cocktail party’’ with up to three sound sources. Percept Psychophys, 58:1026–1036.
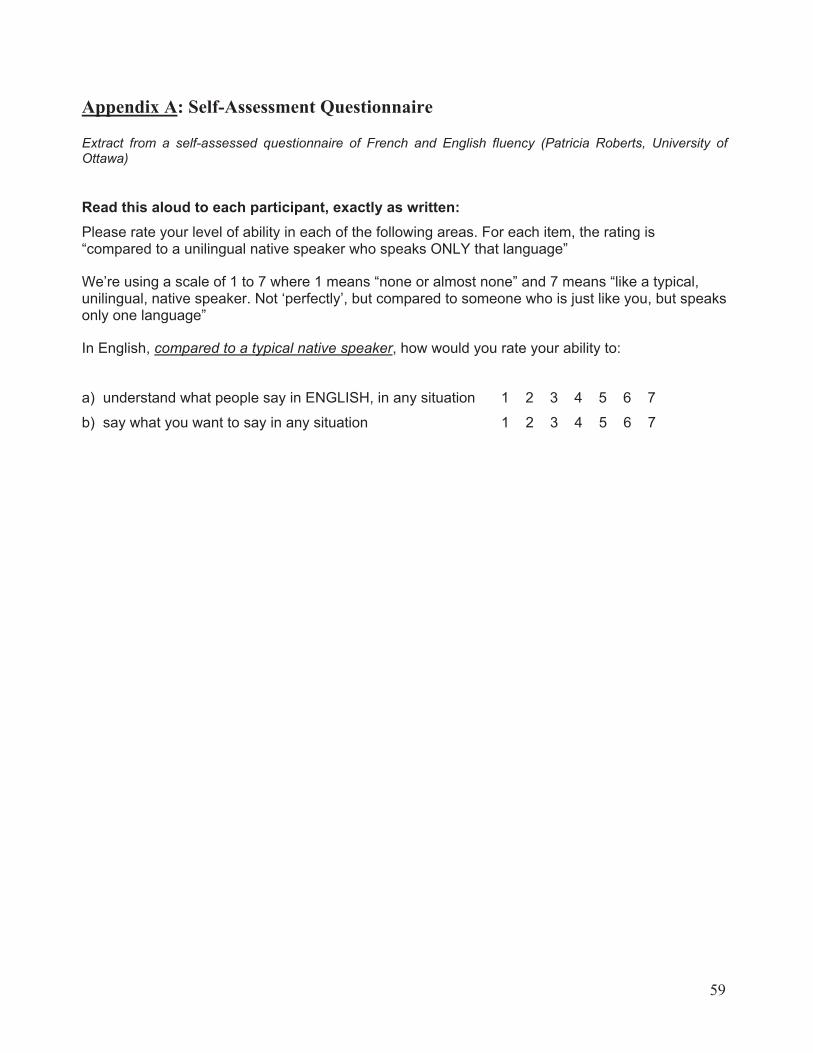
59
Appendix A: Self-Assessment Questionnaire Extract from a self-assessed questionnaire of French and English fluency (Patricia Roberts, University of Ottawa)
Read this aloud to each participant, exactly as written: Please rate your level of ability in each of the following areas. For each item, the rating is “compared to a unilingual native speaker who speaks ONLY that language”
We’re using a scale of 1 to 7 where 1 means “none or almost none” and 7 means “like a typical, unilingual, native speaker. Not ‘perfectly’, but compared to someone who is just like you, but speaks only one language”
In English, compared to a typical native speaker, how would you rate your ability to:
a) understand what people say in ENGLISH, in any situation 1 2 3 4 5 6 7
b) say what you want to say in any situation 1 2 3 4 5 6 7

60
Appendix B: Intelligibility and Sound Quality of Radio Messages in Noise over Tactical Communications Devices PARTICIPANT NUMBER:
CONDITION:
LISTENER/TALKER (please circle)
MODIFIED RHYME TEST PRACTICE LIST 1
MODIFIED RHYME TEST 1 LIST ______ part 1
1sing sitsin sillsip sick
2look shookcook tookhook book
3vest restnest testbest west
4kill kidkit kingkith kiss
5putt puffpub punpup pug
18pace palepage paypave pane
12came capecane cakecave case
8rust mustjust gustdust bust
14mass mapmath manmad mat
10sane savesafe samesale sake
6fin figfit fib fill fizz
7toil boilfoil soilcoil oil
13hold coldfold goldtold sold
9rig pigwig bigjig fig
15sale palegale balemale tale
16raw sawpaw thawjaw law
17rent wentdent senttent bent
11bit hitsit wit
fit kit
19came gamename famesame
20dub dulldun duckdud dug
21rake raveray razerate race
22bill hillfill willkill till
23pan pangpad passpat path
24keel peelreel eelfeel heel
25bus bunbuff buckbug but
1swell sellyell tellsmell well
2mole moanmost moldmode more
3grim slimhim rimdim whim
4bets bellbet beltbeg bend
5link minkthink winkdrink shrink

61
MODIFIED RHYME TEST 1 LIST ______ part 2
Please rate the perceived quality of radio transmissions from the listener’s perspective using the following scale. Circle the desired number from 1 to 5.
Mean opinion score (MOS) MOS Quality Impairment
5 Excellent Imperceptible4 Good Perceptible but not annoying 3 Fair Slightly annoying2 Poor Annoying1 Bad Very annoying
26heath heatheave hearheal heap
27sag sacksat sasssap sad
28gun nunrun sunbun fun
29tick picksick wicklick kick
30cuff cupcud cubcuss cut
43beach beatbean beakbead beam
37team teaktease tearteach teal
33den penhen menten then
39pig pillpin pickpip pit
35dip hiprip siplip tip
31peacepeakpeach peat
32pay waygay may say day
38sub sunsung supsud sum
34seat beatmeat heatfeat neat
40fed redshed wedbed led
41mop shoptop hopcop pop
42lane lamelace laylake late
36dip dindim diddig dill
44sang hanggang bangrang fang
45seep seedseem seetheseen seek
46park darkmark barklark hark
47pin dinsin tinfin win
48tab tangtan tamtack tap
49bath backbat banbass bad
50hot nottot gotlot pot

62
Appendix C: Intelligibility and Sound Quality of Radio Messages in Noise over Tactical Communications Devices
Summary of results
PARTICIPANT NUMBER: DATE: ________________
SKYLARK TEST SCORE:
Self-appraised fluency questionnaire: Please rate your level of ability in each of the following areas. For each item, the rating is “compared to a unilingual native speaker who speaks ONLY that language” We’re using a scale of 1 to 7 where 1 means “none or almost none” and 7 means “like a typical, unilingual, native speaker. Not ‘perfectly’, but compared to someone who is just like you, but speaks only one language” In English, compared to a typical native speaker, how would you rate your ability to: a) understand what people say in ENGLISH, in any situation 1 2 3 4 5 6 7 b) say what you want to say in any situation 1 2 3 4 5 6 7
Tympanometry:External ear canal
volume (cm3)Compliance
(cm3)Pressure(daPa)
Gradient (daPa)
Right ear Left ear
Air-conduction pure-tone thresholds (dB HL) at various audiometric frequencies (Hz) 250 500 1000 2000 3000 4000 6000 8000
Right ear Left ear
Listening tests: Practice in Noise Front: HINT Noise Front: Channel 1 (Digital)
Test condition (device, talk-
through setting, radio volume)
Testingorder
% word correct Volume Mean opinionscore
Total Initial consonant
Final consonant
Threat, ON, preferred volume
Threat, OFF, preferred volume
QuietPro, ON, preferred volume
QuietPro, OFF, preferred volume