+,3z x*, of north carolina, 1 984 - southern research · uals decreased by 12 percent to 933,000...
TRANSCRIPT

Department of
Agriculture Forest Statistics for the Farensenice
+,3z x*, @ *,.,.,*A Northern Coastal Plain
Satheastern F m of North Carolina, 1 984 Resource Bulletin SE-74 Edgar L. Davenport
August 1984
Southeastern Forest Experiment Station 200 Weaver Blud.
Asheville, North Carolina 28804
Forest Statistics for the
Northern Coastal Plain of North Carolina, 1984
Edgar L. Davenport, Forestry Technician Forest Inventory and Analysis
Asheville, North Carolina

Foreword
This report highlights the principal findings of the fifth forest inventory in the Northern Coastal Plain of North Carolina. Fieldwork began in June 1983 and was com- pleted in December 1983. Four previous sur- veys, completed in 1937, 1955, 1963, and 1974, provide statistics for measuring changes and trends over the past 46 years. The primary emphasis in this report is on the changes and trends since 1974. Previously reported figures have been adjusted to pro- vide the best estimate of change.
Periodic surveys of the forest resource a re authorized by the Forest and Rangeland Renewable Resources Research Act of 1978. These surveys are a continuing, nationwide undertaking by the Regional Experiment Stations of the Forest Service, USDA. In Florida, Georgia, North Carolina, South Carolina, and Virginia, these surveys are administered by the Forest Inventory and Analysis (Forest Survey) Research Work Unit a t the Southeastern Forest Experiment Station, with headquarters in Asheville, N.C. The primary objective of the survey is t o periodically inventory and evaluate all forest and related resources. These multi- resource data help provide a basis for for- mulating forest policies and programs and
for the orderly development and use of the resources. This report deals only with the extent and condition of forest lands, asso- ciated timber volumes, and rates of timber growth and removals.
The 23-county area covered by this report is one of four survey units in North Caro- lina. Similar reports for the other two units will be issued as the Statewide inventory progresses. When completed, these inven- tories will provide updated statistics on the timber resource for all of North Carolina.
The Southeastern Station gratefully acknowl- edges the cooperation and assistance pro- vided by the North Carolina Department of Natural Resources and Community Development in collecting field data. Appreciation is also expressed for the excellent cooperation of other public agencies, forest industry, and other private landowners in providing information and access to the sample loca- tions.
JOE P. McCLURE Project Leader
Since 1974 in the Northern Coastal 13. Area of commercial forest land, by Plain of North Carolina.. .............. 1 stand-age and broad management ........... How the Inventory Is Made.. ............. 3 classes, public ownerships. 23
Reliability of the Data.. ................ 3 Definitions of Terms.. ................... 5 14. Area of commercial forest land, by
stand-age and broad management County Tables.. ......................... 12 classes, forest industry. ............. 23
1. Area, by county and land class.. .... 12 15. Area of commercial forest land, by stand-age and broad management
2 . Area of commercial forest land, by classes, other private ownerships.. ... 24 county and ownership class ............. 13
16. Area of commercial forest land, by 3 . Area of commercial forest land, by broad management and stand-volume county and forest-type group ........... 14 classes... ............................ 24
4. Area of commercial forest land, by 17. Volume of growing stock on com- county and stand-size Class.. .......... 15 mercial forest land, by broad manage-
ment class, species group, and stand- 5. Area of commercial forest land, by age class. ............................ 25 county and site class.. ................ 16
18. Net annual growth of growing stock 6 . Area of commercial forest land, on commercial forest land, by broad by county and stocking classes of management class, species group, and growing-stock trees.. ................. 17 stand-age class.. 26 ..................... 7. Volume of sawtimber and growing stock on commhcial forest land, by county and species group .............. 8. Net annual growth of sawtimber and growing stock on commercial forest land, by county and species group.. ... 9. Annual removals of sawtimber and growing stock on commercial forest land, by county and species group.. .
Unit Tables
19. Annual removals of growing stock on commercial forest land, by broad
18 management class, species group, and stand-age class... .................... 27
20. Merchantable volume of all live 19 trees and growing stock on commercial
forest land, by forest-type group and species group... ...................... 28
20 21. Area of commercial forest land treated or disturbed annually, by treatment or disturbance and owner- ............................ ship class 29
10. Area of commercial forest land, by ...... forest type and ownership class.. 21 2 2 . Area of commercial forest land
treated or disturbed annually and 11. Area of commercial forest land, by retained in commercial forest land, by ownership and stocking classes of treatment or disturbance and broad growing-stock trees.. ................. 22 management class.. a29 ................... 12. Area of commercial forest land, by 2 3 . Area of commercial forest land stand-age and broad management regenerated annually, by type of regen- Classes, d l ownerships ................ 22 eration and broad management class.. 30 ..
24. Area of commercial forest land, by treatment opportunity and broad manage- .......................... ment classes 30
2 5 . Area of commercial forest land, by treatment opportunity and ownership
.............................. classes. 31
26. Merchantable volume of all live trees and growing stock on commercial forest land, by ownership class and species group.. ....................... 32
2 7 . Volume of sawtimber on commerical forest land, by ownership class and species group ......................... 32
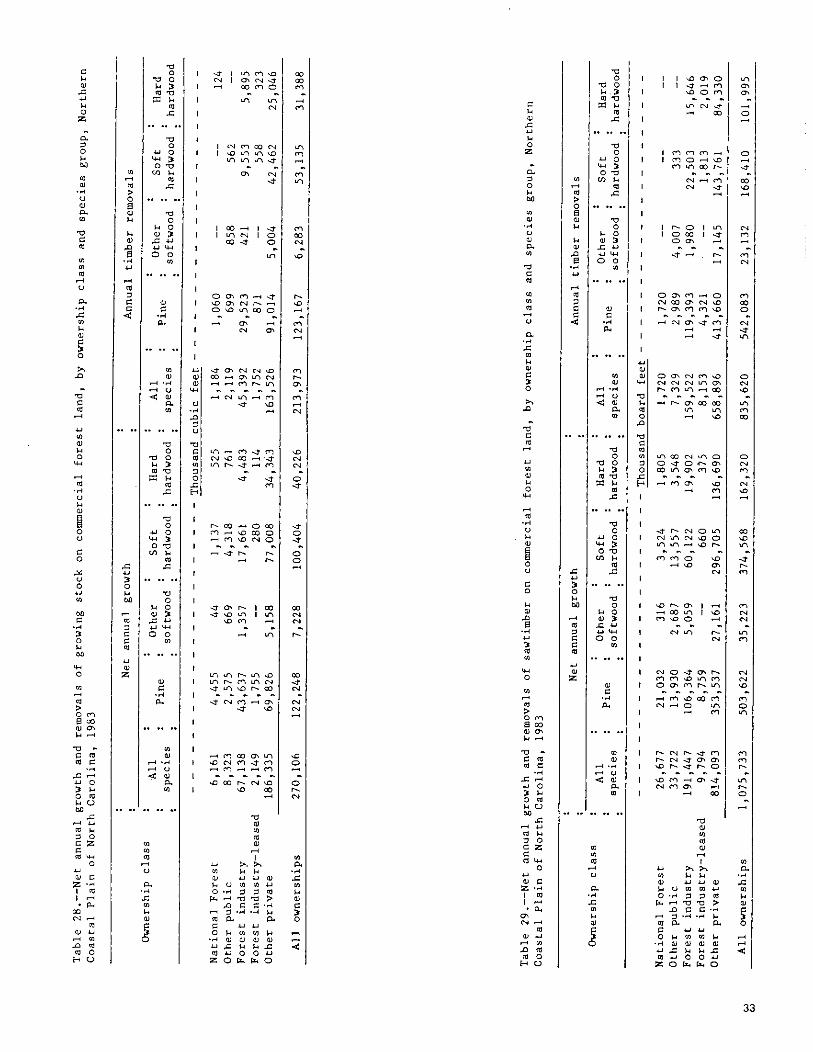
2 8 . Net annual growth and removals of growing stock on commercial forest land, by ownership class and species group.. . 33
29. Net annual growth and removals of sawtimber on commercial forest land, by ownership class and species group.. .... 33
30 . Volume of timber on commercial forest land, by class and species group 34
31. Number of all live trees on commer- cial forest land, by species and diameter class.. ...................... 35
32 . Number of growing-stock trees on commercial forest land, by species and diameter class.. ...................... 3 6
33. Merchantable volume of all live trees on commercial forest land, by spe- cies and diameter class.. .............. 3 7
34. Volume of growing stock on commer- cial forest land, by species and diameter class.. ...................... 3 8
36. Volume of sawtimber on commercial forest land, by species, size class, and log grade .......................... 40
37. Cubic volume in the merchantable saw-log portion of sawtimber trees, by species and diameter class.. ........... 41
38. Total volume of all live trees on commercial forest land, by species and diameter class ......................... 42
39. Green weight of forest biomass on commercial forest land, by species and diameter class. ........................ 43
4 0 . Net annual growth and removals of all live timber and growing stock on commercial forest land, by species.. ... 44
41. Net annual growth and removals of sawtimber on commercial forest land,
............................. by species 45
42. Annual removals of growing stock on commercial forest land, by species and
....................... diameter class.. 46
4 3 . Mortality of all live timber, growing stock, and sawtimber on commercial forest land, by species.. .............. 47
4 4 . Change in number of all live trees on commercial forest land, by species group, survey completion date, and
...................... diameter class.. 48
4 5 . Land area, by class, major forest .... type, and survey completion date.. 49
4 6 . Volume of sawtimber, growing stock, and all live timber on commercial forest land, by species group, survey comple- tion date, and diameter class .......... 50
35 . Volume of sawtimber on commercial forest land, by species and diameter class ................................. 3 9
Since 1974 in the Northern Coastal Plain of North Carolina
area of commercial forest land decreased by 349,000 acres, or by 8 percent. Although 34,000 acres of new commercial forest were added, more than 382,000 acres were diverted to other land uses. Of the acreage diverted, 76 percent was to agriculture, 15 percent to urban and other nonforest uses and 9 percent to water or noncommercial forest land. Commercial forests now occupy almost 3.8 million acres, or 56 percent of the land area in the 23 counties making up the Northern Coastal Plain.
area of commercial forest land held by nonindustrial private forest (NIPF) land- owners declined by almost 14 percent, from over 3.0 million acres to less than 2.6 mil- lion acres. Within the NIPF or other pri- vate sector, acreage of commercial forest land owned-by farmers and other private individuals dropped, while that of corpora- tions (other than forest industry) increased substantially. Commercial forest area in farm ownership decreased from 1.7 to 1.1 million acres, while that of private individ- uals decreased by 12 percent to 933,000 acres. Other corporations increased their holdings by 92 percent to 496,000 acres. The area of commercial forest in public ownership increased by 33 percent and now totals 238,000 acres. Acreage under forest industry control increased by 4 percent to 956,000 acres.
acreage of commercial forest classified as a pine type declined by 162,000 acres, or by almost 10 percent. The acreage of pine type decreased 218,000 acres, or by 22 percent on NIPF land. Across all owner- ships, area classified as pond pine type declined by 45 percent, from 529,000 to 290,000 acres, accounting for most of the net pine-type loss. Acreage of loblolly pine, the primary type in this region, increased by almost 8 percent to 1.1 million acres. Pine types now occupy nearly 1.5 million acres. Acreage of oak-pine type decreased from 607,000 to 481,000 acres, or by 21 per- cent. Acreage in hardwood types has changed little since 1974, remaining at 1.8 million acres. . almost 65,000 acres annually were har- vested and retained in commercial forest, The annual rate of harvest has increased by 12 percent on other private land, but declined by 5,000 acres annually, or by 19
percent on forest industry land. Across all ownerships, the annual rate of harvest has remained about the same. Pine stands ac- count for nearly 50 percent of the area harvested each year. About 10,000 acres, or 16 percent of the area harvested annually, were oak-pine type and 22,000 acres, or 34 percent, were hardwood types. In addition to final harvests, partial cutting (including high grading, selective cutting, commercial thinning, and other stand improvement) occurred on 27,000 acres annually. On the average, substantial volumes of timber were removed from 92,000 acres each year. This average is 22 percent lower than the one for the 1963 to 1974 ~er i0d.
an average of'26,000 acres per year have been artificially regenerated and are adequately stocked with suitable trees. Across all ownership classes, the rate of planting averaged about 2,000 acres more per year than during the previous survey period. All of this increase was on NIPF and public land. The rate of planting dropped by 3,000 acres annually on forest industry land, a direct result of decreased rates of stand harvest. Still, almost three-fourths of all planting activity is on forest industry land. The rate of artificial regeneration has increased nearly fourfold on NIPF land, to 7,000 acres annually. Across all ownerships, an additional 27,000 acres per year were successfully regenerated through natural means. In total, 28,000 acres annually were regenerated to a pine forest type, about 87 percent of the acreage of pine type har- vested each year.
to 14 percent in-the 16-inch diameter class. Across all diameters, pines 3n other private land declined by 107 million stems, or by 25 percent. On forest industry land, large increases in number of pines were recorded in the 4- through 10-inch diameter classes, a result of developing pine plantations on this ownership. Number of pines in the 6- and 8-inch diameter classes more than doubled on forest industry land during the 10-year period. Across all ownerships, the number of all live pines declined through the 16-inch class, except in the 6- and 8-inch categories where industry gains com- pensated for losses on other private land.
Declines in number of hardwoods also occurred in the smaller sizes; drops ranged from 27 percent in the 2-inch class to 6 percent in the 10-inch ,diameter class.
average basal area of all live trees 5.0 inches d.b.h. and larger has increased from 73 to 83 square feet per acre of commercial forest land. Increases in basal area have occurred across most major forest types. Average merchantable volume per acre also increased correspondingly, rising from 1,583 to 1,814 cubic feet per acre of commercial forest land. Hardwoods accounted for three- fourths of this increase.
volume of softwood growing stock remained about the same and now totals 2.8 billion cubic feet . Softwood growing-stock volume increased by 34 percent t o almost 631 million cubic feet on forest industry land and by 49 percent to 212 million cubic feet on public land. Together, these two owner- ships almost offset an 11 percent loss on NIPF land. Volume of loblolly pine increased by 98 million cubic f ee t , or by 5 percent, while volume of pond pine decreased by 118 million cubic f ee t , or by 23 percent. Volume of softwood sawtimber decreased by 5 percent to almost 8.3 billion board feet on NIPF land and declined by 8 percent to 1.5 billion board fee t on forest industry land. On public land, the board-foot volume of soft- wood sawtimber rose from 0.5 to 0.8 billion board feet:
volume of hardwood growing stock increased by 9 percent, from 3.3 t o 3.6 billion cubic feet. Increases occurred in the 12-inch and larger diameter classes, while volume in the 6- through 10-inch diameter classes declined by almost 60 million cubic feet . Increases in volume occurred in most hardwood species, but the largest was in soft maples, which increased by 138 million cubic f ee t , or by 36 percent. Increases in hardwood growing- stock volume were recorded for all three major ownership groups. The current inven- tory of hardwood growing stock includes almost 11 billion board feet of sawtimber, an increase of 19 percent.
net annual growth of all growing stock totaled 270 million cubic fee t and included
almost 1.1 billion board fee t of sawtimber. Net annual growth of softwood growing stock totaled over 129 million cubic f e e t , an increase of 13 percent. On forest indus- try land, net annual growth of softwood growing stock increased by 104 percent t o almost 47 million cubic f ee t , while on NIPF land, softwood net annual growth decreased by 12 percent to 75 million cubic feet per year. Net annual growth of hardwood growing stock totaled almost 141 million cubic fee t , 21 percent more than in 1973. Increases in annual growth of hardwood occurred across all ownerships. More than 79 percent of the hardwood growth occurred on NIPF land, 16 percent on forest industry, and 5 percent on public land.
annual removals of growing stock totaled 214 million cubic feet and included 836 million board feet of sawtimber. Softwood removals declined by 5 percent, from 137 t o 129 million cubic feet since 1973. On forest industry land, softwood removals decreased from 54 to 31 million cubic fee t , while on NIPF land, softwood removals increased by 20 percent to 96 million cubic feet per year. Pines provide a disproportionate share of the removals. They constitute 39 percent of the growing-stock inventory and 45 percent of the net growth, yet provide almost 58 percent of the removals. Removals of hard- wood growing stock were down by 8 percent compared with the previous survey. Most of this decrease occurred on forest industry land where annual hardwood removals declined by 30 percent to 16 million cubic feet . Annual removals of hardwood growing stock remained a t 67 million cubic feet on NIPF land.
reduced gross growth by 17 percent. Soft- wood mortality now totals almost 27 million cubic feet . Approximately 55 percent of the current mortality of softwood can be attrib- uted to insects, 22 percent to suppression, 11 percent to dis'eases, and 12 percent to other natural agents. Across all ownerships, mortality of hardwood was down by 18 per- cent and totaled 13 million cubic feet . Mortality reduced the gross growth of hard- woods by 9 percent.
How the Inventory Is Made
The method of the inventory is a sampling procedure designed to provide reliable sta- tistics primarily a t the State and Survey Unit levels. Individual county statistics are presented so that any combination of coun- ties may be added together until a total is large enough to meet the desired degree of reliability. Procedures were as follows:
1. Initial estimates of forest and nonforest areas were based on the classification of 21,909 sample clusters systematically spaced on the latest aerial photographs available. A subsample of 2 , 5 4 3 of the 16-point clus- ters was ground checked, and a linear regres- sion was fitted to the data to develop the relationship between the photo and ground classification of the subsample. This proce- dure provides a means for adjusting the ini- tial estimates of area for change in land use since date of photography and for photo misclassifications.
2 . Estimates of timber volume and forest classifications were based on measurements recorded at 1,396 ground sample locations systematically distributed within the commer- cial forest land. The plot design at each location was based on a cluster of 10 points. In most cases, variable plots, using a basal- area factor of 3 7 . 5 square feet per acre, were systematically spaced within a single forest condition at 5 of the 10 cluster points. Trees less than 5 inches d.b.h. were tallied on a fixed-radius plot around each point center.
3 . Equations prepared from detailed meas- urements collected on standing trees in this Unit, and similar measurements taken through- out the Southeast, were used to compute the volume of individual tally trees. A mirror caliper and sectional aluminum poles were used to obtain the additional measurements on these standing trees required to con- struct volume equations.
4 . Felled trees were measured at 33 active cutting operations. These data will supplement the standing-tree volume data and be used to generate utilization factors for product and species groups. Forest bio- mass estimates were made using equations developed by the Utilization of Southern Timber Research Work Unit of the South- eastern Forest Experiment Station in Athens, Ga.
5 . Estimates of growth, removals, and mortality were determined from the remeas- urement of 1,467 permanent sample plots established in the fourth survey.
6. Ownership information was collected from correspondence, public records, and local contacts. In those counties where the sample missed a particular ownership class, temporary sample plots were added on these lands.
7. All field data were sent to Asheville for editing and were entered into disk and magnetic-tape storage for processing.. Final estimates were based on statistical sum- maries of the data.
Reliability of the Data
Statistical analysis of these data indicates the following sampling errors in terms of one standard error (two times out of three):
Per million acres of commercial forest land . . . . . . 1 .OO
Per billion cubic feet of growing stock . . . . . . . . . . 5.96
Per billion cubic feet of net annual growth . . . . . . . . 1.12
Per billion cubic feet of annual removals . . . . . . . . . 2.58
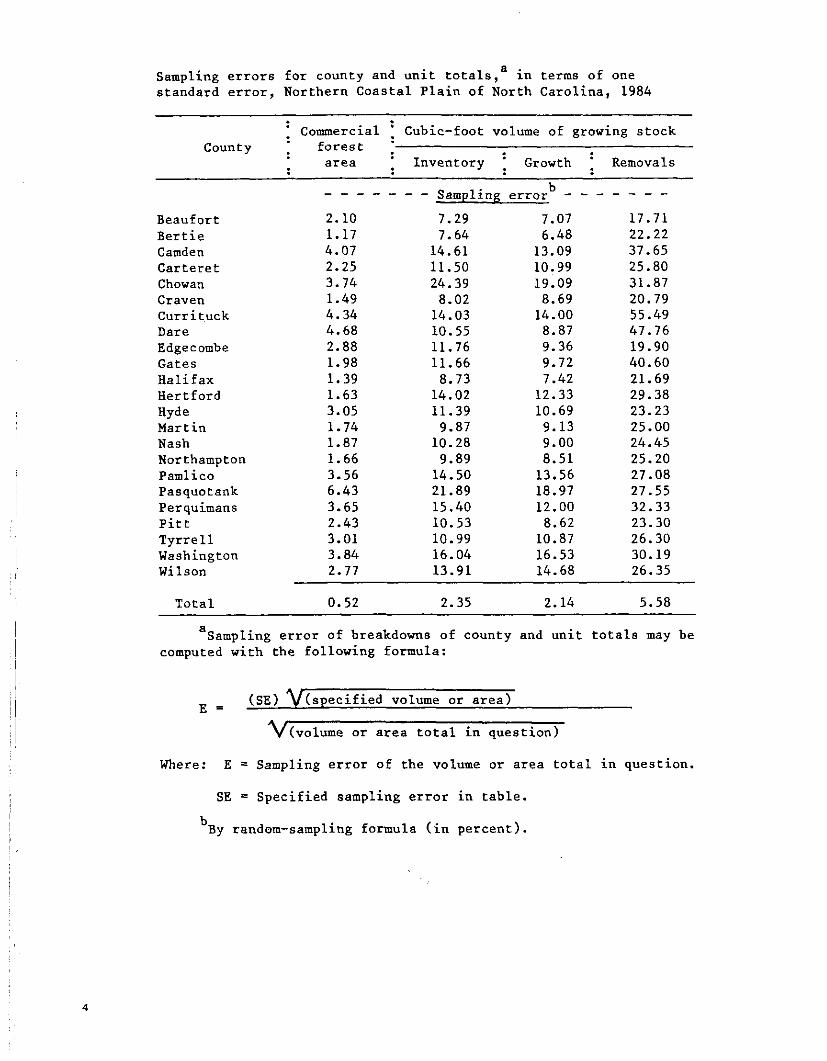
a . Sampling errors for county and unit totals, in terms of one standard error, Northern Coastal Plain of North Carolina, 1984
County
Beauf ort Bertie Camden Carteret Chowan Craven Currituck Dare Edgecombe Gates Halifax Hertford Hyde Mart in Nash Northampton Pamlico Pasquotank Perquimans Pitt Tyrrell Washington Wilson
1 Commercial : Cubic-foot volume of growing stock forest 1 area Inventory 1 Growth Removals
- --
- Sampling errorb - - - - - - - 7.29 7.07 17.71 7.64 6.48 22.22
14.61 13.09 37.65 11.50 10.99 25.80 24.39 19.09 31.87
8.02 8.69 20.79 14.03 14.00 55.49 10.55 8.87 47.76 11.76 9.36 19.90 11.66 9.72 40.60
8.73 7.42 21.69 14.02 12.33 29.38 11.39 10.69 23.23
9.87 9.13 25.00 10.28 9.00 24.45
9.89 8.51 25.20 14.50 13.56 27.08 21.89 18.97 27.55 15.40 12.00 32.33 10.53 8.62 23.30 10.99 10.87 26.30 16.04 16.53 30.19 13.91 14.68 26.35
Total 0.52 2.35 2.14 5.58
a Sampling error of breakdowns of county and unit totals may be computed with the following formula:
(SE) v(specified volume or area) E =
V(vo1ume or area total in question)
Where: E = Sampling error of the volume or area total in question.
SE = Specified sampling error in table.
b ~ y random-sampling formula (in percent).
Definitions of Terms
All live trees. All trees 1.0 inch d. b. h. and larger which are not dead a t the time of inventory.
All l ive-tree volume. Volume (cubic f ee t ) of wood above the ground.line in all live trees 1.0 inch d.b.h. and larger. The volume in twigs and lateral limbs smaller than 0.5 inch in diameter a t the point of occurrence on sapling-size trees is included, but is excluded on poletimber and sawtimber-size trees.
Allowable cut. The volume of timber that could be cut on commercial forest land dur- ing a given period under specified manage- ment plans aimed a t sustained production of timber products.
Basal area. The area in square feet of the cross section a t breast height of a single t ree or of all the trees in a stand, usually expressed as square feet of basal area per acre.
Biomass. The aboveground green weight of solid wood and bark in all live trees 1.0 inch d.b.h. and larger from the ground to the tip of the tree. All foliage is excluded. The weight of wood and bark in lateral limbs, secondary limbs, and twigs under 0.5 inch in diameter at the point of occurrence on sapling-size trees is included, but is excluded on poletimber and sawtimber-size trees.
Bole. That portion of a t ree between a 1-foot stump and a 4-inch top diameter out- side bark (d.0.b.) in trees 5.0 inches d.b.h. and larger.
Broad management class. A classification of commercial forest land based on forest type and stand origin.
Pine plantation. Stands that have been artificially regenerated by planting or direct seeding and with a southern yellow pine, white pine-hemlock, or other soft- wood forest type.
Natural pine. Stands that have not been artificially regenerated and with a
southern yellow pine, white pine-hemlock, or other softwood forest type.
Oak-pine. Stands with a forest type of oak-pine . Upland hardwood. Stands with a forest type of oak-hickory, chestnut oak, southern scrub oak; or maple-beech- birch.
Lowland hardwood. Stands with a forest type of oak-gum-cypress, elm-ash-cotton- wood, palm, or other tropical.
Bureau of Land Management lands. Federal lands administered by the Bureau of Land Management.
Census water. Streams, sloughs, estuaries, canals, and other moving bodies of water one-eighth of a s ta tu te mile in width and greater , and lakes, reservoirs, ponds, and other permanent bodies of water 40 acres in area and greater.
Commercial forest land. Land a t least 16.7 percent stocked by forest trees of any size, or formerly having had such t ree cover, not currently developed for nonforest use, capa- ble of producing 20 cubic feet of industrial wood per acre per year and not withdrawn from timber utilization by legislative action.
Commercial species. Tree species convention- ally regarded as being able to develop into t rees suitable for the manufacture of - industrial timber products. Species that typically exhibit small size, poor form, or inferior quality are excluded.
Cropland. Land under cultivation within the past 24 months, including orchards and land in soil-improving crops, but excluding land cultivated in developing improved pasture. Also includes idle farmland.
D.b.h. Tree diameter (outside bark) a t breast height (4.5 feet above the ground).
Diameter class. A classification of t rees based on t ree d.b.h. Two-inch diameter classes are commonly used by Forest Inven- tory and Analysis, with the even inch as the

approximate midpoint fo r a class. For example , the 6-inch class includes t r e e s 5.0 through 6.9 inches d. b. h. , inclusive.
F a r m . Land on which agricultural operations are being conducted and sale of agricultural products totaled $1,000 or more during t h e year .
Fa rm operator. A person who operates a f a r m , e i the r doing the work himself or d i rect ly supervising the work.
Farmer-owned land (see: Other private land)
Fores t industry land. Land owned by com- panies or individuals operat ing wood-using plants.
F o r e s t industry l eased land. Land which a r e leased o r under management con t rac t s t o for- est industry from o ther owners fo r periods
I of one fores t ro ta t ion or longer. Land under cut t ing con t rac t s are not included.
Fores t land. Land a t l eas t 16.7 percent s tocked by fores t t r ees of any s ize , or for- merly having had such tree cover , and not current ly developed fo r nonforest use.
1 Fores t type . A classification of fores t land I based on the species forming a plurali ty of
l ive- t ree stocking.
White pine-hemlock. Fores t s in which east- e rn white pine, red pine, o r jack pine, singly or in combinat ion, cons t i tu te a plurality of t h e stocking. (Common asso- c ia tes include hemlock, birch, and maple. )
I Spruce-fir. Fores ts in which spruce or t r u e f i r s , singly or in combination, con- s t i t u t e a plurality of t h e stocking. (Common associates include maple , birch, and hemlock. )
Longleaf-slash pine. Fores ts in which long- leaf or slash pine, singly or in combina- t ion, const i tu te a plurality of t h e stock- ing. (Common associates include oak , hickory, and gum.)
Loblolly-shortleaf pine. Fores ts in which loblolly pine, shortleaf pine, or o the r southern yellow pines, excep t longleaf or slash pine, singly or in combination, con-
s t i t u t e a plurality of t h e stocking. (Common associates include oak , hickory, and gum. )
Forests in which hardwoods usually upland oaks) const i tu te a plura-
l i t y of t h e stocking but in which pines account fo r 25 t o 50 percent of the stock- ing. (Common associates include gum, hickory, and yellow-poplar. )
Oak-hickory. Fores ts in which upland oaks o r hickory, singly or in combination, con- s t i t u t e a plurality of the stocking, excep t where pines account for 25 t o 50 percen t , in which case t h e s t and would be classified oak-pine. (Common associates include yellow-poplar, e lm, maple, and black walnut. )
Oak-gum-cypress. Bottom-land fores ts in which tupelo, blackgum, sweetgum, oaks, or southern cypress , singly or in combina- t ion, const i tu te a plurality of the stock- ing, except where pines account for 25 t o 50 percent , in which case t h e s tand would b e classified oak-pine. (Common associates include cottonwood, willow, ash, e lm, hackberry, and maple. )
Elm-ash-cottonwood. Fores ts in which e lm, ash , or cottonwood, singly or in combina- t ion, const i tu te a plurality of t h e stock- ing. (Common associates include willow, sycamore, beech, and maple. )
Maple-beech-birch. Fores t s in which maple, beech, or yellow birch, singly or in com- bination, const i tu te a plurality of the stocking. (Common associates include hemlock, e lm, basswood, and white pine.)
Palm, other tropical . Fores t s in which palms and other tropicals const i tu te a pluraltiy of the stocking.
Gross growth. Annual increase in merchant- able volume of t r ees in t h e absence of cut- t ing and mortali ty. (Gross growth includes survivor growth, ingrowth, growth on in- growth, growth on removals prior t o removal, and growth on mortali ty prior t o d e a t h . )
Growing-stock trees. Live sawtimber-size trees of commercia l species containing a t l e a s t a 12-foot log, or two noncontiguous
saw logs each 8 feet or longer, meeting minimum grade requirements (hardwoods must qualify as either a log grade of 3 or 4; soft- woods must qualify as a log grade 3) with at least one-third of the gross board-foot vol- ume (International 1/4-inch rule) between a 1-foot stump and the minimum saw-log top being sound, or a live tree below sawtimber size that will prospectively qualify under the above standards.
Desirable tree. A tree that qualifies as growing stock and has no serious defects in quality limiting present or prospective use; is of relatively high vigor (30 per- cent or more live crown ratio); is com- patible with the site and physiographic class; has a total board-foot loss not to exceed 15 percent in softwoods or 25 per- cent in hardwoods as a result of severe sweep, crook, or lean; and has a rela- tively clear bole.
Acceptable tree. A tree that qualifies as growing stock but does not meet the mini- mum requirements to qualify as a desirable tree. Included are sawtimber-size trees that do not contain a 12-foot saw log because of excessive, natural taper in the butt log, but have the potential to pro- duce a 12-foot saw log as diameter increases.
Growing-stock volume. Volume (cubic feet) of solid wood in growing-stock trees 5.0 inches d.b.h. and larger, from a 1-foot stump to a minimum 4.0-inch top diameter, outside bark, on the central stem. Volume of solid wood in primary forks from the point of occurrence to a minimum 4.0-inch top diameter outside bark is included.
Hardwoods. Angiosperms; dicotyledonous trees (including all palm species which are mono- cotyledonous), usually broadleaf and decid- uous.
Soft hardwoods. Soft-textured hardwoods such as boxelder, red and silver maples, hackberry, loblolly-bay, sweetgum, yellow- poplar, magnolia, sweetbay, water tupelo, blackgum, sycamore, cottonwood, black cherry, willow, basswood, and elm.
Hard hardwoods. Hard-textured hardwoods such as sugar maple, birch, hickory, dog-
wood, persimmon (forest grown), black locust, beech, ash, honeylocust, holly, black walnut, mulberry, and all commer- cial oaks.
Idle farmIand. Land including former crop- land, orchard, improved pasture, and farm sites not tended within the past 2 years, and currently less than 16.7 percent stocked with live trees.
Improved pasture. Land currently improved for grazing by cultivation, seeding, irriga- tion, or clearing of trees or brush.
Indian land. All lands held in trust by the United States for individual Indians or tribes, or all lands, titles to which are held by individual Indians or tribes, subject to Federal restrictions against alienation.
Industrial wood. .4ll roundwood products except fuelwood.
Ingrowth. The number or net volume of trees that grow large enough during a specified year to qualify as saplings, poletimber, or sawtimber.
Inhibiting vegetation. Cover sufficiently dense to prevent the establishment of tree seedlings.
Land area. The area of dry land and land temporarily or partly covered by water such as marshes, swamps, and river flood plains (omitting tidal flats below mean high tide), streams, sloughs, estuaries, and canals less than one-eighth of a statute mile in width, and lakes, reservoirs, and ponds less than 40 acres in area.
Log grade. .4 classification of logs based on external characteristics as indicators of quality or value.
Logging residues. The unused merchantable portion of growing-stock trees cut or destroyed during logging operations.
Logging slash. The unmerchantable portion of growing-stock trees (including saplings) plus all cull trees 1.0 inch d.b.h. and larger cut or destroyed during logging operations and not used.

Manageable stand. Commercial forest land a t least 60 percent stocked with growing-stock trees that can be featured together under B management scheme.
Merchantable portion. That portion of all live trees 5.0 inches d.b. h. and larger be- tween a 1-foot stump and a minimum 4.0-inch top diameter outside bark on the central stem. That portion of primary forks from the point of occurrence to a minimum 4.0-inch top diameter outside bark is included.
Merchantable volume. Solid-wood volume in merchantable portion of all live trees.
Miscellaneous Federal land. Federal land other than National Forests, land admin- istered by the Bureau of Land Management, and land administered by the Bureau of Indian Affairs.
Miscellaneous private land (see: Other pri- vate land).
I Mortality. The merchantable volume in t rees I that have died from natural causes during a I specified period. I
I National Forest land. Federal land that has been legally designated as National Forests or purchase units, and other land under the administration of the Forest Service, includ- ing experimental areas and Bankhead-Jones Title III land.
!
1 , Net annual growth. The net change in mer-
1 : chantable volume for a specific year in the absence of cutting (gross growth minus mor-
t i tality for that specified year.)
Net volume. Gross volume of wood less ! deductions for rot , sweep, or other defect
affecting use for timber products.
I Noncommercial forest land. Forest land not
I considered commercial. Includes both unpro- ductive forest land and productive-reserved forest land.
Noncommercial species. Tree species of typi- cally small size, poor form, or inferior quality which normally do not develop into t rees suitable for industrial wood products.
Nonforest land. Land that has never sup- ported forests and land formerly forested where timber production is precluded by development for other uses.
Nonindustrial private forest (NIPF) land (see: Other private land).
Nonstocked forest land. Commercial forest land less than 16.7 percent stocked with growing-stock trees.
Other private land. Privately owned land excluding forest industry land or forest industry leased land. Also referred to as nonindustrial private forest (NIPF) land.
Farmer-owned land. Owned by farm oper- ators excluding incorporated farm owner- ships.
Other individual land. Owned by individ- uals other than farm operators.
Other corporate land. Owned by corpora- tions, including incorporated farm owner- ships.
Other removals. The growing-stock volume of t rees removed from the inventory by cultural operations such as timber stand improvement, land clearing, and other changes in land use that result in the removal of the trees from the commercial forest.
Plant residues. Wood material generated in the production of timber products a t primary manufacturing plants.
Coarse residues. Material, such as slabs, edgings, trim, veneer cores and ends, which is suitable for chipping.
Fine residues. Material, such as sawdust, shavings, and veneer chippings, which is not suitable for chipping.
Residues (coarse or the further manufacture
of industrial products or for consumer use, or utilized as fuel.
Unused plant residues. Residues (coarse or fine) that are not used for any product, including fuel.

Poletimber-size trees. All live trees a t least 5.0 inches d.b.h. but smaller than sawtimber size.
Productive-reserved forest land. Forest land sufficiently productive to qualify as com- mercial forest land, but withdrawn from timber utilization through statute or admin- istrative designation.
Quality class. A classification of sawtimber volume by log or t ree grades.
Rangeland. Land on which the natural vege- tation is predominantly native grasses, grasslike plants, forbs, or shrubs valuable for forage, not qualifying as commercial forest and not developed for another land use. Rangeland includes natural grassland and savannah.
Rotten trees. Live t rees of commercial spe- cies that do not contain a t least one 12-foot saw log, or two noncontiguous saw logs, each 8 feet or longer, now or prospec- tively, primarily because of rot or missing sections, and with less than one-third of the gross board-foot t ree volume in sound material.
Rough trees. Live t rees of commercial spe- cies that do not contain a t least one 12-foot saw log, or two noncontiguous saw logs, each 8 feet or longer, now or prospec- tively, primarily because of roughness, poor form, splits, and cracks, and with less than one-third of the gross board-foot t ree volume in sound material; and all live trees of noncommercial species.
Roundwood (roundwood logs). Logs, bolts, or other round sections cut from trees for industrial or consumer uses.
Roundwood chipped. Any timber cut primar- ily for pulpwood, delivered to nonpulpmills, chipped, and then sold to pulpmills as resi- dues, including chipped tops, jump sections, whole t rees and pulpwood sticks.
Roundwood products. Any primary product such as lumber, poles, pilings, pulp, or fuelwood which is produced from roundwood.
Salvable dead trees. Standing or down dead trees considered utilizable by Forest Inventory and Analysis standards.
Saplings. Live trees 1.0 to 5.0 inches d.b.h.
Saw log. A log meeting minimum standards of diameter, length, and defect, including logs a t least 8 feet long, sound and straight, and with a minimum diameter inside bark for softwoods of 6 inches ( 8 inches for hardwoods).
Saw-log portion. That part of the bole of sawtimber trees between a 1-foot stump and the saw-log top, including the portion of forks large enough to contain a saw log.
Saw-log top. The point on the bole of saw- timber trees above which a conventional saw log cannot be produced. The minimum saw-log top is 7.0 inches in diameter out- side bark (d.0.b.) for softwoods and 9.0 inches (d.0.b. ) for hardwoods.
Sawtimber-size trees. Softwoods 9.0 inches d. b.h. and larger and hardwoods 11.0 inches d.b.h. and larger.
Sawtimber volume. Growing-stock volume in the saw-log portion of sawtimber-size t rees in board fee t (International 114-inch rule) .
Seedlings. Live trees of commercial species less than 1.0 inch d.b.h. that are expected t o survive and develop.
S i te class. A classification of forest land in terms of inherent capacity to grow crops of industrial wood based on fully stocked natural stands, by annual production capac- i ty .
Class 1. 165 or more cubic feet per acre.
Class 2 . 120 to 164 cubic feet per acre.
Class 3 . 85 to ll9 cubic fee t per acre.
Class 4. 50 to 84 cubic feet per acre.
Class 5. 20 to 49 cubic feet per acre.
Softwoods. Gymnosperms; in the order Con- if erales, usually evergreen (includes the genus Taxodium which is deciduous), having needles or scalelike leaves.
Pines. Yellow pine species which include - loblolly, longleaf, slash, pond, shortleaf, pitch, Virginia, sand, spruce, and Table Mountain pines.
Other softwoods. Cypress, eastern redcedar, white cedar, eastern white pine, eastern hemlock, spruce, and fir .
Stand-size class. A classification of forest land based on the diameter class distribu- tion of growing-stock trees in the stand.
Sawtimber stands. Stands a t least 16.7 percent stocked with growing-stock trees, with half or more of total stocking in sawtimber and poletimber t rees, and with sawtimber stocking a t least equal t o pole- timber stocking.
Poletimber stands. Stands a t least 16.7 percent stocked with growing-stock trees of which half or m o r e of total stocking is in poletimber and sawtimber t rees, and with poletimber stocking exceeding that of sawtimber.
Sapling-seedling stands. Stands a t least 16.7 percent stocked with growing-stock trees of which more than half of total stocking is saplings and seedlings.
S ta te , county, and municipal land. Land owned by States , counties, and local public agencies or municipalities, or land leased to these governmental units for 50 years or more.
Stocking. The degree of occupancy of land by trees, measured by basal area or the number of trees in a stand and spacing in the stand, compared with a minimum standard, depending on t ree size, required to fully utilize the growth potential of the land.
Fully stocked. 100 percent or more stock- ing.
Medium stocked. 6 0 to 99 percent stocking.
Poorly stocked. Less than 60 percent stocking.
Survivor growth. The merchantable volume increment on trees 5.0 inches d.b.h. and larger in the inventory a t the beginning of the year and surviving to i ts end.
Timber products. Roundwood products and byproducts.
Timber removals. The merchantable volume of trees removed from the inventory by harvesting, cultural operations such as stand improvement, land clearing, or changes in land use.
Top. The portion of the main stem and forks from a 4.0-inch diameter outside bark t o the tips of the main stem and forks, plus all other limbs above the 4.0-inch top a t least 0.5 inch in diameter a t their point of occurrence.
Treatment opportunity. A classification of the management or treatment that would most improve for timber production the existing condition of the stand being sampled.
Unproductive forest land. Forest land inca- pable of producing 20 cubic feet per acre of industrial wood under natural conditions, because of adverse site conditions.
Upper-stem portion. That part of the main stern or fork of sawtimber t rees above the saw-log top to minimum top diameter 4.0 inches outside bark or to the point where the main stem or fork breaks into limbs.
Urban and other areas. Areas developed for residential, industrial, or recreational purposes, school yards, cemeteries, roads, railroads, airports, beaches, powerlines and other rights-of-way, or other nonforest land not included in any other specified land use class.
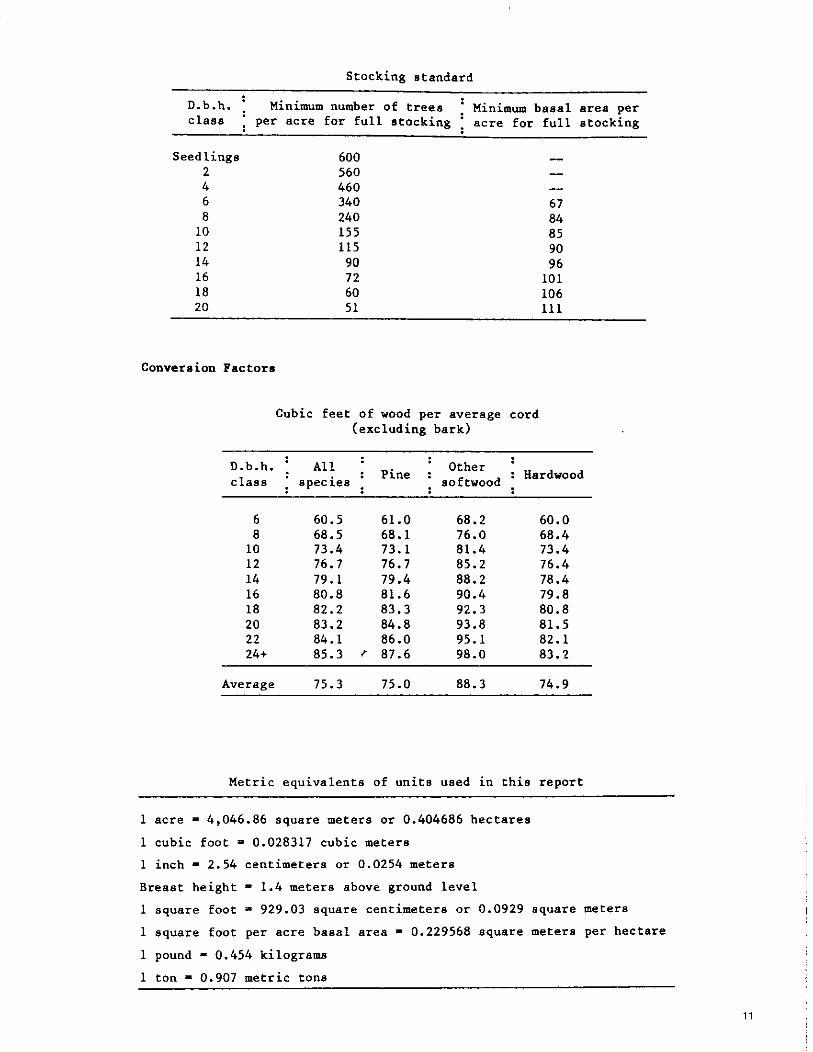
Stocking standard
D.b.h. : Minimum number of trees : Minimum basal area per class per acre for full stocking acre for full stocking
Seedlings 600 -- 2 560 -- 4 460 -- 6 340 67 8 240 84 10 155 85 12 115 90 14 90 96 16 72 101 18 60 106 20 5 1 111
Conversion Factors
Cubic feet of wood per average cord (excluding bark)
D.b.h. : All I Pine . Other ' : Hardwood class : species . : softwood .
6 60.5 61.0 68.2 60.0 8 68.5 68.1 76.0 68.4 10 73.4 73.1 81.4 73.4 12 76.7 76.7 85.2 76.4 14 79.1 79.4 88.2 78.4 16 80.8 81.6 90.4 79.8 18 82.2 83.3 92.3 80.8 20 83.2 84.8 93.8 81.5 22 84.1 86.0 95.1 82.1 24+ 85.3 r 87.6 98.0 83.2
Averaee 75.3 75.0 88.3 74.9
Metric equivalents of units used in this report
1 acre - 4,046.86 square meters or 0.404686 hectares
1 cubic foot - 0.028317 cubic meters
1 inch - 2.54 centimeters or 0.0254 meters
Breast height - 1.4 meters above ground level
1 square foot - 929.03 square centimeters or 0.0929 square meters
1 square foot per acre basal area - 0.229568 square meters per hectare 1 pound - 0.454 kilograms 1 ton - 0.907 metric tons
County Tables 1 The county tables are intended for use in compiling forest resource
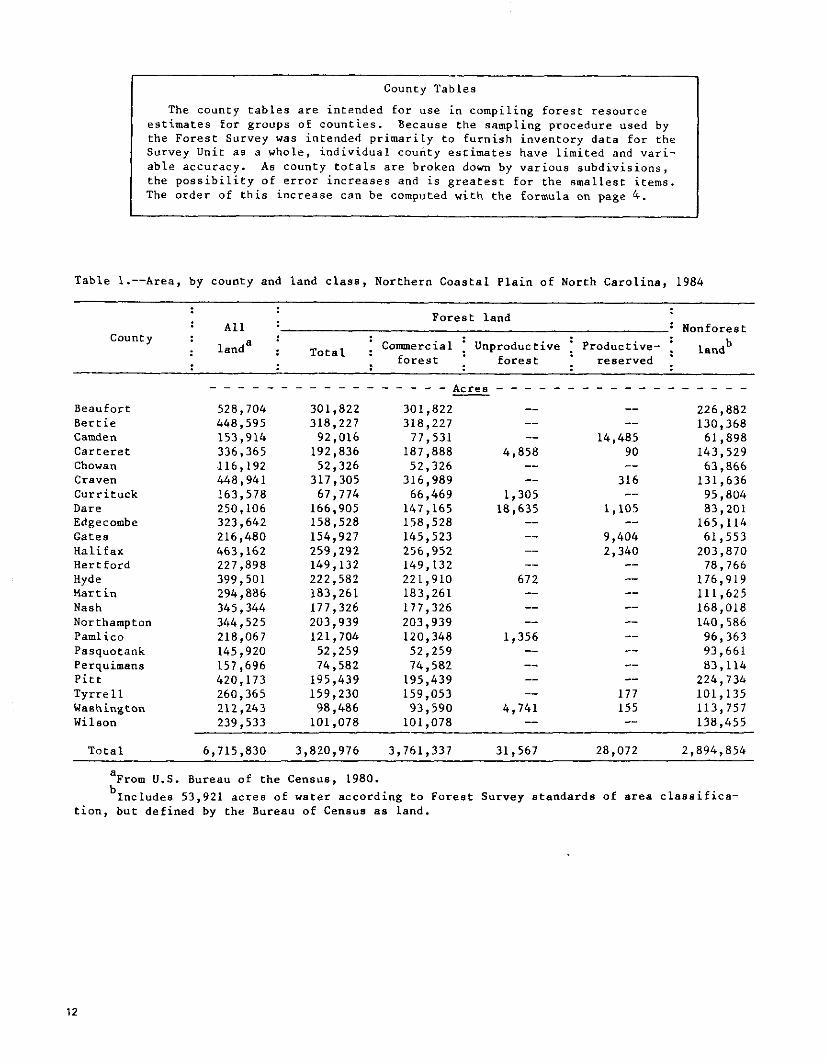
estimates for groups of counties. Because the sampling procedure used by the Forest Survey was intended primarily to furnish inventory data for the Survey Unit as a whole, individual county estimates have limited and vari- able accuracy. As county totals are broken down by various subdivisions, the possibility of error increases and is greatest for the smallest items. The order of this increase can be computed with the formula on page 4.
Table 1.--Area, by county and land class, Northern Coastal Plain of North Carolina, 1984
Forest land : All : : Nonforest
County Commercial : Unproductive 1 Productive- : land b I landa I Total I
forest 1 fores t reserved : - - - - - - - - - - - - - - - - - k r e s - - - - - - - - - - - - - - - - - - - - - -
Beaufort 528,704 301,822 301,822 -- -- 226,882 Bertie 448,595 318,227 318,227 -- -- 130,368 Camden 153,914 92,016 77,531 -- 14,485 61,898 Carteret 336,365 192,836 187,888 4,858 90 143,529 Chowan 116,192 52,326 52,326 -- -- 63,866 Craven 448,941 317,305 316,989 -- 316 131,636 Currituck 163,578 67,774 66,469 1,305 -- 95,804 Dare 250,106 166,905 147,165 18,635 1,105 83,201 Edgecombe 323,642 158,528 158,528 -- -- 165,114 Gates 216,480 154,927 145,523 -- 9,404 61,553 Halifax 463,162 259,292 256,952 -- 2,340 203,870 Hert ford 227,898 149,132 149,132 -- -- 78,766 Hyde 399,501 222,582 221,910 672 -- 176,919 Mart in 294,886 183,261 183,261 -- -- 111,625 Nash 345,344 177,326 177,326 -- -- 168,018 Northampton 344,525 203,939 203,939 -- -- 140,586 Pamlico 218,067 121,704 120,348 1,356 -- 96,363 Pasquotank 145,920 52,259 52,259 -- -- 93,661 Perquimans 157,696 74,582 74,582 -- -- 83,114 Pitt 420,173 195,439 195,439 -- -- 224,734 Tyrrell 260,365 159,230 159,053 -- 177 101,135 Washington 212,243 98,486 93,590 4,741 155 113,757 Wilson 239,533 101,078 101,078 -- -- 138,455
Total 6,715,830 3,820,976 3,761,337 31,567 28,072 2,894,854
a From U.S. Bureau of the Census, 1980. b~ncludes 53,921 acres of water according to Forest Survey standards of area classifica-
tion, but defined by the Bureau of Census as land.
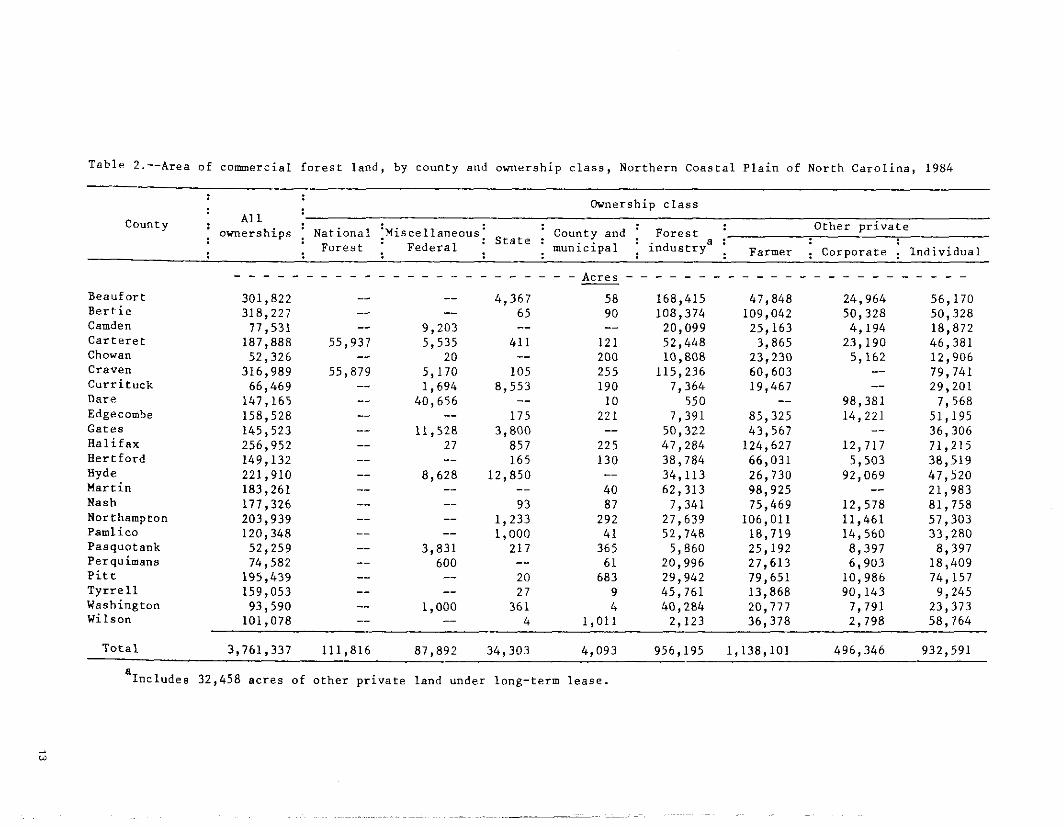
Table 2.--Area of commercial forest land, by county and ownership class, Northern Coastal Plain of North Carolina, 1984
County
Beaufort Bertie Camden Carteret Chowan Craven Currituck Dare Edgecombe Gates Halifax Hertford Ryde Martin Nash Nor thampton Pamlico Pasquotank Perquimans Pitt Tyrrell Washington Wilson
Ownership class All
Other private : ownerships National :Miscellaneous: County and : Forest ' State : Forest : Federal : j Farmer i Corporate j Individual
- - - - - - - - - - - - - - - - - - - - - - - - A c r e s - - - - - - - - - - - - - - - - - - - - - - - - - 301,822 -- -- 4,367 58 168,415 47,848 24,964 56,170 318,227 -- -- 65 90 108,374 109,042 50,328 50,328 77,531 -- 9,203 -- -- 20,099 25,163 4,194 18,872 187,888 55,937 5,535 411 121 52,448 3,865 23,190 46,381 52,326 -- 20 -- 200 10,808 23,230 5,162 12,906 316,989 55,879 5,170 105 255 115,236 60,603 -- 79,741 66,469 -- 1,694 8,553 190 7,364 19,467 -- 29,201 147,165 -- 40,656 -- 10 550 -- 98,381 7,568 158,528 -- -- 175 221 7,391 85,325 14,221 51,195 145,523 -- 11,528 3,800 -- 50,322 43,567 -- 36,306 256,952 -- 27 85 7 225 47,284 124,627 12,717 71,215 149,132 -- -- 165 130 38,784 66,031 5,503 38,519 221,910 -- 8,628 12,850 -- 34,113 26,730 92,069 47,520 183,261 -- -- -- 40 62,313 98,925 -- 21,983 177,326 -- -- 93 87 7,341 75,469 12,578 81,758 203,939 -- -- 1,233 292 27,639 106,011 11,461 57,303 120,348 -- -- 1,000 41 52,748 18,719 14,560 33,280 52,259 -- 3,831 21 7 365 5,860 25,192 8,397 8,397 74,582 -- 600 -- 6 1 20,996 27,613 6,903 18,409 195,439 -- -- 20 683 29,942 79,651 10,986 74,157 159,053 -- -- 27 9 45,761 13,868 90,143 9,245 93,590 -- 1,000 361 4 40,284 20,777 7,791 23,373 101,078 -- -- 4 1,011 2,123 36,378 2,798 58,764
Total 3,761,337 111,816 87,892 34,303 4,093 956,195 1,138,101 496,346 932,591
a Includes 32,458 acres of other private land under long-term lease.
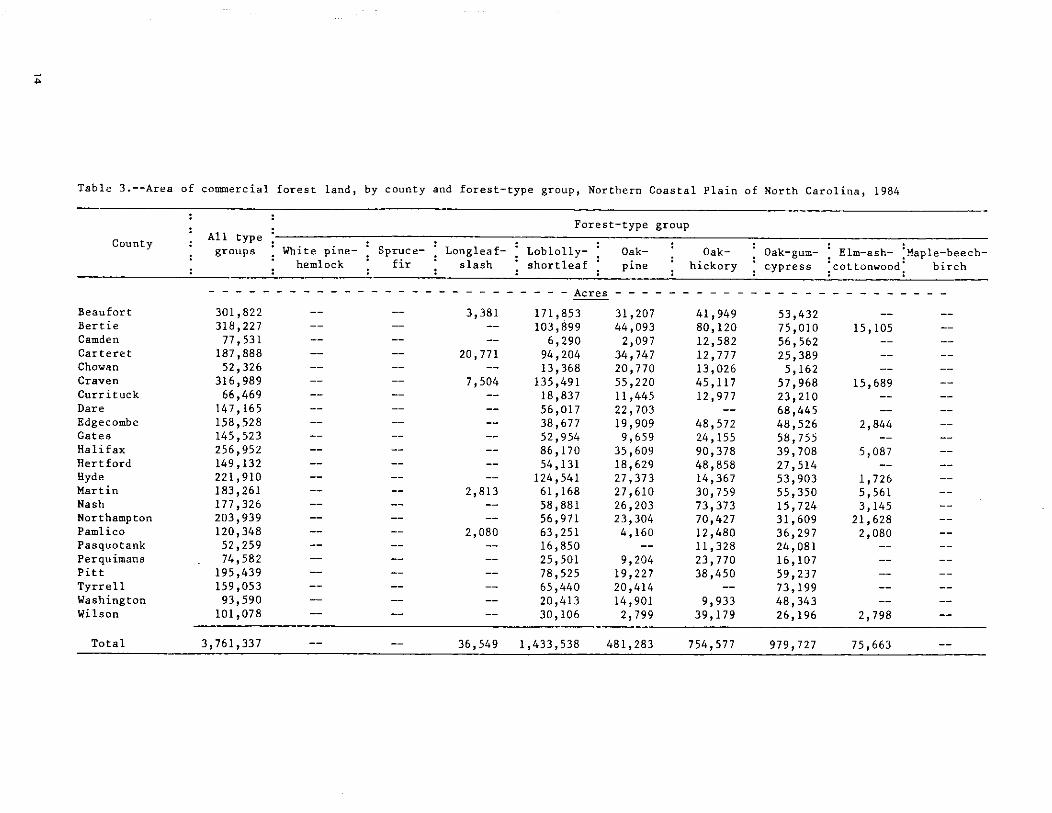
Table 3.--Area of commercial forest land, by county and forest-type group, Northern Coastal Plain of North Carolina, 1984
Forest-type group
County : All type : : groups : White pine- Spruce- : Longleaf- Loblolly- : Oak- 1 Oak- Oak-gum- Elm-ash- :Maple-beech- : hemlock : fir slash : shortleaf : pine : hickory : cypress :cottonvood: birch
- - - - - - - - - - - - - - - - - - - - - - - - - - - A c r e s - - - - - - - - - - - - - - - - - - - - - - - - - - Beaufort Bertie Cemden Carteret Chowan Craven Currituck Dare Edgecombe Gates Halifax Hertford Hyde Martin Nash Northampton Pamlico Pasquotank Perquimans Pitt Tyrrell Washington Wilson
Total 3,761,337 -- -- 36,549 1,433,538 481,283 754,577 979,727 75,663 --
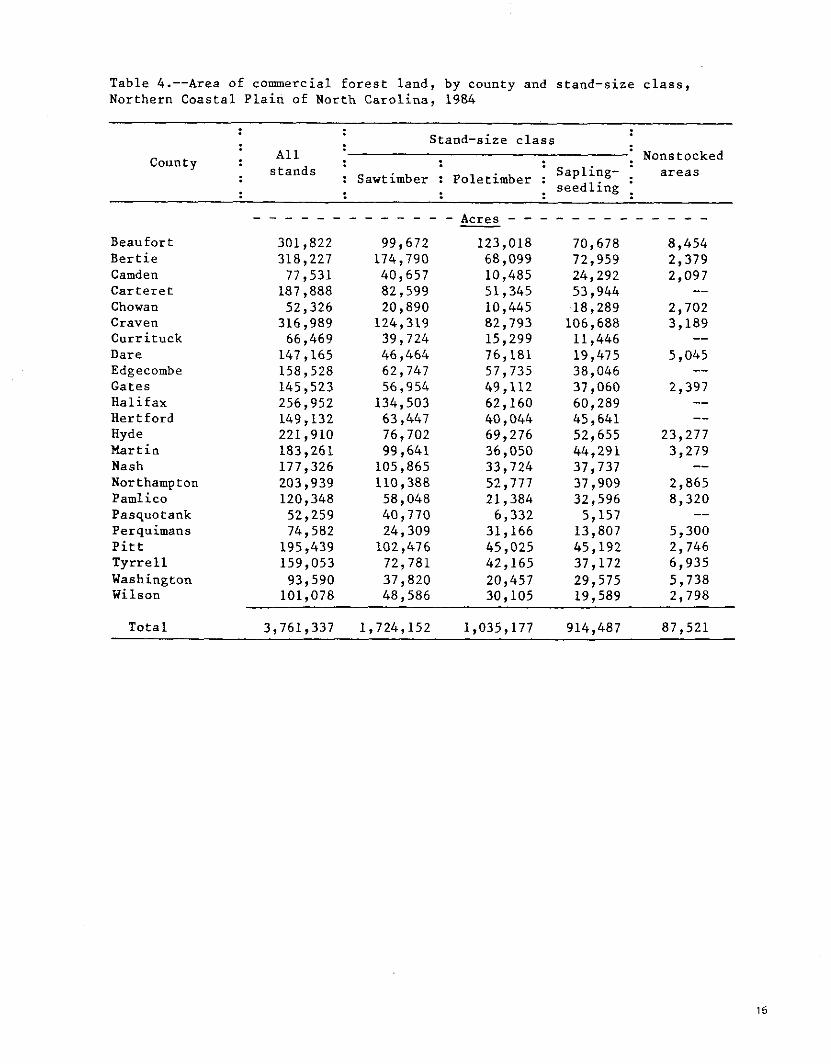
Table 4.--Area of commercial forest land, by county and stand-size class, Northern Coastal Plain of North Carolina, 1984
County
Beaufort Bertie Camden Carteret Chowan Craven Currituck Dare Edgecornbe Gates Halifax Hertford Hyde Mart in Nash Northampton Pamlico Pasquotank Perquimans Pitt Tyrrell Washington Wilson
Total
Stand-size class A11 Nonstocked
stands I Sawtimber poletimber i areas . seedling :

Table 5.--Area of commercial forest land, by county and site class, Northern Coastal Plain of North Carolina, 1984
All Site class (cubic feet per acre per year)
County : classes : > 164 120-164 : 85-119 : 50-84 : 20-49
- - - - - - - - - - - - - - - A c r e s - - - - - - - - - - - - - - - - Beaufort 301,822 -- 4,161 126,807 155,184 15,670
Bertie 318,227 -- 11,184 152,975 148,476 5,592 Camden 77,531 -- 2,097 20,969 54,465 -- Carteret 187,888 -- -- 32,064 91,476 64,348 Chowan 52,326 -- 5,162 39,421 5,162 2,581
Craven 316,989 -- 14,429 94,185 153,747 54,628 Curr i t uck 66,469 -- -- 29,200 28,412 8,857 Dare 147,165 -- -- 10,693 77,943 58,529 Edgecombe 158,528 -- 25,599 55,065 77,864 -- Gates 145,523 -- 4,841 50,732 81,790 8,160 Halifax 256,952 5,087 12,716 99,865 128,663 10,621 Her t ford 149,132 -- 2,751 48,265 98,116 -- Hyde 221,910 -- 5,940 24,604 97,084 94,282 Mart in 183,261 -- 13,740 57,837 111,684 -- R7-h 177,326 -- 15,721 88,140 73,465 -- Northampton 203,939 -- 8,688 78,963 110,558 5,730 Pamlico 120,348 -- 6,011 32,367 54,386 27,584 Pasquotank 52,259 -- 8,762 32,967 10,530 -- Perquimans 74,582 -- 9,902 31,971 30,408 2,301 Pitt 195,439 -- 16,480 86,539 92,420 -- Tyrrell 159,053 -- -- 33,490 79,733 45,830 Washington 93,590 -- 2,597 35,130 44,475 11,388 Wilson 101,078 -- 5,596 40,193 55,289 --
Total 3,761,337 5,087 176,377 1,302,442 1,861,330 416,101
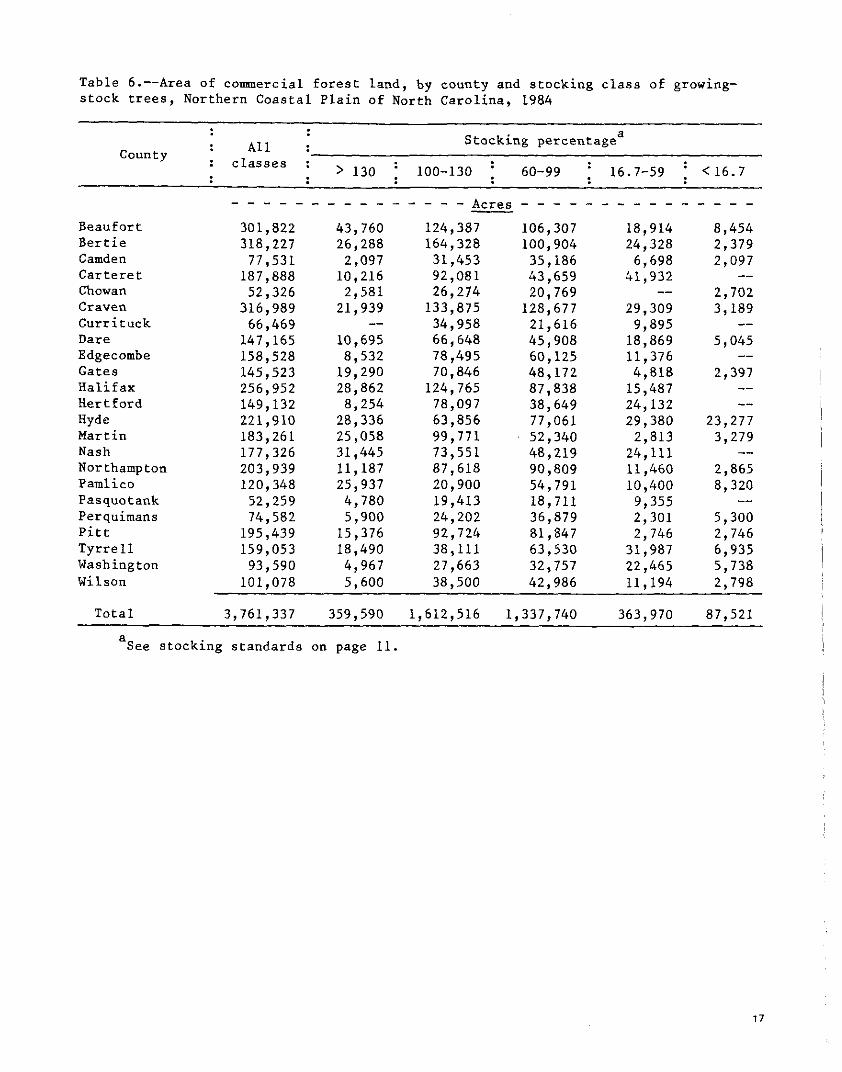
Table 6.--Area of comercia1 forest land, by county and stocking class of growing- stock trees, Northern Coastal Plain of North Carolina, 1984
a A1 1 Stocking percentage
County : classes : > 130 : 100-130 : 60-99 : 16.7-59 : <16.7
- - - - - - - - - - - - - - - A c r e s - - - - - - - - - - - - - - - - Beauf ort 301,822 43,760 124,387 106,307 18,914 8,454 Bertie 318,227 26,288 164,328 100,904 24,328 2,379 Camden 77,531 2,097 31,453 35,186 6,698 2,097 Carteret 187,888 10,216 92,081 43,659 41,932 -- Chowan 52,326 2,581 26,274 20,769 -- 2,702 Craven 316,989 21,939 133,875 128,677 29,309 3,189 Currituck 66,469 -- 34,958 21,616 9,895 -- Dare 147,165 10,695 66,648 45,908 18,869 5,045 Edgecornbe 158,528 8,532 78,495 60,125 11,376 -- Gates 145,523 19,290 70,846 48,172 4,818 2,397 Halifax 256,952 28,862 124,765 87,838 15,487 -- Hertford 149,132 8,254 78,097 38,649 24,132 -- Hyde 221,910 28,336 63,856 77,061 29,380 23,277 Martin 183,261 25,058 99,771 52,340 2,813 3,279 Nash 177,326 31,445 73,551 48,219 24,111 -- Northampton 203,939 11,187 87,618 90,809 11,460 2,865 Pamlico 120,348 25,937 20,900 54,791 10,400 8,320 Pasquotank 52,259 4,780 19,413 18,711 9,355 -- Perquimans 74,582 5,900 24,202 36,879 2,301 5,300 Pitt 195,439 15,376 92,724 81,847 2,746 2,746 Tyrrell 159,053 18,490 38,111 63,530 31,987 6,935 Washington 93,590 4,967 27,663 32,757 22,465 5,738 Wilson 101,078 5,600 38,500 42,986 11,194 2,798
Total 3,761,337 359,590 1,612,516 1,337,740 363,970 87,521
a See stocking standards on page 11.
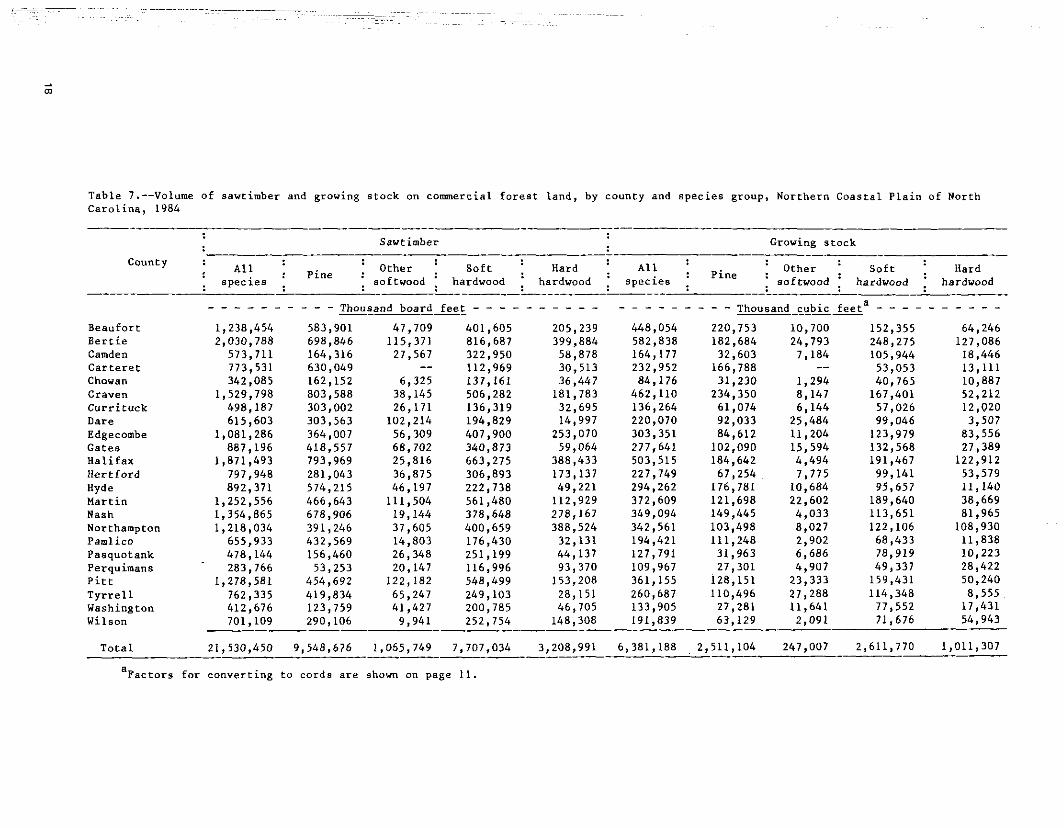
T a b l e 7.--Volume of sawtimber and growing s t o c k on commercial f o r e s t l a n d , by county and s p e c i e s group, Nor thern C o a s t a l P l a i n o f North C a r o l i n a , 1984
-- - - - - - - -- - Sawtimber Growing s t o c k
- --- County Other S o f t : Hard : : A l l j p i n e : @.I1 1 p i n e . Other S o f t : Hard : s p e c i e s . . softwood hardwood : hardwood : s p e c i e s . softwood : hardwood hardwood - -- - - -- - - - - - - -- - - - -
- - - - - - - - - - Thousand board feet - - - - - - - - - - - - - - - - - - - Thousand_c_u_bic f e e t a - - - - - - - - - - B e a u f o r t 1 ,238,454 583,901 47,709 401,605 205,239 448,054 220,753 10,700 152,355 64,246 B e r t i e 2 ,030,788 698,846 115,371 816,687 399,884 582,838 182,684 24,793 248,275 127,086 Camden 573,711 164,316 27,567 322,950 58,878 164,177 32,603 7,184 105,944 18,446 C a r t e r e t 773,531 630,049 -- 112,969 30,513 232,952 166,788 -- 53,053 13,111 Chowan 342,085 162,152 6,325 137,161 36,447 84 ,176 31,230 1 ,294 40,765 10,887 Craven 1,529,798 803,588 38,145 506,282 181,783 462,110 234,350 8,147 167,401 52,212 C u r r i t u c k 498,187 303,002 26,171 136,319 32,695 136,264 61,074 6,144 57,026 12 ,020 Dare 615,603 303,563 102,214 194,829 14,997 220,070 92,033 25,484 99,046 3,507 Edgecombe 1,081,286 364,007 56,309 407,900 253,070 303,351 84,612 11,204 123,979 83,556 G a t e s 887,196 418,557 68,702 340,873 59,064 277,641 102,090 15,594 132,568 27,389 H a l i f a x 1,871,493 793,969 25,816 663,275 388,433 503,515 184,642 4,494 191,467 122,912 H e r t f o r d 797,948 281,043 36,875 306,893 173,137 227,749 67,254 7,775 99,141 53,579 Hyde 892,371 574,215 46,197 222,738 49,221 294,262 176,781 10,684 95,657 11 ,140 M a r t i n 1,252,556 466,643 111,504 561,480 112,929 372,609 121,698 22,602 189,640 38,669 Nash 1,354,865 678,906 19,144 378,648 278,167 349,094 149,445 4 ,033 113,651 81,965 Northampton 1,218,034 391,246 37,605 400,659 388,524 342,561 103,498 8,027 122,106 108,930 Pamlico 655,933 432,569 14,803 176,430 32,131 194,421 111,248 2,902 68,433 11,838 Pasquotank 478,144 156,460 26,348 251,199 44,137 127,791 31,963 6,686 78,919 10 ,223 Perquimans 283,766 53,253 20,147 116,996 93 ,370 109,967 27,301 4 ,907 49,337 28,422 P i t t 1 ,278,581 454,692 122,182 548,499 153,208 361,155 128,151 23,333 159,431 50,240 T y r r e l l 762,335 419,834 65,247 249,103 28,151 260,687 110,496 27,288 114,348 8,555 Washington 412,676 123,759 41,427 200,785 46,705 133,905 27,281 11,641 77,552 17,431 Wilson 701,109 290,106 9,941 252,754 148,308 191,839 63,129 71,676 54,943 - - ---- 2 ,091
T o t a l 21,530,450 9,548,676 1,065,749 7,707,034 3,208,991 6,381,188 2,511,104 247,007 2,611,770 1,011,307
a ~ a c t o r s f o r c o n v e r t i n g t o c o r d s a r e shown on page 11.

T a b l e 8.--Net annual growth o f sawt imber and growing s t o c k on commercial f o r e s t l a n d , by c o u n t y and s p e c i e s g roup , Nor the rn C o a s t a l P l a i n o f North C a r o l i n a , 1983
Sawtimber Growing s t o c k -
County A l l . : Other : S o f t : Hard 1 A l l I pine . ' O t h e r : S o f t 1 Hard
: P i n e : : s p e c i e s . softwood 1 hardwood : hardwood : s p e c i e s . 1 sof twood : hardwood hardwood
B e a u f a r t B e r t i e Camden C a r t e r e r Chowan Craven C u r r i t u c k
- - - - - - - - - Thousand board f e e t - - - - - - - - - - - - - - - - - - - Thousand cub i c f e e t - - - - - - - - -
Dare 34;876 20;365 5,191 8 ;896 424 7;259 3; 244 891 3;052 7 2 Edgecornbe 54,324 16 ,261 1 , 7 4 1 22,389 1 3 , 9 3 3 12,217 4 ,238 283 4 ,455 3 ,241 G a t e s 44,531 1 8 , 8 3 4 2,391 19,342 3,964 11,462 5 , 0 3 1 433 4 ,681 1 , 3 1 7 H a l i f a x 95,184 41,030 390 34 ,283 19 ,481 22,065 8,376 69 8,332 5,288 H e r t f o r d 34,071 12 ,013 1,127 13 ,400 7,531 9 ,281 3 ,415 199 3,744 1 , 9 2 3 Hyde 50,312 33,285 1 , 5 3 3 13,228 2,266 12 ,573 7,676 248 4 , 2 6 3 386 M a r t i n 62,898 25 ,186 3,346 26,835 7,531 15,652 6 ,417 928 6,686 1,621 Nssh 57 ,322 26,636 405 16 ,326 1 3 , 9 5 5 14,106 6 ,143 68 4,804 3,091 Northampton 56,630 22,718 871 16,854 16 ,187 14,584 5 ,889 136 4 ,391 4 ,168 Paml ico 36,362 25,608 460 8,988 1,306 8 ,639 4 ,799 74 3,339 427 Pasquo tank 1 8 , 7 0 3 6 ,208 1,006 9 ,435 2,054 3 ,973 1,189 186 2,260 338 Perquirnans 14 ,533 4 ,691 624 5 ,778 3,440 5 ,033 2,294 121 1 ,546 1,072 P i t t 60,528 23,236 3,485 26,214 7,593 15,432 7,578 560 5,189 2 ,105 T y r r e l l 37,522 21,406 3,079 11 ,793 1 ,244 9 ,743 4 ,238 931 4 ,246 328 Washington 16 ,646 5 , 2 7 2 1,515 8,157 1,702 5,935 1 ,079 533 3,539 784 Wilson 39,190 12 ,614 33 1 16 ,604 9,601 8 , 2 3 5 2 ,651 55 3 ,403 2,126
T o t a l 1 ,075 ,733 503,622 35,223 374,568 162,320 270,106 122,248 7,228 100,404 40,226

Table 9.--Annual removals of sawtimber and growing stock on commercial forest land, by county and species group, Northern Coastal Plain of North Carolina, 1983
Sawtimber Growing stock
County Other : Soft 1 Hard : Other Soft Hard 1 All 1 Pine . ; All ; pine .
soecies softwood ' hardwood ' hardwood ' species . : softwood : hardwood hardwood
Beaufart Bertie Camden Carteret Chowan Craven Currituck Dare Edgecombe Gates Halifax Hertford Hyde Martin Nash Northampton Pamlico Pasquotank Perquimans Pitt Tyrrell Washington Wilson
- - - Thousand board feet - - - 45,685 1,178 11,169 38,794 688 7,989 24,122 5,126 2,014 26,451 -- 1,061 16,107 -- 2,632 36,771 -- 8,630 6,963 -- 6,651 15,360 3,673 386 35,861 -- 15,668 26,352 -- 5,769 17,556 -- 17,992 17,725 -- 3,863 20,866 1,134 6,049 34,162 -- 953 26,880 -- 11,832 9.723 -- 15,153
- - - - - - - - - Thousand cubic feet - - - - - - - - - 15.778 10.551 220 3,460 1,547
Total 835,620 542,083 23,132 168,410 101,995 213,973 123,167 6,283 53,135 31,388

Unit Tables
Table 10.--Area of commercial forest land, by forest type and ovnership class, Northern Coastal Plain of North Carolina, 1984
Ownership class
: All Forest type : ownerships : National : Other : Forest : Forest 1 other
industry- ' : Forest : public : industry : : private . leased ?
- - - - - - - - - - - - - - - - A c r e s - - - - - - - - - - - - - - - - - - - Softwood types: White pine-hemlock -- -- -- -- -- -- Spruce-fir -- -- -- -- -- -- Longleaf pine 26,490 16,437 1,723 2,384 -- 5,946 Slash pine 10,059 -- -- 2,813 3,381 3,865 Loblolly pine 1,137,861 17,626 13,105 523,234 12,750 571,146 Shortleaf pine 5,895 -- -- -- -- 5,895 Virginia pine -- -- -- -- -- -- Sand pine -- -- -- -- -- -- Eastern redcedar -- -- -- -- -- -- Pond pine 289,782 30,206 30,481 46,404 -- 182,691 Spruce pine -- -- -- -- -- -- Pitch pine -- -- -- -- -- -- Table Mountain pine -- -- -- -- -- --
Total 1,470,087 64,269 45,309 574,835 16,131 769,543
Eardwood types: Oak-pine 481,283 35,702 6,561 57,500 3,735 377,785 Oak-hickory 754,577 4,590 10,221 74,975 6,201 658,590 Chestnut oak -- -- -- -- -- -- Southern scrub oak -- -- -- -- -- -- Oak-gum-cypress 979,727 7,255 62,471 193,544 6,391 710,066 Elm-ash-cottonwood 75,663 -- 1,726 22,883 - 51,054 Maple-beech-birch -- -- -- -- -- -- Total 2,291,250 47,547 80,979 348,902 16,327 1,797,495
All types 3,761,337 111,816 126,288 923,737 32,458 2,567,038
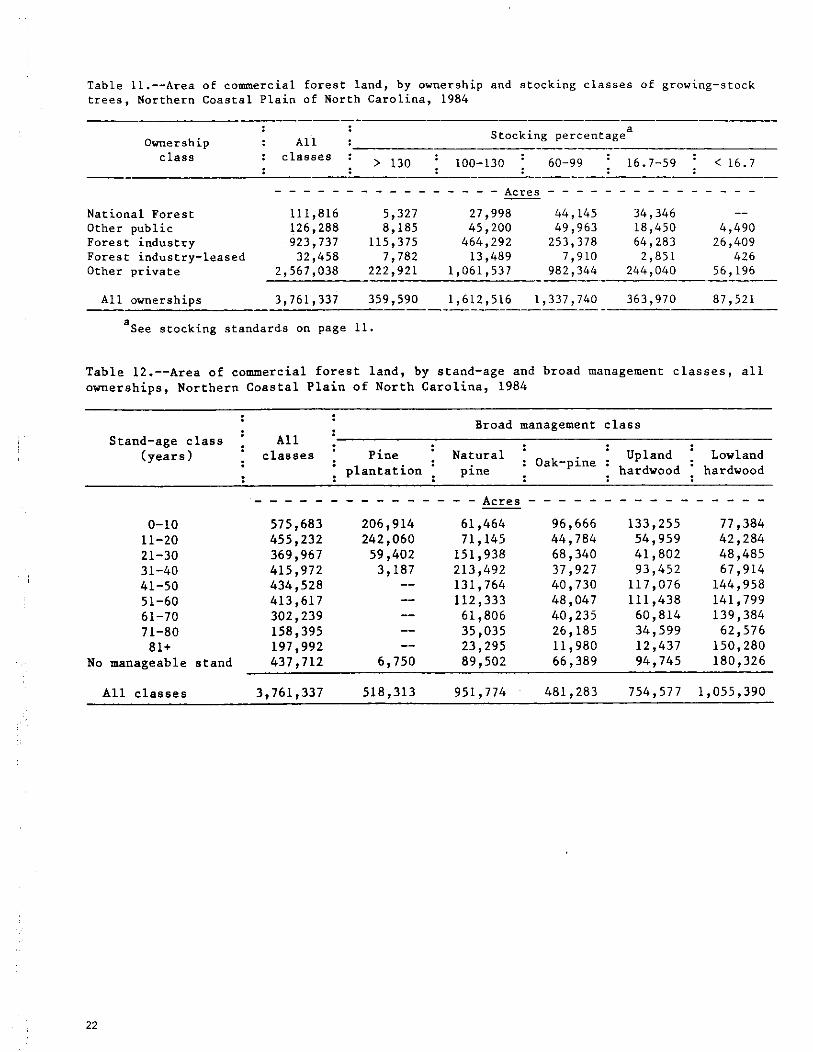
Table 11.--Area of comercial forest land, by ownership and stocking classes of growing-stock trees, Northern Coastal Plain of North Carolina, 1984
a Stocking percentage Ownership : All : class : classes : > 130 100-130 60-99 : 16.7-59 : c16.7
-- -- - - - - - - - - - - - - - - - - A c r e s - - - - - - - - - - - - - - - -
National Forest 111,816 5,327 27,998 44,145 34,346 -- Other public 126,288 8,185 45,200 49,963 18,450 4,490 Forest industry 923,737 115,375 464,292 253,378 64,283 26,409 Forest industry-leased 32,458 7,782 13,489 7,910 2,851 426 Other ~rivate 2,567,038 222,921 1,061,537 982,344 244,040 56,196 - -- All ownerships -- -- 3,761,337 359,590 1,612,516 1,337,740 363,970 - -- 87,521
a See stocking standards on page 11.
Table 12.--Area of commercial forest land, by stand-age and broad management classes, all ownerships, Northern Coastal Plain of North Carolina, 1984
Broad management class - All : Stand-age class . (years) 1 classes 1 Pine : Natural I ~ ~ k - ~ i ~ ~ : Upland Lowland
plantation pine . . hardwood : hardwood - - - - - - - - - - - - - - - A c r e s - - - - - - - - - - - - - - - - -
0-10 575,683 206,914 61,464 96,666 133,255 77,384 11-20 455,232 242,060 71,145 44,784 54,959 42,284 21-30 369,967 59,402 151,938 68,340 41,802 48,485 31-40 415,972 3,187 213,492 37,927 93,452 67,914 41-50 434,528 -- 131,764 40,730 117,076 144,958 51-60 413,617 -- 112,333 48,047 111,438 141,799 61-70 302,239 -- 61,806 40,235 60,814 139,384 71-80 158,395 -- 35,035 26,185 34,599 62,576 81+ 197,992 -- 23,295 11,980 12,437 150,280
No manageable stand 437,712 6,750 89,502 66,389 94,745 180,326
All classes 3,761,337 518,313 951,774 481,283 754,577 1,055,390
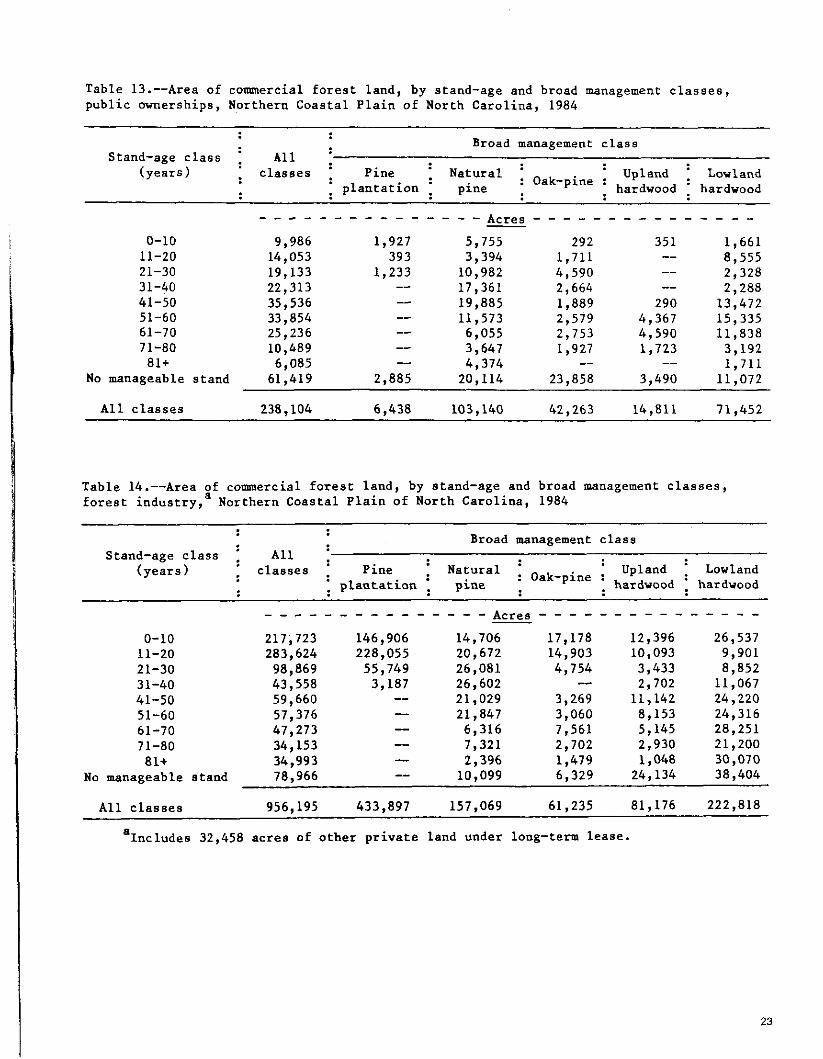
Table 13.--Area of commercial forest land, by stand-age and broad management classes, public ownerships, Northern Coastal Plain of North Carolina, 1984
--
Broad management class Stand-age class : A11 :
(years) : classes . Pine . Natural . Upland 1 Lowland : Oak-pine : 1 plantation I pine . . hardwood 1 hardwood
0-10 11-20 21-30 31-40 41-50 51-60 61-70 71-80 81+
No manageable stand
- - - - Acres - 5,755 3,394 10,982 17,361 19,885 11,573 6,055 3,647 4,374 20,114
All classes 238,104 6,438 103,140 42,263 14,811 71,452
Table 14.--Area of commercial forest land, by stand-age and broad management classes, a forest industry, Northern Coastal Plain of North Carolina, 1984
Broad management class :
Stand-age class . All (years) : classes Pine 1 Natural I Oak-pine : Upland Lowland : plantation : pine . hardwood : hardwood
- - - - - - - - - - - - - - - A c r e s - - - - - - - - - - - - - - - - 0-10 11-20 21-30 31-40 41-50 51-60 61-70 71-80 81+
No manageable stand
All classes 956,195 433,897 157.069 61,235 81,176 222,818
a Includes 32,458 acres of other private land under long-term lease.
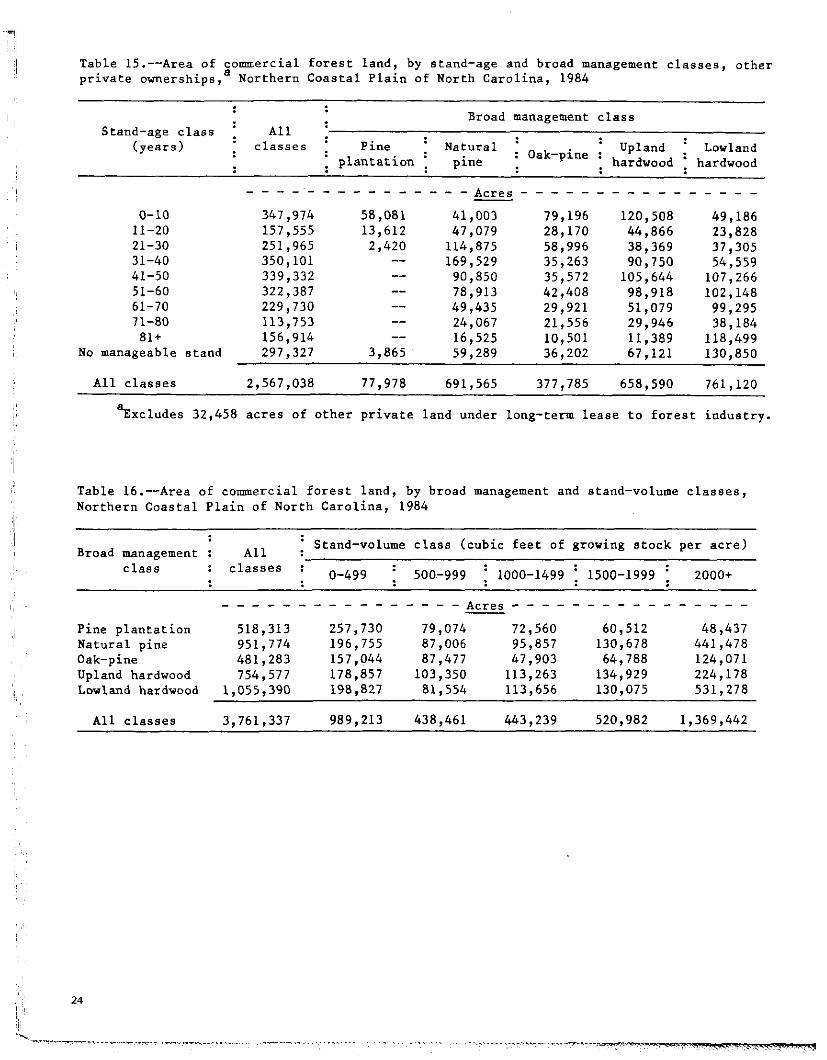
Table 15.--Area of commercial forest land, by stand-age and broad management classes, other a private ownerships, Northern Coastal Plain of North Carolina, 1984
Broad management class - All : Stand-age class . (years) classes : Pine . Natural ' Upland . Lowland : Oak-pine : plantation pine . . hardwood hardwood
- - - - - - - - - - - - - - - A c r e s - - - - - - - - - - - - - - - - - 0-10 347,974 58,081 41,003 79,196 120,508 49,186 11-20 157,555 13,612 47,079 28,170 44,866 23,828 21-30 251,965 2,420 114,875 58,996 38,369 37,305 31-40 350,101 -- 169,529 35,263 90,750 54,559 41-50 339,332 -- 90,850 35,572 105,644 107,266 51-60 322,387 -- 78,913 42,408 98,918 102,148 61-70 229,730 -- 49,435 29,921 51,079 99,295 71-80 113,753 -- 24,067 21,556 29,946 38,184 El+ 156,914 -- 16,525 10,501 11,389 118,499
No manageable stand 297,327 3,865 59,289 36,202 67,121 130,850
All classes 2,567,038 77,978 691,565 377,785 658,590 761,120
%xcludes 32,458 acres of other private land under long-term lease to forest industry.
Table 16.--Area of commercial forest land, by broad management and stand-volume classes, Northern Coastal Plain of North Carolina, 1984
: Stand-volume class (cubic feet of growing stock per acre) Broad management : All
class : classes : 0-499 500-999 : 1000-1499 1500-1999 : 2000+
- - - - - - - - - - - - - - - - Acres - - - - - - - - - - - - - - - - - Pine plantation 518,313 257,730 79,074 72,560 60,512 48,437 Natural pine 951,774 196,755 87,006 95,857 130,678 441,478 Oak-pine 481,283 157,044 87,477 47,903 64,788 124,071 Upland hardwood 754,577 178,857 103,350 113,263 134,929 224,178 Lowland hardwood 1,055,390 198,827 81,554 113,656 130,075 531,278
All classes 3,761,337 989,213 438,461 443,239 520,982 1,369,442
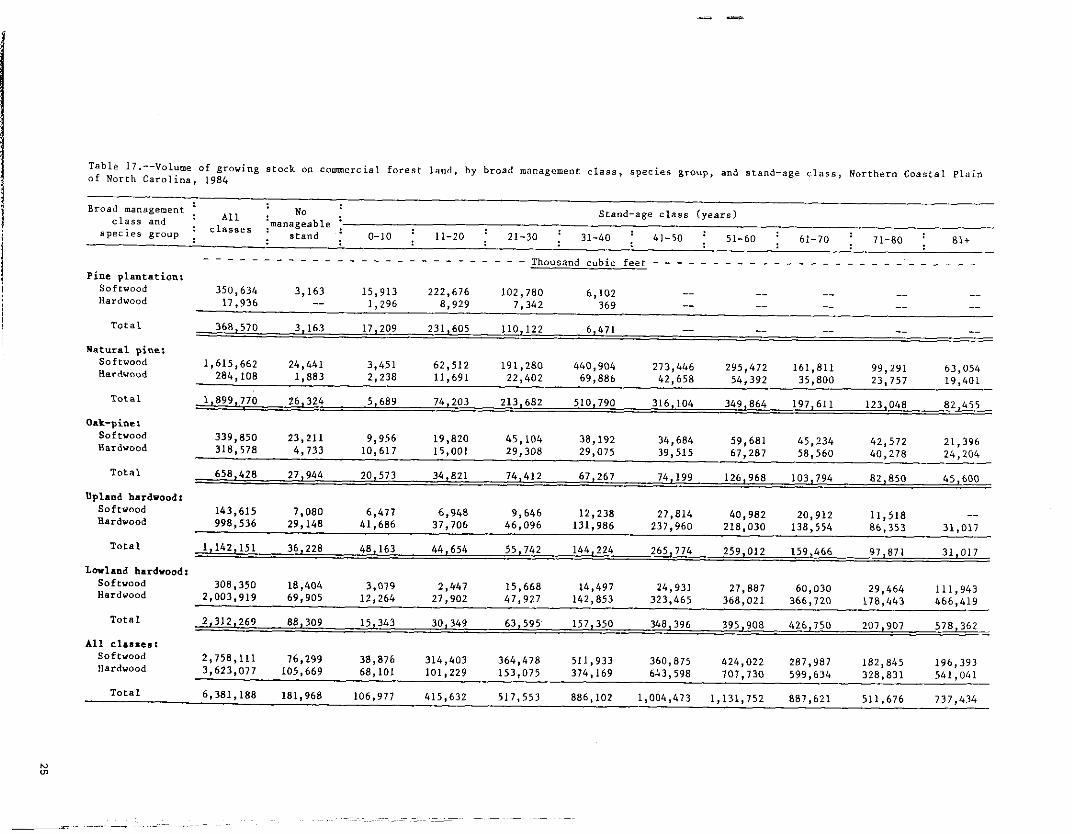
Table 17.--Volume of growing s tock on commercial f o r e s t land, by broad management c l a s s , specie6 group, and stand-age c l a s s , Northern Coastal P l a i n o f North Caro l ina , 1984
Broad management ' No 1 : A l l : Stand-age c l a s s (years) c l a s s and manageable :
s p e c i e s group j c lassep . : s tand : 0-10 : 11-20 : 21-30 : 31-40 41-50 j 51-60 61-70 j 71-80 81+
- - - - - - - ' - - - - - - - -. - - - - - - - - - - Thousand cubic f e e t - - - - - - - - - - - - - - - - - - - - - - - - - . P i n e p lan ta t ioo :
Softwood 350,634 3,163 15,913 222,676 102,780 6,102 -- -- -- -- -- Hardwood 17,936 -- 1,296 8,929 7,342 369 -- -- -- -- --
T o t a l 368,570 3,163 17,209 231,605 110,122 6,471 -- -- -- -- --
n a t u r a l pine: oftw wood 1,615,662 24,441 3,451 62,512 191,280 440,904 273,446 295,472 161,811 99,291 63,054 Hardwood 284,108 1,883 2,238 11,691 22,402 69,886 42,658 54,392 35,800 23,757 19,401
T o t a l 1,899,770 26,324 5,689 74,203 213,682 510,790 316,104 349,864 197,611 123,048 82,455
Oak-pine: Softwood 339,850 23,211 9,956 19,820 45,104 38,192 34,684 59,681 45,234 42,572 21,396 Hardwood 318,578 4,733 10,617 15,001 29,308 29,075 39,515 67,287 58,560 40,278 24,204
T o t a l 658.428 27,944 20,573 34,821 74,412 67,267 74,199 126,968 103,794 82,850 45,600
Upland hardwood: Softwood 143,615 7,080 6,477 6,948 9,646 12,238 27,814 40,982 20,912 11,518 -- Rardvood 998,536 29,148 41,686 37,706 46,096 131,986 237,960 218,030 138,554 86,353 31,017
T o t a l 1,142,151 36,228 48,163 44,654 55,742 144,224 265,774 259,012 159,466 97,871 31,017
Lowland hardwood: Softwood 308.350 18,404 3,079 2,447 15,668 14,497 Hardwood
24,931 27,887 60,030 29,464 111,943 2,003,919 69,905 12,264 27,902 47,927 142,853 323,465 368,021 366,720 178,443 466,419
Softwood 2,758,111 76,299 38,876 314,403 364,478 511,933 360,875 424,022 287,987 Hardvood
182,845 196,393 3,623,077 105,669 68,101 101,229 153,075 374,169 653,598 707,730 599,634 328,831 5&1,041
Tota l 6,381,188 181,968 106,977 415,632 517,553 886,102 1,004,473 1,131,752 887,621 511,676 737,434
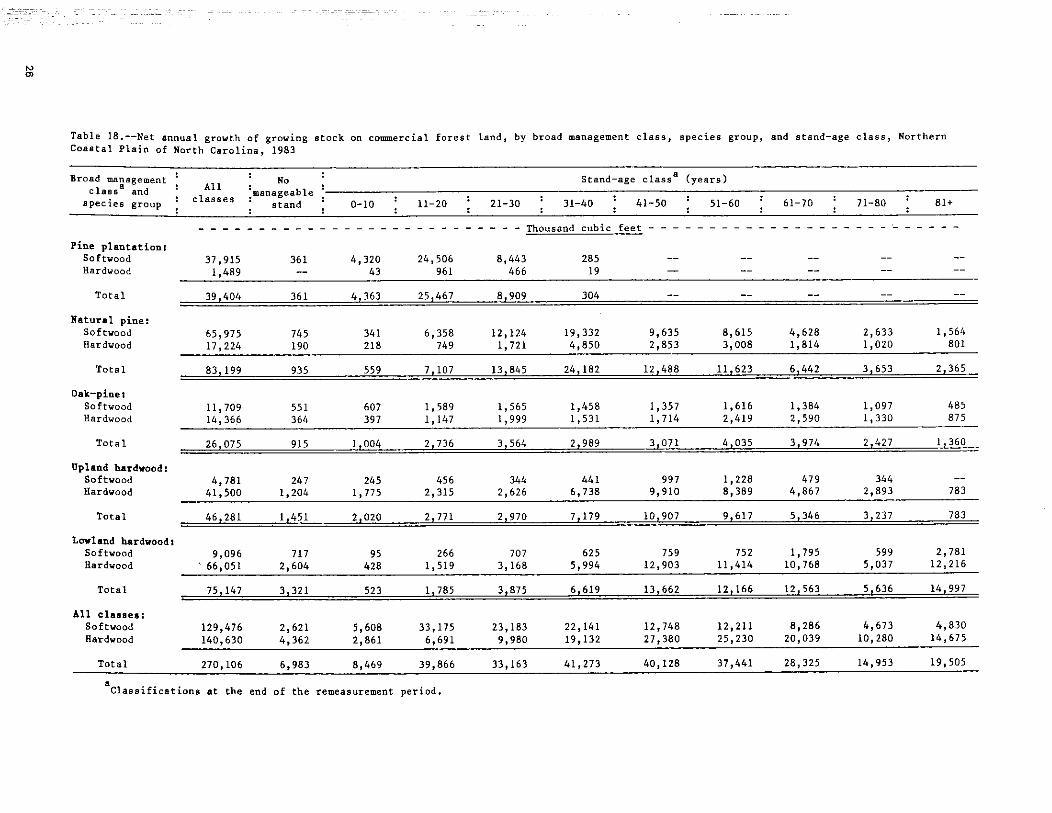
Table 18.--Net annual growth of growing s t o c k on commercial f o r e s t l a n d , by broad management c l a s s , s p e c i e s group, and stand-age c l a s s , Nor thern Coas t a l P l a i n of North c a r o l i n a , 1983
Broad management No 1 Stand-age classa ( y e a r e ) c l e e s a and clt:ies :manageable :
s p e c i e s group : . s t a n d 0-10 . 11-20 21-30 : 31-40 : 41-50 : 51-60 : 61-70 71-80 : 81+
- - - - - - - - - - - - - - - - - - - - - - - - - - - Thousand cub ic feet - - - - - - - - - - - - - - - - - - - - - - - - - - P i n e p l a n t a t i o n ,
Softwood 37,915 361 4 ,320 24,506 8 ,443 285 -- -- -- -- -- Hardwood 1.489 -- 43 961 466 19 -- -- -- -- --
T o t a l 39,404 361 4 ,363 25,467 8,909 304 -- -- -- -- --
N a t u r a l p ine: Softwood 65,975 745 341 6 ,358 12,124 19,332 9,635 8 ,615 4 ,628 2,633 1 ,564 Hardwood 17,224 190 218 749 1 ,721 4 ,850 2 ,853 3 ,008 1 ,814 1 ,020 801
Softwood 11,709 551 607 1 ,589 1,565 1,458 1 ,357 1 ,616 1 ,384 1 ,097 485 Hardwood 14,366 364 397 1 ,147 1,999 1 ,531 1 ,714 2,419 2 ,590 1 ,330 875
T o t a l 26,075 915 1 ,004 2,736 3,564 2,989 3 ,071 4 ,035 3,974 2,427 1 ,360
Uoland harAvnna: . - - - - - - - - - - . Softwood 4,781 24 7 245 456 344 44 1 997 1 ,228 479 344 -- Hardwood 41,500 1,204 1 ,775 2,315 2,626 6,738 9,910 8 ,389 4 ,867 2,893 783
T o t a l 46,281 1 ,451 2,020 2,771 2,970 7,179 10,907 9,617 5 ,346 3,237 783
Lor land hardwoodl Softwood 9,096 717 95 266 707 625 759 752 1 ,795 599 2,781 Hardwood ' 66,051 2,604 428 1 ,519 3 ,168 5 ,994 12,903 11,414 10,768 5 ,037 12,216
T o t a l 75,147 3,321 523 1 ,785 3,875 6 ,619 13,662 12,166 12,563 5 ,636 14,997
A l l claases: Softwood 129,476 2,621 5 ,608 33,175 23,183 22,141 12,748 12,211 8,286 4,673 4,830 Kardvood 140,630 4,362 2,861 6,691 9,980 19,132 27,380 25,230 20,039 10,280 14,675
T o t a l 270,106 6,983 8 ,469 39,866 33,163 41,273 40,128 37,441 28,325 14,953 19,505
' c l a s s i f i c a t i o n s a t t he end of t h e remeasurement pe r iod .
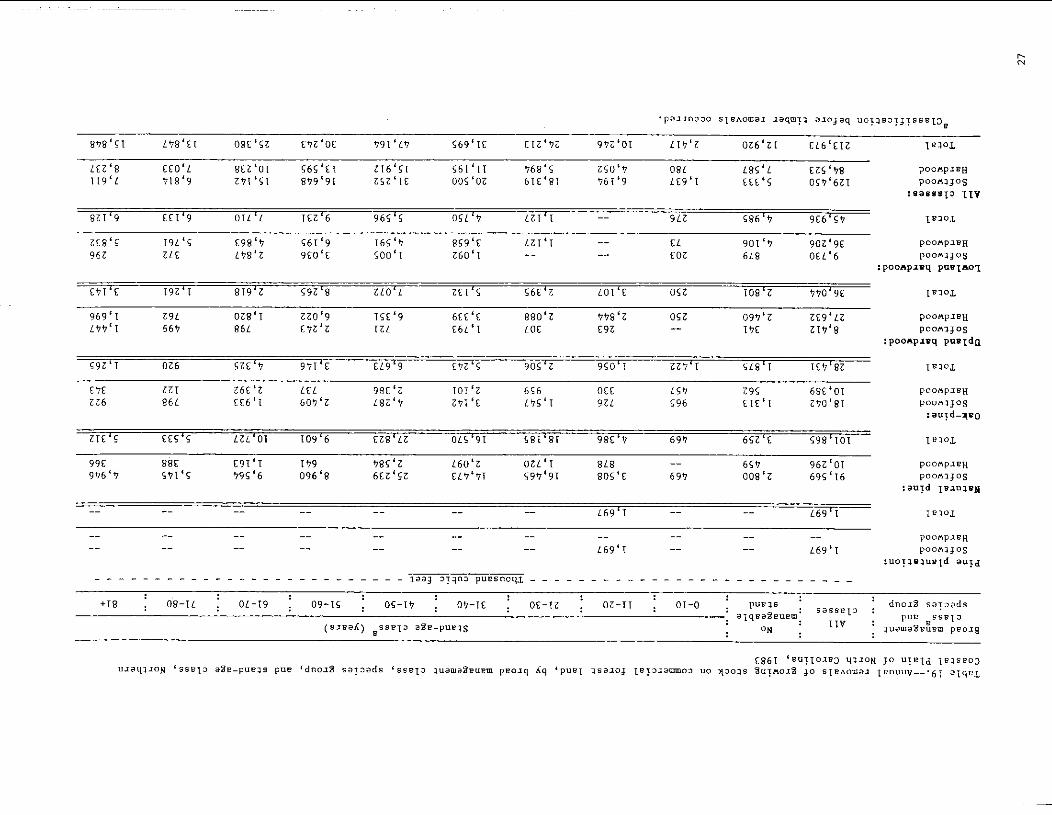
969 '1 291 0 2 8 ' 1 220 '9 TSE'9 6EE'E 880 '2 998 '2 052 0 9 9 ' 2 ZE9'12 p o o n p z e ~ 1 9 9 ~ 1 569 861 E9Z'Z I Z L E 6 ~ ' 1 LOE E92 -- I '7E 219 '8 paon13os
:POOI~IP~ p u e l d n
E 9 Z ' l 026 5 2 ~ ' ~ 9 7 1 ' ~ EL9'9 1'72'5 905 '2 9 5 0 ' 1 Z Z V ' I i L 8 ' I iE t i ' 82 I~IOL
-
CQE 221 Z6EcZ LEL 98ELZ TO1 '2 656 OEE 15'7 Z95 68E'01 p a o n p s e ~ 226 8 6 1 ES6'1 60'7'2 L 8 2 ' 9 271 'E L ' /SL1 9ZL 596 E I E ' I 2'70'81 p o o n ~ j o s
.. -- -. -- -- -- -- -- -- -- -- pounple" -- -- -- -- -- -. -- 1 6 9 ' 1 -- -- 1 6 9 ' 1 poon lJoS
:uoyas1un1d a o y d
- - - - . - - - - . - - - - - - - - - - - - - - - - ~ a a ~ 3 y q n ~ p u e s n o l l ~ . - - - - - - - - - - - - - - - - - - - - - - - - - - - ' dnaz% s a ~ ~ a d s + I 8 1 08 - IL 01-19 1 09-15 1 0 5 - I t I O' / - I f I 0 02-11 : 01-0 : Pue ls : sasse13 :
. aiqea%euem: IIv : pue e s s e [ > (slead) s s e 1 ~ a % e - p u e ~ g
ON . ~uama%euem p e o ~ g
E861 'eu?1o=e3 ~ I X O N 30 uye16 j e I s e o 3 u l a q l x a N ' s s e l ~ a%e-pueas puc ' d n o l % s a r J a d s ' s s e ~ > ~uama%euem peoxq dq ' p u e 1 1sa303 Ie!Jxa-oJ uo y ~ o ~ s % u y n a ~ d 30 s[enomax ~enuug-:61 a tqeL

Table 20.--Merchantable volume of all live trees and growing stock on commercial forest land, by farest-type group, and species group, Northern Coastal Plain of North Carolina, 1984
All live trees Growing stock
Forest-type group : Other Soft Hard : Hard All I Pine . Other Soft . All Pine . species . softwood : hardwood : hardwood species . softwood : hardwood : hardwood
- - - - - - - - - - - - - - - - - - - - - - Thousand cubic feet - - - - - - - - - - - - - - - - - - - - - - - - -- -- -- -- -- -- -- -- -- -- White pine-hemlock
Spruce-fir Longleaf-slash pine Loblolly-shortleaf pine Oak-pine Oak-hickory Oak-gum-cypress Elm-ash-cottonwood -- -- -- -- -- -- -- -- -- -- Maple-beech-birch
All types 6,823,008 2,523,789 260,807 2,881,739 1,156,673 6,381,188 2,511,104 247,007 2,611,770 1,011,307
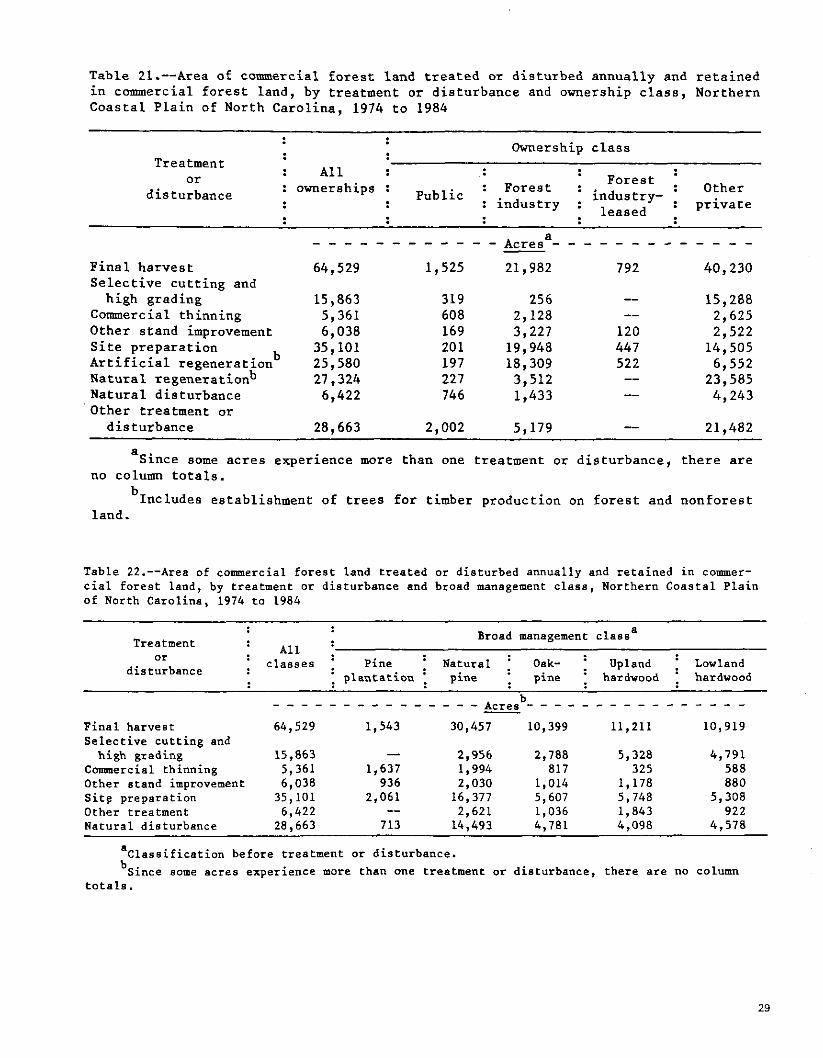
Table 21.--Area of commercial forest land treated or disturbed annually and retained in commercial forest land, by treatment or disturbance and ownership class, Northern Coastal Plain of North Carolina, 1974 to 1984
--
Ownership class Treatment
All or Forest ' : ownerships : : Forest : disturbance : Other
: industry : industry- : private . leased . a - - - - - - - - - - - - A c r e s - - - - - - - - - - - - - -
Final harvest 64,529 1,525 21,982 792 40,230 Selective cutting and high grading 15,863 319 256 -- 15,288
Commercial thinning 5,361 608 2,128 -- 2,625 Other stand improvement 6,038 169 3,227 120 2,522 Site preparation 35,101 201 19,948 447 14,505 Artificial regeneration 25,580 197 18,309 522 6,552 Natural regenerationb 27,324 227 3,512 -- 23,585 Natural disturbance 6,422 746 1,433 -- 4,243 Other treatment or disturbance 28,663 2,002 5,179 -- 21,482
a Since some acres experience more than one treatment or disturbance, there are
no column totals. b Includes establishment of trees for timber production on forest and nonforest
land.
Table 22.--Area of commercial forest land treated or disturbed annually and retained in comer- cia1 forest land, by treatment or disturbance and broad management class, Northern Coastal Plain of North Carolina, 1974 to 1984
a Broad management class Treatment or 1 All :
1 classes Pine i Natural Oak- i Upland : Lowland disturbance plantation pine . pine . hardwood : hardwood
Final harvest Selective cutting and high grading
Commercial thinning Other stand improvement Sitg preparation Other treatment Natural disturbance
- - - - - b Acres - - - - - 30,457 10,399
a Classification before treatment or disturbance. b~ince some acres experience more than one treatment or disturbance, there are no column
totals.
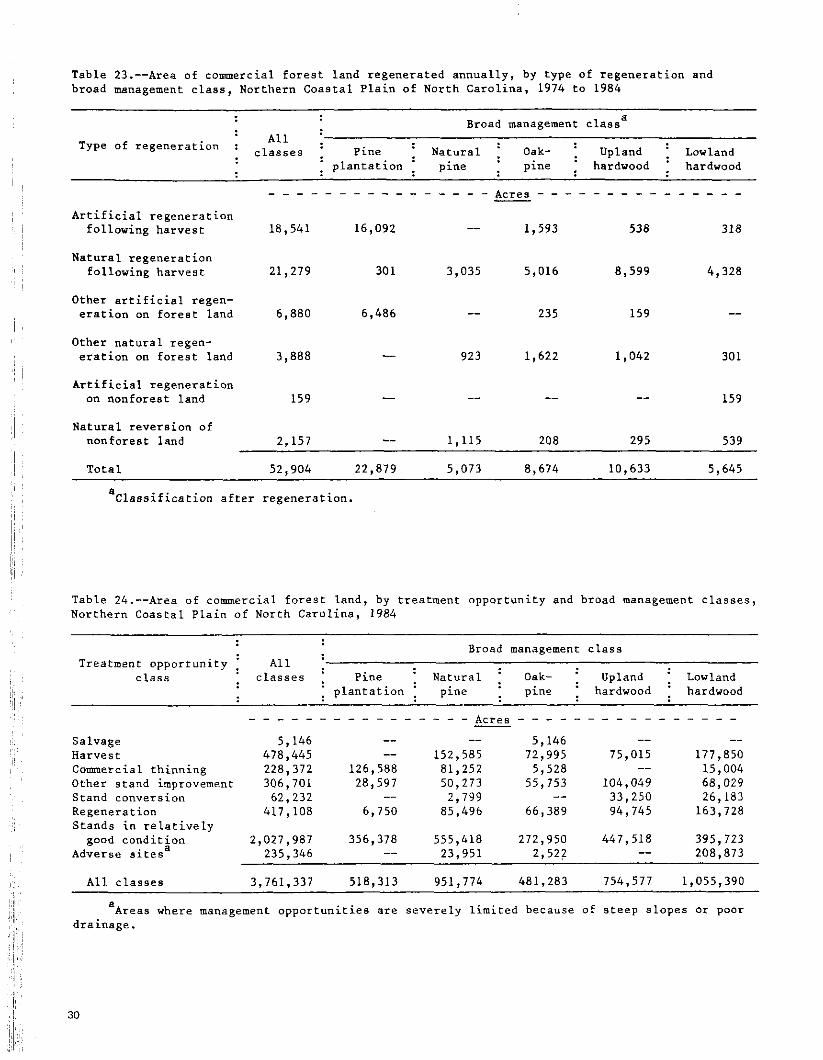
Table 23.--Area of commercial forest land regenerated annually, by type of regeneration and broad management class, Northern Coastal Plain of North Carolina, 1974 to 1984
a Broad management class : All : Type of regeneration : classes : Pine : Natural Oak- : Upland Lowland : plantation : pine : pine . hardwood hardwood
- - - - - - - - - - - - - - - - A c r e s - - - - - - - - - - - - - - - - Artificial regeneration
following harvest 18,541 16,092
Natural regeneration following harvest 21,279
Other artificial regen- eration on forest land 6,880 6,486 -- 235 159 --
Other natural regen- eration on forest land 3,888 -- 923 1,622 1,042 30 1
Artificial regeneration on nonforest land 159 -- -- -- -- 159
Natural reversion of nonforest land 2,157 -- 1,115 208 295 539
Total 52,904 22,879 5,073 8,674 10,633 5,645
a Classification after regeneration.
Table 24.--Area of commercial forest land, by treatment opportunity and broad management classes, Northern Coastal Plain of North Carolina, 1984
~- ~
Broad management class Treatment opportunity All 1
class ' classes 1 Pine : Natural : Oak- Upland Lowland : plantation : pine : pine . hardwood 1 hardwood
- - - - - - - - - - - - - - - - A c r e B - - - - - - - - - - - - - - - - - Salvage 5,146 -- -- 5,146 -- -- Harvest 478,445 -- 152,585 72,995 75,015 177,850 Commercial thinning 228,372 126,588 81,252 5,528 -- 15,004 Other stand improvement 306,701 28,597 50,273 55,753 104,049 68,029 Stand conversion 62,232 -- 2,799 -- 33,250 26,183 Regeneration 417,108 6,750 85,496 66,389 94,745 163,728 Stands in relatively good condition 2,027,987 356,378 555,418 272,950 447,518 395,723
a Adverse sites 235,346 -- 23,951 2,522 -- 208,873
All classes 3,761,337 518,313 951,774 481,283 754,577 1,055,390
a Areas where management opportunities are severely limited because of steep slopes or poor drainage.
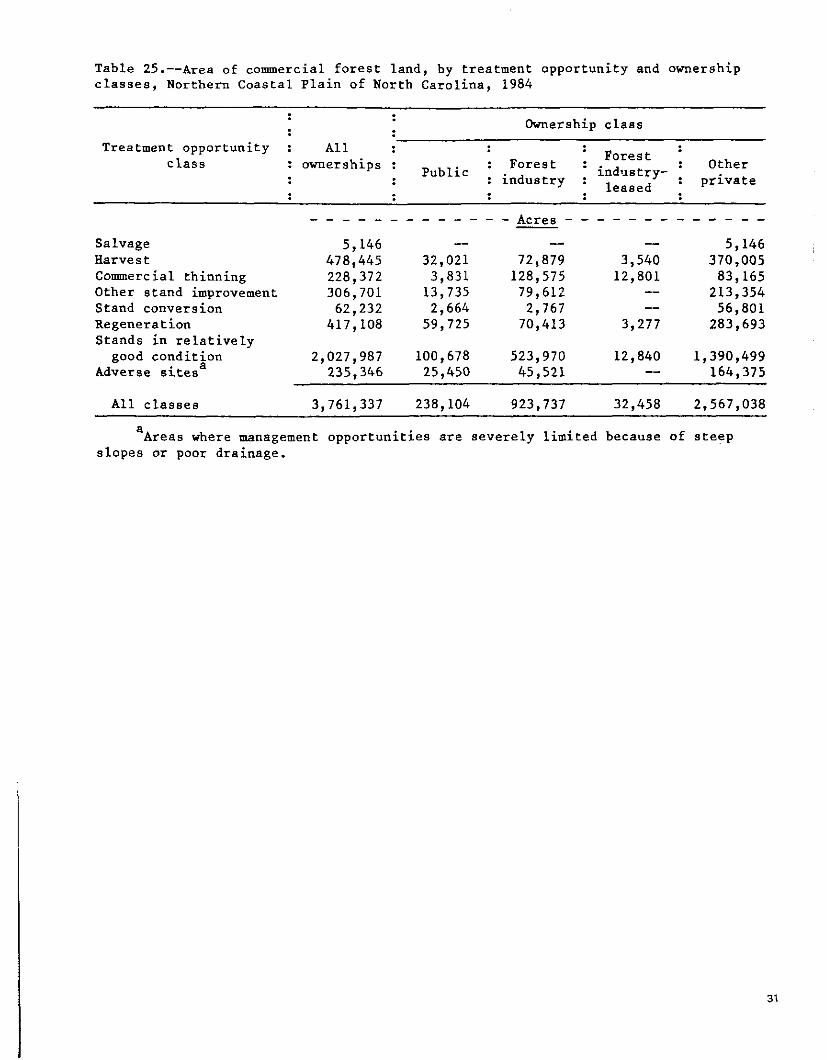
Table 25.--Area of commercial forest land, by treatment opportunity and ownership classes, Northern Coastal Plain of North Carolina, 1984
Ownership class
Treatment opportunity : A1 1 class : ownerships : : Forest : Forest I Other
: industry : . industry- leased : - private
Salvage 5,146 Harvest 478,445 Commercial thinning 228,372 Other stand improvement 306,701 Stand conversion 62,232 Regeneration 417,108 Stands in relatively good condition 2,027,987
Adverse sitesa 235,346
- - Acres -
All classes 3.761.337 238.104 923.737 32.458 2.567.038
a Areas where management opportunities are severely limited because of steep
slopes or poor drainage.
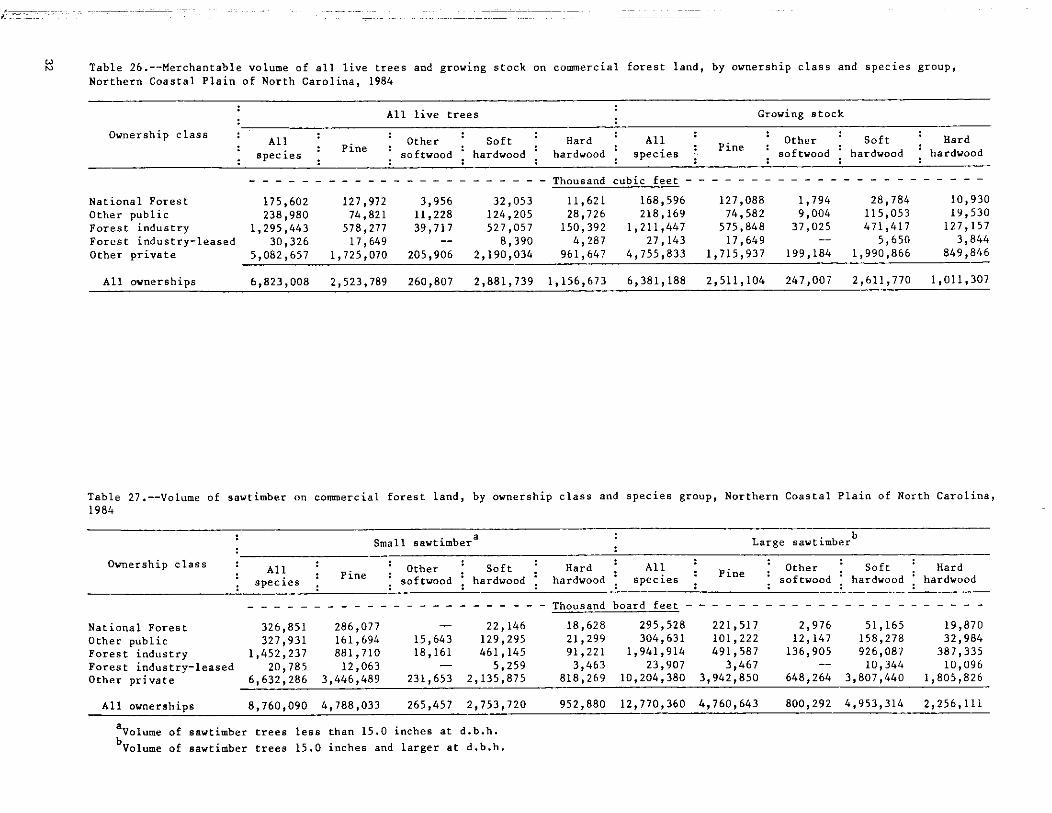
W N Table 26.--Merchantable volume of all live trees and growing stock on commercial forest land, by ovnership class and species group,
Northern Coastal Plain of North Carolina, 1984
All live trees Growing stock
Ownership class : : Other Soft Hard 1 I Pine :
Other : Soft 1 Hard I Pine : species . softwood hardwood : hardwood species . . softwood 1 hardwood : hardwood
- - - - - - - - - - - - - - - - - - - - - - - Thousand cubic feet - - - - - - - - - - - - - - - - - - - - - - - National Forest 175,602 127,972 3,956 32,053 11,621 168,596 127,088 1,794 28,784 10,930 Other public 238,980 74,821 11,228 124,205 28,726 218,169 74,582 9,004 115,053 19,530 Forest industry 1,295,443 578,277 39,717 527,057 150,392 1,211,447 575,848 37,025 471,417 127,157 Forest industry-leased 30,326 17,649 -- 8,390 4,287 27,143 17,649 -- 5,650 3,844 Other private 5,082,657 1,725,070 205,906 2,190,034 961,647 4,755,833 1,715,937 199,184 1,990,866 849,846
All ownerships 6,823,008 2,523,789 260,807 2,881,739 1,156,673 6,381,188 2,511,104 247,007 2,611,770 1,011,307
Table 27.--Volume of sawtimber on commercial forest land, by ownership class and species group, Northern Coastal Plain of North Carolina, 1984
Large sawtimber b
Small sawtimbera
Ownership class ' : All ' : Hard j All i Other j Soft . i Other Soft i Hard : Pine softwood hardwood : hardwood : species . : species . : softwood hardwood 1 hardwood
- - - - - - - - - - - - - - - - - - - - - - - Thousand board feet - - - - - - - - - - - - - - - - - - - - - - - National Forest 326,851 286,077 -- 22,146 18,628 295,528 221,517 2,976 51,165 19,870
Other public 327,931 161,694 15,643 129,295 21,299 304,631 101,222 12,147 158,278 32,984 Forest industry 1,452,237 881,710 18,161 461,145 91,221 1,941,914 491,587 136,905 926,087 387,335 Forest industry-leased 20,785 12,063 -- 5,259 3,463 23,907 3,467 -- 10,344 10,096 Other ~rivate 6,632,286 3,446,489 231,653 2,135,875 818,269 10,204,380 3,942,850 648,264 3,807,440 1,805,826
All ovnerships 8,760,090 4,788,033 265,457 2,753,720 952,880 12,770,360 4,760,643 800,292 4,953,314 2,256,111
'volume of sawtimber trees less than 15.0 inches at d.b.h. b~alume of sawtimber trees 15.0 inches and larger at d.b.h.
-f 1 "I0.0 N 1 CnN-3 - m n o
" " "7 "-
N

Table 30.--Volume of timber on commercial forest land, by class and species group, Northern Coastal Plain of North Carolina, 1984
1 pine Other Soft 1 Hard
Class of timber : species . : softwood : hardwood : hardwood
- - - - - - - - - - Thousand cubic feet - - - - - - - - - - - Sawtimber trees:
Saw-log portion 3,688,592 1,654,875 187,850 1,327,068 a
518,799 Upper-stem portion 808,876 218,851 23,041 394,500 172,484
Total 4,497,468 1,873,726 210,891 1,721,568 691,283
Poletimber trees 1,883,720 637,378 36,116 890,202 320,024
All growing-stock trees 6,381,188 2,511,104 247,007 2,611,770 1,011,307
Rough trees:
Sawtimber size 113,499 4,982 1,745 77,026 29,746 Poletimber size 206,618 7,370 -- 99,974 99,274
Total 320,117 12,352 1,745 177,000 129,020- -- Rotten trees:
Sawtimber size 112,562 333 11,881 86,180 14,168 Poletimber size 9,141 174 6,789 2,178 --
Total 121,703 333 12,055 92,969 16,346
Salvable dead trees:
Sawtimber size Poletimber size
Total 7,198 6,552 249 239 158
Total, all timber 6,830,206 2,530,341 261,056 2,881,978 1,156,831
a Includes cull sections in the saw-log portion.
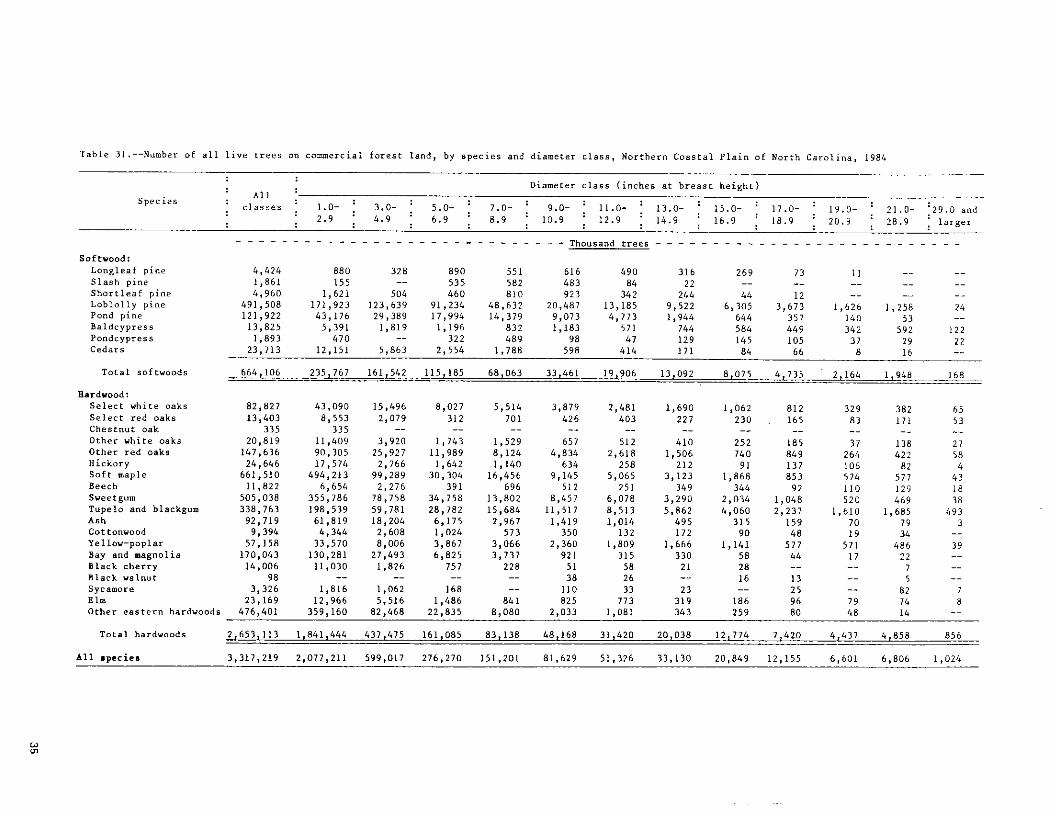
Table 31.--Number of all live trees oo commercial forest land, by species and diameter class, Northern Coastal Plain of North Carolina, 1984
Diameter class (inches a t breast height)
species All :
: classes : 1.0- : 3.0- 1 5.0- j 7.0- 1 9.0- 11.0- : 13.0- : 15.0- 17.0- 19.0- 21.0- :29.0and 1 2.9 : 4.9 6.9 8.9 10.9 : 12.9 : 14.9 : 6 9 18.9 20.9 28.9 larger
.--...--.-..--......-..-....- Thousand trees - - - - - - - - - . - - - - - - . - . . . . . . . . . Softvood: Longleaf pine 4,424 880 328 890 55 1 616 490 316 269 73 11 .. .. Slash pine 1,861 155 -. 535 582 483 84 22 -. -- -. .. .. Shortleaf pine 4,960 1,621 504 460 810 923 34 2 244 44 12 -- -. .. Loblolly pine 491,508 171,923 123,639 91,234 48,632 20,487 13,185 9,522 6,305 3,673 1,626 1,258 24 Pond pine 121,922 43,176 29,389 17,994 14,379 9,073 4,773 1,944 644 357 140 53 .. Baldcypress 13,825 5,391 1,819 1,196 832 1,183 571 744 584 449 342 592 122
.. Pondcypres~ 1.893 470 322 489 98 47 129 145 105 37 29 22 Cedars 23,713 12,151 5,863 2,554 1,788 598 414 171 84 6 6 8 16 -- Total softwoods 664,106 235,767 161,542 115,185 68,063 33,461 19>906 13,092 8,075 4,735 2,164 1,948 168
Bardwood: Select white oaks 82,827 43,090 15,496 8,027 5,514 3,879 2,481 1,690 1,062 812 329 382 65 Select red oaks 13,403 8,553 2,079 312 701 426 403 227 230 . 165
-. -- .. 83 -- ..
171 53 Chestnut oak 335 335 -. -- .. -. .- -. Other vhite oaks 20,819 11,409 3,920 1,743 1,529 657 512 410 252 185 3 7 138 27 Other red oaks 147,636 90,305 25,927 11,989 8,124 4,834 2,618 1,506 740 849 264 422 58 Hickory 24,646 17,574 2,766 1,642 1,140 634 258 212 9 1 137 106 82 4 Soft maple 661.510 494,213 99,289 30,304 16,456 9,145 5,065 3,123 1,868 853 574 577 43 Beech 11,822 6,654 2,276 391 696 512 251 349 344 92 110 129 18 Sveetgum 505,038 355,786 78,758 34,758 13,802 8,457 6,078 3,290 2,034 1,048 520 469 38 Tupelo and blackgum 338,763 198,539 59,781 28,782 15,684 11,517 8,513 5,862 4,060 2,237 1,610 1,685 493 Ash 92,719 61,819 18,204 6,175 2,967 1,419 1,014 495 315 159 70 79 3 Cottonvood 9.394 4,344 2,608 1,024 573 350 132 172 90 48 19 34 .. Yellow-poplar 57,158 33,570 8,006 3,867 3,066 2,360 1,809 1,666 1,141 577 571 48 6 39 Bay and magnolia 170,043 130,281 27,493 6,825 3,737 921 315 330 58 44 17 2 2 -- Black cherry 14,006 11,030 1,826 757 228 51 58 2 1 28 .- -. 7 .. Black walnut 98 -- -. -. 38 26 -- I6 13 -. 5 .- -.
Sycamore 3,326 1,816 1,062 168 -. 110 33 23 -- 25 -- 82 7 Elm 23,169 12,966 5,516 1,486 84 1 825 773 319 186 96 79 74 8 Other eastern hardwoods 476,401 359,160 82,468 22,835 8,080 2,033 1,081 343 259 80 48 14 -- Total hardwoods 2,653,113 1,841,444 437,475 161,085 83,138 48,168 31,420 20,038 12,774 7,420 4,437 4,858 856
A11 npecie. 3,317,219 2,077,211 599,017 276,270 151,201 81,629 51,326 33,130 20,849 12,155 6.601 6,806 1,024
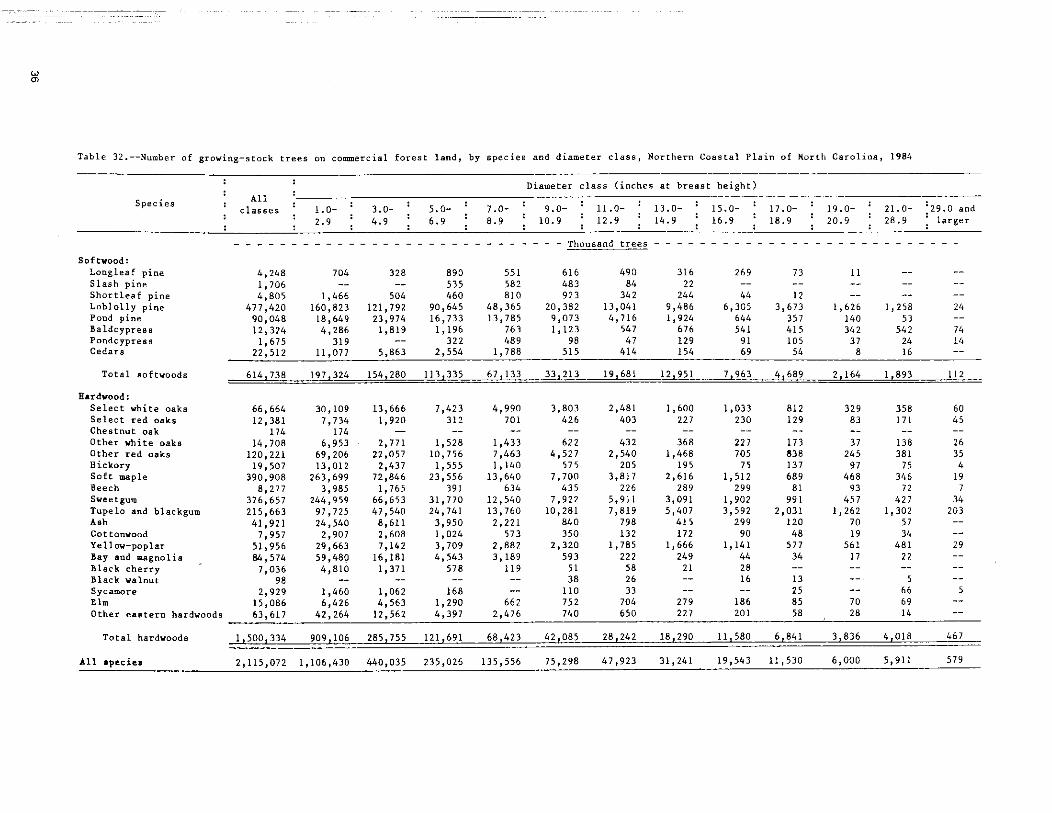
Table 32.--Number of growing-s~ock trees on commercial forest land, by species and diameter class, Northern Coastal Plain of North Carolina, 1984
Diameter class (inches at breast heighr) : All : Species
classes 1.0- ' 3.0- f 5.0- f 7.0- j 9.0- 11.0- 13.0- i 15.0- j 17.0- i 19.0- i 21.0- i29.0and 2.9 : 4.9 : 6.9 : 8.9 : 10.9 1 1 2 . 9 : 14.9 1 1 6 . 9 : 18.9 1 2 0 . 9 : 2 8 . 9 :larger
- - - . . . - - . . . - . . . . . . . - . . - - - - . . - ~ o u b a n d t rees---------.........-..------
Softvood: Loogleaf pine 4,248 704 328 890 551 616 490 316 269 7 3 I1 -. -- Slash pine 1,706 -- -- 535 582 483 84 22 -. -. -- .. .-
Shortleaf pine 4,805 1,466 504 460 810 923 34 2 244 44 12 -. -- -.
Loblolly pine 477,420 160,823 121,792 90,645 48,365 20,382 13,041 9,486 6,305 3,673 1,626 1,258 24 Pond pine 90,048 18,649 23,974 16,733 13,785 9,073 4,716 1,924 644 357 140 53 .- Baldcypress 12,324 4,286 1,819 1,196 763 1,123 547 676 541 415 342 542 74 Pondcypress 1,675 319 -- 322 489 98 47 129 9 1 105 37 24 14 Cedars 22,512 11,077 5,863 2,554 1,788 515 414 154 69 54 8 16 --
Total aoftvoods 614,738 197,324 154,280 113,335 67.133 33,213 19,681 12,951 7,963 4,689 2,164 1,893 112
Eardvood: Select white oaks Select red oaks Chestnut oak Other white oaks Other red oaks Eickory Soft maple Beech Sweetgum Tupelo and blackgum Ash Cottoowood Yellov-poplar Bay and magnolia Black cherry Black walnut Sycamore Elm Other eastern hardvooda
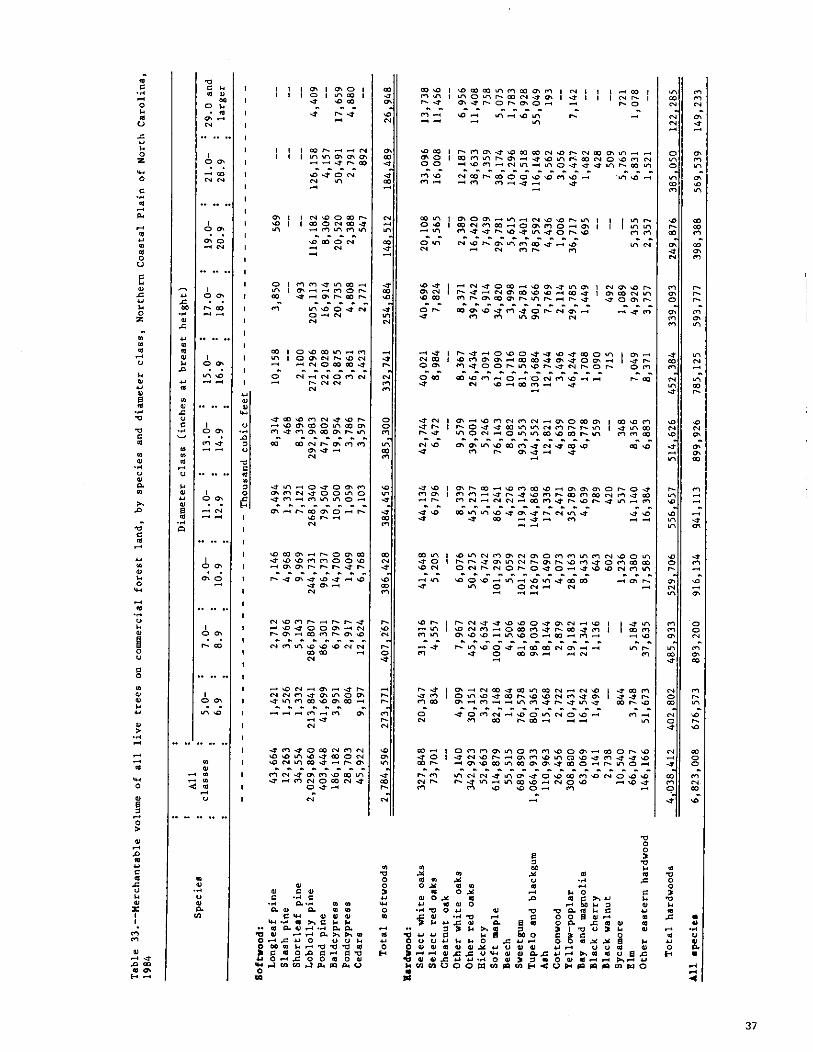
- U m a C I N U a C " - a m m o v , m m * N I m - 0 o N n N - m O m m l m a o ." n u n m m m C n d n t r - o ~ ~ m n n ~ n ~ ~ n ~ ~ m m
P m o ~ - o n n m a m n m n n m - - - - - - - - - - - - .
m U - N O m m m a m ~ u ~ * m a * 0 C m * - U m a N
a 4
m
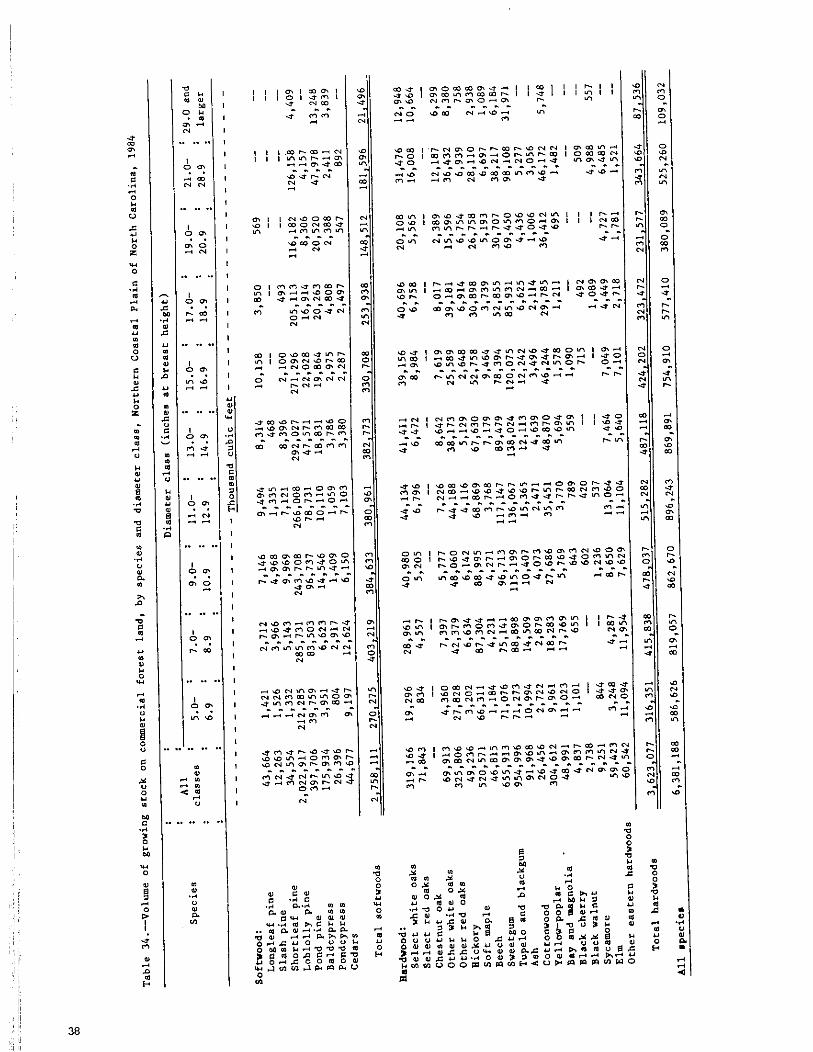
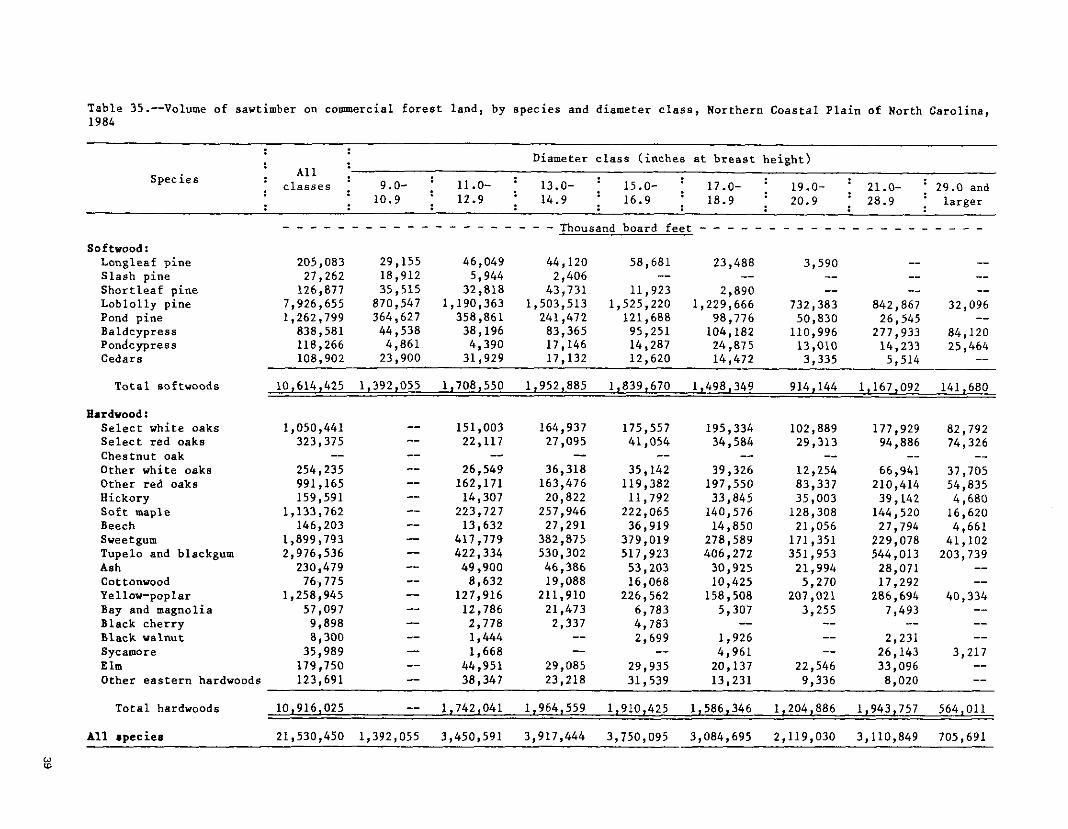
Table 35.--Volume of savtimber on commercial forest land, by species and diameter class, Northern Coastal Plain of North Carolina, 1984
Diameter class (inches at breast height)
Species : All : 9.0- . : classes . 11.0- 13.0- 15.0- 17.0- 19.0- 21.0- :29.0and 10.9 12.9 14.9 16.9 18.9 20.9 28.9 ' lareer
. . . . . . . . . . . . . . . . . . . . Thousand board feet - - - - - - - - - - - - - - - - - - - - - Softrood: Longleaf pine 205,083 29,155 46,049 44,120 58,681 23,488 3,590 -- -- Slash pine 27,262 18,912 5,944 2,406 -- -- -- -- -- Shortleaf pine 126,877 35,515 32,818 43,731 11,923 2,890 -- -- -- Loblolly pine 7,926,655 870,547 1,190,363 1,503,513 1,525,220 1,229,666 732,383 842,867 32,096 Pond pine 1,262,799 364,627 358,861 241,472 121,688 98,776 50,830 26,545 -- Baldcypress 838,581 44,538 38,196 83,365 95,251 104,182 110,996 277,933 84,120 ~ondc~~ress 118,266 4,861 4,390 17,146 14,287 24,875 13,010 14,233 25,464 Cedars 108,902 23,900 31,929 17,132 12,620 14,472 3,335 5,514 --
Total softwoods 10,614,425 1,392,055 1,708,550 1,952.885 1,839,670 1,498,349 914,144 1,167,092 141,680
Bardrood: Select white oaks 1,050,441 -- 151,003 164,937 175,557 195,334 102,889 177,929 82,792 Select red oaks 323,375 -- 22,117 27,095 41,054 34,584 29,313 94,886 74,326 Chestnut oak -- -- -- - -- -- -- -- -- Other white oaks 254,235 -- 26,549 36,318 35,142 39,326 12,254 66,941 37,705 Other red oaks 991,165 -- 162,171 163,476 119,382 197,550 83,337 210,414 54,835 Eickory 159,591 -- 14,307 20,822 11,792 33,845 35,003 39,142 4,680 Soft maple 1,133,762 -- 223,727 257,946 222,065 140,576 128,308 144,520 16,620 Beech 146,203 -- 13,632 27,291 36,919 14,850 21,056 27,794 4,661 Sweetgum 1,899,793 -- 417,779 382,875 379,019 278,589 171,351 229,078 41,102 Tupelo and blackgum 2,976,536 - 422,334 530,302 517,923 406,272 351,953 544,013 203,739 Ash 230,479 -- 49,900 46,386 53,203 30,925 21,994 28,071 -- Cottonwood 76,775 -- 8,632 19,088 16,068 10,425 5,270 17,292 -- Yellow-poplar 1,258,945 127,916 211,910 226,562 158,508 207,021 286,694 40,334 Bay and magnolia 57,097 -- 12,786 21,473 6,783 5,307 3,255 7,493 -- Black cherry 9,898 -- 2,778 2,337 4,783 -- -- -- -- Black walnut 8,300 - 1,444 -- 2,699 1,926 -- 2,231 -- Sycamore 35,989 - 1,668 -- -- 4,961 -- 26,143 3,217 Elm 179,750 -- 44,951 29,085 29,935 20,137 22,546 33,096 -- Other eastern hardwoods 123,691 -- 38,347 23,218 31,539 13,231 9,336 8,020 --
Total hardwoods 10,916,025 -- 1,742,041 1,964,559 1,910,425 1,586,346 1,204,886 1,943,757 564,011
A11 mpecies 21,530,450 1,392,055 3,450,591 3,917,444 3,750,095 3,084,695 2,119,030 3,110,849 705,691
W LO
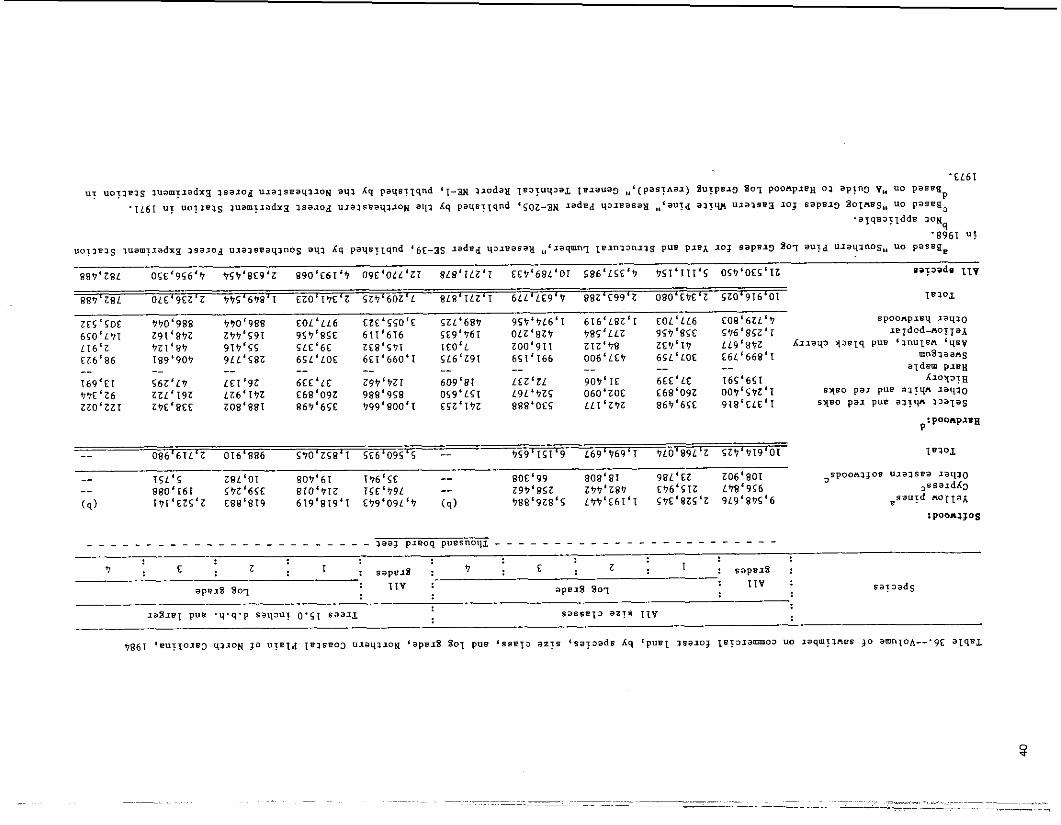
'CL61 uy uoyaeas auamyxadxa asaxod uaaaseaqaloN aqa Xq paqsy~qnd ~ I -W alodag Te>?uq,ag Tezaua3 ,,'(pasynaz) Suypex3 807 poonple" oa apln3 y,, uo pass% P
'IL61 U? O O ? ~ B ~ S auamyladxa asazod ulaassaqaloN aqa bq paqsy~qnd ' S ~ Z - ~ N laded qaxeasaa ,,'aura aarlyl usaasea 302 sapex3 %a~ne~,, uo pasag .a~qeJyIdd~ a o ~ q
'8961 U?
uoyaeas auamr~adaa >sarod ulaaseaqanog aqa bq paqsy~qnd '6~-as laded qJleaoag ,,'xaqmn~ 1 e m a ~ n 3 a s pun plea lo3 saps13 Boy auyj ulaqanog,, uo passg*
889'ZBL OSE'9S6'h f59'8C9'Z 890'~61'V O~C'OLL'ZI 8L8'1LZ6T CEf168L'OI 586'LSC"7 h51'111'5 05h'OES'IZ sa).~ads 1 1 ~
88hgZ8L 0LC'9CZ1Z hfS'698'1 EZO'IVE'Z SLCL60Z'L 8~8'1L~'l ~ L L ' L E ~ ' ~ 88ZLC99'Z 080'CCCLZ SZ0'916'01 1eaoz
ZCS'SOC fh06988 '7'70'988 COL1LL6 Ezc'ESO'C SZL'68b 95'7'9L6'1 616'~8~'1 COL ' L L ~ C O ~ ' ~ L L ' ~ spoonpxeq xaqao
650'LfI Z9I18'?Z ~9'1'591 9St18SE 611'616 5~9'961 0L2'8~9 ' 7 8 s ' ~ ~ ~ ~E?'~SC 5'76'851'1 xeldod-no~~ax
L16'Z 9~1'8'l 919'55 SLC'6C ~ ~ 8 ' 5 9 1 ICO'L Z00'911 ZIZ"i8 ZEV'IV LLg18hZ bzlaq~ y a e ~ q PUB 'anu~en 'qey CZ6'86 189'909 9LL'58Z 6SL6LOE 6CT1660'I ~ ~ 6 ' 2 9 1 651'166 006'LE9 6 5 ~ ~ ~ 0 ~ ~ 6 ~ ~ 6 6 8 ' 1 mn8aaang -- -- -- -- -- -- -- -- -- -- a ~ d e m p x a ~ 169'FT S6Z1Lh LCI19Z 6CC'LC Z9C6hZ1 609'81 LCZ'ZL 909'IC 6CC6LC 165'651 b l o y m ~ thE'Z6 ZZLL19Z ~Z6'1fZ C68'09Z 988'958 059'LSl L9L1fZ5 060'ZOC C68'092 0O'I'S'lZ'I syeo pal pus aayqn zaqao
ZZO'ZZI ZVCL8CC ~08'881 869'6SC 999'800'1 CSL'I~Z 888'0~5 LLI'z~z 86h165C 918'~LC'l syso pax pue aalqn a3a~as
- - - - - - - - - - - - - - - - - - - - - - - - 2aaJ pxeoq puesnoqs - - - - - - - - - - - - - - - - - - - - - - - - 9 . : c . : I ; : s a p s ~ ~ 1 9 . c : : . z ; 1 I sap ax^ ;
apex% 207 : 1IV : aps1.9 80.1 : 1IV : say~ads
la%xa~ pup .q'q'p saqaur 0.51 s a a q s a s s s ~ ~ azys 11y
9861 'eur~01e3 q a x o ~ 30 uyeld Ieaseo3 uxaqaxo~ 'apex2 301 pus LsseI> azls 'say3ade bq #pus1 asam* Isy>xammo> uo zaqmyanes j o amnToh--.gc alqag
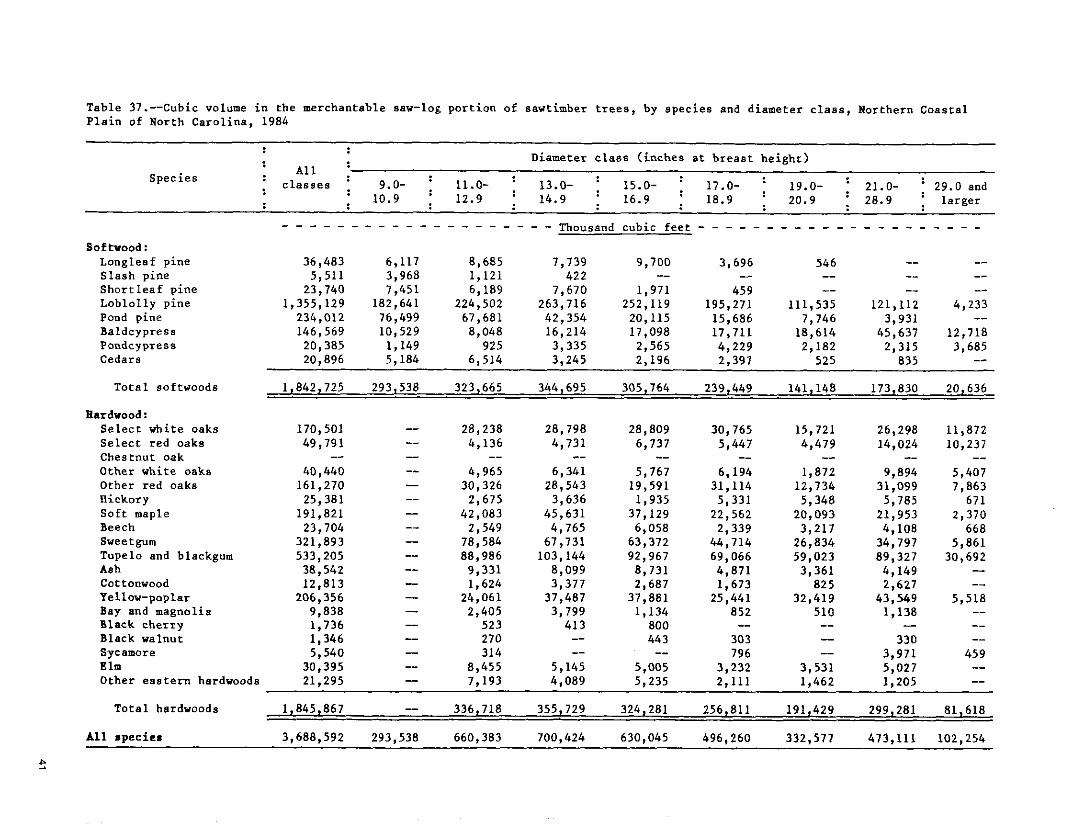
Table 37.--Cubic volume in the merchantable saw-log portion of sawtimber trees, by species and diameter class, Northern Coastal Plain of North Carolina, 1984
-- - - -- -
Diameter class (inches at breast height)
Species : All : : classes : 9.0- : 11.0- : 13.0- 15.0- : 17.0- j 19.0- 21.0- j29.0and : 10.9 : 12.9 : 14.9 : 16.9 : 18.9 : 20.9 : 28.9 larger
- - - - - - - - - - - - - - - - - - - - Thousand cubic feet - - - - - - - - - - - - - - - - - - - - - Softvood: Longleaf pine 36,483 6,117 8,685 7,739 9,700 3,696 546 -- -- Slash pine 5,511 3,968 1,121 422 -- -- -- -- -- Shortleaf pine 23,740 7,451 6,189 7,670 1,971 459 -- -- -- Loblolly pine 1,355,129 182,641 224,502 263,716 252,119 195,271 111,535 121,112 4,233 Pond pine 234,012 76,499 67,681 42,354 20,115 15,686 7,746 3,931 -- Baldcypress 146,569 10,529 8,048 16,214 17,098 17,711 18,614 45,637 12,718 Pondcypress 20,385 1,149 925 3,335 2,565 4,229 2,182 2,315 3,685 Cedars 20,896 5,184 6,514 3,245 2,196 2,397 525 835 -- Total softwoods 1,842,725 293,538 323,665 344,695 305,764 239,449 141,148 173,830 20,636
Eardvood : Select white oaks 170,501 28,238 28,798 28,809 30,765 15,721 26,298 11,872 Select red oaks 49,791 -- 4,136 4,731 6,737 5,447 4,479 14,024 10,237 Chestnut oak -- - -- -- -- - -- -- -- Other vhite oaks 40,440 -- 4,965 6,341 5,767 6,194 1,872 9,894 5,407 Other red oaks 161,270 - 30,326 28,543 19,591 31,114 12,734 31,099 7,863 Rickory 25,381 -- 2,675 3,636 1,935 5,331 5,348 5,785 671 Soft maple 191,821 - 42,083 45,631 37,129 22,562 20,093 21,953 2,370 Beech 23,704 -- 2,549 4,765 6,058 2,339 3,217 4,108 668 Swee tgum 321,893 -- 78,584 67,731 63,372 44,714 26,834 34,797 5,861 Tupelo and blackgum 533,205 - 88,986 103,144 92,967 69,066 59,023 89,327 30,692 Ash 38,542 -- 9,331 8,099 8,731 4,871 3,361 4,149 -- Cottonvood 12,813 - 1,624 3,377 2,687 1,673 825 2,627 -- Yellow-poplar 206,356 - 24,061 37,487 37,881 25,441 32,419 43,549 5,518 Bay and magnolia 9,838 - 2,405 3,799 1,134 852 510 1,138 -- Black cherry 1,736 - 523 413 800 -- -- -- -- Black valnut 1,346 270 -- 443 303 - 330 -- Sycamore 5,540 - 314 -- -- 796 -- 3,971 459 Elm 30,395 -- 8,455 5,145 5,005 3,232 3,531 5,027 -- Other eastern hardwoods 21,295 - 7,193 4,089 5,235 2,111 1,462 1,205 --
Total hardvoods 1,845,867 - 336,718 355,729 324,281 256,811 191,429 299,281 81,618
A11 species 3,688,592 293,538 660,383 700,424 630,045 496,260 332,577 473,111 102,254
f:

I I I - f l O N I O , , ' g l - " ' 1" m
" - 7
* 2" " n
I , - o n m u m 1 I , * " m o m n n r r n o 1 - - - - - " - * o n - - Y O
* N
n , , n n O " m n 1 I m * u m n o 9 **Om"- m - - -
o m * - m n N O -.
n I C m O N - C O 0 IY1Nmm"n n n lnmnoorr n - - - - - - 1 OrnYlOO m
",IN N m N
* t Q n m N - 3 - O O I C C O O - O "
n n n n o m m - - - - - - - ... N10n"nn m - O N * C o n
O r O m O n U O m m N m * - h m n 0 n n n . O m n C N * - - - - - - - - 01 0 N U V V U 0
""7- U n I
0 - N - N m N U 0 O.N",O...O"?N N C n * C 0 m n m O - - - . . - - - - - 0 - " 3 C - N - m N
o m - ,, * Q
......... O N n m N U O O m N C O m n N m 0 m - . - - - - - - - m n 4 L " n m - m N -... "
N - I
. O n O m * n C n ,,,*,nmn ;: C I C N C n C O N * - - " - - - * - - n * O O * m u m C
"0 - m " - -3
......... d O - m C u O O 0 ......... - - - - " - " - * NN-ICIOO4-3 n
0" - m m n
N m , , , O m n m O * " , N , l , O " l m N I N O O " , O N 0 O , N , l l m * I ........... - - - - - - - - m 1
C, m u orr-n m - - * - P m , * - m n r O C n N . . . n N a m n . . . m n , m m n O * m N " 1 n * m 0 O n N 00 o O m C m - - O n * C * O C O m - - " - " - - - - - - - " - - - - m n m m a n a - C n - 4 - O m - u - - * * - * u Y1 *
n n ~ ~ m m - ~ o ~ u - ~ n ! t , o n n O I O O C n N ~ Q m m O U 1 1 1 O 9 m m m ~ m m o - m o - ~ m - " - - - - - " " " - - N m - - U O N o m n C m m n l - O N N N m 111- *
Q ' I n N n O N " C m O C m I 1 O n O n N I O " , O m C U O ~ C O n , m h m C N C 1 " n m m n m 0 * Q C n N C n - - - ............. 00 O P m - Q N N m N n - - a * m - a u O = n
* O , m C , , N h - C - m C N n N , m O . . . m I m m C O n m N - C C C O n , m N 00 * m C O N * C O O O O N m N - - - - - - - - - - - - - - - - - m - O N ~ n n ~ - * * - N - * - - m r.1019- .n - E:
* m I * O O m " N 1 - m " n 0 1 0 O m d O l m n n O O C - n n o C O l * m - n m - - q o q - o ~ q m u a - a em-q - - - - - " - - m r N m O N 0 C m U " n m m m . - * m..... * d
n , , , O m N m O * O n O - n C O h N m m n l m h - h o o m N ~ C m N o n n r - * m ~ n m n * o n m m o a n ~ y - . - - - - - - - - - - - - n m o r o u n m - 0 ~ 0 ~ 1 O 0 n 4 " 2 2"" * - N
* O , N N N O * C O C m O N N * O o ~ C n l * m m N - C O C m n - . C n O O m m n m - u o ~ o n n m o * r r ~ n n - - - - - - - - * m e - - - - - N, C n m * O O m m u ~ p - - N " O N N n I - N ... ::;:2d%2429E1%:11:f - m ",mccm"m""m..* q? - - - - - . . - - - - - - - - * n O - m r n - c N O N r - O O 22" n .... ..
4
C O l O n m n m m N O m m n n l C n O m ~ t - m m n m - o - o n o n ~ - - m 03 N u " - C 4 m " m " O - .............. 94% 04 C C ~ D - U D N ~ Q U - - n m ?. I " "-N - N C - - 4
O " , m m N O C m O N , , O N n , C O * NC,m...-Onm*mCmn-.lOC- 9% O-U---C-~"--Y;Y--? m m" - - .. z N 1nnNnn-Urn...CN
m n m m N m . X % : Z Z S 2 2 Z X Z 2 2 2 % 1 6 2 : :q m - ~ m o o 1 u n o r 0 n o r - - - - - - - - - - - - - - O N N N " U - I " O - C - n N O
N * C"4 ", m - P E R Z 4 2 2 Z 2 Z 2 ' 2 Z 6 2 Z P I 2 00 O O * ~ - N m m C u m O N q * ~ - - - .................. *m O O C 1 C O - c m C n " - m e * -a 0- o n - "- - - n .. 4 -
m v
E 0 -
1 m 0 - rn E .a ... 0 w U
C u M
Z w 0
C .+ a 4 * z u
" U
C
k * 0 - : 4 3
V
* s u a
4 .4
TI
TI
5 2 .* " u P rn
X P
TI
4 ... u m u L w - * ." " ,.
[ g .a w
u
- C * a s M o * . ?d m... N ...... O h . . ...m N N
...... 34 m o - N
...... o m . . C m - -
^ . . . . . . I
9": 2 2 ......I
o m . . 2: " " "
1 o m . . "N - - ......
V I
3": 0"
......, o m :< ...... 9": m a
...... o m G i
...... o m . . - N
..........
u 6 , C u m 9
:: C , P '
Y
", u 5 C . ... w m * 3 " "
."
I
I
I
, I
8
I
' !
, 1
,
' 8
1
" a w " .d P 1 " v m ; i:
1
4
, I
I
, 3
8
, I
I
, I
.i d
4 - 0
M
4 d 0 > " m .# 0 e.
I.
m m
u + P "
* * < 2
..........
u s .+ " a P m
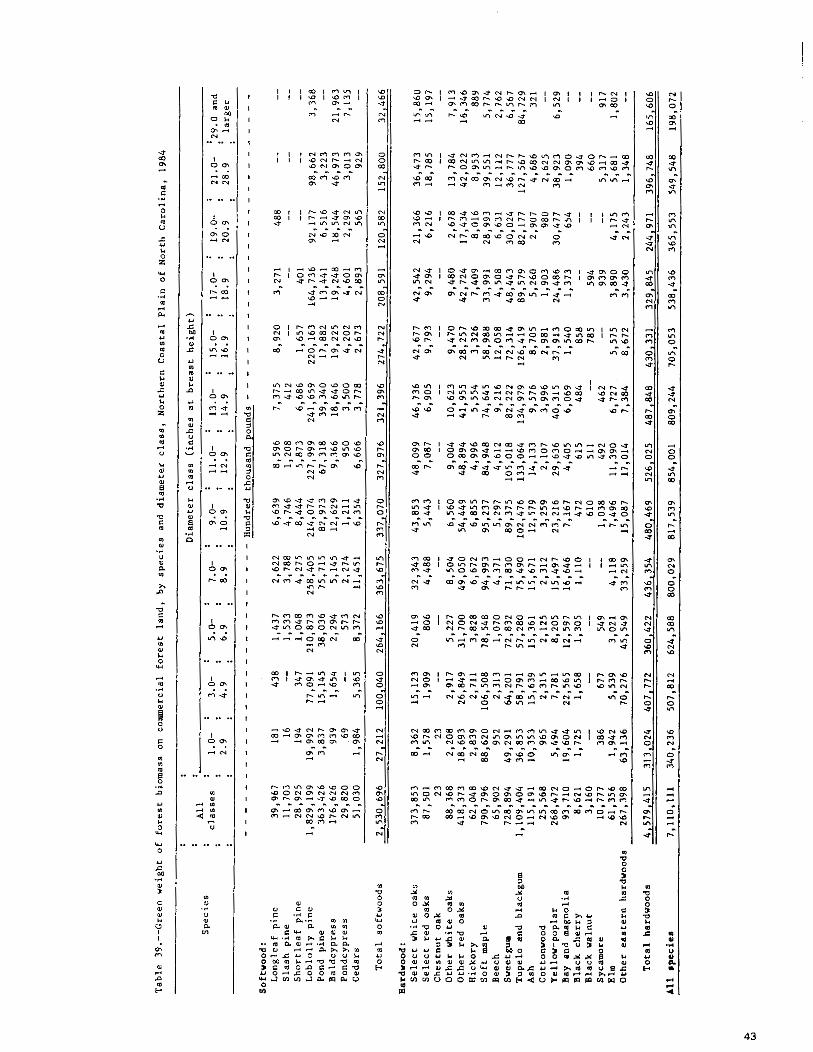
1 1 1 g 1 2 2 1 2 n a - -7 - - - n I-
N n
8 I ! n n o n m 0 I I I ON,.-?.
0 N a O m g - - - - m 0 0 n N m u ... -
O C l n o m - f N ~ m - I m , , I " N , O N ~ ~ ~ - U ~ C O O ~ N I ~ ~ ~ ~ - ~ V o - m - m o m - - n - n , - - - - - - - - m y q q in"- - 0 n w 0 - f o - - - m
- n m 0 m - -
~ ~ I U N O - N - C O Y I ~ O U O C - m - m ~ m ~ m n - - ~ m n ~ m m ~ - m ~ m m u - - o ~ " , - - ~ O , m O n O n , n 2 : - - - .02 nr;m-a~o;;,;;: ,,- .o 2 n - 3 - 7 "..ON n m *
n 0
4 " 2 g " ~ z ~ ; g p - 2 ; t bnn - o
"" 0 - 7 0 m 0 o - m m U O "" : 2 I - - - - _ - _ _ _ _
- 0 N - m m 0 O N N o - - . "
N - N O m n U N -7 "7
2 :
N Q I O - 7 P - m O m O n O n l U m O O 0 O u m t m ~ o m o ~ - 0 o m r 1 m n m n n~ U - U ~ ~ U ~ N ~ Q O * m m - g u m u n - "
N m o?N;;;m-h;:;; U * n u m n
n n m m N n n 6"
- o t o - o m m u m n - n o m , ~ m ~ - n h m l - n N m " , - - O m - U . . . 1 0 l - r .. .................. - - N m o?dn-m-NNOm-N;; "10 - - 0 . 0 -7 N Y I - C N n - 0 0 * C
0 w n n u n - w m 0 a ~ m u l ~ ~ u n o , N n n . , - w h h m 4 e m m . ..... ................... - - 0 0 d:;;,,;,,dd Or. - - - - m - u - u - m n u - m 0
v m
m - I U - 7 0 m N m u n - 0 n " ? - N O u .. m m ~ o m m u - - ~ n o n o - - m m - N o 0 0 o m m m 0 0 0 - - 0 * 0 n u n o o m; o?m;;;,-n-;;h; - - . . . O . 0 u U .... * m 0 - 3 N - - YI m
" O t O m n C ~ m O m m O r N o m O h m m , U I O * " ? n m - h C . . . - " , - - n m m .. .................... .. " - O;dm'mhN-N;rr-- ... d ; - - " u "7 m - 0 - N .- d m - * m
n m l Q O N " , - 0 0 - N C Q O I l m m U m l O - - m - n m - - m < - t l ~ , 2 R ?4 ~ o ~ m ~ m u o o u o - - N n 0 - - N U m - m - - - - - * 2 d n * m - - - - * 0 0 0 * m
m a t - o m m o N o - n n - m l m - m N . - 0 1 N O N V r O m O N 0 0 0 1 U N U N m .......Om...... "0-Y .. 0 < . 6 .. N .... ... d ; N ...... I O N
n o
l % l Z $ Z S 2 S 2 : 2 2 2 : l E k : = 2 ................... - - - - _ - * _ - _ _ - _ _ .................. - - - - * N 0 e m - N .. - - 0 0
:::zZ:::22222Z2l%;: 2 : nn ~ o m o m w m n m * o r n m - o N - - - - - - - - - - - - " - . - m - ~ m ~ m 0 - 0 n o - - n n o - m en.. - - : x
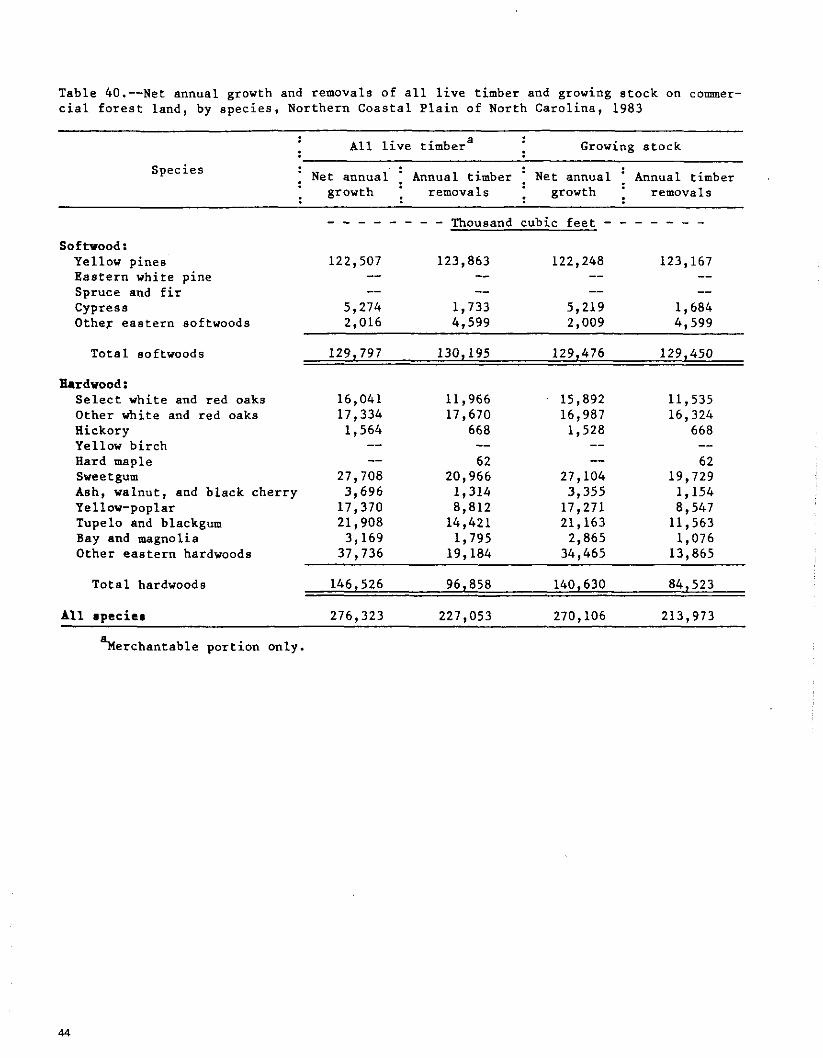
Table 40.--Net annual growth and removals of all live timber and growing stock on commer- cial forest land, by species, Northern Coastal Plain of North Carolina, 1983
All live timbera Growing stock
Species . . : Net annual : Annual timber Net annual : Annual timber growth I removals growth : removals
- - - - - - - - Thousand cubic feet - - - - - - - Softvood: Yellow pines 122,507 123,863 122,248 123,167 Eastern white pine -- -- -- -- Spruce and fir -- -- -- -- Cypress 5,274 1,733 5,219 1,684 Other eastern softwoods 2,016 4,599 2,009 4,599
Total softwoods 129,797 130,195 129,476 129.450
Hardwood : Select white and red oaks 16,041 11,966 15,892 11,535 Other white and red oaks 17,334 17,670 16,987 16,324 Hickory 1,564 668 1,528 668 Yellow birch -- -- -- -- Bard maple -- 62 -- 62 Sweetgum 27,708 20,966 27,104 19,729 Ash, walnut, and black cherry 3,696 1,314 3,355 1,154 Yellow-poplar 17,370 8,812 17,271 8,547 Tupelo and blackgum 21,908 14,421 21,163 11,563 Bay and magnolia 3,169 1,795 2,865 1,076 Other eastern hardwoods 37,736 19,184 34,465 13,865
Total hardwoods 146,526 96,858 140,630 84,523
A11 apeciem 276,323 227,053 270,106 213,973
%erchantable portion only.
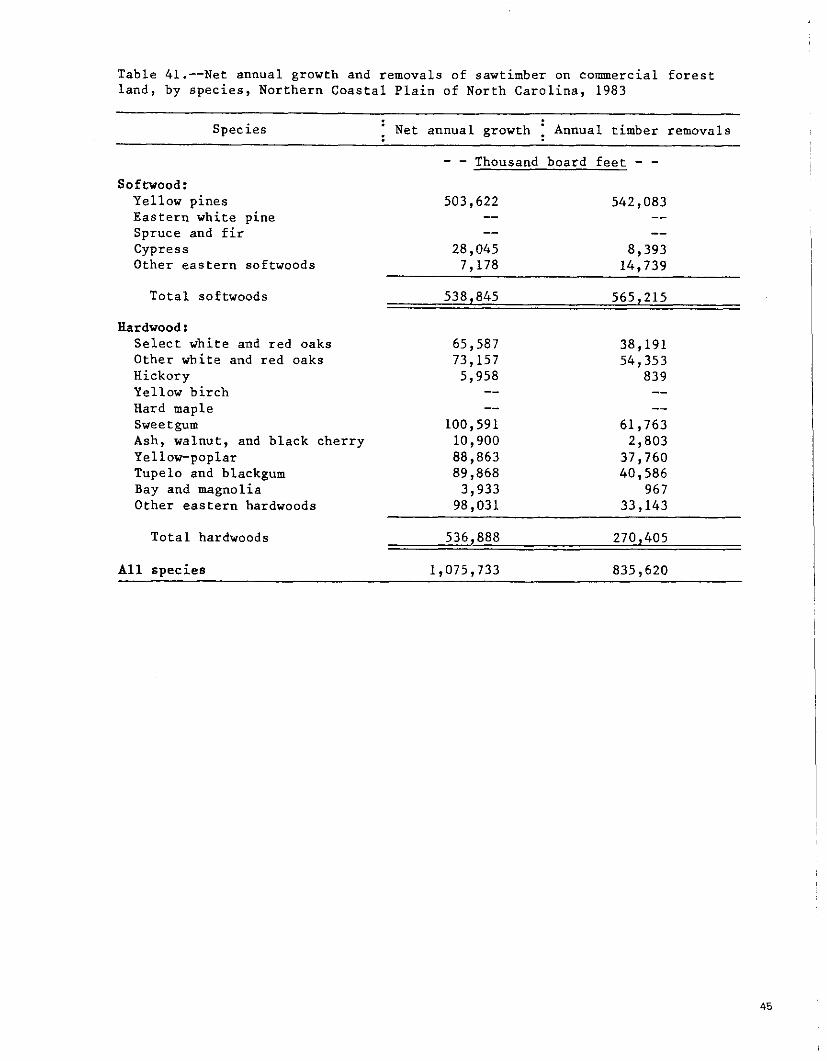
Table 41.--Net annual growth and removals of sawtimber on commercial forest land, by species, Northern Coastal Plain of North Carolina, 1983
Species : Net annual growth : Annual timber removals - - Thousand board feet - -
So£ mood: Yellow pines 503,622 542,083 Eastern white pine -- -- Spruce and fir -- -- Cypress 28,045 8,393 Other eastern softwoods 7,178 14,739
Total softwoods 538,845 565,215
Hardwood : Select white and red oaks 65,587 38,191 Other white and red oaks 73,157 54,353 Hickory 5,958 839 Yellow birch -- -- Hard maple -- -- Sweetgum 100,591 61,763 Ash, walnut, and black cherry 10,900 2,803 Yellow-poplar 88,863 37,760 Tupelo and blackgum 89,868 40,586 Bay and magnolia 3,933 967 Other eastern hardwoods 98,031 33,143
Total hardwoods
All species 1,075,733 835,620
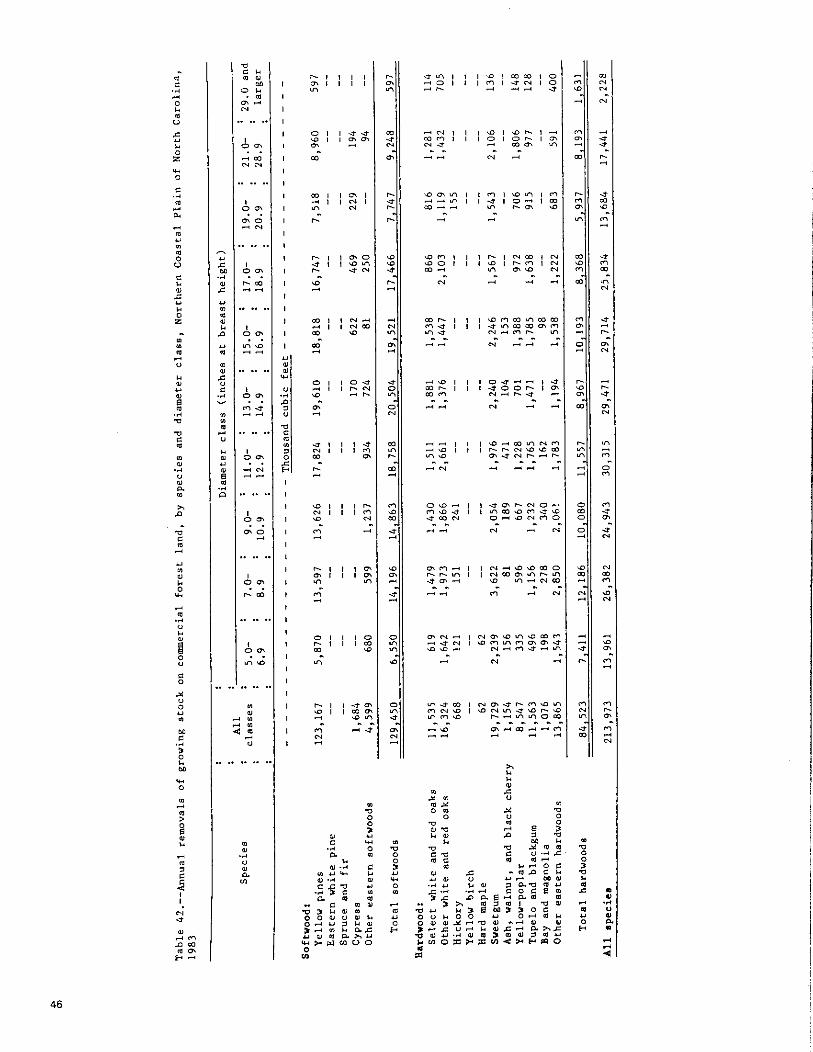
- 0
; Y : u
.A Q '2
.d mu". E a .LI
.. C m u - 5 * w - O O U U U * O r r u 3 * ol
rr m C P C z . . P X Y W ~ W O ~ V O 0 V1

Table 43.--Mortality of all live timber, growing stock, and saw- timber on commercial fore.st land, by species, Northern Coastal Plain of North Carolina, 1983
All live ' Growing ' Species timbera : Sawtimber stock .
Thousand cubic feet Thousand -------------- board feet
Softwood: Yellow pines 26,203 25,797 71,624 Eastern white pine -- -- -- Spruce and fir -- -- -- Cypress 474 474 1,058 Other eastern softwoods 565 507 1,636
Total softwoods 27,242 26,778 74,318
Bardwood: Select white and red oaks 1,536 1,439 3,558 Other white and red oaks 3,473 2,844 6,421 Hickory 74 -- -- Yellow birch -- -- -- Hard maple -- -- -- Sweetgum 2,186 1,418 3,377 Ash, walnut, and black cherry 904 207 -- Yellow-poplar 535 535 1,097 Tupelo and blackgum 3,402 1,266 3,958 Bay and magnolia 797 527 574 Other eastern hardwoods 9,688 5,004 11,719
Total hardwoods 22,595 13,240 30,704
All species 49,837 40,018 105,022
anerchantable portion only.
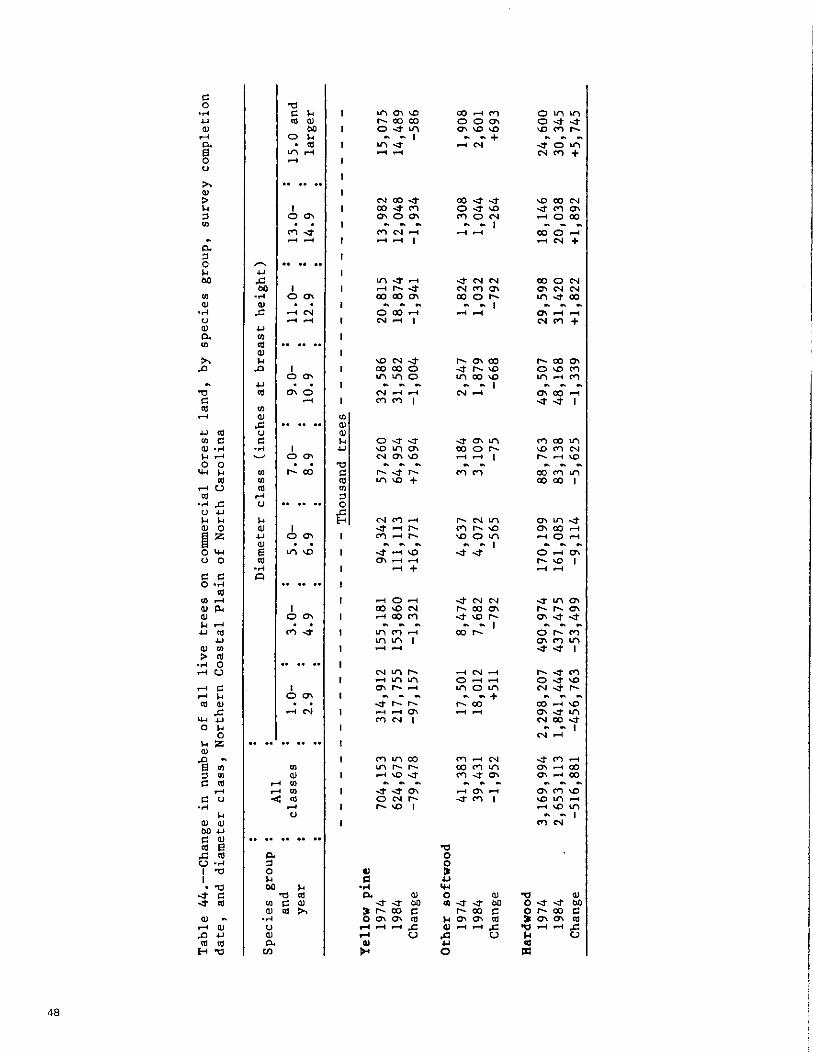
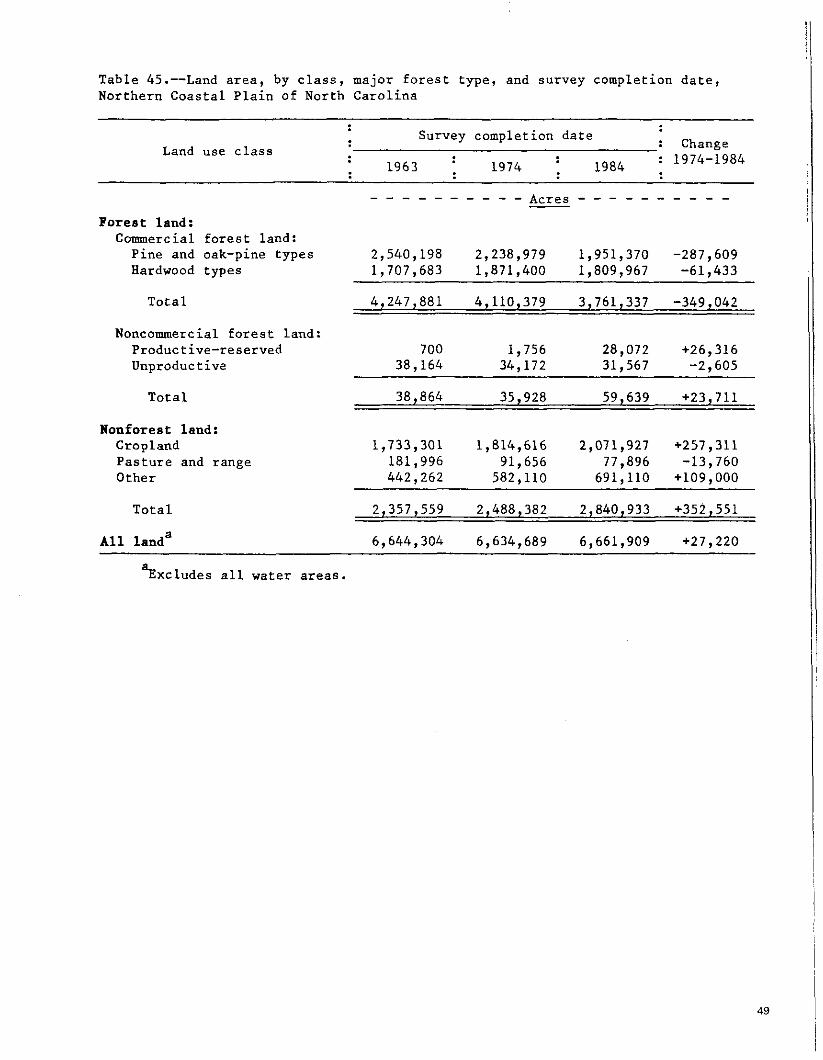
Table 45.--Land area, by class, major forest type, and survey completion date, Northern Coastal Plain of North Carolina
Survey completion date : Change
Land use class 1963 1974 : : 1974-1984 1984 .
Forest land: Commercial forest land: Pine and oak-pine types 2,540,198 2,238,979 1,951,370 -287,609 Hardwood types 1,707,683 1,871,400 1,809,967 -61,433
Total
Noncommercial forest land: Productive-reserved 700 1,756 28,072 +26,316 Unproductive 38,164 34,172 31,567 -2,605
Total 38,864 35,928 59,639 +23,711
Wonforest land: Cropland Pasture and range Other
Total
All landa 6,644,304 6,634,689 6,661,909 +27,220
'~xcludes all water areas.

a Table 46.--Volume of sawtimber, growing stock, and all live timber on commercial forest land, by species group, survey completion date, and diameter class, Northern Coastal Plain of North Carolina
Species 1 Diameter class (inches at breast height) - All : group : and . classes 1 5.0- 7.0- 1 9.0- 11.0- 1 13.0- 15.0- 1 17.0- 1 19.0- : 21.0 and year . 8.9 10.9 1 12.9 1 14.9 16.9 1 18.9 1 20.9 1 6.9 . larger
SAWIUBKE (in thousand board feet)
Softwood 1963 11,548,678 -- -- 1,520,255 2,209,378 2,442,302 2,143,046 1,436,031 784,005 1,013,661 1974 10,902,517 -- -- 1,461,457 1,943,507 2,281,079 2,076,974 1,423,570 789,077 926,853 1984 10,614,425 -- -- 1,392,055 1,708,550 1,952,885 1,839,670 1,498,349 914,144 1,308,772
Eardwood 1963 9,208,882 -- -- -- 1,464,649 1,654,155 1,621,440 1,519,848 891,118 2,057,672 1974 9,174,743 -- -- -- 1,641,678 1,778,952 1,593,885 1,323,232 916,873 1,920,123 1984 10,916,025 -- -- -- 1,742,041 1,964,559 1,910,425 1,586,346 1,204,886 2,507,768
GROWING STOR (in thousand cubic feet)
Sof twood 1963 2,838,853 214,969 319,191 420,076 492,615 478,695 385,232 243,395 127,377 157,303 1974 2,760,998 231,776 358,292 403,829 433,335 447,095 373,355 241,283 128,201 143,832 1984 2,758,111 270,275 403,219 384,633 380,961 382,773 330,708 253,938 148,512 203,092
Eardwood 1963 3,113,967 289,697 375,914 410,016 433,200 410,155 360,000 309,920 171,270 353,795 1974 3,326,531 334,277 444,156 491,365 485,560 441,099 353,882 269,827 176,220 330,145 1984 3,623,077 316,351 415,838 478,037 515,282 487,118 424,202 323,472 231,577 431,200
b . ALL LIVE TIUBEP (in thousand cubic feet)
Softwood 1963 2,864,271 218,486 322,011 422,106 496,962 481,799 387,662 244,099 127,377 163,769 1974 2,785,649 235,570 361,455 405,786 437,159 449,985 375,712 242,001 128,201 149,780 1984 2,784,596 273,771 407,267 386,428 384,456 385,300 332,741 254,684 148,512 211,437
Bardwood 1963 3,473,155 368,753 438,730 454,421 467,932 433,299 383,915 324,927 184,842 416,336
1974 3,717,849 425,498 518,376 544,577 524,477 465,989 377,400 282,883 190,193 388,456 1984 4,038,412 402,802 485,933 529,706 556,657 514,626 452,384 339,093 249,876 507,335
a To provide a basis for valid comparisons, adjustments have been made to allow for differences in volume tables and sautimber specifications used in previous surveys.
b~erchantable volume.

-- Davenport, Edgar L.
Forest statistics for the Northern Coastal Ploin of North Caro- lina, 1984. Resour. Bull. SE-74. Asheville, NC: Department of Agriculture, Forest Service, Southeastern Forest Experiment Station; 1984. 50 p.
Since the fourth inventory of the forest resources of the Northern Coastal Plain of North Carolina in 1974, the area of commercial forest land decreased by 349,000 acres, or by 8 percent. lnventory of softwood growing stock remained stable at 2.8 bil l ion cubic feet, while the volume o f hardwood growing stock increased by 9 percent. Net annual growth of hardwood exceeded annual removals by 66 percent. Annual removals of pine growing stock exceeded net annual growth by more than 30 percent on nonindustrial private forest lond, while net annual growth of pines exceeded removals by 49 percent on forest industry land.
KEYWORDS: Commercial forest land, forest ownership, timber volume, timber growth, timber removals, forest trends.
- Davenport, Edgar L.
Forest statistics for the Northern Coastal Plain of North Caro- lina, 1984. Resour. Bull. SE-74. Asheville, NC: Department of Agriculture, Forest Service, Southeastern Forest Experiment Station; 1984. 50 p.
Since the fourth inventory of the forest resources of the Northern Coastal Ploin of North Carolina in 1974, the area of commercial forest land decreased by 349,000 acres, or by 8 percent. lnventory o f softwood growing stock remained stable ot 2.8 billion cubic feet, while the volume of hardwood growing stock increased by 9 percent. Net onnuol growth of hordwood exceeded annual removals by 66 percent. Annual removals o f pine growing stock exceeded net annual growth by more than 30 percent on nonindustrial private forest lond, while net annual growth of pines exceeded rernovols by 49 percent on forest industry land.
KEYWORDS: Commercial forest land, forest ownership, timber volume, timber growth, timber removals, forest trends.

The Forest Service, U.S. De- partment of Agriculture, is dedicated to the principle of multiple use management of the Nation's forest resources for sustained yields of wood, water, forage, wildlife, and recreation. Through forestry research, cooperation with the States and private forest owners, and management of the National Forests and National Grasslands, it strives -as directed by Congress-to provide increasingly greater service to a growing Nation.
USDA policy does not permit discrimination because of race, color, national origin, sex or religion. Any person who believes he or she has been discrimi- nated against in any USDA-related activity should write immediately to the Secretary of Agriculture, Washington, D.C. 20250.