4-1 business finance (mgt 232) lecture 14. 4-2 risk and return
TRANSCRIPT

4-14-1
Business Finance(MGT 232)
Lecture 14

4-24-2
Risk and ReturnRisk and ReturnRisk and ReturnRisk and Return

4-3
• Risk and Return• Stand Alone Expected return • Stand alone risk• Coefficient of variance
Overview of the Last Lecture

4-4
Certainty EquivalentCertainty Equivalent (CECE) is the amount of cash someone would require with certainty at a
point in time to make the individual indifferent between that certain amount and an amount expected to be received with risk at the same
point in time.
Certainty EquivalentCertainty Equivalent (CECE) is the amount of cash someone would require with certainty at a
point in time to make the individual indifferent between that certain amount and an amount expected to be received with risk at the same
point in time.
Risk AttitudesRisk Attitudes
4-5
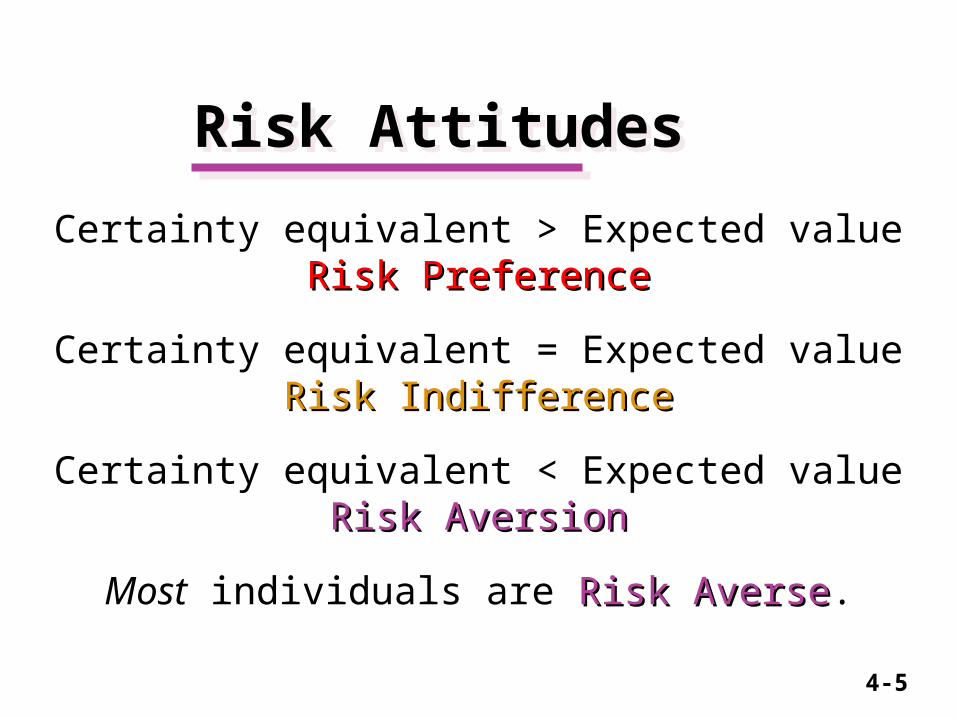
Certainty equivalent > Expected valueRisk PreferenceRisk Preference
Certainty equivalent = Expected valueRisk IndifferenceRisk Indifference
Certainty equivalent < Expected valueRisk AversionRisk Aversion
Most individuals are Risk AverseRisk Averse.
Certainty equivalent > Expected valueRisk PreferenceRisk Preference
Certainty equivalent = Expected valueRisk IndifferenceRisk Indifference
Certainty equivalent < Expected valueRisk AversionRisk Aversion
Most individuals are Risk AverseRisk Averse.
Risk AttitudesRisk Attitudes

4-6
Risk Attitude Example
You have the choice between (1) a guaranteed rupee reward or (2) a coin-flip gamble of Rs.100,000 (50%
chance) or Rs.0 (50% chance). The expected value of the gamble is Rs.50,000.
– Mariam requires a guaranteed Rs.25,000, or more, to call off the gamble.
– Ali is just as happy to take Rs.50,000 or take the risky gamble.
– Sameer requires at least Rs.52,000 to call off the gamble.

4-7
What are the Risk Attitude tendencies of each?What are the Risk Attitude tendencies of each?
Risk Attitude ExampleRisk Attitude Example
Mariam shows “risk aversion”“risk aversion” because her “certainty equivalent” < the expected value of the gamble..
Ali exhibits “risk indifference”“risk indifference” because his “certainty equivalent” equals the expected value of the gamble..
Sameer reveals a “risk preference”“risk preference” because his “certainty equivalent” > the expected value of the gamble..

4-8
Portfolio Risk & Return
Portfolio Risk & Return
““Don’t Put all your eggs in one basket”Don’t Put all your eggs in one basket”
Portfolio is a group of two or more stocks
““Don’t Put all your eggs in one basket”Don’t Put all your eggs in one basket”
Portfolio is a group of two or more stocks
4-9
Expected return on a Portfolio
Expected return on a Portfolio
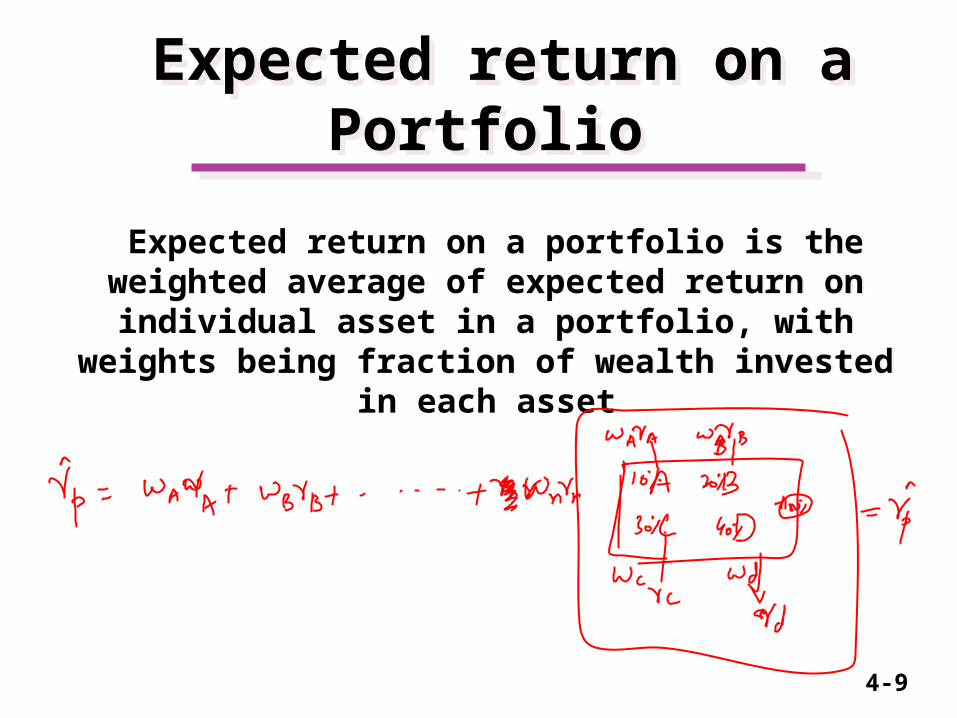
Expected return on a portfolio is the weighted average of expected return on individual asset in a portfolio, with weights being fraction of wealth
invested in each asset
Expected return on a portfolio is the weighted average of expected return on individual asset in a portfolio, with weights being fraction of wealth
invested in each asset
4-10
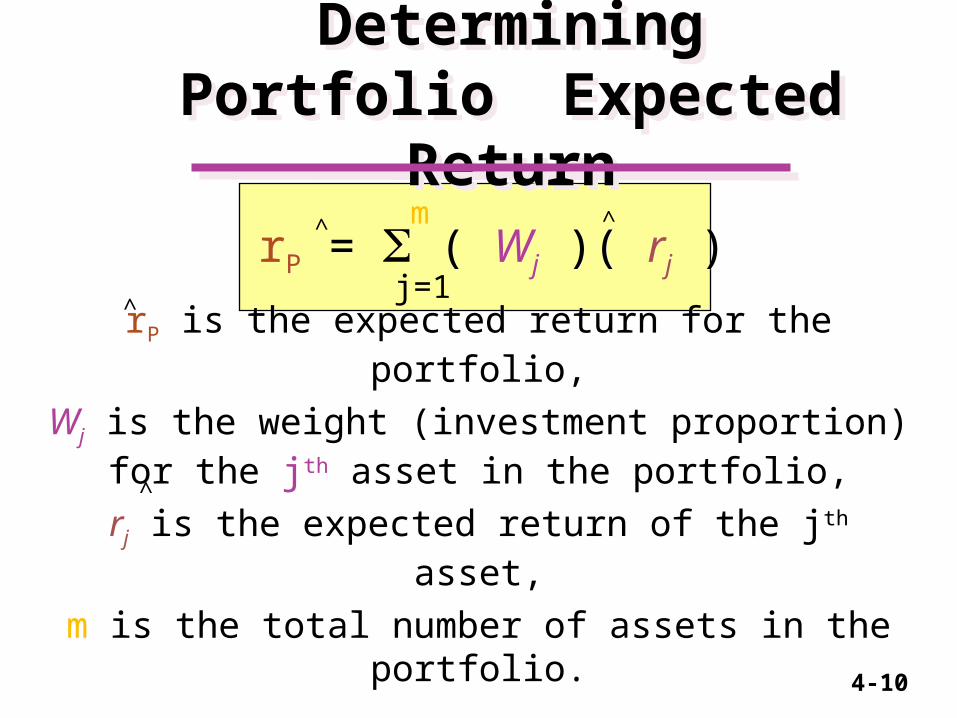
rP = ( Wj )( rj )
rP is the expected return for the portfolio,
Wj is the weight (investment proportion) for the jth asset in the portfolio,
rj is the expected return of the jth asset,
m is the total number of assets in the portfolio.
rP = ( Wj )( rj )
rP is the expected return for the portfolio,
Wj is the weight (investment proportion) for the jth asset in the portfolio,
rj is the expected return of the jth asset,
m is the total number of assets in the portfolio.
Determining PortfolioExpected Return
Determining PortfolioExpected Return
m
j=1
^
^
^
^

4-11
Expected return on a Portfolio
Expected return on a Portfolio
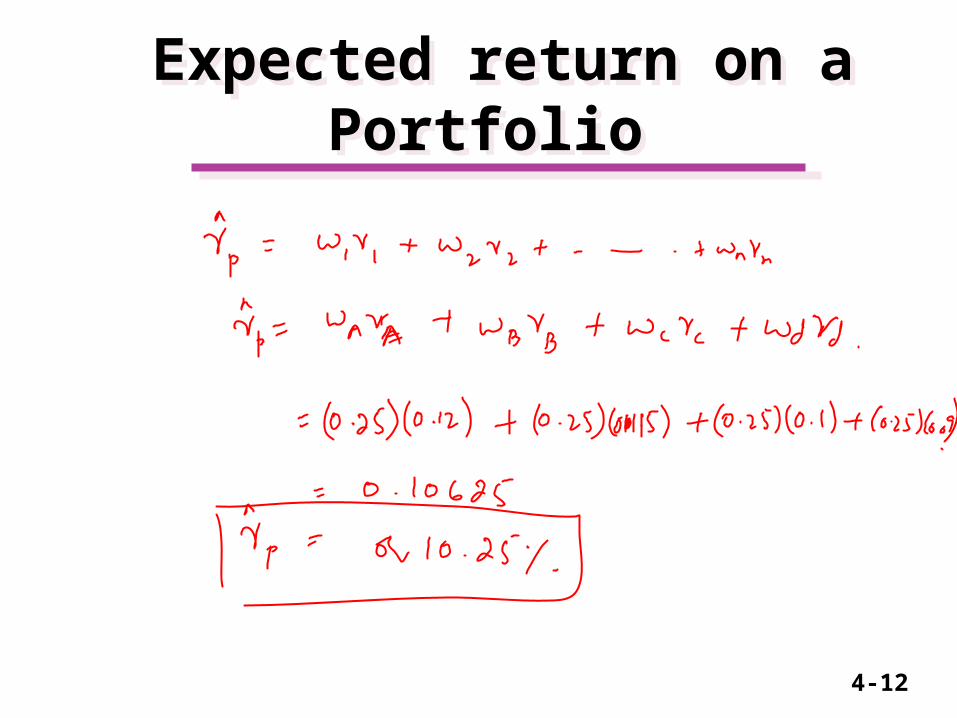
Shares ri wi
A 12%
B 11.5
C 10
D 9
Total wealth invested = Rs. 100,000 equally distributed
4-12
Expected return on a Portfolio
Expected return on a Portfolio

4-13
Risk of a PortfolioRisk of a Portfolio
m
j=1
m
k=1PP = Wj Wk jk
Wj is the weight (investment proportion) for the jth asset in the portfolio,
Wk is the weight (investment proportion) for the kth asset in the portfolio,
jk is the covariance between returns for the jth and kth assets in the portfolio.
PP = Wj Wk jk Wj is the weight (investment proportion) for the jth
asset in the portfolio,Wk is the weight (investment proportion) for the
kth asset in the portfolio,jk is the covariance between returns for the jth
and kth assets in the portfolio.

4-14
Correlation CoefficientCorrelation Coefficient
A standardized statistical measure of the linear relationship between two variables.
The tendency of two variables to move together is called correlation and is
represented by greek letter ρ
A standardized statistical measure of the linear relationship between two variables.
The tendency of two variables to move together is called correlation and is
represented by greek letter ρ
4-15
Correlation CoefficientCorrelation Coefficient
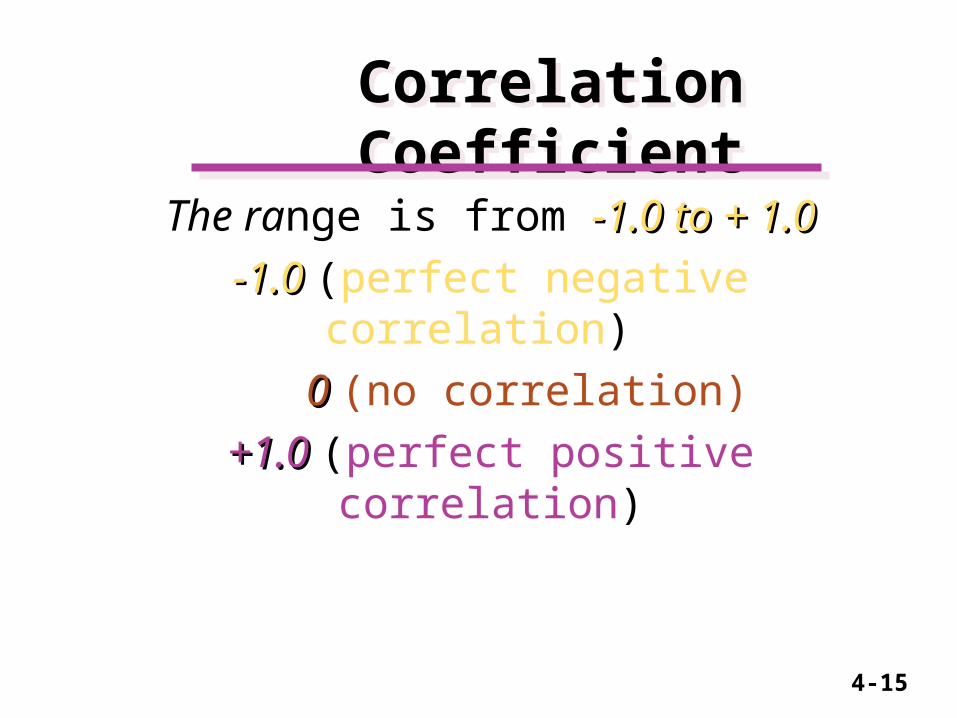
The range is from -1.0 to + 1.0-1.0 to + 1.0-1.0 -1.0 (perfect negative correlation)
0 0 (no correlation) +1.0 +1.0 (perfect positive correlation)
The range is from -1.0 to + 1.0-1.0 to + 1.0-1.0 -1.0 (perfect negative correlation)
0 0 (no correlation) +1.0 +1.0 (perfect positive correlation)
4-16
Correlation CoefficientCorrelation Coefficient
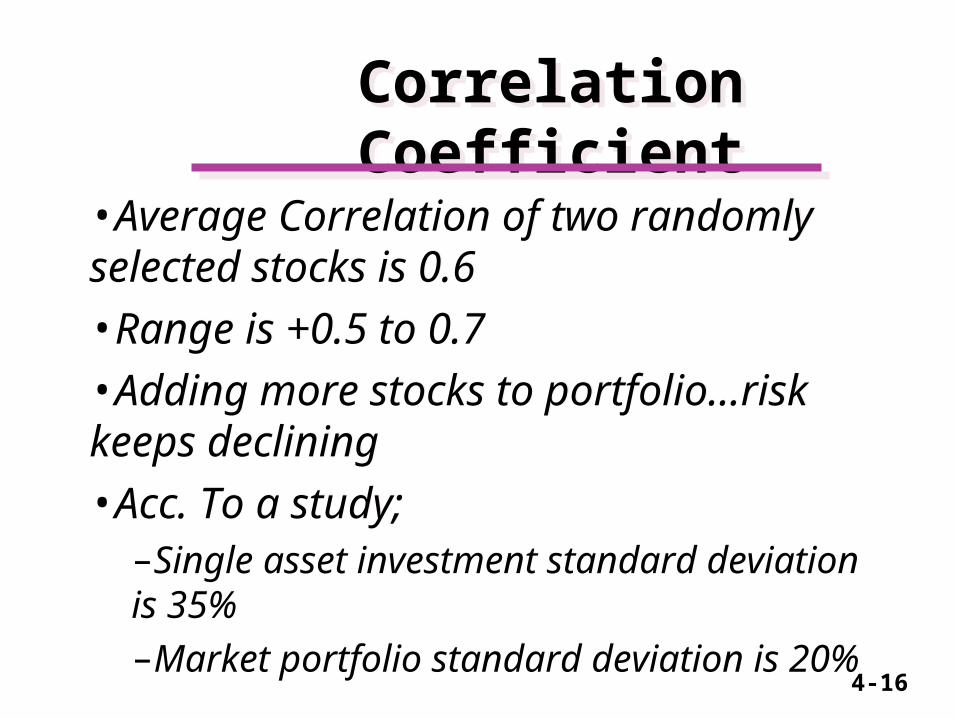
•Average Correlation of two randomly selected stocks is 0.6•Range is +0.5 to 0.7•Adding more stocks to portfolio…risk keeps declining•Acc. To a study;–Single asset investment standard deviation is 35% –Market portfolio standard deviation is 20%
•Average Correlation of two randomly selected stocks is 0.6•Range is +0.5 to 0.7•Adding more stocks to portfolio…risk keeps declining•Acc. To a study;–Single asset investment standard deviation is 35% –Market portfolio standard deviation is 20%

4-17
Stock C Stock D PortfolioReturnReturn 9.00% 8.00% 8.64%Stand.Stand.Dev.Dev. 13.15% 10.65% 10.91%CVCV 1.46 1.33 1.26
The portfolio has the LOWEST coefficient of variation due to diversification.
Stock C Stock D PortfolioReturnReturn 9.00% 8.00% 8.64%Stand.Stand.Dev.Dev. 13.15% 10.65% 10.91%CVCV 1.46 1.33 1.26
The portfolio has the LOWEST coefficient of variation due to diversification.
Summary of the Portfolio Return and Risk Calculation
Summary of the Portfolio Return and Risk Calculation
4-18
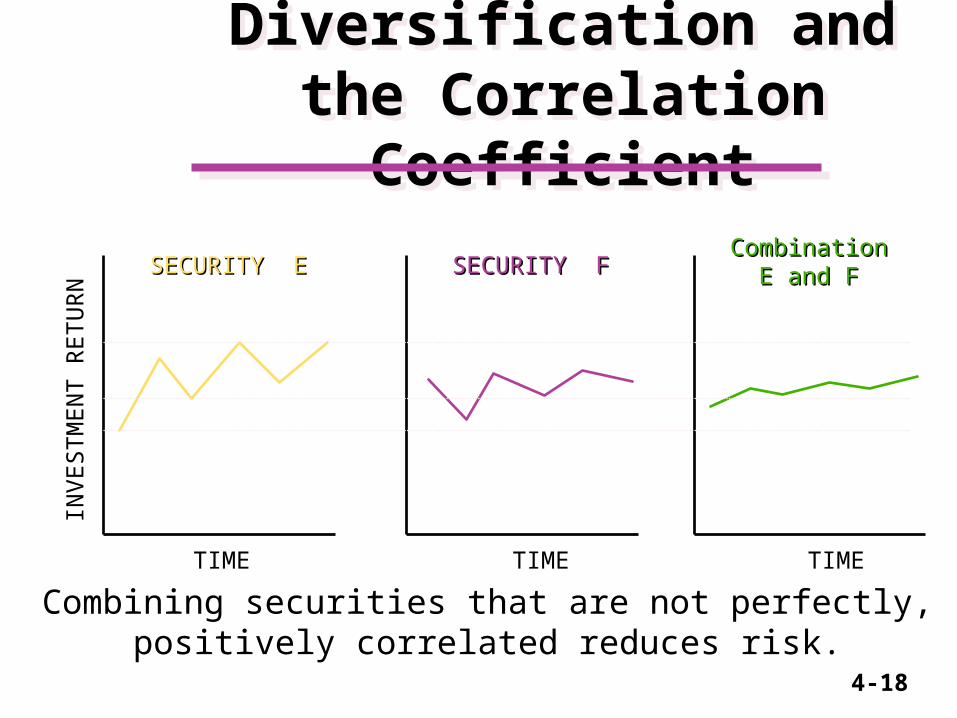
Combining securities that are not perfectly, positively correlated reduces risk.
Combining securities that are not perfectly, positively correlated reduces risk.
Diversification and the Correlation CoefficientDiversification and the Correlation Coefficient
INV
ESTM
EN
T R
ETU
RN
TIME TIMETIME
SECURITY ESECURITY E SECURITY FSECURITY FCombinationCombination
E and FE and F
4-19
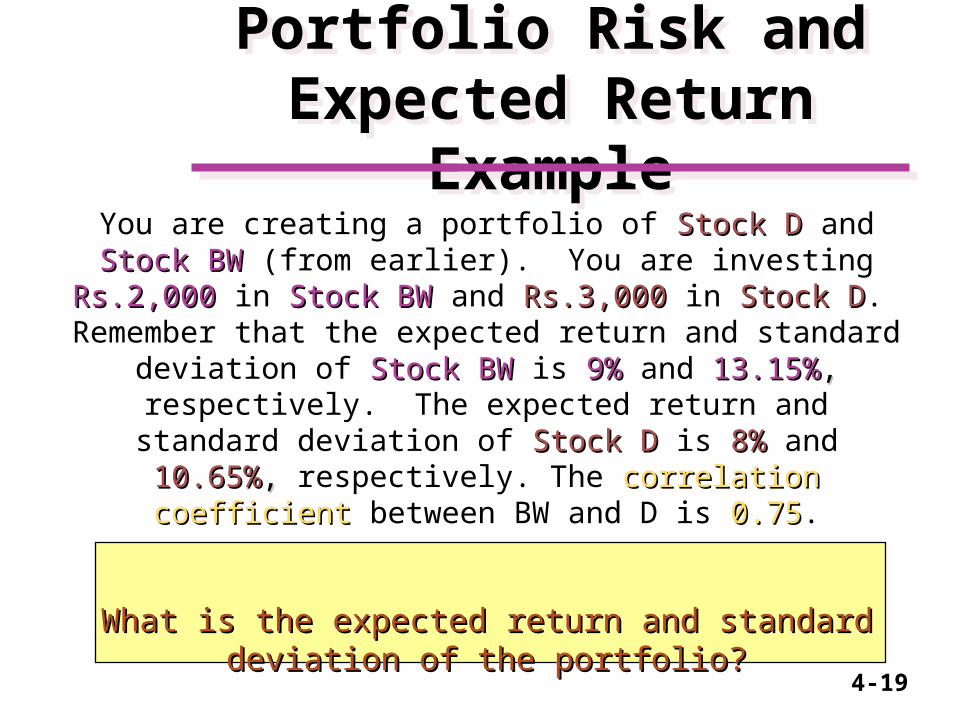
You are creating a portfolio of Stock D Stock D and Stock BW Stock BW (from earlier). You are investing Rs.2,000Rs.2,000 in Stock BW Stock BW and
Rs.3,000Rs.3,000 in Stock DStock D. Remember that the expected return and standard deviation of Stock BWStock BW is 9%9% and 13.15%13.15%,,
respectively. The expected return and standard deviation of Stock D Stock D is 8%8% and 10.65%10.65%,, respectively. The correlation correlation
coefficient coefficient between BW and D is 0.750.75.
What is the expected return and standard deviation of What is the expected return and standard deviation of the portfolio?the portfolio?
Portfolio Risk and Expected Return Example
Portfolio Risk and Expected Return Example
4-20
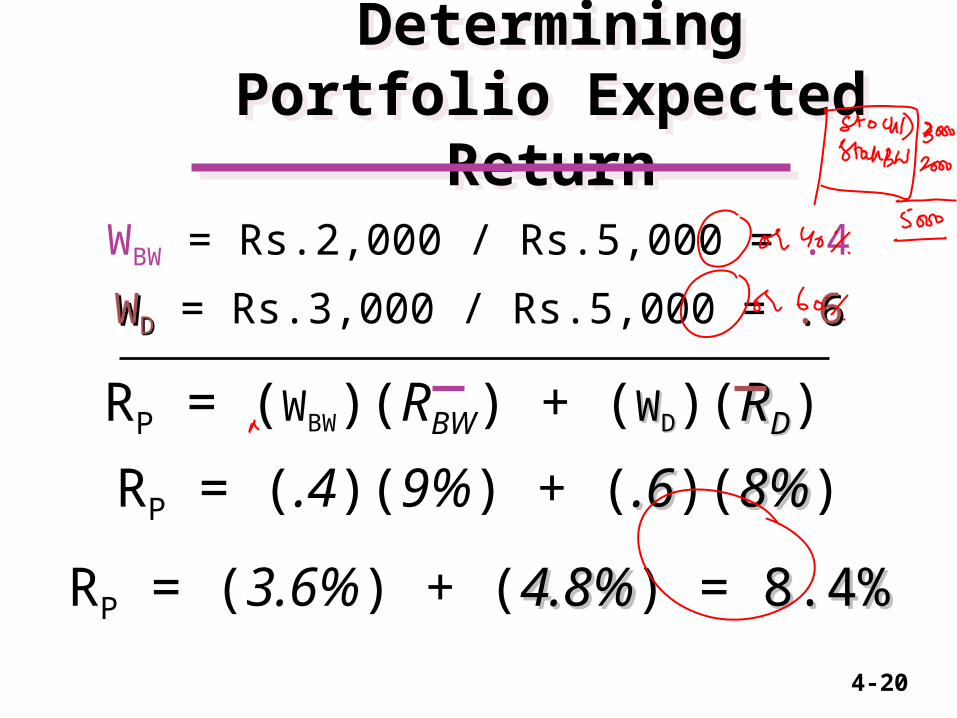
Determining Portfolio Expected Return
Determining Portfolio Expected Return
WBW = Rs.2,000 / Rs.5,000 = .4
WWDD = Rs.3,000 / Rs.5,000 = .6 .6
RP = (WBW)(RBW) + (WWDD)(RRDD)
RP = (.4)(9%) + (.6.6)(8%8%)
RP = (3.6%) + (4.8%4.8%) = 8.4%8.4%
WBW = Rs.2,000 / Rs.5,000 = .4
WWDD = Rs.3,000 / Rs.5,000 = .6 .6
RP = (WBW)(RBW) + (WWDD)(RRDD)
RP = (.4)(9%) + (.6.6)(8%8%)
RP = (3.6%) + (4.8%4.8%) = 8.4%8.4%
4-21
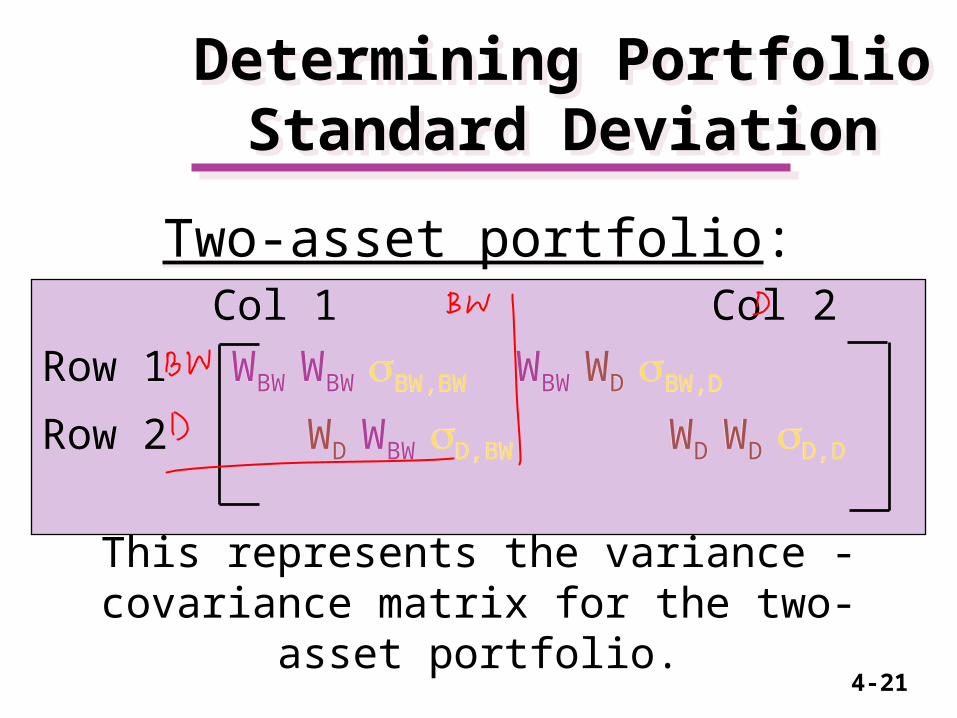
Two-asset portfolio: Col 1 Col 2
Row 1 WBW WBW BW,BW WBW WD BW,D
Row 2 WD WBW D,BW WD WD D,D
This represents the variance - covariance matrix for the two-asset portfolio.
Two-asset portfolio: Col 1 Col 2
Row 1 WBW WBW BW,BW WBW WD BW,D
Row 2 WD WBW D,BW WD WD D,D
This represents the variance - covariance matrix for the two-asset portfolio.
Determining Portfolio Standard Deviation
Determining Portfolio Standard Deviation

4-22
Two-asset portfolio: Col 1 Col 2
Row 1 (.4)(.4)(.0173) (.4)(.6)(.0105)
Row 2 (.6)(.4)(.0105) (.6)(.6)(.0113)
This represents substitution into the variance - covariance matrix.
Two-asset portfolio: Col 1 Col 2
Row 1 (.4)(.4)(.0173) (.4)(.6)(.0105)
Row 2 (.6)(.4)(.0105) (.6)(.6)(.0113)
This represents substitution into the variance - covariance matrix.
Determining Portfolio Standard Deviation
Determining Portfolio Standard Deviation
4-23
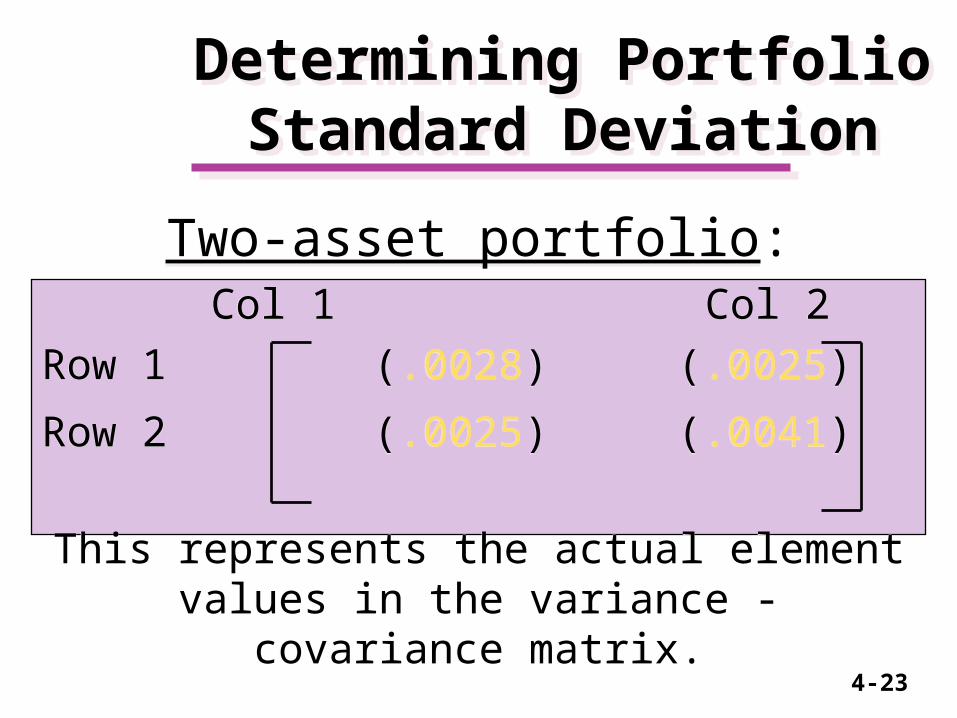
Two-asset portfolio: Col 1 Col 2
Row 1 (.0028) (.0025)
Row 2 (.0025) (.0041)
This represents the actual element values in the variance - covariance matrix.
Two-asset portfolio: Col 1 Col 2
Row 1 (.0028) (.0025)
Row 2 (.0025) (.0041)
This represents the actual element values in the variance - covariance matrix.
Determining Portfolio Standard Deviation
Determining Portfolio Standard Deviation

4-24
Determining Portfolio Standard Deviation
Determining Portfolio Standard Deviation
P = .0028 + (2)(.0025) + .0041
P = SQRT(.0119)
P = .1091 or 10.91%
A weighted average of the individual standard deviations is INCORRECT.
P = .0028 + (2)(.0025) + .0041
P = SQRT(.0119)
P = .1091 or 10.91%
A weighted average of the individual standard deviations is INCORRECT.

4-25
Determining Portfolio Standard Deviation
Determining Portfolio Standard Deviation
The WRONG way to calculate is a weighted average like:
P = .4 (13.15%) + .6(10.65%)P = 5.26 + 6.39 = 11.65%
10.91% = 11.65%
This is INCORRECT.
The WRONG way to calculate is a weighted average like:
P = .4 (13.15%) + .6(10.65%)P = 5.26 + 6.39 = 11.65%
10.91% = 11.65%
This is INCORRECT.

4-26
Summary
• Risk attitudes• Portfolio return• Portfolio Risk• Coefficient of correlation• Risk diversification