4 q fy16 earnings webcast deck - final
TRANSCRIPT

NYSE: NLSN
THURSDAY FEBRUARY 9, 2017 8:00AM ET
4TH QUARTER AND FULL YEAR 2016 RESULTS

Co
pyr
igh
t ©
2016
Th
e N
iels
en C
om
pan
y.
2NLSN 4Q and FY 2016 Results
SAFE HARBOR FOR FORWARD-LOOKING STATEMENTS
The following discussion contains forward-looking statements, including those about Nielsen’s outlook and
prospects, that relate to the Private Securities Litigation Reform Act of 1995. Forward-looking statements
are those which are not historical facts. These and other statements that relate to future results and
events are based on Nielsen’s current expectations as of February 9, 2017.
Our actual results in future periods may differ materially from those currently expected because of a
number of risks and uncertainties. The risks and uncertainties that we believe are material are outlined in
our disclosure filings and materials, which you can find on http://ir.nielsen.com, such as our most recent
10-K, 10-Q and 8-K reports. Please consult these documents for a more complete understanding of these
risks and uncertainties. We disclaim any intention or obligation to update or revise any forward-looking
statements, whether as a result of new information, future events or otherwise, except as may be required
by law.
Our outlook is provided for the purpose of providing information about current expectations for 2017. This
information may not be appropriate for other purposes.

MITCH BARNSCHIEF EXECUTIVE OFFICER

Co
pyr
igh
t ©
2016
Th
e N
iels
en C
om
pan
y.
4NLSN 4Q and FY 2016 Results
FULL YEAR 2016 OVERVIEW
RESILIENT BUSINESS MODEL
• Financial highlights
- Revenue of $6.3 billion…up 4.1% constant currency
• Watch: up 6.3% constant currency• Buy: up 2.3% constant currency
- Adjusted EBITDA of $1.9 billion…up 5.2% constant currency
- Diluted net income per share of $1.39 vs. $1.54 a year ago…up 35.0% ex-items
- Record free cash flow of $941 million…up 16.5% vs. a year ago
• Executing on our balanced capital allocation framework
- Acquisitions remain integral, bolstering key parts of our strategy
- Returned $850 million back to shareholders in the form of dividends and buybacks
• Updating 2017 guidance
Co
pyr
igh
t ©
2016
Th
e N
iels
en C
om
pan
y.
5NLSN 4Q and FY 2016 Results
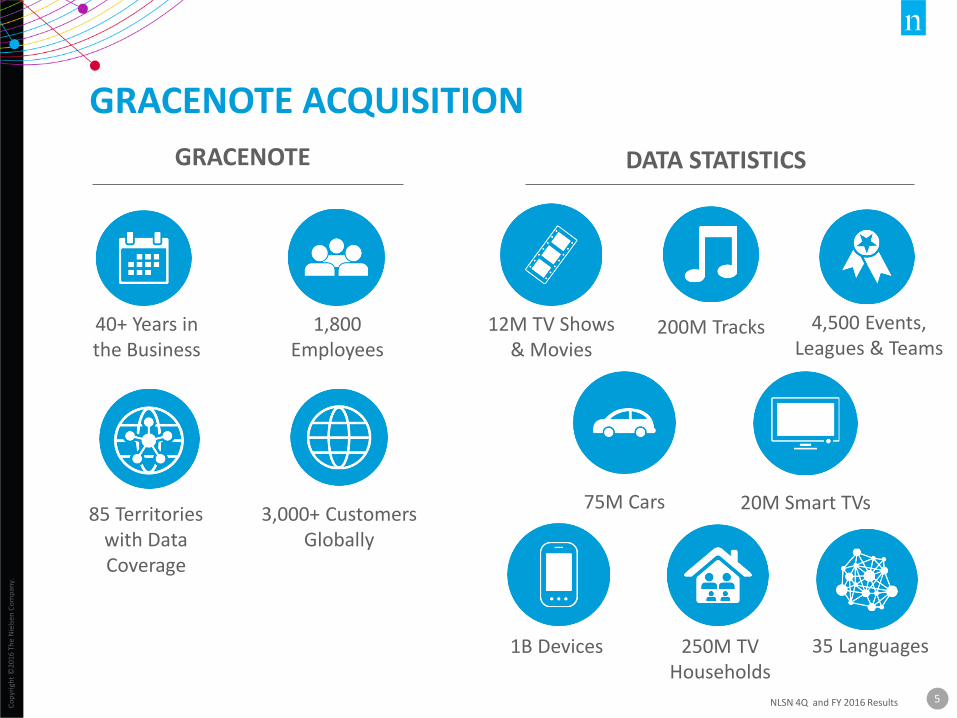
GRACENOTE ACQUISITION
40+ Years in the Business
1,800 Employees
85 Territories with Data Coverage
3,000+ Customers Globally
GRACENOTE DATA STATISTICS
12M TV Shows & Movies
200M Tracks 4,500 Events, Leagues & Teams
75M Cars 20M Smart TVs
1B Devices 250M TV Households
35 Languages

Co
pyr
igh
t ©
2016
Th
e N
iels
en C
om
pan
y.
6NLSN 4Q and FY 2016 Results
• 10% increase in Portable People Meter sample size (48 markets)
• Incorporating out-of-home viewing
• Set-top-box data to add stability and granularity to ratings
• “Digital in TV Ratings”: newly MRC accredited; to be included in C3/C7
• Total Content Ratings: limited commercial release on March 1st
• Digital Content Ratings: syndicated September 2016; continued adoption
• Subscription Video On-Demand: >20K episodes; improving data capture
• Digital Ad Ratings: growing client adoption and use for guarantees
• National TV: incorporating out-of-home viewing in April
• 2017 Upfronts: Total Audience and its many components to play a key role
WATCH: STRATEGIC INITIATIVES
• Nielsen Marketing Cloud: increasing the value of data and analytics
Total Audience Measurement
Marketing Effectiveness: Convergence of Watch and Buy
Audio
Local

Co
pyr
igh
t ©
2016
Th
e N
iels
en C
om
pan
y.
7NLSN 4Q and FY 2016 Results
BUY: TWO-SPEED WORLD
• Linking measurement data with analytics, explanatory and predictive
• Addressing client needs of speed and efficiency
• Expanding to an additional 20-30 clients as the year unfolds; broader rollout in 2018
• Connected Partner Program growing, adding value to measurement data
Connected System: The Future of Buy
• Global footprint remains strategic advantage
• Balanced portfolio of global and local clients, broad-based growth
• Ongoing investments in measurement coverage and granularity
Emerging Markets: Compelling Story
Developed Markets: Challenging Growth Environment
• Measurement + everyday analytics remain mission critical for clients
• Renewal rates with large global clients 100%
• Clients reining in costs and reducing spend, our business not immune
• Covering 90% of US e-commerce sales of fast moving consumer goods
• Strategic agreement with JD.com in China
• Active in 11 markets, expanding to six more in 2017
E-Commerce: Building Out Coverage
JAMERE JACKSONCHIEF FINANCIAL OFFICER

Co
pyr
igh
t ©
2016
Th
e N
iels
en C
om
pan
y.
9NLSN 4Q and FY 2016 Results
TOTAL NIELSEN RESULTS – FY 2016($ in millions, except per share amounts)
NON-GAAP RESULTSFY
2016FY
2015V%(b)
Total Revenue $6,309 $6,172 4.1%
Core Revenue $5,924 $5,749 5.2%
Adjusted EBITDA $1,938 $1,858 5.2%
Adjusted EBITDA margin % 30.7% 30.1% 31 bps
Free Cash Flow $941 $808 16.5%
(a) Growth as reported(b) Growth in constant currency, excluding Free Cash Flow(c) Calculated using weighted average shares outstanding of 362.2 million for FY 2016 and 371.0 million for FY 2015.
U.S. GAAP RESULTSFY
2016FY
2015V%(a)
Total Revenue $6,309 $6,172 2.2%
Net Income (NI) $502 $570 (11.9%)
Diluted NI per share(c) $1.39 $1.54 (9.7%)

Co
pyr
igh
t ©
2016
Th
e N
iels
en C
om
pan
y.
10NLSN 4Q and FY 2016 Results
TOTAL NIELSEN RESULTS – 4Q 2016($ in millions, except per share amounts)
NON-GAAP RESULTS4Q
20164Q
2015V%(b)
Total Revenue $1,656 $1,624 3.4%
Core Revenue $1,550 $1,504 4.7%
Adjusted EBITDA $548 $531 3.8%
Adjusted EBITDA margin % 33.1% 32.7% 13 bps
Free Cash Flow $476 $306 55.6%
(a) Growth as reported(b) Growth in constant currency, excluding Free Cash Flow(c) Calculated using weighted average shares outstanding of 359.7 million for 4Q 2016 and 366.5 million for 4Q 2015.
U.S. GAAP RESULTS4Q
20164Q
2015V%(a)
Total Revenue $1,656 $1,624 2.0%
Net Income (NI) $159 $251 (36.7%)
Diluted NI per share(c) $0.44 $0.68 (35.3%)

Co
pyr
igh
t ©
2016
Th
e N
iels
en C
om
pan
y.
11NLSN 4Q and FY 2016 Results
WATCH SEGMENT RESULTS ($ in millions, growth in constant currency)
REVENUE
PROFITABILITY
4Q DYNAMICS
Total Watch
Adjusted EBITDA
Margin
$788
$363
46.1%
4Q 16
$745
$343
46.0%
4Q 15
6.2%
6.8%
25 bps
V%
• Strong total revenue growth: +6.2% Audience Measurement (Video/Text): +9.0% Audio: (1.6%) Marketing Effectiveness: +9.2% Other Watch/Corporate: (2.9%)
• Growth initiatives delivering Digital Ad Ratings adoption Nielsen Marketing Cloud momentum Continued traction with Digital Content Ratings
• Continued margin expansion while investing
Core Watch $722 $679 7.1%

Co
pyr
igh
t ©
2016
Th
e N
iels
en C
om
pan
y.
12NLSN 4Q and FY 2016 Results
BUY SEGMENT RESULTS ($ in millions, growth in constant currency)
REVENUE
PROFITABILITY
4Q DYNAMICS
Adjusted EBITDA
Margin
$193
22.2%
4Q 16
$195
22.2%
4Q 15
(1.0%)
(43 bps)
V%
Total Buy $868 $879 0.9% • Modest total revenue growth: +0.9% Developed: +0.4% Emerging: +7.2% Corporate: (24.5%)
• Emerging markets remain robust
• Portfolio pruning underway U.S. consumer segmentation U.S. custom survey research services
• Investing in the Connected System and future productivity
Core Buy $828 $825 2.6%

Co
pyr
igh
t ©
2016
Th
e N
iels
en C
om
pan
y.
13NLSN 4Q and FY 2016 Results
FOREIGN CURRENCY IMPACT
(a) Projected impact assumes rates in effect at 2/8/17 remain in effect for the balance of 2017.
Note: We report on a constant currency basis to reflect operating performance
61%9%
3%3%3%
21%
USD EUR CAD GBP CNY Other
2016 CURRENCY PROFILE - REVENUEPROJECTED FX IMPACT(a):
REPORTED VS CONSTANT CURRENCY
(140)
(190)
(50)
(160)
(120)
30
(70)(60)(90)
20
(40) (40)
60
(10)
4Q16 FY16 1Q17E 2Q17E 3Q17E 4Q17E FY17E
Rev (bps) EBITDA (bps)

Co
pyr
igh
t ©
2016
Th
e N
iels
en C
om
pan
y.
14NLSN 4Q and FY 2016 Results
2017 GUIDANCE(Revenue and adj. EBITDA margin growth in constant currency)
Total Revenue 5% - 6%
Total Revenue Core 6.5% - 7.5%
Total Revenue Core (ex Gracenote) 3% - 4%
Adj. EBITDA margin growth Flat
GAAP Net Income Per Share $1.40 - $1.46
Net Debt Leverage Ratio ~3.8x
Free Cash Flow ~$900M
Net book interest $365M - $375M
GAAP Tax Rate 38.0% - 38.5%
Restructuring $60M - $70M
Cash restructuring $100M - $110M
D&A $665M - $675M
Est. wtd. avg. diluted shares outstanding for FY 2017 ~359M
OTHER FINANCIAL METRICS

Co
pyr
igh
t ©
2016
Th
e N
iels
en C
om
pan
y.
15NLSN 4Q and FY 2016 Results
&

APPENDIX

Co
pyr
igh
t ©
2016
Th
e N
iels
en C
om
pan
y.
17NLSN 4Q and FY 2016 Results
CERTAIN NON-GAAP MEASURESOverview of Non-GAAP PresentationsWe use the non-GAAP financial measures discussed below to evaluate our results of operations, financial condition, liquidity and indebtedness. We believe that the presentation of these non-GAAP measures provides useful information to investors regarding financial and business trends related to our results of operations, cash flows and indebtedness and that when this non-GAAP financial information is viewed with our GAAP financial information, investors are provided with valuable supplemental information regarding our results of operations, thereby facilitating period-to-period comparisons of our business performance and is consistent with how management evaluates the company’s operating performance and liquidity. In addition, these non-GAAP measures address questions the Company routinely receives from analysts and investors and, in order to assure that all investors have access to similar data the Company has determined that it is appropriate to make this data available to all investors. None of the non-GAAP measures presented should be considered as an alternative to net income or loss, operating income or loss, cash flows from operating activities, total indebtedness or any other measures of operating performance and financial condition, liquidity or indebtedness derived in accordance with GAAP. These non-GAAP measures have important limitations as analytical tools and should not be considered in isolation or as substitutes for an analysis of our results as reported under GAAP. Our use of these terms may vary from the use of similarly-titled measures by others in our industry due to the potential inconsistencies in the method of calculation and differences due to items subject to interpretation.
Constant Currency PresentationWe evaluate our results of operations on both an as reported and a constant currency basis. The constant currency presentation, which is a non-GAAP measure, excludes the impact of fluctuations in foreign currency exchange rates. We believe providing constant currency information provides valuable supplemental information regarding our results of operations, thereby facilitating period-to-period comparisons of our business performance and is consistent with how management evaluates the company’s performance. We calculate constant currency percentages by converting our prior-period local currency financial results using the current period exchange rates and comparing these adjusted amounts to our current period reported results. No adjustment has been made to foreign currency exchange transaction gains or losses in the calculation of constant currency net income.
Net Debt and Net Debt Leverage RatioThe net debt leverage ratio is defined as net debt (gross debt less cash and cash equivalents) as of the balance sheet date divided by Adjusted EBITDA for the twelve months then ended. Net debt and the net debt leverage ratio are commonly used metrics to evaluate and compare leverage between companies and are not presentations made in accordance with GAAP.

Co
pyr
igh
t ©
2016
Th
e N
iels
en C
om
pan
y.
18NLSN 4Q and FY 2016 Results
CERTAIN NON-GAAP MEASURES(continued)
Adjusted EBITDA
We define Adjusted EBITDA as net income or loss from our consolidated statements of operations before interest income and expense, income taxes, depreciation and amortization, restructuring charges, stock-based compensation expense and other non-operating items from our consolidated statements of operations as well as certain other items that arise outside the ordinary course of our continuing operations. We use Adjusted EBITDA to measure our performance from period to period both at the consolidated level as well as within our operating segments, to evaluate and fund incentive compensation programs and to compare our results to those of our competitors.
Free Cash FlowWe define free cash flow as net cash provided by operating activities, plus contributions to the Nielsen Foundation, less capital expenditures, net. We believe providing free cash flow information provides valuable supplemental liquidity information regarding the cash flow that may be available for discretionary use by us in areas such as the distributions of dividends, repurchase of common stock, voluntary repayment of debt obligations or to fund our strategic initiatives, including acquisitions, if any. However, free cash flow does not represent residual cash flows entirely available for discretionary purposes; for example, the repayment of principal amounts borrowed is not deducted from free cash flow. Key limitations of the free cash flow measure include the assumptions that we will be able to refinance our existing debt when it matures and meet other cash flow obligations from financing activities, such as principal payments on debt. Free cash flow is not a presentation made in accordance with GAAP.
Co
pyr
igh
t ©
2016
Th
e N
iels
en C
om
pan
y.
19NLSN 4Q and FY 2016 Results
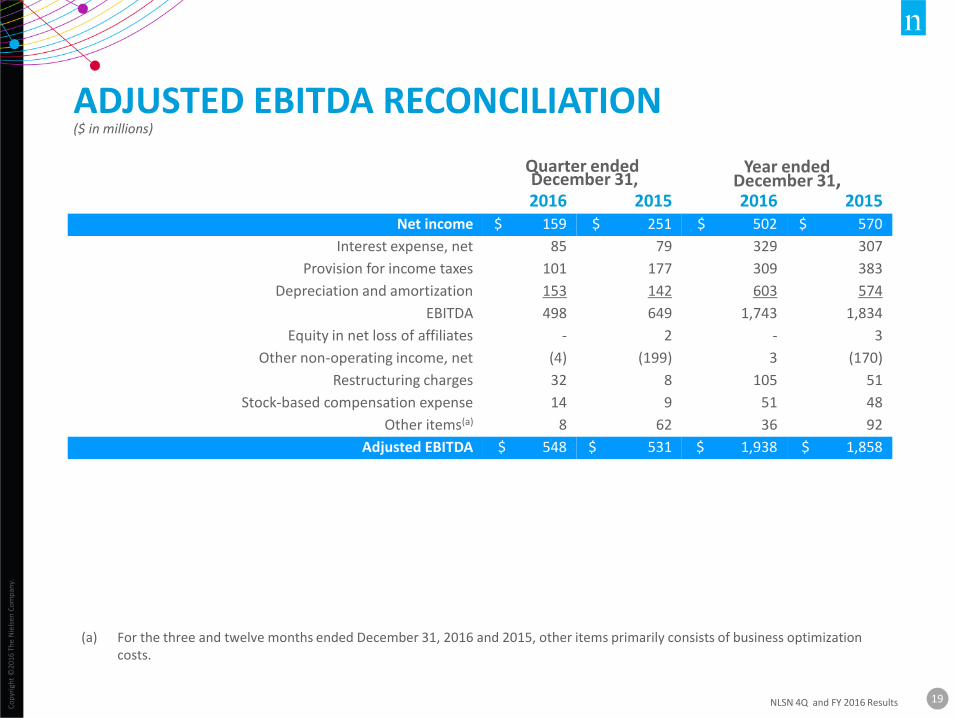
ADJUSTED EBITDA RECONCILIATION($ in millions)
Quarter endedDecember 31,
Year ended December 31,
2016 2015 2016 2015Net income $ 159 $ 251 $ 502 $ 570
Interest expense, net 85 79 329 307
Provision for income taxes 101 177 309 383
Depreciation and amortization 153 142 603 574
EBITDA 498 649 1,743 1,834
Equity in net loss of affiliates - 2 - 3
Other non-operating income, net (4) (199) 3 (170)
Restructuring charges 32 8 105 51
Stock-based compensation expense 14 9 51 48
Other items(a) 8 62 36 92
Adjusted EBITDA $ 548 $ 531 $ 1,938 $ 1,858
(a) For the three and twelve months ended December 31, 2016 and 2015, other items primarily consists of business optimization costs.
Co
pyr
igh
t ©
2016
Th
e N
iels
en C
om
pan
y.
20NLSN 4Q and FY 2016 Results
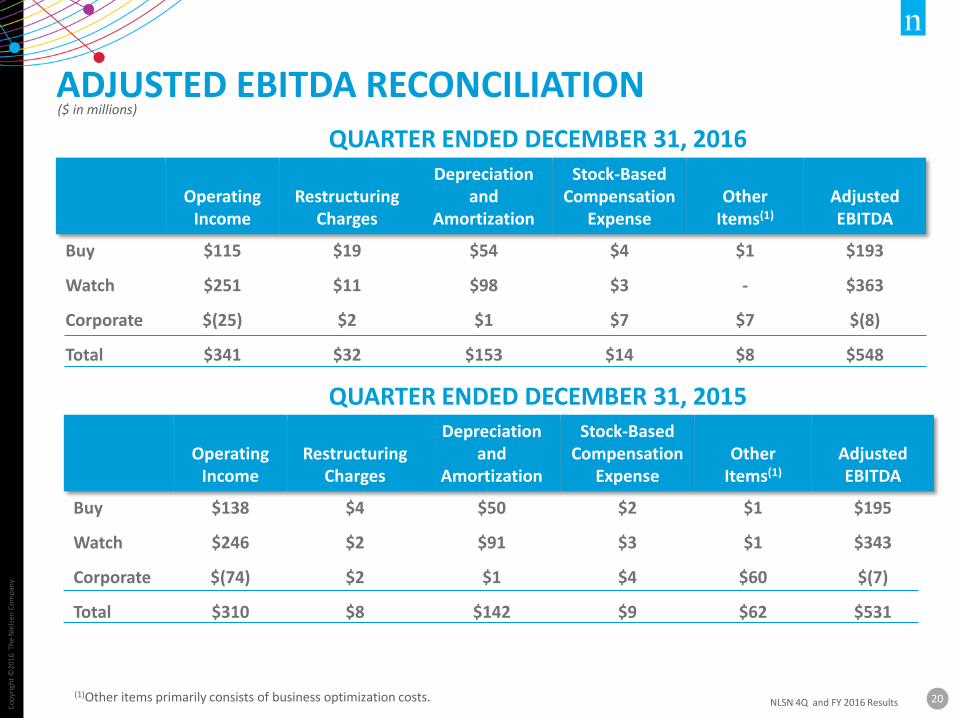
($ in millions) ADJUSTED EBITDA RECONCILIATION
Operating Income
RestructuringCharges
Depreciationand
Amortization
Stock-Based Compensation
ExpenseOther
Items(1)
Adjusted EBITDA
Buy $115 $19 $54 $4 $1 $193
Watch $251 $11 $98 $3 - $363
Corporate $(25) $2 $1 $7 $7 $(8)
Total $341 $32 $153 $14 $8 $548
QUARTER ENDED DECEMBER 31, 2016
QUARTER ENDED DECEMBER 31, 2015
Operating Income
RestructuringCharges
Depreciationand
Amortization
Stock-Based Compensation
ExpenseOther
Items(1)
Adjusted EBITDA
Buy $138 $4 $50 $2 $1 $195
Watch $246 $2 $91 $3 $1 $343
Corporate $(74) $2 $1 $4 $60 $(7)
Total $310 $8 $142 $9 $62 $531
(1)Other items primarily consists of business optimization costs.

Co
pyr
igh
t ©
2016
Th
e N
iels
en C
om
pan
y.
21NLSN 4Q and FY 2016 Results
($ in millions) ADJUSTED EBITDA RECONCILIATION
Operating Income
RestructuringCharges
Depreciationand
Amortization
Stock-Based Compensation
Expense
Other Items(1)
Adjusted EBITDA
Buy $331 $61 $212 $16 $3 $623
Watch $935 $18 $387 $10 $2 $1,352
Corporate $(123) $26 $4 $25 $31 $(37)
Total $1,143 $105 $603 $51 $36 $1,938
YEAR ENDED DECEMBER 31, 2016
YEAR ENDED DECEMBER 31, 2015Operating
IncomeRestructuring
ChargesDepreciation
and Amortization
Stock-Based Compensation
Expense
Other Items(1)
Adjusted EBITDA
Buy $369 $32 $207 $15 $1 $624
Watch $880 $14 $363 $8 $4 $1,269
Corporate $(156) $5 $4 $25 $87 $(35)
Total $1,093 $51 $574 $48 $92 $1,858
(1)Other items primarily consists of business optimization costs.

Co
pyr
igh
t ©
2016
Th
e N
iels
en C
om
pan
y.
22NLSN 4Q and FY 2016 Results
($ in millions) ADJUSTED EBITDA RECONCILIATION
2016Reported
2015Reported % V Reported
2015 Constant Currency
% V Constant Currency
Buy $193 $195 (1.0%) $195 (1.0%)
Watch $363 $343 5.8% $340 6.8%
Corporate $(8) $(7) NM $(7) NM
Total $548 $531 3.2% $528 3.8%
QUARTER ENDED DECEMBER 31,
YEAR ENDED DECEMBER 31,
2016Reported
2015Reported % V Reported
2015 Constant Currency
% V Constant Currency
Buy $623 $624 (0.2%) $613 1.6%
Watch $1,352 $1,269 6.5% $1,264 7.0%
Corporate $(37) $(35) NM $(35) NM
Total $1,938 $1,858 4.3% $1,842 5.2%

Co
pyr
igh
t ©
2016
Th
e N
iels
en C
om
pan
y.
23NLSN 4Q and FY 2016 Results
2016Reported
2015 Reported
% VReported
2015 Constant Currency
% V Constant Currency
Developed Markets $545 $553 (1.4%) $543 0.4%
Emerging Markets 283 272 4.0% 264 7.2%
Core Buy $828 $825 0.4% $807 2.6%
Corporate $40 $54 (25.9%) $53 (24.5%)
Buy $868 $879 (1.3%) $860 0.9%
Video and Text $519 $479 8.4% $476 9.0%
Audio 120 122 (1.6%) 122 (1.6%)
Marketing Effectiveness 83 78 6.4% 76 9.2%
Core Watch $722 $679 6.3% $674 7.1%
Corporate/Other Watch 66 66 0.0% 68 (2.9%)
Watch $788 $745 5.8% $742 6.2%
Total Core Buy and Watch $1,550 $1,504 3.1% $1,481 4.7%
Total $1,656 $1,624 2.0% $1,602 3.4%
REVENUE RECONCILIATION
QUARTER ENDED DECEMBER 31,($ in millions)

Co
pyr
igh
t ©
2016
Th
e N
iels
en C
om
pan
y.
24NLSN 4Q and FY 2016 Results
2016Reported
2015 Reported
% VReported
2015 Constant Currency
% V Constant Currency
Developed Markets $2,096 $2,110 (0.7%) $2,077 0.9%
Emerging Markets 1,063 1,044 1.8% 979 8.6%
Core Buy $3,159 $3,154 0.2% $3,056 3.4%
Corporate $163 $191 (14.7%) $191 (14.7%)
Buy $3,322 $3,345 (0.7%) $3,247 2.3%
Video and Text $1,978 $1,840 7.5% $1,827 8.3%
Audio 500 504 (0.8%) 503 (0.6%)
Marketing Effectiveness 287 251 14.3% 247 16.2%
Core Watch $2,765 $2,595 6.6% $2,577 7.3%
Corporate/Other Watch 222 232 (4.3%) 234 (5.1%)
Watch $2,987 $2,827 5.7% $2,811 6.3%
Total Core Buy and Watch $5,924 $5,749 3.0% $5,633 5.2%
Total $6,309 $6,172 2.2% $6,058 4.1%
REVENUE RECONCILIATION
YEAR ENDED DECEMBER 31,($ in millions)

Co
pyr
igh
t ©
2016
Th
e N
iels
en C
om
pan
y.
25NLSN 4Q and FY 2016 Results
OTHER NON-OPERATING (LOSS)/INCOME IMPACT ON DILUTED EARNINGS PER SHARE(amounts in millions, except per share information)
All amounts are presented net of the estimated tax impact
Q4’15 FY’15Business acquisition/disposition and sale of investment $ 187 $ 187
Diluted per share impact $ 0.51 $ 0.51
GAAP weighted-average shares of common stock outstanding, diluted 366.5 371.0

Co
pyr
igh
t ©
2016
Th
e N
iels
en C
om
pan
y.
26NLSN 4Q and FY 2016 Results
($ in millions)
2017 GUIDANCE NON-GAAP RECONCILIATIONS
NET DEBT LEVERAGE RATIO
Gross Debt ~$ 8,320
Cash ~$ 580
Net Debt ~$ 7,740
Adjusted EBITDA $2,030 - $2,050
Net Debt Leverage Ratio ~3.8x
FREE CASH FLOW
Net cash provided by operating activities ~$1,360
Less: Capital expenditures, net ~(460)
Free cash flow ~$900
ADJUSTED EBITDA RECONCILIATION
2017 Guidance Range
Net income $500 - $525 Interest expense, net $365 - $375
Provision for income taxes $310 – $330Depreciation and amortization $665 – $675
Restructuring charges $60 – $70Stock-based compensation and other $100 - $105
Adjusted EBITDA $2,030 - $2,050

Co
pyr
igh
t ©
2016
Th
e N
iels
en C
om
pan
y.
27NLSN 4Q and FY 2016 Results
($ in millions)
2017 GUIDANCE NON-GAAP RECONCILIATIONS
2017 Guidance
Low% V Constant
Currency
2017 Guidance
High% V Constant
Currency2016 Constant
Currency
Total Revenue $6,578 5.0% $6,640 6.0% $6,265
Total Revenue Core $6,268 6.5% $6,326 7.5% $5,885
Total Revenue Core (ex. Gracenote)
$6,062 3.0% $6,120 4.0% $5,885
REVENUE RECONCILIATION

Co
pyr
igh
t ©
2016
Th
e N
iels
en C
om
pan
y.
28NLSN 4Q and FY 2016 Results
FREE CASH FLOW RECONCILIATION($ in millions)
Quarter EndedDecember 31,(Unaudited)
Year EndedDecember 31,(Unaudited)
2016 2015 2016 2015Net cash provided by operating activities $ 543 $ 401 $ 1,296 $ 1,209Plus: Non-recurring contribution to the Nielsen
Foundation — — 36 —Less: Capital expenditures, net (67) (95) (391) (401)Free cash flow $ 476 $ 306 $ 941 $ 808
Co
pyr
igh
t ©
2016
Th
e N
iels
en C
om
pan
y.
29NLSN 4Q and FY 2016 Results
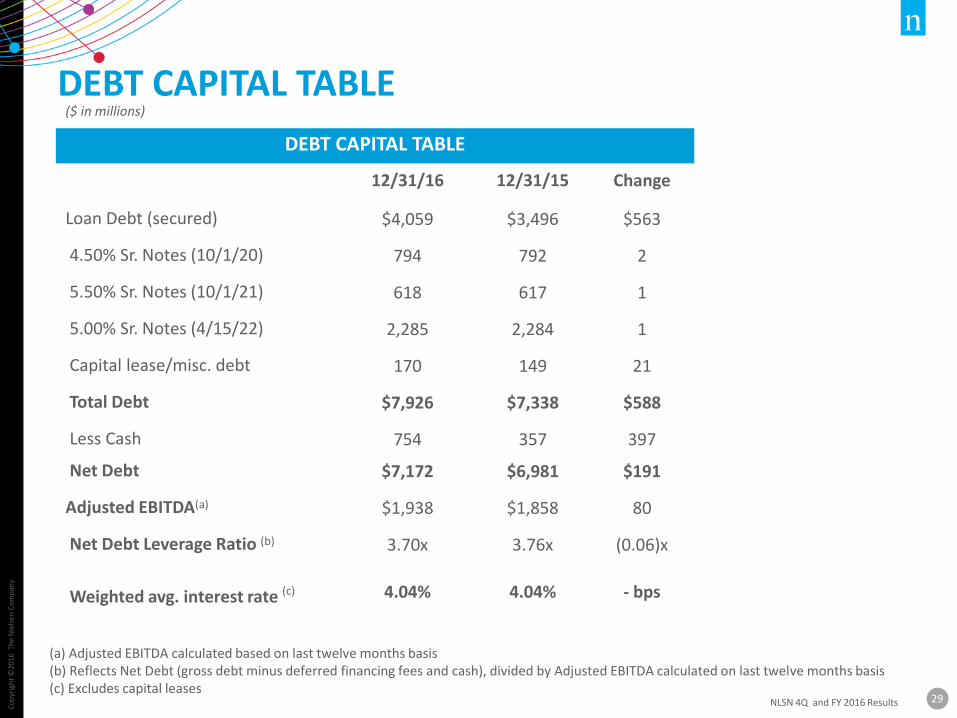
DEBT CAPITAL TABLE
(a) Adjusted EBITDA calculated based on last twelve months basis(b) Reflects Net Debt (gross debt minus deferred financing fees and cash), divided by Adjusted EBITDA calculated on last twelve months basis (c) Excludes capital leases
DEBT CAPITAL TABLE
12/31/16 12/31/15 Change
Loan Debt (secured) $4,059 $3,496 $563
4.50% Sr. Notes (10/1/20) 794 792 2
5.50% Sr. Notes (10/1/21) 618 617 1
5.00% Sr. Notes (4/15/22) 2,285 2,284 1
Capital lease/misc. debt 170 149 21
Total Debt $7,926 $7,338 $588
Less Cash 754 357 397
Net Debt $7,172 $6,981 $191
Adjusted EBITDA(a) $1,938 $1,858 80
Net Debt Leverage Ratio (b) 3.70x 3.76x (0.06)x
Weighted avg. interest rate (c) 4.04% 4.04% - bps
($ in millions)

Co
pyr
igh
t ©
2016
Th
e N
iels
en C
om
pan
y.
30NLSN 4Q and FY 2016 Results
SELECTED FINANCIAL METRICS & BALANCE SHEET ITEMS
FINANCIAL METRICS
4Q 16
Free Cash Flow $476
Capital Expenditures, net $67
D&A(c) $153
Net Book Interest $85
Cash Taxes $50
Cash Restructuring $20
Wtd. avg. diluted shares 359.7
BALANCE SHEET – 12/31/16
Gross Debt $7,926
Cash $754
Net Debt $7,172
Net Debt Leverage Ratio (a) 3.70x
CURRENT DEBT MATURITY PROFILE – 12/31/16 (b)
(a) Reflects net debt (gross debt minus deferred financing fees and cash), divided by Adjusted EBITDA calculated on last twelve months basis(b) Excludes Capital Leases ($158M) and other debt ($12M)(c) Includes $52 million of depreciation and amortization associated with tangible and intangible assets acquired in business combinations
($ in millions)
$138$278
$1,397
$814
$1,021
$2,323
$1,785
2017 2018 2019 2020 2021 2022 2023

+1.646.654.4602
http://ir.nielsen.com
Follow Nielsen
NIELSEN INVESTOR RELATIONS