4.0 experimental results & graphical behaviour of...
TRANSCRIPT

99
4.0 EXPERIMENTAL RESULTS & GRAPHICAL BEHAVIOUR OF RESULTS
TABLE 4.1 PHYSICAL PROPERTIES OF MATERIALS
Table 4.1.1 Physical properties of 53 grade Ordinary Portland Cement
S. No Physical property Test results of ultra tech –
OPCC (53 grade)
Requirements as per IS:
12269 - 1987
1 Standard consistency (%) 30 -
2 Setting time (a) Initial (min)
(b)Final (min)
120
320
30 (min)
600 (max)
3
Compressive strength (MPa)
(a) 3 days
(b) 7 days (c) 28 days
32
44
54
27 (min)
37 (min)
53 (min)
4
Fineness
(a) By sieving with IS sieve No.9 (%) (b) Blains permeability method
(m2/kg)
2
320
10
225 (min)
5 Specific gravity 3.10 -

100
Table 4.1.2. Sieve analysis of fine aggregate
(Weight of sample taken = 1000 gms)
S.No Sieve size Weight retained
(gms)
Percentage weight
retained
Cumulative % weight
retained Percentage passing
1 80mm 0 0 0 100
2 40mm 0 0 0 100
3 20mm 0 0 0 100
4 10mm 0 0 0 100
5 4.75mm 0 0 0 100
6 2.36mm 15 1.5 1.5 98.5
7 1.18mm 225 22.5 24 76.0
8 600 micron 39.6 39.6 63.6 36.40
9 300 micron 272 27.2 90.8 9.20
10 150 micron 850 8.50 99.4 0.60
11 pan - - - -
Sum of cumulative percentage weight retained 279.3
101
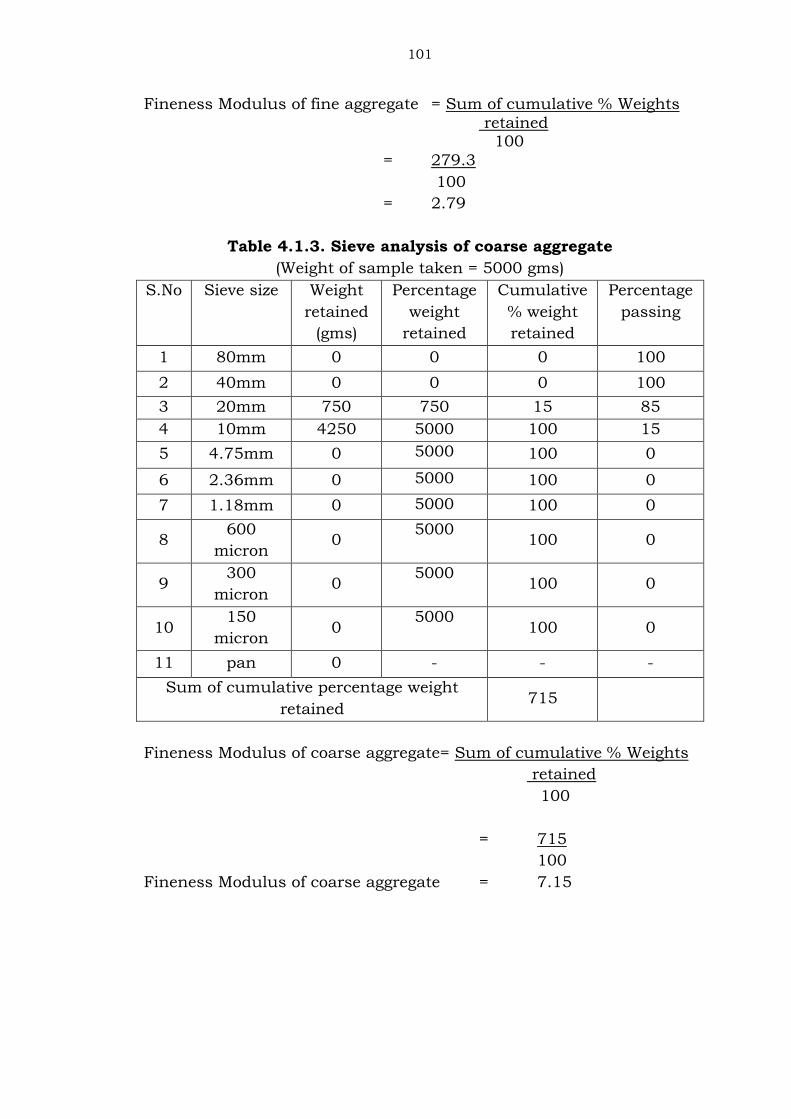
Fineness Modulus of fine aggregate = Sum of cumulative % Weights
retained 100
= 279.3
100
= 2.79
Table 4.1.3. Sieve analysis of coarse aggregate
(Weight of sample taken = 5000 gms)
S.No Sieve size Weight
retained
(gms)
Percentage
weight
retained
Cumulative
% weight
retained
Percentage
passing
1 80mm 0 0 0 100
2 40mm 0 0 0 100
3 20mm 750 750 15 85
4 10mm 4250 5000 100 15
5 4.75mm 0 5000 100 0
6 2.36mm 0 5000 100 0
7 1.18mm 0 5000 100 0
8 600
micron 0
5000 100 0
9 300
micron 0
5000 100 0
10 150
micron 0
5000 100 0
11 pan 0 - - -
Sum of cumulative percentage weight
retained 715
Fineness Modulus of coarse aggregate= Sum of cumulative % Weights
retained
100
= 715
100
Fineness Modulus of coarse aggregate = 7.15

102
Table 4.1.4. Properties of fine aggregate and coarse aggregate
S.
No
Properties of the
aggregate
Test results
of fine
aggregate
Test results
of coarse
aggregate
Indian Standard
1 Specific gravity 2.5 2.56 IS: 2386 – 1963
(Part-3)
2 Flakiness index - 8 % IS: 2386 – 1963
(Part-3)
3 Elongation index - 7.80% IS: 2386 – 1963
(Part-2)
4 Fineness modulus 2.79 7.15 IS: 2386 – 1963
(Part-2)
Table 4.1.5. Physical properties of Metakaolin (Obtained from 20
microns limited)
1 Average particle size 1.5 µm
2 B.E.T. surface area in m2/kg 15000
3 Pozzolanic reactivity mg Ca (OH)2/gm 1050
4 Specific gravity 2.50
5 Bulk density (gm/ltr) 300 + or – 30
6 Physical form Off-white powder

103
Table 4.1.6. Chemical composition of Metakaolin (Obtained from
20 microns limited)
1 SiO2 + Al2O3 + Fe2O3 96.88 %
2 CaO 0.39 %
3 MgO 0.08 %
4 TiO2 1.35 %
5 Na2O 0.56 %
6 K2O 0.06 %
7 Li2O Nil
8 L.O.I 0.68 %
Table 4.1.7. Properties of superplasticizer – Conplast SP430
(FOSROC)
S.No. Property Details
1 Colour & form Brown liquid
2 Based on Based on sulphonated naphthalene
polymers
3 Complies to
codes IS: 9103 – 1999 & BS: 5075 part 3
4 Water reduction Water reduction upto 25% without loss of
workability
5 Specific gravity 1.220 to 1.225 at 300C
6 Chloride content NIL
7 Air entrainment Approximately 1% additional air is
entrained
8 Compatibility Compatible with all types of cements
expect high alumina cement
9 Workability Can be used to produce flowing concrete
that requires no compaction
10 Cohesion
Cohesion is improved due to dispersion
of cement particles thus minimizing
segregation.
11 Dosage 0.50 to 2 liters per 100 Kg of cement
12 Dispensing
SP 430 + water mixture should be added
in the last phase after prewetting the mix
80% of the total water required

104
Table 4.1.8. Details of the crimped steel fibres (Obtained from Stewols India Pvt. Ltd)
S.No. Length of the
fibre
Diameter of the
fibre, mm
Aspect ratio of
the fibre Volume fraction %
Ultimate tensile
strength MPa
1 27 0.45 60 0.50,1.0,1.50 840
To
1250 2 36 0.45 80 0.50,1.0,1.50
TABLE 4.2 TRIAL MIXES OF OPC AND MK CONCRETE
Table 4.2.1 Trial mixes for OPC concrete of M20 grade
S.
No Mix ID
Water
/cement
ratio
Cement
(Kg/m3)
Water
(l/m3)
Fine
aggregate
(Kg/m3)
Coarse
aggregate
(Kg/m3)
Workabili
ty
(compacti
ng factor)
Compressive
strength of OPCC
(MPa)
7 days 28 days
1. Trail 1 0.55 380 209 567.40 1078.96 0.924 26.94 38.17
2. Trail 2 0.55 360 198 582.60 1082.0 0.940 25.04 35.10
3. Trail 3 0.55 340 187 597.90 1137.0 0.962 21.63 33.04
4. Trail 4 0.55 320 176 613.70 1166 0.976 20.16 30.69

105
Table 4.2.2. Trial mixes for OPC concrete of M50 grade
S.
No Mix ID
Water
cement
ratio
Cement
(Kg/m3)
Water
(l/m3)
Fine
aggregate
(Kg/m3)
Coarse
aggregate
(Kg/m3)
Super
plasticizer
(1% of
cement)
Workability
( compacting
factor)
Compressive
strength of OPCC
(MPa)
7 days 28 days
1. Trail 1 0.33 520 171.6 499.20 1372.80 5.2 0.816 54.39 79.64
2. Trail 2 0.33 510 168.3 489.60 1346.4 5.1 0.832 51.70 74.52
3. Trail 3 0.33 500 165.0 480.0 1320.0 5.0 0.854 49.14 70.82
4. Trail 4 0.33 480 158.4 460.80 1267.20 4.8 0.870 45.57 66.24
5. Trail 5 0.33 470 155.0 451.0 1240.0 4.7 0.892 43.50 61.40

106
Table 4.2.3. Mix proportions of OPC concrete of M20 grade
S. No Material Quantity of Material
1. Cement (Kg/m3) 320
2. Metakaolin (Kg/m3) 0
3. Water (Liters/m3) 176
4. Fine aggregate (Kg/m3) 613.70
5. Coarse aggregate (Kg/m3) 1166
6. Super plasticizer (SP 430) 0
7. Water Cement ratio (W/c ratio) 0.55
8. Workability (C.F) 0.976
The ratio of mix proportions of OPC Concrete of M20 grade are,
Cement : Fine Aggregate : Coarse aggregate
1 : 1.92 : 3.64

107
Table 4.2.4.Mix proportions of OPC concrete of M50 grade
S. No Material Quantity of Material
1. Cement (Kg/m3) 470
2. Metakaolin (Kg/m3) 0
3. Water (Liters/m3) 155
4. Fine aggregate (Kg/m3) 451
5. Coarse aggregate (Kg/m3) 1240
6. Super plasticizer (SP 430) 1.0% by weight of cement
7. Water Cement ratio (W/c ratio) 0.33
8. Workability (C.F) 0.892
The ratio of mix proportions of OPC Concrete of M50 grade are,
Cement : Fine Aggregate : Coarse aggregate:
1 : 0.96 : 2.64

108
Table 4.2.5. Trial mix proportions and compressive strength of Metakaolin concrete (M20 & M50 grade)
Grade of
Concrete
S.
No
Type of
Mix
Cement
(kg/m3)
(Cement %)
Metakaolin
(kg/m3)
(Metakaolin
%)
Water
(l/m3)
Fine
aggregat
e
(kg/m3)
Coarse
aggregate
(kg/m3)
Workability
(C.F)
Compressive
strength
(MPa)
28 days
M20
1 Normal 320 (100) 0.00 (0) 176 613.70 1160 0.967 30.69
2 MK (05) 304 (95) 16.0 (5) 176 613.70 1160 0.950 31.76
3 MK (10) 288 (90) 32.0 (10) 176 613.70 1160 0.930 32.86
4 MK (15) 272 (85) 48.0 (15) 176 613.70 1160 0.920 32.09
5 MK (20) 256 (80) 64.0 (20) 176 613.70 1160 0.912 31.14
6 MK (25) 240 (75) 80.0 (25) 176 613.70 1160 0.890 28.90
M50
1 Normal 470 (100) 0.00 (0) 155 451 1240 0.892 61.40
2 MK (05) 446.50 (95) 23.50 (5) 155 451 1240 0.874 65.78
3 MK (10) 423.0 (90) 47.0 (10) 155 451 1240 0.862 68.90
4 MK (15) 399.50 (85) 70.50 (15) 155 451 1240 0.850 66.80
5 MK (20) 376.0 (80) 94.0 (20) 155 451 1240 0.830 64.92
6 MK (25) 352.5 (75) 117.50 (25) 155 451 1240 0.812 56.36

109
Table 4.2.6. Quantities of materials required per 1 cu.m of OPCC, MKC, SFRC and SFRC-MK (M20)
S.
No Type of Mix
Cement
(kg/m3)
Metaka
olin
(kg/m3)
Fine
aggrega
te
(kg/m3)
Coarse
aggregate
(kg/m3)
Water
(kg/m3)
Super
plasticizer
(kg/m3)
(1% of
cementitio
us
material)
Quantity
of steel
fibres
(kg/m3)
Compressive
strength
(MPa)
1 OPC 320 0 1166 613.70 176 - - 30.69
2 MKC 288 32 1166 613.70 176 3.20 - 32.86
3 SFRC
(0.5 – 60) 320 0 1166 613.70 176 3.20 40 31.66
4 SFRC
(1.0 – 60) 320 0 1166 613.70 176 3.20 80 32.48
5 SFRC
(1.5 – 60) 320 0 1166 613.70 176 3.20 120 33.66
6 SFRC
(0.5 – 80) 320 0 1166 613.70 176 3.20 40 31.92
7 SFRC
(1.0 – 80) 320 0 1166 613.70 176 3.20 80 32.61
8 SFRC
(1.5 – 80) 320 0 1166 613.70 176 3.20 120 34.38

110
9 SFRC – MK
(0.5 – 60) 288 32 1166 613.70 176 3.20 40 34.12
10 SFRC –MK
(1.0 – 60) 288 32 1166 613.70 176 3.20 80 35.02
11 SFRC – MK
(1.5 – 60) 288 32 1166 613.70 176 3.20 120 35.86
12 SFRC – MK
(0.5 – 80) 288 32 1166 613.70 176 3.20 40 34.78
13 SFRC –MK
(1.0 – 80) 288 32 1166 613.70 176 3.20 80 35.54
14 SFRC – MK
(1.5 – 80) 288 32 1166 613.70 176 3.20 120 36.50

111
Table 4.2.7. Quantities of materials required per 1 cu.m of OPCC, MKC, SFRC and SFRC-MK (M50)
S.
No Type of Mix
Cement
(kg/m3)
Metaka
olin
(kg/m3)
Fine
aggrega
te
(kg/m3)
Coarse
aggregate
(kg/m3)
Water
(kg/m3)
Super
plasticizer
(kg/m3) (1%
of
cementitiou
s material)
Quantity
of steel
fibres
(kg/m3)
Compressive
strength MPa
1 OPC 470 0 1240 451 155 4.7 - 61.40
2 MKC 423 47 1240 451 155 4.7 - 68.90
3 SFRC
(0.5 – 60) 470 0 1240 451 155 4.7 40 63.81
4 SFRC
(1.0 – 60) 470 0 1240 451 155 4.7 80 65.86
5 SFRC
(1.5 – 60) 470 0 1240 451 155 4.7 120 67.72
6 SFRC
(0.5 – 80) 470 0 1240 451 155 4.7 40 65.18
7 SFRC
(1.0 – 80) 470 0 1240 451 155 4.7 80 66.86
8 SFRC
(1.5 – 80) 470 0 1240 451 155 4.7 120 69.04

112
9 SFRC – MK
(0.5 – 60) 423 47 1240 451 155 4.7 40 71.04
10 SFRC –MK
(1.0 – 60) 423 47 1240 451 155 4.7 80 72.80
11 SFRC – MK
(1.5 – 60) 423 47 1240 451 155 4.7 120 74.22
12 SFRC – MK
(0.5 – 80) 423 47 1240 451 155 4.7 40 72.58
13 SFRC –MK
(1.0 – 80) 423 47 1240 451 155 4.7 80 73.42
14 SFRC – MK
(1.5 – 80) 423 47 1240 451 155 4.7 120 75.68

113
TABLE 4.3 WORKABILITY STUDIES OF OPCC, MKC, SFRC & SFRC-MK MIXES OF M20
AND M50 GRADE
Table 4.3.1. Workability of OPCC & SFRC of M20 grade in terms of Compacting Factor and Slump
S.No Type of mix Compacting factor Slump in mm
1 OPC Concrete 0.976 95
2 SFRC (0.5-60) 0.950 60
3 SFRC (1.0-60) 0.925 40
4 SFRC (1.5-60) 0.890 32
5 SFRC (0.5-80) 0.935 50
6 SFRC (1.0-80) 0.910 35
7 SFRC (1.5-80) 0.886 25
Table 4.3.2. Workability of MKC & SFRC -MK of M20 grade in terms of Compacting Factor and Slump
S.No Type of mix Compacting factor Slump in mm
1 MK Concrete 0.930 65
2 SFRC-MK (0.5-60) 0.915 45
3 SFRC-MK (1.0-60) 0.905 32
4 SFRC-MK (1.5-60) 0.875 25
5 SFRC-MK (0.5-80) 0.90 40
6 SFRC-MK (1.0-80) 0.890 25
7 SFRC-MK (1.5-80) 0.865 20

114
Table 4.3.3. Workability of OPCC & SFRC of M50 grade in terms of Compacting Factor and Vee Bee time
S.No Type of mix Compacting factor Vee- Bee time in sec
1 OPC Concrete 0.892 19
2 SFRC (0.5-60) 0.860 26
3 SFRC (1.0-60) 0.834 50
4 SFRC (1.5-60) 0.810 68
5 SFRC (0.5-80) 0.838 34
6 SFRC (1.0-80) 0.806 58
7 SFRC (1.5-80) 0.782 94
Table 4.3.4. Workability of MKC & SFRC –MK of M50 grade in terms of Compacting Factor and Vee Bee time
S.No Type of mix Compacting factor Vee- Bee time in sec
1 MK Concrete 0.862 25
2 SFRC-MK (0.5-60) 0.794 40
3 SFRC-MK (1.0-60) 0.778 62
4 SFRC-MK (1.5-60) 0.752 106
5 SFRC-MK (0.5-80) 0.788 44
6 SFRC-MK (1.0-80) 0.766 72
7 SFRC-MK (1.5-80) 0.730 124

115
Table 4.3.5. Mix proportions and workability properties of OPCC, MKC, SFRC & SFRC-MK mixes of M20 and
M50 grade
Grade of
Concrete S. No Type of Mix
W/C
ratio
Compacting
factor (C.F) Mix proportion
M20
1 OPCC 0.55 0.976 1:1.92:3.64
2 MKC 0.55 0.930 1:1.92:3.64
3 SFRC (1.5%) (AR – 60) 0.55 0.890 1:1.92:3.64
4 SFRC (1.5%) (AR – 80) 0.55 0.880 1:1.92:3.64
5 SFRC –MK (1.5%) (AR – 60) 0.55 0.875 1:1.92:3.64
6 SFRC –MK (1.5%) (AR – 80) 0.55 0.866 1:1.92:3.64
M50
7 OPCC 0.33 0.892 1:0.96:2.64
8 MKC 0.33 0.862 1:0.96:2.64
9 SFRC (1.5%) (AR – 60) 0.33 0.812 1:0.96:2.64
10 SFRC (1.5%) (AR – 80) 0.33 0.782 1:0.96:2.64
11 SFRC –MK (1.5%) (AR – 60) 0.33 0.754 1:0.96:2.64
12 SFRC –MK (1.5%) (AR – 80) 0.33 0.730 1:0.96:2.64

116
TABLE 4.4. STRENGTH STUDIES ON OPCC, SFRC, MKC AND SFRC-MK MIXES OF M20 AND
M50 GRADE
Table 4.4.1. Strength studies on OPCC, SFRC, MKC and SFRC-MK mixes of M20 grade
Table 4.4.1.1. Compressive strength of OPCC & SFRC mixes of M20 Grade
S.
No Type of mix
Fibre
Content
(%)
Aspect
Ratio
(AR)
Fibre
Factor (F)
C.S
@ 7
days
(MPa)
C.S
@ 14
days
(MPa)
C.S
@ 28
days
(MPa)
% increase in C.S of SFRC
w.r.t. OPCC
7
days
14
days
28
days
1 OPC
Concrete 0 0 0 19.96 24.66 30.69 - - -
2 SFRC
(0.5-60) 0.5 60 0.225 20.30 25.31 31.66 1.70 2.63 3.16
3 SFRC
(1.0-60) 1.0 60 0.45 20.80 25.86 32.20 4.20 4.90 5.88
4 SFRC
(1.5-60) 1.5 60 0.675 21.02 26.15 33.10 5.30 6.04 7.52
5 SFRC
(0.5-80) 0.5 80 0.30 20.48 25.58 32.08 2.60 3.73 4.52
6 SFRC
(1.0-80) 1 80 0.60 21.12 26.20 32.91 5.31 6.24 7.23
7 SFRC
(1.5-80) 1.5 80 0.90 21.38 26.52 33.46 6.61 7.56 9.02

117
Table 4.4.1.2. Comparison of predicted compressive strength with experimental compressive strength of
OPCC & SFRC mixes of M20 Grade
Avg. Error = 0.80 % Mean = 0.992
S.No Type of mix
(Mix- ID)
Fibre
Content (%)
Aspect
ratio (AR)
Fibre
Factor
(F)
C.S.in MPa at
28 days from
experiment
( cs )
C.S.in MPa at
28 days from
proposed
equation
(edictedcs Pr,
)
cs
edictedcs
Pr,
1 OPC Concrete 0 0 0 30.69 30.69 1.00
2 SFRC(0.5-60) 0.5 60 0.225 31.66 31.42 0.992
3 SFRC(1.0-60) 1.0 60 0.45 32.48 32.14 0.989
4 SFRC(1.5-60) 1.5 60 0.675 33.66 32.86 0.996
5 SFRC(0.5-80) 0.5 80 0.30 31.92 31.57 0.984
6 SFRC(1.0-80) 1 80 0.60 32.61 32.48 0.987
7 SFRC(1.5-80) 1.5 80 0.90 34.10 33.37 0.997
118
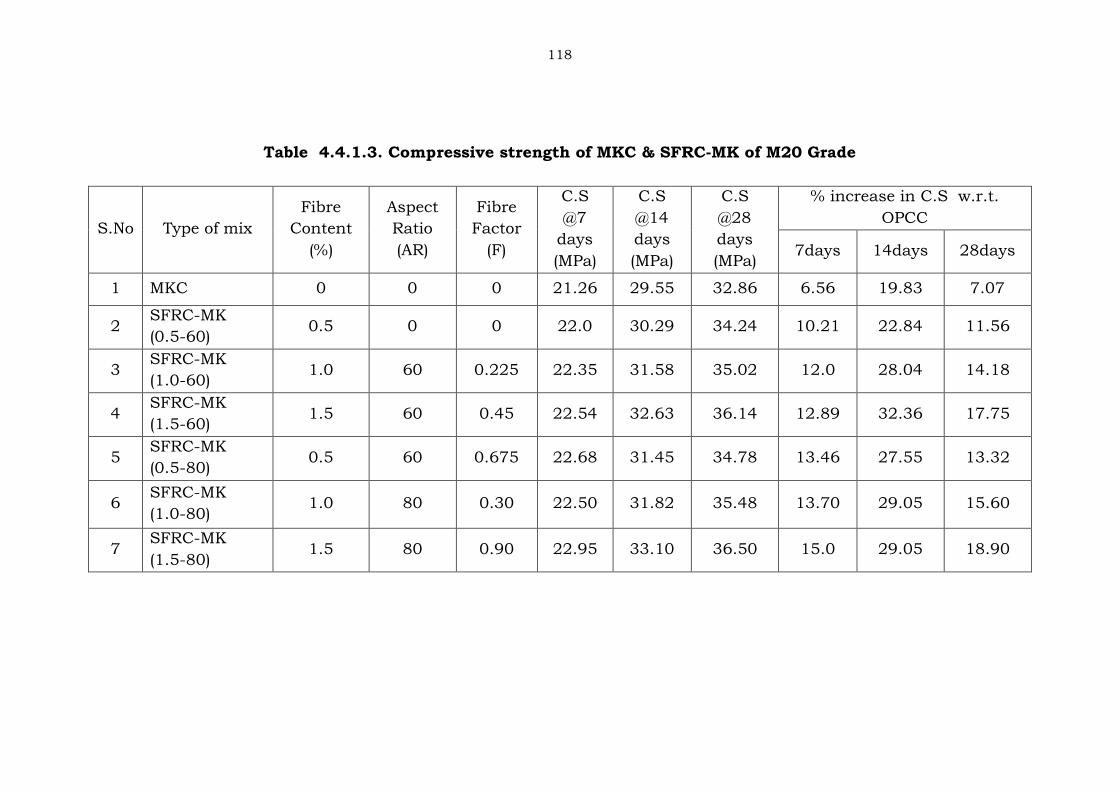
Table 4.4.1.3. Compressive strength of MKC & SFRC-MK of M20 Grade
S.No Type of mix
Fibre
Content
(%)
Aspect
Ratio
(AR)
Fibre
Factor
(F)
C.S
@7
days
(MPa)
C.S
@14
days
(MPa)
C.S
@28
days
(MPa)
% increase in C.S w.r.t.
OPCC
7days 14days 28days
1 MKC 0 0 0 21.26 29.55 32.86 6.56 19.83 7.07
2 SFRC-MK
(0.5-60) 0.5 0 0 22.0 30.29 34.24 10.21 22.84 11.56
3 SFRC-MK
(1.0-60) 1.0 60 0.225 22.35 31.58 35.02 12.0 28.04 14.18
4 SFRC-MK
(1.5-60) 1.5 60 0.45 22.54 32.63 36.14 12.89 32.36 17.75
5 SFRC-MK
(0.5-80) 0.5 60 0.675 22.68 31.45 34.78 13.46 27.55 13.32
6 SFRC-MK
(1.0-80) 1.0 80 0.30 22.50 31.82 35.48 13.70 29.05 15.60
7 SFRC-MK
(1.5-80) 1.5 80 0.90 22.95 33.10 36.50 15.0 29.05 18.90

119
Table 4.4.1.4. Comparison of predicted compressive strength with experimental compressive strength of MKC
& SFRC-MK mixes of M20 grade
S.No Type of mix
(Mix- ID)
Fibre
Content
(%)
Aspect
ratio
(AR)
Fibre
Factor
(F)
C.S.in MPa at
28 days from
experiment
)( csm
C.S.in MPa at
28 days from
proposed
equation
)(Pr, edictedcsm
csm
edictedcsm
Pr,
1 MK Concrete 0 0 0 32.86 32.86 1.00
2 SFRC-MK
(0.5-60) 0.5 60 0.225 34.12 33.74 0.986
3 SFRC-MK
(1.0-60) 1.0 60 0.45 35.02 34.68 0.988
4 SFRC-MK
(1.5-60) 1.5 60 0.675 35.86 35.57 0.989
5 SFRC-MK
(0.5-80) 0.5 80 0.30 34.78 33.97 0.977
6 SFRC-MK
(1.0-80) 1.0 80 0.60 35.54 35.13 0.981
7 SFRC-MK
(0.5-80) 1.5 80 0.90 36.58 36.22 0.992
Avg. Error =1.10% Mean = 0.989

120
Table 4.4.1.5. Compressive strength of OPCC & SFRC mixes of M50 grade
S.No Type of mix
Fibre
Content
(%)
Aspect
Ratio
(AR)
Fibre
Factor
(F)
C.S
@7
days
(MPa)
C.S
@14
days
(MPa)
C.S
@28
days
(MPa)
% increase in C.S of SFRC
w.r.t. OPCC
7days 14days 28days
1 OPC
Concrete 0 0 0 40.02 49.24 61.4 - - -
2 SFRC
(0.5-60) 0.5 60 0.225 41.17 50.98 63.81 2.88 3.54 3.92
3 SFRC
(1.0-60) 1.0 60 0.45 42.26 52.58 65.86 5.60 6.78 7.26
4 SFRC
(1.5-60) 1.5 60 0.675 42.56 53.05 67.72 6.36 7.74 10.29
5 SFRC
(0.5-80) 0.5 80 0.30 41.75 51.90 65.18 4.32 5.40 6.15
6 SFRC
(1.0-80) 1.0 80 0.60 43.05 53.82 66.86 7.57 9.26 8.90
7 SFRC
(1.5-80) 1.5 80 0.90 43.52 54.53 69.04 8.70 10.74 12.24

121
Table 4.4.1.6. Comparison of predicted compressive strength with experimental compressive strength of
OPCC & SFRC mixes of M50 grade
S.
No
Type of mix
(Mix- ID)
Fibre
Content (%)
Aspect
ratio (AR)
Fibre Factor
(F)
C.S.in MPa at 28
days from
experiment
( cs )
C.S.in MPa at 28
days from
proposed
equation
(edictedcs Pr,
)
cs
edictedcs
Pr,
1 OPC Concrete 0 0 0 61.40 61.40 1.00
2 SFRC
(0.5-60) 0.5 60 0.225 63.81 63.26 0.991
3 SFRC
(1.0-60) 1.0 60 0.45 65.86 65.12 0.988
4 SFRC
(1.5-60) 1.5 60 0.675 67.72 66.98 0.989
5 SFRC
(0.5-80) 0.5 80 0.30 65.18 63.88 0.980
6 SFRC
(1.0-80) 1.0 80 0.60 66.86 66.37 0.992
7 SFRC
(1.5-80) 1.5 80 0.90 69.04 68.85 0.997
Avg. Error = 1.10 % Mean = 0.989

122
Table 4.4.1.7. Compressive strength of MKC & SFRC-MK mixes of M50 grade
S.
No Type of mix
Fibre
Content
(%)
Aspect
Ratio
(AR)
Fibre
Factor
(F)
C.S
@7
days
(MPa)
C.S
@14
days
(MPa)
C.S
@28
days
(MPa)
% increase in C.S w.r.t.
OPCC
7days 14days 28days
1 OPC Concrete 0 0 0 40.02 49.54 61.40
2 MK
Concrete 0 0 0 44.08 62.40 68.90 10.15 26.0 12.22
3 SFRC-MK
(0.5-60) 0.5 60 0.225 45.96 64.28 71.54 14.85 29.76 15.70
4 SFRC-MK
(1.0-60) 1.0 60 0.45 46.90 65.86 72.78 17.20 32.93 18.53
5 SFRC-MK
(1.5-60) 1.5 60 0.675 47.08 66.86 74.0 17.52 34.98 20.87
6 SFRC-MK
(0.5-80) 0.5 80 0.30 46.23 65.22 72.58 15.52 31.65 18.20
7 SFRC-MK
(1.0-80) 1.0 80 0.60 47.23 66.62 73.42 18.02 34.48 19.57
8 SFRC-MK
(0.5-80) 1.5 80 0.90 47.96 67.72 75.15 19.86 36.68 23.25

123
Table 4.4.1.8. Comparison of predicted compressive strength with experimental compressive strength of MKC
& SFRC-MK mixes of M50 grade
S.No Type of mix
(Mix- ID)
Fibre
Content (%)
Aspect
ratio (AR)
Fibre
Factor (F)
C.S.in MPa at 28
days from
experiment
( csm )
C.S.in MPa at
28 days from
proposed
equation
)(Pr, edictedcsm
csm
edictedcsm
Pr,
1 MK Concrete 0 0 0 68.90 68.90 1.00
2 SFRC-MK
(0.5-60) 0.5 60 0.225 71.04 70.48 0.992
3 SFRC-MK
(1.0-60) 1.0 60 0.45 72.78 72.07 0.989
4 SFRC-MK
(1.5-60) 1.5 60 0.675 74.22 73.66 0.991
5 SFRC-MK
(0.5-80) 0.5 80 0.30 72.58 71.02 0.978
6 SFRC-MK
(1.0-80) 1.0 80 0.60 73.42 73.13 0.996
7 SFRC-MK
(0.5-80) 1.5 80 0.90 75.68 75.25 0.993
Avg. Error = 0.90 % Mean = 0.991

124
Table 4.4.2. Studies on Split tensile strength of OPCC, SFRC, MKC and SFRC-MK mixes of M20 and M50 grade
Table 4.4.2.1. Splitting tensile strength of OPCC & SFRC mixes of M20 grade
S.No Type of mix
(Mix- ID)
Fibre
Content (%)
Aspect
ratio (AR)
Fibre
Factor (F)
Splitting
Tensile
Strength @28
days (MPa)
( st )
% increase in
Spl. .Tensile
Strength w.r.t to
OPCC
Ratio of Spl.
Tensile Strength
to compressive
strength of OPCC
1 OPC Concrete 0 0 0 2.84 - 0.0925
2 SFRC (0.5-60) 0.5 60 0.225 3.32 16.90 0.1048
3 SFRC (1.0-60) 1.0 60 0.45 3.76 32.39 0.1151
4 SFRC (1.5-60) 1.5 60 0.675 4.35 54.22 0.1301
5 SFRC (0.5-80) 0.5 80 0.30 3.50 23.24 0.1091
6 SFRC (1.0-80) 1.0 80 0.60 4.25 49.65 0.1303
7 SFRC (1.5-80) 1.5 80 0.90 4.63 63.03 0.1346

125
Table 4.4.2.2. Comparison of predicted splitting tensile strength with experimental Splitting tensile strength
of OPCC & SFRC mixes of M20 grade
S.No Type of mix
(Mix- ID)
Fibre
Content
(%)
Aspect
ratio (AR)
Fibre
Factor (F)
Spl.tensile
strength in
MPa @ 28 days
from
experiment
( st )
Spl.tensile
strength in MPa @
28 days from
proposed equation
(edictedst Pr,
)
st
edictedst
Pr,
1 OPC Concrete 0 0 0 2.84 2.84 1.00
2 SFRC (0.5-60) 0.5 60 0.225 3.32 3.29 0.981
3 SFRC (1.0-60) 1.0 60 0.45 3.76 3.74 0.994
4 SFRC (1.5-60) 1.5 60 0.675 4.35 4.25 0.970
5 SFRC (0.5-80) 0.5 80 0.30 3.50 3.36 0.962
6 SFRC (1.0-80) 1.0 80 0.60 4.25 4.09 0.960
7 SFRC (1.5-80) 1.5 80 0.90 4.63 4.72 1.01
Avg. Error = 1.75 % Mean = 0.982

126
Table 4.4.2.3.Splitting tensile strength of MKC & SFRC-MK mixes of M20 grade
S.No Type of mix
(Mix- ID)
Fibre
Content (%)
Aspect
ratio (AR)
Fibre
Factor (F)
Splitting
Tensile
Strength
@28 days
(MPa)
( st )
% increase
in Spl.
Tensile
Strength
w.r.t to
OPCC
Ratio of Spl. Tensile
Strength to
Compressive strength
of OPCC
1 OPC Concrete 0 0 0 2.84 - 0.0925
2 MK Concrete 0 0 0 3.08 8.45 0.1004
3 SFRC-MK
(0.5-60) 0.5 60 0.225 3.42 20.42 0.1114
4 SFRC-MK
(1.0-60) 1.0 60 0.45 4.06 42.95 0.1322
5 SFRC-MK
(1.5-60) 1.5 60 0.675 4.50 58.45 0.1466
6 SFRC-MK
(0.5-80) 0.5 80 0.30 3.82 34.50 0.1244
7 SFRC-MK
(1.0-80) 1.0 80 0.60 4.38 54.22 0.1427
8 SFRC-MK
(0.5-80) 1.5 80 0.90 4.96 74.65 0.1616

127
Table 4.4.2.4. Comparison of predicted splitting tensile strength with experimental splitting tensile strength
of MKC & SFRC-MK mixes of M20 grade
S.No Type of mix
(Mix - ID)
Fibre
Content (%)
Aspect
ratio (AR)
Fibre
Factor (F)
Spl.tensile
strength in MPa
@ 28 days from
experiment
( stm )
Spl.tensile
strength in MPa
@ 28 days from
predicted
equation
(edictedstm Pr,
)
stm
edictedstm
Pr,
1 MK Concrete 0 0 0 3.08 3.08 1.00
2 SFRC-MK
(0.5-60) 0.5 60 0.225 3.42 3.55 1.03
3 SFRC-MK
(1.0-60) 1.0 60 0.45 4.06 4.04 0.971
4 SFRC-MK
(1.5-60) 1.5 60 0.675 4.50 4.51 0.963
5 SFRC-MK
(0.5-80) 0.5 80 0.30 3.82 3.72 1.00
6 SFRC-MK
(1.0-80) 1.0 80 0.60 4.38 4.35 0.962
7 SFRC-MK
(1.5-80) 1.5 80 0.90 4.96 4.99 1.00
Avg. Error =1 % Mean = 0.989

128
Table 4.4.2.5. Splitting tensile strength of OPCC & SFRC mixes of M50 grade
S.No Type of mix
(Mix- ID)
Fibre
Content (%)
Aspect
ratio (AR)
Fibre
Factor (F)
Splitting
Tensile
Strength @28
days (MPa)
( st )
% increase
in Spl.
.Tensile
Strength
w.r.t to
OPCC
Ratio of Spl.
Tensile Strength to
Compressive
strength of OPCC
1 OPC Concrete 0 0 0 4.32 - 0.0704
2 SFRC
(0.5-60) 0.5 60 0.225 5.28 22.22 0.0859
3 SFRC
(1.0-60) 1.0 60 0.45 6.02 39.35 0.0980
4 SFRC
(1.5-60) 1.5 60 0.675 6.72 55.56 0.1094
5 SFRC
(0.5-80) 0.5 80 0.30 5.50 27.31 0.0895
6 SFRC
(1.0-80) 1.0 80 0.60 6.53 51.15 0.1063
7 SFRC
(1.5-80) 1.5 80 0.90 7.22 67.12 0.1175

129
Table 4.4.2.6. Comparison of predicted splitting tensile strength with experimental splitting tensile strength
of OPCC & SFRC mixes of M50 grade
S.No
Type of mix
(Mix-ID)
Fibre
Content
(%)
Aspect
ratio (AR)
Fibre
Factor(F)
Splitting tensile
strength in MPa @
28 days from
experiment
( st )
Splitting tensile
strength in MPa @
28 days from
proposed equation
(edictedst Pr,
)
st
edictedst
Pr,
1 OPC Concrete 0 0 0 4.32 4.32 1.00
2 SFRC (0.5-60) 0.5 60 0.225 5.28 5.04 0.954
3 SFRC (1.0-60) 1.0 60 0.45 6.02 5.77 0.958
4 SFRC (1.5-60) 1.5 60 0.675 6.72 6.50 0.967
5 SFRC (0.5-80) 0.5 80 0.30 5.50 5.29 0.962
6 SFRC (1.0-80) 1.0 80 0.60 6.53 6.26 0.958
7 SFRC (1.5-80) 1.5 80 0.90 7.22 7.23 1.00
Avg. Error = 2.80 % Mean = 0.971

130
Table 4.4.2.7 Splitting tensile strength of MKC & SFRC-MK mixes of M50 grade
S.No Type of mix
(Mix- ID)
Fibre
Content (%)
Aspect
ratio (AR)
Fibre
Factor (F)
Splitting
Tensile
Strength @28
days (MPa)
( stm )
% increase in
Spl. .Tensile
Strength w.r.t
to OPCC
Ratio of Spl.
Tensile Strength to
Compressive
strength of OPCC
1 MK Concrete 0 0 0 4.76 10.19 0.077
2 SFRC-MK
(0.5-60) 0.5 60 0.225 5.65 30.78 0.0920
3 SFRC-MK
(1.0-60) 1.0 60 0.45 6.38 47.68 0.1039
4 SFRC-MK
(1.5-60) 1.5 60 0.675 7.41 71.52 0.1206
5 SFRC-MK
(0.5-80) 0.5 80 0.30 6.20 43.51 0.1009
6 SFRC-MK
(1.0-80) 1.0 80 0.60 6.90 59.72 0.1123
7 SFRC-MK
(1.5-80) 1.5 80 0.90 7.69 78.00 0.1252
131
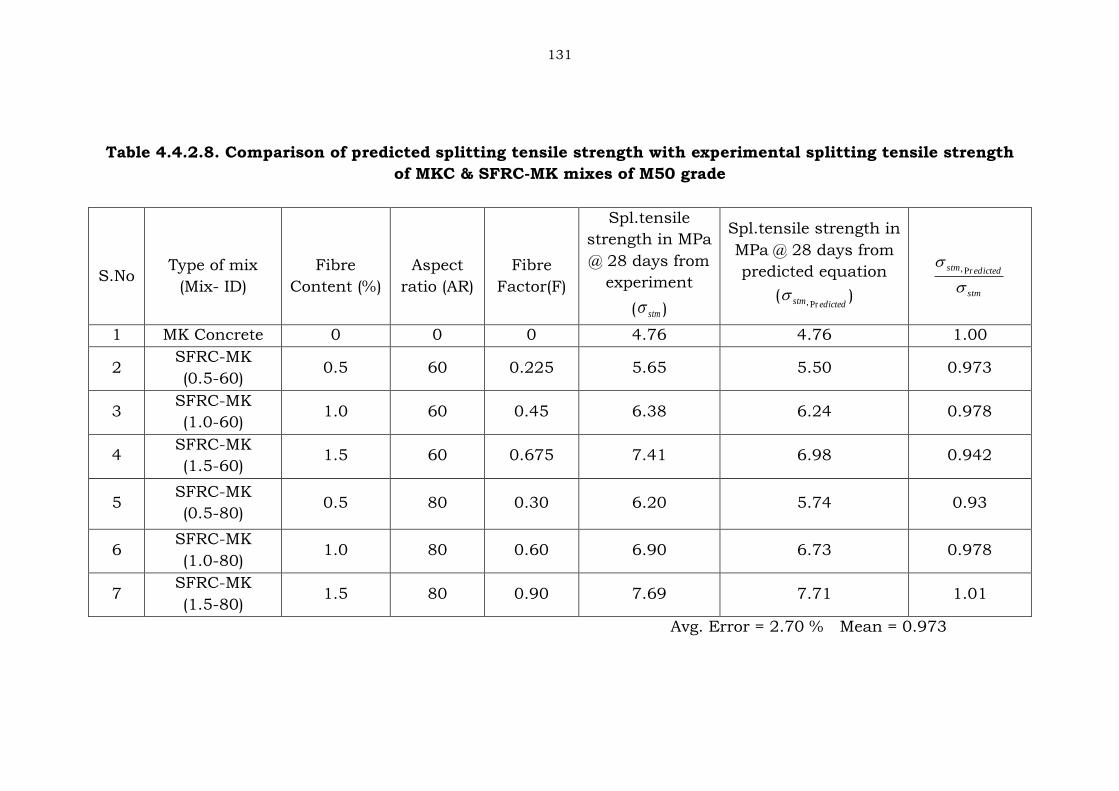
Table 4.4.2.8. Comparison of predicted splitting tensile strength with experimental splitting tensile strength
of MKC & SFRC-MK mixes of M50 grade
S.No
Type of mix
(Mix- ID)
Fibre
Content (%)
Aspect
ratio (AR)
Fibre
Factor(F)
Spl.tensile
strength in MPa
@ 28 days from
experiment
( stm )
Spl.tensile strength in
MPa @ 28 days from
predicted equation
(edictedstm Pr,
)
stm
edictedstm
Pr,
1 MK Concrete 0 0 0 4.76 4.76 1.00
2 SFRC-MK
(0.5-60) 0.5 60 0.225 5.65 5.50 0.973
3 SFRC-MK
(1.0-60) 1.0 60 0.45 6.38 6.24 0.978
4 SFRC-MK
(1.5-60) 1.5 60 0.675 7.41 6.98 0.942
5 SFRC-MK
(0.5-80) 0.5 80 0.30 6.20 5.74 0.93
6 SFRC-MK
(1.0-80) 1.0 80 0.60 6.90 6.73 0.978
7 SFRC-MK
(1.5-80) 1.5 80 0.90 7.69 7.71 1.01
Avg. Error = 2.70 % Mean = 0.973

132
Table 4.4.3. Studies on Modulus of rupture of OPCC, SFRC, MKC and SFRC-MK mixes of M20 and M50
grade
Table 4.4.3.1. Modulus of Rupture of OPCC & SFRC mixes of M20 grade
S.No Type of Mix
(Mix-ID)
Fibre
Content
(%)
Aspect
Ratio
(AR)
Fibre
Factor (F)
Modulus of
Rupture
@28 days
in MPa
( rf )
% increase in
Modulus of
Rupture w.r.t.
OPCC
Ratio of Modulus of Rupture to
Compressive
Strength
Splitting
tensile
strength
1 OPC Concrete 0 0 0 4.03 - 0.131 1.42
2 SFRC
(0.5-60) 0.5 60 0.225 4.76 15.33 0.155 1.67
3 SFRC
(1.0-60) 1.0 60 0.45 5.44 25.90 0.177 1.91
4 SFRC
(1.5-60) 1.5 60 0.675 6.10 33.94 0.198 2.14
5 SFRC
(0.5-80) 0.5 80 0.30 5.08 20.66 0.165 1.78
6 SFRC
(1.0-80) 1.0 80 0.60 5.76 30.00 0.187 2.02
7 SFRC
(1.5-80) 1.5 80 0.90 6.72 40.70 0.218 2.36

133
Table 4.4.3.2. Comparison of Predicted Modulus of Rupture with experimental Modulus of Rupture of OPCC &
SFRC mixes of M20 grade
S.
No
Type of mix
(Mix- ID)
Fibre
Content
(%)
Aspect
ratio
(AR)
Fibre
Factor
(F)
Modulus of Rupture
in MPa @ 28 days
from experiment
( rf )
Modulus of Rupture in
MPa @ 28 days from
proposed equation
edictedrf
Pr,
rf
edictedrf
Pr,
1 OPC Concrete 0 0 0 4.03 4.03 1.00
2 SFRC
(0.5-60) 0.5 60 0.225 4.76 4.69 0.985
3 SFRC
(1.0-60) 1.0 60 0.45 5.44 5.34 0.982
4 SFRC
(1.5-60) 1.5 60 0.675 6.10 6.00 0.984
5 SFRC
(0.5-80) 0.5 80 0.30 5.08 4.90 0.965
6 SFRC
(1.0-80) 1.0 80 0.60 5.76 5.79 1.00
7 SFRC
(1.5-80) 1.5 80 0.90 6.72 6.66 0.991
Avg. Error = 1.32% Mean = 0.9

134
Table 4.4.3.3. Modulus of Rupture of MKC & SFRC-MK mixes of M20 grade
S.
No
Type of Mix
(Mix- ID)
Fibre
Content (%)
Aspect
Ratio (AR)
Fibre
Factor (F)
Modulus of
Rupture @28
days in MPa
)( rsm
Ratio of
Modulus of
Rupture
w.r.t C.S of
OPCC
Ratio of
Modulus of
Rupture to
Splitting
tensile
strength of
OPCC
% increase in
Modulus of
Rupture of
SFRC-MK
w.r.t OPCC
1 OPC
Concrete 0 0 0 4.03 0.131 1.41 -
2 MK Concrete 0 0 0 4.26 0.138 1.50 5.40
3 SFRC-MK
(0.5-60) 0.5 60 0.225 4.87 0.158 1.71 17.30
4 SFRC-MK
(1.0-60) 1.0 60 0.45 5.66 0.184 1.99 28.80
5 SFRC-MK
(1.5-60) 1.5 60 0.675 6.46 0.210 2.27 37.60
6 SFRC-MK
(0.5-80) 0.5 80 0.30 5.12 0.166 1.80 21.30
7 SFRC-MK
(1.0-80) 1.0 80 0.60 6.31 0.205 2.22 36.20
8 SFRC-MK
(1.5-80) 1.5 80 0.90 6.90 0.224 2.42 41.60

135
Table 4.4.3.4. Comparison of predicted Modulus of Rupture with experimental Modulus of Rupture of MKC &
SFRC-MK mixes of M20 grade
S.No
Type of mix
(Mix- ID)
Fibre
Content
(%)
Aspect
ratio (AR)
Fibre
Factor (F)
Modulus of
Rupture in
MPa @28 days
from
experiment
)( rsm
Modulus of Rupture
in MPa @ 28 days
from predicted
equation
(edictedrsm Pr,
)
rm
edictedrsm
Pr,
1 MK Concrete 0 0 0 4.26 4.26 1.00
2 SFRC-MK
(0.5-60) 0.5 60 0.225 4.87 4.96 1.01
3 SFRC-MK
(1.0-60) 1.0 60 0.45 5.66 5.66 1.00
4 SFRC-MK
(1.5-60) 1.5 60 0.675 6.46 6.37 0.986
5 SFRC-MK
(0.5-80) 0.5 80 0.30 5.12 5.18 1.01
6 SFRC-MK
(1.0-80) 1.0 80 0.60 6.31 6.13 0.971
7 SFRC-MK
(1.5-80) 1.5 80 0.90 6.90 7.07 `1.02
Avg. Error = 0.1% Mean = 0.999

136
Table 4.4.3.5. Modulus of Rupture of OPCC & SFRC mixes of M50 grade
S.No Type of Mix
(Mix- ID)
Fibre
Content
(%)
Aspect
Ratio (AR)
Fibre
Factor (F)
Modulus of
Rupture
@28 days in
MPa )( rf
Ratio of
Modulus of
Rupture
w.r.t C.S of
OPCC
Ratio of
Modulus of
Rupture to
Splitting
tensile
strength of
OPCC
%increase in
Modulus of
Rupture of
SFRC w.r.t
OPCC
1 OPC Concrete 0 0 0 5.42 0.088 1.25 -
2 SFRC
(0.5-60) 0.5 60 0.225 6.48 0.105 1.50 16.35
3 SFRC
(1.0-60) 1.0 60 0.45 7.50 0.122 1.73 27.80
4 SFRC
(1.5-60) 1.5 60 0.675 8.64 0.1400 1.99 37.30
5 SFRC
(0.5-80) 0.5 80 0.30 6.80 0.0.111 1.57 20.30
6 SFRC
(1.0-80) 1.0 80 0.60 8.32 0.135 1.92 34.90
7 SFRC
(1.5-80) 1.5 80 0.90 9.15 0.1490 2.11 40.80

137
Table 4.4.3.6. Comparison of predicted Modulus of Rupture with experimental Modulus of Rupture of OPCC &
SFRC mixes of M50 grade
S.No
Type of mix
(Mix- ID)
Fibre
Content
(%)
Aspect
ratio (AR)
Fibre
Factor
(F)
Modulus of
Rupture in MPa
@28 days from
experiment
)( rf
Modulus of Rupture
in MPa @ 28 days
from predicted
equation
(edicted
rfPr,
)
rf
edictedrf
Pr,
1 OPC Concrete 0 0 0 5.42 5.42 1.00
2 SFRC (0.5-60) 0.5 60 0.225 6.48 6.39 0.986
3 SFRC (1.0-60) 1.0 60 0.45 7.50 7.36 0.981
4 SFRC (1.5-60) 1.5 60 0.675 8.60 8.34 0.970
5 SFRC (0.5-80) 0.5 80 0.30 6.82 6.71 0.984
6 SFRC (1.0-80) 1.0 80 0.60 8.30 8.01 0.965
7 SFRC (1.5-80) 1.5 80 0.90 9.15 9.31 1.02
Avg. Error = 1.2 % Mean = 0.987

138
Table 4.4.3.7. Modulus of Rupture of MKC & SFRC-MK mixes of M50 grade
S.No Type of Mix
(Mix- ID)
Fibre
Content
(%)
Aspect
Ratio
(AR)
Fibre
Factor (F)
Modulus of
Rupture
@28 days in
MPa
)( rsm
Ratio of
Modulus of
Rupture
w.r.t C.S of
OPCC
Ratio of
Modulus of
Rupture to
Splitting
tensile
strength
% increase in
Modulus of
Rupture of
SFRC-MK
w.r.t OPCC
1 MK Concrete 0 0 0 5.80 0.095 1.33 6.55
2 SFRC-MK
(0.5-60) 0.5 60 0.225 6.81 0.1109 1.54 20.40
3 SFRC-MK
(1.0-60) 1.0 60 0.45 7.96 0.129 1.80 31.90
4 SFRC-MK
(1.5-60) 1.5 60 0.675 9.21 0.150 2.08 41.15
5 SFRC-MK
(0.5-80) 0.5 80 0.30 7.33 0.119 1.65 26.05
6 SFRC-MK
(1.0-80) 1.0 80 0.60 8.34 0.136 1.88 35.00
7 SFRC-MK
(1.5-80) 1.5 80 0.90 9.72 0.160 2.19 44.20

139
Table 4.4.3.8. Comparison of predicted Modulus of Rupture with experimental Modulus of Rupture of MKC &
SFRC-MK mixes of M50 grade
S. No
Type of mix
(Mix- ID)
Fibre
Content
(%)
Aspect
ratio (AR)
Fibre
Factor (F)
Modulus of
Rupture in MPa
@28 days from
experiment
( rsm )
Modulus of Rupture
in MPa @ 28 days
from predicted
equation
(edictedrsm Pr,
)
rsm
edictedrsm
Pr,
1 MK Concrete 0 0 0 5.87 5.87 1.0
2 SFRC-MK
(0.5-60) 0.5 60 0.225 6.81 6.87 1.00
3 SFRC-MK
(1.0-60) 1.0 60 0.45 7.96 7.88 0.988
4 SFRC-MK
(1.5-60) 1.5 60 0.675 9.21 8.89 0.965
5 SFRC-MK
(0.5-80) 0.5 80 0.30 7.33 7.21 0.984
6 SFRC-MK
(1.0-80) 1 80 0.60 8.34 8.55 1.02
7
SFRC-MK
(1.5-80) 1.5 80 0.90 9.82 9.90 1.01
Avg. error = 0.5 % Mean = 0.995

140
Table 4.4.4. Studies on Modulus of Elasticity of OPCC, SFRC, MKC and SFRC-MK mixes of M20 and M50 grade
Table 4.4.4.1. Modulus of Elasticity of OPCC & SFRC mixes of M20 grade
S.No Type of Mix
(Mix -ID)
Fibre Content
(%)
Aspect Ratio
(AR)
Fibre Factor
(F)
Modulus of
Elasticity @28 days
in GPa (Es)
% increase in Modulus
of Elasticity of SFRC
w.r.t OPCC
1 OPC Concrete 0 0 0 24.32 -
2 SFRC
(0.5-60) 0.5 60 0.225 25.04 2.96
3 SFRC
(1.0-60) 1.0 60 0.45 25.62 5.34
4 SFRC
(1.5-60) 1.5 60 0.675 26.68 9.70
5 SFRC
(0.5-80) 0.5 80 0.30 25.59 5.22
6 SFRC
(1.0-80) 1.0 80 0.60 26.25 7.93
7 SFRC
(1.5-80) 1.5 80 0.90 27.20 11.84

141
Table 4.4.4.2. Comparison of predicted Modulus of Elasticity with experimental Modulus of Elasticity of OPCC
& SFRC mixes of M20 grade
S.No
Type of mix
(Mix ID)
Fibre
Content
(%)
Aspect
ratio (AR)
Fibre
Factor (F)
Modulus of
Elasticity of
SFRC in GPa
@28 days from
experiment (Es)
Modulus of Elasticity
of SFRC in GPa @ 28
days from proposed
equation
Es Predicted
s
edicteds
E
EPr
1 OPC Concrete 0 0 0 24.32 24.32 1.00
2 SFRC
(0.5-60) 0.5 60 0.225 25.04 25.04 1.0
3 SFRC
(1.0-60) 1.0 60 0.45 25.72 25.81 1.0
4 SFRC
(1.5-60) 1.5 60 0.675 26.68 26.48 0.992
5 SFRC
(0.5-80) 0.5 80 0.30 25.59 25.28 0.985
6 SFRC
(1.0-80) 1.0 80 0.60 26.25 26.17 0.997
7 SFRC
(1.5-80) 1.5 80 0.90 27.20 27.12 0.997
Avg. error = 0.5% Mean = 0.995

142
Table 4.4.4.3. Modulus of Elasticity of MKC & SFRC-MK mixes of M20 grade
S.No
Type of Mix
(Mix- ID)
Fibre
Content (%)
Aspect
Ratio (AR)
Fibre
Factor (F)
Modulus of
Elasticity of
SFRC-MK
@28 days in
GPa )(Esm
% increase in
Modulus of
Elasticity of
SFRC-MK w.r.t
OPCC
% increase in
Modulus of
Elasticity of
SFRC-MK w.r.t
MKC
1 OPC Concrete 0 0 0 24.32 - -
2 MK Concrete 0 0 0 25.43 4.82 -
3 SFRC-MK
(0.5-60) 0.5 60 0.225 26.24 8.16 3.18
4 SFRC-MK
(1.0-60) 1.0 60 0.45 27.06 11.26 6.41
5 SFRC-MK
(1.5-60) 1.5 60 0.675 27.44 13.10 7.90
6 SFRC-MK
(0.5-80) 0.5 80 0.30 26.58 9.29 4.52
7 SFRC-MK
(1.0-80) 1.0 80 0.60 27.25 12.04 7.18
8 SFRC-MK
(1.5-80) 1.5 80 0.90 27.90 14.72 9.71

143
Table 4.4.4.4. Comparison of predicted Modulus of Elasticity with experimental
Modulus of Elasticity of MKC & SFRC-MK mixes of M20 grade
S.No
Type of mix
(Mix ID)
Fibre
Content
(%)
Aspect
ratio (AR)
Fibre
Factor (F)
Modulus of
Elasticity of
SFRC in GPa
@28 days from
experiment
( Esm )
Modulus of Elasticity
of SFRC in GPa @ 28
days from predicted
equation
(E sm , Predicted)
sm
edictedsm
E
E Pr,
1 MK Concrete 0 0 0 25.43 25.43 1.0
2 SFRC-MK
(0.5-60) 0.5 60 0.225 26.24 26.03 0.990
3 SFRC-MK
(1.0-60) 1.0 60 0.45 27.06 26.64 0.984
4 SFRC-MK
(1.5-60) 1.5 60 0.675 27.44 27.20 0.99
5 SFRC-MK
(0.5-80) 0.5 80 0.30 26.58 26.24 0.987
6 SFRC-MK
(1.0-80) 1.0 80 0.90 27.25 27.04 0.989
7 SFRC-MK
(1.5-80) 1.5 80 0.90 27.90 27.85 0.998
Avg. Error = 1.01 % Mean = 0.990

144
Table 4.4.4.5. Modulus of Elasticity of OPCC & SFRC mixes of M50 grade
S.No Type of Mix
(Mix -ID)
Fibre Content
(%)
Aspect Ratio
(AR)
Fibre Factor
(F)
Modulus of
Elasticity @28
days in GPa (Es)
% increase in Modulus
of Elasticity of SFRC
w.r.t OPCC
1 OPC Concrete 0 0 0 33.88 -
2 SFRC
(0.5-60) 0.5 60 0.225 35.50 4.78
3 SFRC
(1.0-60) 1.0 60 0.45 36.52 7.79
4 SFRC
(1.5-60) 1.5 60 0.675 37.70 11.27
5 SFRC
(0.5-80) 0.5 80 0.30 36.39 7.40
6 SFRC
(1.0-80) 1.0 80 0.60 37.04 9.32
7 SFRC
(1.5-80) 1.5 80 0.90 38.34 13.16

145
Table 4.4.4.6. Comparison of predicted Modulus of Elasticity with experimental Modulus of Elasticity of OPCC
& SFRC mixes of M50 grade
S.No
Type of mix
(Mix- ID)
Fibre
Content
(%)
Aspect
ratio (AR)
Fibre
Factor (F)
Modulus of
Elasticity of
SFRC in GPa
@28 days from
experiment
(Es)
Modulus of Elasticity
of SFRC in GPa @
28 days from
proposed equation
(Es Predicted)
s
edicteds
E
EPr
1 OPC Concrete 0 0 0 33.88 33.88 1.00
2 SFRC (0.5-60) 0.5 60 0.225 35.50 34.93 0.983
3 SFRC (1.0-60) 1.0 60 0.45 36.52 35.99 0.985
4 SFRC (1.5-60) 1.5 60 0.675 37.70 37.04 0.982
5 SFRC (0.5-80) 0.5 80 0.30 36.39 35.28 0.969
6 SFRC (1.0-80) 1.0 80 0.60 37.04 36.69 0.990
7 SFRC (1.5-80) 1.5 80 0.90 38.34 37.25 0.972
Avg. Error = 1.70 % Mean = 0.983

146
Table 4.4.4.7. Modulus of Elasticity of MKC & SFRC-MK mixes of M50 grade
S.No Type of Mix
(Mix ID)
Fibre
Content (%)
Aspect
Ratio (AR)
Fibre
Factor (F)
Modulus of
Elasticity of
SFRC-MK @28
days in GPa
(Esm)
% increase in
Modulus of
Elasticity of
SFRC-MK w.r.t
OPCC
% increase in
Modulus of
Elasticity of
SFRC-MK w.r.t
MKC
1 OPC Concrete 0 0 0 33.88 - -
2 MK Concrete 0 0 0 36.32 7.20 -
3 SFRC-MK
(0.5-60) 0.5 60 0.225 37.08 9.44 2.09
4 SFRC-MK
(1.0-60) 1.0 60 0.45 38.44 13.45 5.83
5 SFRC-MK
(1.5-60) 1.5 60 0.675 39.48 16.52 8.70
6 SFRC-MK
(0.5-80) 0.5 80 0.30 37.92 11.92 4.40
7 SFRC-MK
(1.0-80) 1.0 80 0.60 39.02 15.17 7.43
8 SFRC-MK
(1.5-80) 1.5 80 0.90 40.28 18.90 10.90

147
Table 4.4.4.8. Comparison of predicted Modulus of Elasticity with experimental Modulus of Elasticity of MKC
& SFRC-MK mixes of M50 grade
S.No
Type of mix
(Mix- ID)
Fibre
Content
(%)
Aspect
ratio (AR)
Fibre
Factor (F)
Modulus of
Elasticity of
SFRC in GPa
@28 days from
experiment
( Esm )
Modulus of
Elasticity of SFRC
in GPa @ 28 days
from predicted
equation
(E sm Predicted)
sm
edictedsm
E
E Pr,
1 MK Concrete 0 0 0 36.32 36.32 1.00
2 SFRC-MK
(0.5-60) 0.5 60 0.225 37.08 37.32 1.00
3 SFRC-MK
(1.0-60) 1.0 60 0.45 38.44 38.33 0.987
4 SFRC-MK
(1.5-60) 1.5 60 0.675 39.48 39.32 0.995
5 SFRC-MK
(0.5-80) 0.5 80 0.30 37.92 37.66 0.990
6 SFRC-MK
(1.0-80) 1.0 80 0.60 39.02 39.02 0.985
7 SFRC-MK
(1.5-80) 1.5 80 0.90 40.28 40.02 0.994
Avg. error = 1.70 % Mean = 0.983

148
Table 4.4.5. Studies on Impact resistance of OPCC, SFRC, MKC and SFRC-MK mixes of M20 and M50
grade
Table 4.4.5.1. Impact Resistance of OPCC & SFRC mixes of M20 grade
S.No Type of Mix
(Mix- ID)
Fibre
Content (%)
Aspect
Ratio (AR)
Fibre
Factor (F)
Impact Resistance of
SFRC @28 days
(No. of blows)
% Increase in Impact
resistance of SFRC w.r.t
OPCC
At Ist
Crack
At failure At Ist
Crack
At failure
1 OPC Concrete 0 0 0 10 18 - -
2 SFRC (0.5-60) 0.5 60 0.225 26 70 61.50 74.30
3 SFRC (1.0-60) 1.0 60 0.45 43 119 76.80 84.00
4 SFRC (1.5-60) 1.5 60 0.675 64 198 84.50 90.90
5 SFRC (0.5-80) 0.5 80 0.30 30 90 66.67 80.00
6 SFRC (1.0-80) 1.0 80 0.60 57 156 82.50 88.50
7 SFRC (1.5-80) 1.5 80 0.90 76 218 86.80 91.80

149
Table 4.4.5.2. Comparison of predicted Impact resistance with experimental Impact resistance of OPCC &
SFRC mixes of M20 grade
S.No Type of Mix
(Mix- ID)
Fibre
Content
(%)
Aspect
Ratio (AR)
Fibre
Factor (F)
Impact Resistance of
SFRC @28 days
(No. of blows)
(experimental) (Is)
Impact Resistance of
SFRC @28 days
(No. of blows)
(predicted) (Is,pred)
Is,pred
Is
1 OPC Concrete 0 0 0 18 18 1.00
2 SFRC
(0.5-60) 0.5 60 0.225 70 72.67 1.038
3 SFRC
(1.0-60) 1.0 60 0.45 119 127.35 1.067
4 SFRC
(1.5-60) 1.5 60 0.675 198 182.02 0.919
5 SFRC
(0.5-80) 0.5 80 0.30 90 90.92 1.00
6 SFRC
(1.0-80) 1.0 80 0.60 156 163.80 1.04
7 SFRC
(1.5-80) 1.5 80 0.90 218 236.70 1.08
Avg..Error = 1.90 % Mean = 1.019

150
Table 4.4.5.3. Impact Resistance of MKC & SFRC-MK mixes of M20 grade
S.No Type of Mix
(Mix- ID)
Fibre
Content (%)
Aspect Ratio
(AR)
Fibre
Factor (F)
Impact Resistance of
SFRC @ 28 days
(No. of blows)
% Increase in Impact
resistance of SFRC-MK
w.r.t. OPCC
At Ist
Crack At failure
At Ist
Crack At Failure
1 MK Concrete 0 0 0 08 11 - -
2 SFRC-MK
(0.5-60) 0.5 60 0.225 47 110 78.70 83.60
3 SFRC-MK
(1.0-60) 1.0 60 0.45 110 228 90.90 92.10
4 SFRC-MK
(1.5-60) 1.5 60 0.675 168 332 94.00 94.60
5 SFRC-MK
(0.5-80) 0.5 80 0.30 69 145 85.50 87.60
6 SFRC-MK
(1.0-80) 1.0 80 0.60 149 323 93.30 94.40
7 SFRC-MK
(1.5-80) 1.5 80 0.90 203 416 95.10 95.67

151
Table 4.4.5.4. Comparison of Predicted Impact resistance with experimental Impact resistance of MKC&
SFRC-MK mixes of M20 grade
S.No Type of Mix
(Mix- ID)
Fibre
Content
(%)
Aspect
Ratio
(AR)
Fibre
Factor (F)
Impact Resistance
of SFRC @ 28 days
(No. of blows)
(experimental) Ism
Impact Resistance
of SFRC @ 28 days
(No. of blows)
(predicted) Ism,pred
Ism,pred
Ism
1 OPC Concrete 0 0 0 11 11 1.00
2 SFRC
(0.5-60) 0.5 60 0.225 110 114.72 1.04
3 SFRC
(1.0-60) 1.0 60 0.45 228 218.45 0.958
4 SFRC
(1.5-60) 1.5 60 0.675 332 320.79 0.966
5 SFRC
(0.5-80) 0.5 80 0.30 145 149.3 1.03
6 SFRC
(1.0-80) 1.0 80 0.60 302 287.6 0.954
7 SFRC
(1.5-80) 1.5 80 0.90 416 425.9 1.02
Avg.Error = 0.50 % Mean = 0.995

152
Table 4.4.5.5. Impact Resistance of OPCC & SFRC mixes of M50 grade
S.No Type of Mix
(Mix- ID)
Fibre
Content (%)
Aspect
Ratio (AR)
Fibre
Factor (F)
Impact Resistance of
SFRC @ 28 days (No. of
blows)
% Increase in Impact
resistance of SFRC w.r.t
OPCC
At First
Crack At failure At First
Crack At failure
1 OPC Concrete 0 0 0 17 25 - -
2 SFRC (0.5-60) 0.5 60 0.225 52 156 67.30 84.00
3 SFRC (1.0-60) 1.0 60 0.45 98 296 82.70 91.60
4 SFRC (1.5-60) 1.5 60 0.675 146 412 88.40 93.90
5 SFRC (0.5-80) 0.5 80 0.30 83 185 79.50 86.50
6 SFRC (1.0-80) 1.0 80 0.60 127 346 86.60 92.80
7 SFRC (1.5-80) 1.5 80 0.90 175 485 90.30 94.90

153
Table 4.4.5.6. Comparison of Predicted Impact resistance with experimental Impact resistance of OPCC &
SFRC mixes of M50 grade
S.No Type of Mix
(Mix- ID)
Fibre
Content
(%)
Aspect
Ratio
(AR)
Fibre
Factor
(F)
Impact Resistance
of SFRC @ 28 days
(No. of blows)
(experimental) (Is)
Impact Resistance
of SFRC @ 28 days
(No. of blows)
(predicted) (Is,pred)
Is,pred
Is
1 OPC Concrete 0 0 0 25 25 1.00
2 SFRC
(0.5-60) 0.5 60 0.225 156 142.67 0.914
3 SFRC
(1.0-60) 1.0 60 0.45 296 260.35 0.88
4 SFRC
(1.5-60) 1.5 60 0.675 412 378.02 0.917
5 SFRC
(0.5-80) 0.5 80 0.30 185 181.90 0.983
6 SFRC
(1.0-80) 1.0 80 0.60 346 338.8 0.976
7 SFRC
(1.5-80) 1.5 80 0.90 485 495.7 1.02
Avg.Error = 4.5 % Mean = 0.955

154
Table 4.4.5.7. Impact Resistance of MKC & SFRC-MK mixes of M50 grade
S.No Type of Mix
(Mix- ID)
Fibre
Content (%)
Aspect
Ratio (AR)
Fibre
Factor (F)
Impact Resistance of
SFRC-MK @ 28 days (No.
of blows)
% Increase in Impact
resistance of SFRC-MK
w.r.t OPCC
At first
Crack At Failure At first
Crack At failure
1 MK Concrete 0 0 0 14 18 - -
2 SFRC-MK
(0.5-60) 0.5 60 0.225 146 258 88.35 90.30
3 SFRC-MK
(1.0-60) 1.0 60 0.45 262 470 93.50 94.70
4 SFRC-MK
(1.5-60) 1.5 60 0.675 393 730 95.70 96.60
5 SFRC-MK
(0.5-80) 0.5 80 0.30 220 320 92.30 93.00
6 SFRC-MK
(1.0-80) 1.0 80 0.60 369 596 95.40 96.00
7 SFRC-MK
(1.5-80) 1.5 80 0.90 446 862 96.20 98.00

155
Table 4.4.5.8. Comparison of Predicted Impact resistance with experimental Impact resistance of MKC &
SFRC-MK mixes of M50 grade
S.No Type of Mix
(Mix- ID)
Fibre
Content
(%)
Aspect
Ratio (AR)
Fibre
Factor (F)
Impact Resistance of
SFRC @ 28 days
(No. of blows)
(experimental) Ism
Impact Resistance
of SFRC @ 28 days
(No. of blows)
(predicted) Ism,pred
Ism,pred
Ism
1 OPC Concrete 0 0 0 19 19 1.00
2 SFRC
(0.5-60) 0.5 60 0.225 258 234.10 0.906
3 SFRC
(1.0-60) 1.0 60 0.45 470 449.20 0.955
4 SFRC
(1.5-60) 1.5 60 0.675 730 664.30 0.910
5 SFRC
(0.5-80) 0.5 80 0.30 320 305.8 0.953
6 SFRC
(1.0-80) 1.0 80 0.60 596 592.6 0.993
7 SFRC
(1.5-80) 1.5 80 0.90 862 879.4 1.02
Avg.Error = 3.75 % Mean = 0.962

156
Table 4.4.5.9. Increase / decrease in impact resistance of SFRC & SFRC-MK mixes of M20 and M50 grade in
compasrison with OPC concrete
Grade of
concrete Type of mix
Increase / Decrease in impact strength (No. of times)
0% 0.50% 1.0% 1.5%
M20
SFRC (1.5-60) - 3.88 6.61 11.0
SFRC (1.5-80) - 5.0 8.66 12.11
SFRC-MK (1.5-60) -1.64 6.11 12.68 18.44
SFRC-MK (1.5-80) -1.64 8.05 17.94 23.11
M50
SFRC (1.5-60) - 6.24 11.84 16.48
SFRC (1.5-80) - 7.40 13.84 19.40
SFRC-MK (1.5-60) -1.32 10.32 18.80 29.20
SFRC-MK (1.5-80) -1.32 12.80 23.84 32.48

157
Table 4.4.5.10 Compressive strength of SFRC & SFRC-MK mixes Of M20 & M50 grades with predicted values
and percentage variation
Grade of
Concrete S. No Type of Mix
Compressive strength in
MPa (Exp)
Predicted Compressive
Strength (MPa) % Variation
M20
1 OPCC 30.69 30.69 -
2 SFRC (0.5-60) 31.66 31.61 0.20
3 SFRC (1.0-60) 32.48 32.53 -
4 SFRC (1.5-60) 33.66 33.45 0.70
5 SFRC (0.5-80) 31.92 31.92 -
6 SFRC (1.0-80) 32.61 33.10 2.00
7 SFRC (1.5-80) 34.10 34.37 1.00
8 MKC 32.86 32.86 1.00
9 SFRC-MK (0.5-60) 34.12 33.74 1.40
10 SFRC-MK (1.0-60) 35.02 34.63 1.20
11 SFRC-MK (1.5-60) 35.86 35.52 1.10
12 SFRC-MK (0.5-80) 34.78 34.04 2.30
13 SFRC-MK (1.0-80) 35.54 35.13 1.20

158
14 SFRC-MK (1.5-80) 36.58 36.21 1.10
M50
1 OPCC 61.40 61.40 -
2 SFRC (0.5-60) 63.81 63.26 1.00
3 SFRC (1.0-60) 65.86 65.12 1.20
4 SFRC (1.5-60) 67.72 66.98 2.10
5 SFRC (0.5-80) 65.18 63.88 2.00
6 SFRC (1.0-80) 66.86 66.37 1.00
7 SFRC (1.5-80) 69.04 68.85 1.30
8 MKC 68.90 68.90 -
9 SFRC-MK (0.5-60) 71.54 70.48 1.50
10 SFRC-MK (1.0-60) 72.80 72.07 1.40
11 SFRC-MK (1.5-60) 74.00 73.66 1.80
12 SFRC-MK (0.5-80) 72.58 71.01 2.40
13 SFRC-MK (1.0-80) 73.42 73.13 1.40
14 SFRC-MK (1.5-80) 75.68 75.15 1.05

159
Table 4.4.5.11 Split tensile strength of SFRC & SFRC-MK mixes of M20 & M50 grades with predicted values
and percentage variation
Grade of
Concrete S. No Type of Mix
Split tensile strength in
MPa (Exp)
Predicted Split tensile
Strength (MPa) % Variation
M20
1 OPCC 2.84 2.84 -
2 SFRC (0.5-60) 3.32 3.26 1.90
3 SFRC (1.0-60) 3.76 3.74 0.60
4 SFRC (1.5-60) 4.38 4.25 3.00
5 SFRC (0.5-80) 3.50 3.36 3.80
6 SFRC (1.0-80) 4.25 4.09 4.00
7 SFRC (1.5-80) 4.63 4.72 1.00
8 MKC 3.08 3.08 -
9 SFRC-MK (0.5-60) 3.42 3.58 5.00
10 SFRC-MK (1.0-60) 4.06 4.07 -
11 SFRC-MK (1.5-60) 4.68 4.56 2.60
12 SFRC-MK (0.5-80) 3.82 3.74 2.10
13 SFRC-MK (1.0-80) 4.38 4.40 -

160
14 SFRC-MK (1.5-80) 4.96 5.06 2.00
M50
1 OPCC 4.32 4.32 -
2 SFRC (0.5-60) 5.28 5.04 4.60
3 SFRC (1.0-60) 5.90 5.77 2.20
4 SFRC (1.5-60) 6.99 6.50 6.80
5 SFRC (0.5-80) 5.50 5.29 3.80
6 SFRC (1.0-80) 6.53 6.26 4.20
7 SFRC (1.5-80) 7.22 7.23 -
8 MKC 4.76 4.76 -
9 SFRC-MK (0.5-60) 5.65 5.50 2.70
10 SFRC-MK (1.0-60) 6.38 6.24 2.20
11 SFRC-MK (1.5-60) 7.41 6.98 5.80
12 SFRC-MK (0.5-80) 6.20 5.74 7.00
13 SFRC-MK (1.0-80) 6.82 6.73 2.20
14 SFRC-MK (1.5-80) 7.69 7.71 1.00

161
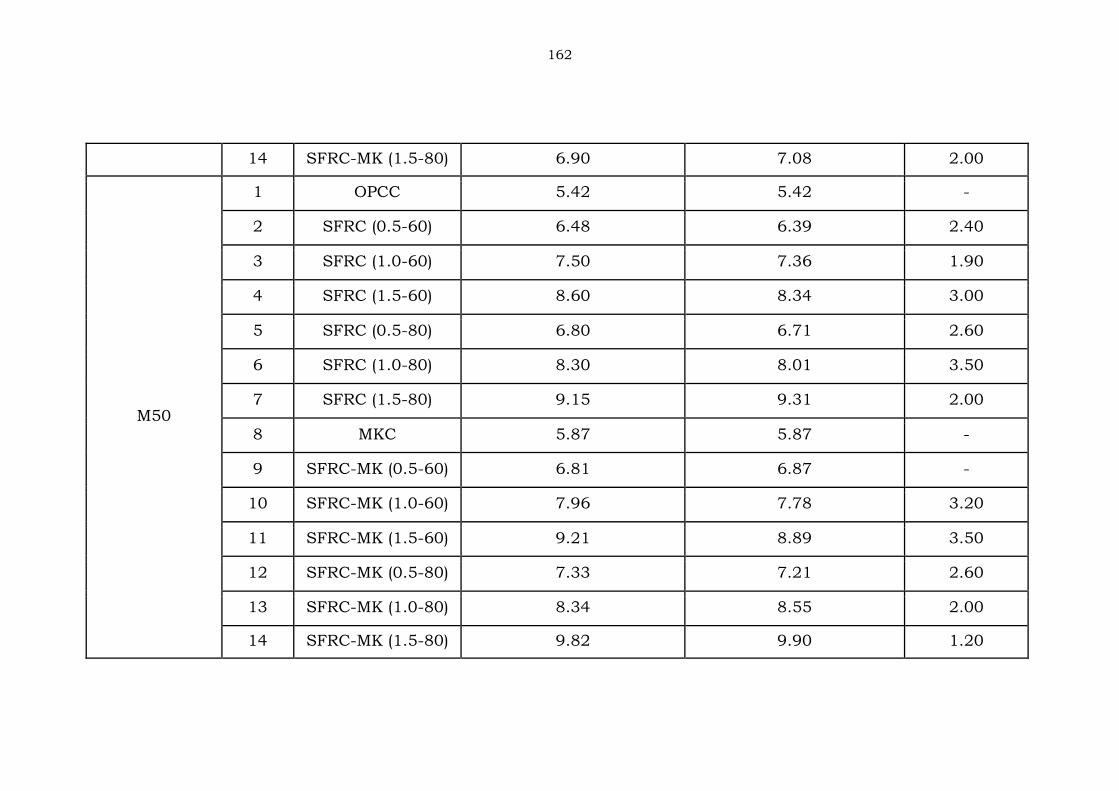
Table 4.4.5.12 Comparison of predicted Modulus of Rupture of SFRC & SFRC-MK mixes of M20 & M50 grades
with experimental Modulus of Rupture
Grade of
Concrete S. No Type of Mix
Modulus of Rupture in
MPa (Exp)
Predicted Modulus of
Rupture (MPa) % Variation
M20
1 OPCC 4.03 4.03 -
2 SFRC (0.5-60) 4.76 4.69 1.50
3 SFRC (1.0-60) 5.44 5.34 1.80
4 SFRC (1.5-60) 6.10 6.00 1.60
5 SFRC (0.5-80) 5.08 4.90 3.50
6 SFRC (1.0-80) 5.76 5.79 -
7 SFRC (1.5-80) 6.72 6.66 1.00
8 MKC 4.26 4.26 -
9 SFRC-MK (0.5-60) 4.87 4.96 2.00
10 SFRC-MK (1.0-60) 5.66 5.60 -
11 SFRC-MK (1.5-60) 6.46 6.37 2.40
12 SFRC-MK (0.5-80) 5.12 5.20 1.00
13 SFRC-MK (1.0-80) 6.31 6.12 2.80
162
14 SFRC-MK (1.5-80) 6.90 7.08 2.00
M50
1 OPCC 5.42 5.42 -
2 SFRC (0.5-60) 6.48 6.39 2.40
3 SFRC (1.0-60) 7.50 7.36 1.90
4 SFRC (1.5-60) 8.60 8.34 3.00
5 SFRC (0.5-80) 6.80 6.71 2.60
6 SFRC (1.0-80) 8.30 8.01 3.50
7 SFRC (1.5-80) 9.15 9.31 2.00
8 MKC 5.87 5.87 -
9 SFRC-MK (0.5-60) 6.81 6.87 -
10 SFRC-MK (1.0-60) 7.96 7.78 3.20
11 SFRC-MK (1.5-60) 9.21 8.89 3.50
12 SFRC-MK (0.5-80) 7.33 7.21 2.60
13 SFRC-MK (1.0-80) 8.34 8.55 2.00
14 SFRC-MK (1.5-80) 9.82 9.90 1.20

163
Table 4.4.5.13 Comparison of predicted Modulus of Elasticity of SFRC & SFRC-MK mixes of M20 & M50 grades
with experimental Modulus of Elasticity
Grade of
Concrete S. No Type of Mix
Modulus of Elasticity in
GPa (Exp)
Predicted Modulus of
Elasticity (GPa) % Variation
M20
1 OPCC 24.32 24.32 -
2 SFRC (0.5-60) 25.04 24.90 0.80
3 SFRC (1.0-60) 25.72 25.26 2.00
4 SFRC (1.5-60) 26.68 26.10 2.20
5 SFRC (0.5-80) 25.59 25.08 3.00
6 SFRC (1.0-80) 26.25 25.56 2.70
7 SFRC (1.5-80) 27.20 26.48 2.90
8 MKC 25.43 25.43 -
9 SFRC-MK (0.5-60) 26.24 25.80 1.70
10 SFRC-MK (1.0-60) 27.06 26.54 1.20
11 SFRC-MK (1.5-60) 27.44 27.00 1.70
12 SFRC-MK (0.5-80) 26.58 26.24 1.30
13 SFRC-MK (1.0-80) 27.44 26.74 1.90

164
14 SFRC-MK (1.5-80) 26.58 27.80 0.80
M50
1 OPCC 27.25 33.88 -
2 SFRC (0.5-60) 27.90 34.93 1.70
3 SFRC (1.0-60) 33.88 35.99 2.50
4 SFRC (1.5-60) 35.50 37.04 1.80
5 SFRC (0.5-80) 36.52 35.28 3.10
6 SFRC (1.0-80) 37.04 36.69 1.00
7 SFRC (1.5-80) 38.34 37.25 2.80
8 MKC 36.32 36.32 -
9 SFRC-MK (0.5-60) 37.08 37.32 -
10 SFRC-MK (1.0-60) 38.44 38.03 1.10
11 SFRC-MK (1.5-60) 39.48 39.72 2.00
12 SFRC-MK (0.5-80) 37.92 37.66 1.00
13 SFRC-MK (1.0-80) 39.02 38.69 1.10
14 SFRC-MK (1.5-80) 40.28 39.54 1.90

165
Table 4.4.5.14 Predicted equations of mechanical properties of M20 grade concrete
S.No Property Type of Mix Proposed equation (Valid up to a fibre content of
1.50% by vol.) Valid upto
1 Compressive
strength
SFRC σcs, Predicted = 4.097F + σCS 34.38 MPa
2 SFRC-MK σcsm, Predicted = 3.95 F + σcsm 36.42 MPa
3 Splitting tensile
strength
SFRC σSt, Predicted = 2.097 F + σSt 4.72 MPa
4 SFRC-MK σStm, Predicted = 2.125 F + σStm 4.99 MPa
5 Modulus of
rupture
SFRC σrf, Predicted = 2.93 F + σrf 6.67 MPa
6 SFRC-MK σrsm, Predicted = 3.136 F + σrsm 7.08 MPa
7 Modulus of
elasticity
SFRC Es, Predicted = 3.204 F + Es 27.20 GPa
8 SFRC-MK Esm, Predicted = 2.68 F + Esm 27.85 GPa
9 Impact resistance
to failure
SFRC Is, Predicted = 243.26 F + Is 237 blows
10 SFRC-MK Ism, Predicted = 461.22 F + Ism 426 blows

166
Table 4.4.5.15 Predicted equations of mechanical properties of M50 grade concrete
S.No Property Type of Mix Proposed equation (Valid upto a fibre content of
1.50% by vol.) Valid upto
1 Compressive
strength
SFRC σcs, Predicted = 8.289 F + σCS 63.26 MPa
2 SFRC-MK σcsm, Predicted = 6.256 F + σcsm 74.53 MPa
3 Splitting tensile
strength
SFRC σSt, Predicted = 3.24 F + σSt 7.24 MPa
4 SFRC-MK σStm, Predicted = 3.30 F + σStm 7.73 MPa
5 Modulus of
rupture
SFRC σrf, Predicted = 4.32 F + σrf 9.30 MPa
6 SFRC-MK σrsm, Predicted = 4.478 F + σrsm 9.90 MPa
7 Modulus of
elasticity
SFRC Es, Predicted = 4.69 F + Es 38.10 GPa
8 SFRC-MK Esm, Predicted = 4.51 F + Esm 40.38 GPa
9 Impact resistance
to failure
SFRC Is, Predicted = 503.69 F + Is 478 blows
10 SFRC-MK Ism, Predicted = 956 F + Ism 878 blows

167
TABLE 4.5. THERMAL EFFECTS OF OPCC, MKC, SFRC & SFRC-MK MIXES OF M20 AND
M50 GRADE
Table 4.5.1. Variation in compressive strength, splitting tensile strength and modulus of rupture of M20 grade
concrete due to various thermal cycles at 500C
Type of strength No. of
days OPCC MKC
SFRC
(1.5-60)
SFRC
(1.5-80)
SFRC-MK
(1.5-60)
SFRC-MK
(1.5-80)
Compressive
Strength (MPa)
0 30.69 32.86 33.66 34.10 36.14 36.50
28 26.80 34.93 30.16 30.88 33.21 33.88
90 25.18 35.96 28.24 29.05 31.02 31.72
180 24.54 36.60 27.38 28.20 30.27 31.05
Split Tensile
strength (MPa)
0 2.84 3.08 4.35 4.68 4.50 4.96
28 2.42 3.20 3.84 4.18 4.09 4.56
90 2.22 3.28 3.53 3.85 3.76 4.20
180 2.09 3.32 3.32 3.61 3.55 3.97
Modulus of
Rupture (MPa)
0 4.03 4.26 6.22 6.72 6.46 6.90
28 3.32 4.43 5.45 5.97 5.98 6.33
90 3.04 4.55 4.97 5.46 5.49 5.80
180 2.83 4.61 4.65 5.06 5.05 5.36

168
Table 4.5.2. Variation in compressive strength, splitting tensile strength and modulus of rupture of M50 grade
concrete due to various thermal cycles at 500C
Type of strength No. of
days OPCC MKC
SFRC
(1.5-60)
SFRC
(1.5-80)
SFRC-MK
(1.5-60)
SFRC-MK
(1.5-80)
Compressive
Strength (MPa)
0 61.40 68.9 67.72 69.04 74.22 75.68
28 55.99 75.56 63.71 65.89 72.33 74.10
90 53.26 77.74 60.53 62.70 68.60 71.14
180 51.29 79.18 58.24 60.35 65.42 67.94
Split Tensile strength
(MPa)
0 4.32 4.76 6.99 7.22 7.41 7.69
28 3.86 5.28 6.53 6.85 7.17 7.52
90 3.59 5.43 6.09 6.40 6.68 7.06
180 3.41 5.54 5.79 6.09 6.38 6.74
Modulus
of
Rupture (MPa)
0 5.42 5.87 8.60 9.15 9.21 9.82
28 4.70 6.42 7.96 8.66 8.87 9.60
90 4.33 6.61 7.32 7.94 8.20 8.85
180 4.05 6.70 6.78 7.36 7.58 8.20

169
Table 4.5.3. Variation in compressive strength, splitting tensile strength and modulus of rupture of M50 grade
due to various thermal cycles at 1000C
Type of strength No. of
days OPCC MKC
SFRC
(1.5-60)
SFRC
(1.5-80)
SFRC-MK
(1.5-60)
SFRC-MK
(1.5-80)
Compressive
Strength (MPa)
0 61.4 68.90 67.72 69.04 74.22 75.68
28 52.66 77.76 60.08 62.60 70.16 72.26
90 46.72 80.06 53.37 55.58 62.22 64.26
180 42.72 81.89 48.93 50.88 57.09 58.92
Split Tensile
strength (MPa)
0 4.32 4.76 6.99 7.22 7.41 7.69
28 3.61 5.41 6.07 6.36 6.81 7.18
90 3.28 5.69 5.52 5.77 6.17 6.53
180 3.08 5.88 5.18 5.44 5.78 6.12
Modulus of
Rupture (MPa)
0 5.42 5.87 8.60 9.15 9.22 9.82
28 4.42 6.63 7.44 8.09 8.40 9.04
90 3.94 6.92 6.63 7.24 7.50 8.10
180 3.62 7.08 6.14 6.71 6.95 7.54

170
Table 4.5.4. Variation in compressive strength, splitting tensile strength and modulus of rupture of M20 grade
concrete due to various thermal cycles at 1000C
Type of strength No. of
days OPCC MKC
SFRC
(1.5-60)
SFRC
(1.5-80)
SFRC-MK
(1.5-60)
SFRC-MK
(1.5-80)
Compressive
Strength (MPa)
0 30.69 32.86 33.66 34.10 36.14 36.50
28 24.35 35.80 27.34 28.20 30.80 31.68
90 21.15 36.62 23.78 24.53 26.84 27.64
180 18.95 37.33 21.35 22.01 24.07 24.86
Split Tensile
Strength (MPa)
0 2.84 3.08 4.35 4.68 4.50 4.96
28 2.18 3.26 3.44 3.75 3.72 4.16
90 1.99 3.32 3.17 3.45 3.43 3.86
180 1.84 3.40 2.93 3.19 3.14 3.52
Modulus of
Rupture (MPa)
0 4.03 4.26 6.22 6.72 6.46 6.90
28 3.05 4.55 4.95 5.43 5.35 5.79
90 2.75 4.65 4.49 4.94 4.89 5.31
180 2.51 4.74 4.12 5.56 4.51 4.92

171
Table 4.5.5. Percentage increase or decrease in compressive strength, splitting tensile strength and modulus
of rupture of various types of M20 grade concrete with zero thermal cycles at 500C and 1000C
Type of Mix
(Mix -ID)
No. of
Days
% Compressive Strength % Split tensile strength % Modulus of Rupture
500C 1000C 500C 1000C 500C 1000C
OPCC
0 - - - - - -
28 -12.66 -20.64 -14.57 -23.14 -17.66 -24.72
90 -17.94 -31.08 -21.7 -29.58 -24.50 -31.86
180 -20.04 -38.26 -26.20 -35.08 -29.72 -37.60
MKC
0 - - - - - -
28 6.26 8.92 4.12 6.08 4.18 6.72
90 9.42 11.40 6.34 7.90 6.80 9.28
180 11.36 13.58 7.94 9.40 8.33 11.08
SFRC
(1.5-60)
0 - - - - - -
28 -10.38 -18.76 -11.53 -20.86 -12.30 -20.47
90 -16.09 -29.33 -18.85 -27.02 -19.94 -27.80
180 -18.66 -36.58 -23.70 -32.58 -25.88 -33.76

172
SFRC
(1.5-80)
0 - - - - - -
28 -9.44 -17.28 -10.60 -19.72 -11.08 -19.18
90 -14.8 -28.05 -17.76 -26.20 -18.70 -26.44
180 -17.30 -35.44 -22.78 -31.82 -24.76 -32.40
SFRC-MK
(1.5-60)
0 - - - - - -
28 -8.10 -14.76 -9.06 -17.24 -8.62 -17.10
90 -14.18 -25.72 -16.30 -23.70 -16.22 -24.26
180 -16.24 -33.38 -21.10 -30.24 -22.92 -30.24
SFRC-MK
(1.5-80)
0 - - - - - -
28 -7.16 -13.20 -7.90 -16.04 -7.18 -16.06
90 -13.08 -24.20 -15.26 -22.16 -15.02 -23.02
180 -14.92 -31.88 -19.88 -29.06 -21.40 -28.84
173
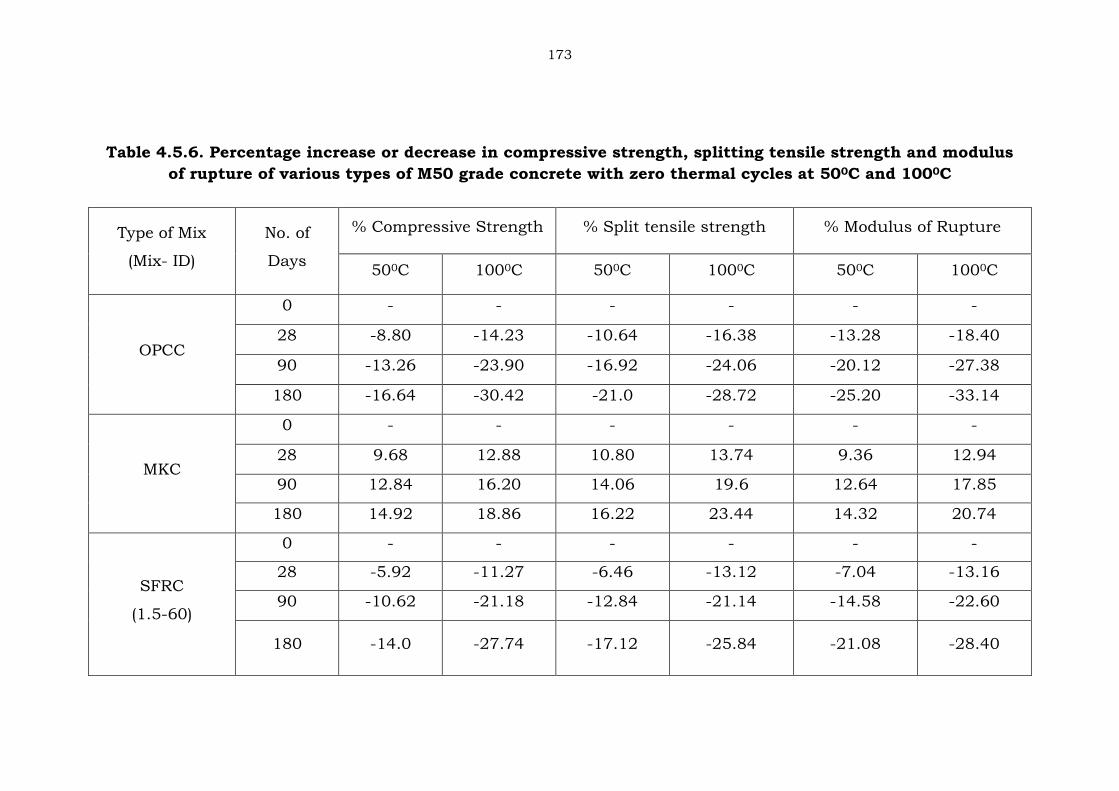
Table 4.5.6. Percentage increase or decrease in compressive strength, splitting tensile strength and modulus
of rupture of various types of M50 grade concrete with zero thermal cycles at 500C and 1000C
Type of Mix
(Mix- ID)
No. of
Days
% Compressive Strength % Split tensile strength % Modulus of Rupture
500C 1000C 500C 1000C 500C 1000C
OPCC
0 - - - - - -
28 -8.80 -14.23 -10.64 -16.38 -13.28 -18.40
90 -13.26 -23.90 -16.92 -24.06 -20.12 -27.38
180 -16.64 -30.42 -21.0 -28.72 -25.20 -33.14
MKC
0 - - - - - -
28 9.68 12.88 10.80 13.74 9.36 12.94
90 12.84 16.20 14.06 19.6 12.64 17.85
180 14.92 18.86 16.22 23.44 14.32 20.74
SFRC
(1.5-60)
0 - - - - - -
28 -5.92 -11.27 -6.46 -13.12 -7.04 -13.16
90 -10.62 -21.18 -12.84 -21.14 -14.58 -22.60
180 -14.0 -27.74 -17.12 -25.84 -21.08 -28.40

174
SFRC
(1.5-80)
0 - - - - - -
28 -4.56 -9.33 -5.04 -11.90 -5.32 -11.54
90 -9.18 -19.49 -11.42 -20.04 -13.20 -20.82
180 -12.58 -26.3 -15.6 -24.70 -19.56 -26.66
SFRC-MK
(1.5-60)
0 - - - - - -
28 -2.54 -5.47 -3.20 -8.14 -3.76 -8.84
90 -7.56 -16.17 -9.72 -16.69 -11.08 -18.70
180 -11.86 -23.08 -13.92 -21.96 -17.80 -24.58
SFRC-MK
(1.5-80)
0 - - - - - -
28 -2.08 -4.52 -2.14 -6.62 -2.24 -7.90
90 -6.0 -15.08 -8.10 -15.20 -9.84 -17.78
180 -10.22 -22.14 -12.36 -20.44 -16.52 -23.20

175
TABLE 4.6. TEMPERATURE EFFECTS OF OPCC, MKC,
SFRC & SFRC-MK MIXES OF M20 AND M50 GRADE
Table 4.6.1. Compressive strength of OPCC, MKC, SFRC &
SFRC-MK mixes of M20 and M50 grade at elevated temperatures
Table 4.6.1.1.Variation in compressive strength of OPCC of
M20 grade due to temperature effects
S.
No Temperature
Exposure Duration Compressive
Strength
after cooling
to room
temperature
(MPa)
0 Hrs 4 Hrs 8 Hrs 12 Hrs
1 At room
temperature 30.69 - - - -
2 At 2000C - 29.22 28.54 28.08 31.95
3 At 4000C - 26.73 25.93 24.92 27.18
4 At 6000C - 23.32 21.94 20.65 22.77
Table 4.6.1.2. Variation in compressive strength of MKC of
M20 grade due to temperature effects
S..No Temperature
Exposure Duration
Compressive
Strength
after cooling
to room
temperature
(MPa)
0 Hrs 4
Hrs 8 Hrs 12 Hrs
1 At room
temperature 32.86 - - - -
2 At 2000C - 32.04 31.29 31.10 36.32
3 At 4000C - 29.12 28.26 27.60 30.73
4 At 6000C - 23.75 21.85 20.53 24.32

176
Table 4.6.1.3.Variation in compressive strength of SFRC
(1.5-60) of M20 grade due to temperature effects
S.No Temperature
Exposure Duration
Compressive
Strength
after cooling
to room
temperature
(MPa)
0 Hrs 4 Hrs 8 Hrs 12 Hrs
1 At room
temperature 33.66 - - - -
2 At 2000C - 29.95 29.22 28.61 33.25
3 At 4000C - 26.38 25.17 23.29 26.18
4 At 6000C - 20.93 18.34 15.75 17.12
Table 4.6.1.4.Variation in compressive strength of SFRC (1.5-80)
of M20 grade due to temperature effects
S.No Temperature
Exposure Duration Compressive
Strength
after cooling
to room
temperature
(MPa)
0 Hrs 4 Hrs 8 Hrs 12
Hrs
1 At room
temperature 34.10 - - - -
2 At 2000C - 30.42 29.53 28.17 32.90
3 At 4000C - 25.95 24.82 22.73 25.57
4 At 6000C - 19.7 17.93 14.80 17.11

177
Table 4.6.1.5.Variation in compressive strength of SFRC-MK
(1.5-60) of M20 grade due to temperature effects
S.No Temperature
Exposure Duration
Compressive
Strength
after cooling
to room
temperature
(MPa)
0 Hrs 4 Hrs 8 Hrs 12
Hrs
1 At room
temperature 36.14 - - - -
2 At 2000C - 33.32 32.60 31.36 38.31
3 At 4000C - 29.42 28.12 26.09 29.99
4 At 6000C - 20.42 18.14 14.90 16.70
Table 4.6.1.6.Variation in compressive strength of SFRC-MK
(1.5-80) of M20 grade due to temperature effects
S.No Temperature
Exposure Duration
Compressive
Strength
after cooling
to room
temperature
(MPa)
0 Hrs 4 Hrs 8 Hrs 12 Hrs
1 At room
temperature 36.50 - - - -
2 At 2000C - 33.01 32.40 30.28 38.22
3 At 4000C - 28.41 27.58 25.22 29.67
4 At 6000C - 19.3 17.22 14.52 16.13

178
Table 4.6.1.7.Variation in compressive strength of OPCC of M50
grade due to temperature effects
S.No Temperature
Exposure Duration Compressive
Strength
after cooling
to room
temperature
(MPa)
0 Hrs 4 Hrs 8 Hrs 12
Hrs
1 At room
temperature 61.4 - - - -
2 At 2000C - 54.84 53.36 51.33 64.60
3 At 4000C - 47.15 45.19 42.24 51.80
4 At 6000C - 36.60 33.27 29.40 35.24
Table 4.6.1.8.Variation in compressive strength of MKC of M50
grade due to temperature effects
S.No Temperature
Exposure Duration Compressive
Strength
after cooling
to room
temperature
(MPa)
0 Hrs 4 Hrs 8 Hrs 12
Hrs
1 At room
temperature 68.90 - - - -
2 At 2000C - 61.32 58.49 57.88 74.62
3 At 4000C - 54.64 52.91 50.30 60.35
4 At 6000C - 38.03 34.72 27.96 31.42

179
Table 4.6.1.9. Variation in compressive strength of SFRC (1.5-60)
of M50 grade due to temperature effects
S.No Temperature
Exposure Duration Compressive
Strength
after cooling
to room
temperature
(MPa)
0 Hrs 4 Hrs 8 Hrs 12
Hrs
1 At room
temperature 67.72 - - - -
2 At 2000C - 51.48 49.34 46.06 53.50
3 At 4000C - 43.66 41.78 40.52 45.44
4 At 6000C - 33.58 30.20 26.40 31.20
Table 4.6.1.10.Variation in compressive strength of SFRC (1.5-80)
of M50 grade due to temperature effects
S.No Temperature
Exposure Duration Compressive
Strength
after cooling
to room
temperature
(MPa)
0 Hrs 4 Hrs 8 Hrs 12
Hrs
1 At room
temperature 69.04 - - - -
2 At 2000C - 51.23 48.81 45.02 52.26
3 At 4000C - 41.98 39.28 37.56 42.14
4 At 6000C - 32.80 29.48 21.40 26.23

180
Table 4.6.1.11.Variation in compressive strength of SFRC-MK
(1.5-60) of M50 grade due to temperature effects
S.No Temperature
Exposure Duration Compressive
Strength
after cooling
to room
temperature
(MPa)
0 Hrs 4 Hrs 8 Hrs 12
Hrs
1 At room
temperature 74.22 - - - -
2 At 2000C - 60.31 57.63 55.06 65.63
3 At 4000C - 55.80 51.91 48.02 55.20
4 At 6000C - 31.59 27.08 23.0 26.20
Table 4.6.1.12.Variation in compressive strength of SFRC-MK
(1.5-80) of M50 grade due to temperature effects
S.No Temperature
Exposure Duration Compressive
Strength
after cooling
to room
temperature
(MPa)
0 Hrs 4 Hrs 8 Hrs 12 Hrs
1 At room
temperature 75.68 - - - -
2 At 2000C - 59.59 57.48 54.18 65.45
3 At 4000C - 53.36 50.58 46.60 54.41
4 At 6000C - 27.30 26.33 18.31 21.94

181
Table 4.6.1.13. Percentage decrease in compressive strength of OPCC, MKC, SFRC & SFRC-MK mixes of M20
and M50 grade at elevated temperatures
Grade of concrete S. No Type of Mix Temperature % Decrease in Compressive
Strength
M20
1 OPCC
200 8.50
400 18.80
600 32.70
2 MKC
200 5.35
400 16.00
600 37.50
3 SFRC
(1.5 -80)
200 17.40
400 33.30
600 56.60
4 SFRC –MK
(1.5 -80)
200 17.00
400 30.90
600 60.50

182
M50
5 OPCC
200 16.40
400 31.20
600 52.10
6 MKC
200 15.50
400 27.0
600 59.40
7 SFRC
(1.5 -80)
200 34.80
400 45.60
600 69.0
8 SFRC –MK
(1.5 -80)
200 27.90
400 38.0
600 75.80

183
Table 4.6.1.14. Percentage increase in compressive strength of
OPCC, MKC, SFRC & SFRC-MK mixes of M20 and M50 grade after
cooling to room temperature in comparison to its strength at
elevated temperatures
Grade of
concrete
S. No Type of
Mix
Temperature % increase in
Compressive
Strength
M20
1 OPCC
200 13.80
400 9.06
600 10.26
2 MKC
200 16.78
400 11.34
600 6.90
3 SFRC
(1.5 -80)
200 16.80
400 12.50
600 15.6
4 SFRC –MK
(1.5 -80)
200 26.22
400 17.64
600 11.10
M50
5 OPCC
200 25.86
400 14.80
600 20.80
6 MKC
200 28.92
400 18.80
600 18.10
7 SFRC
(1.5 -80)
200 16.08
400 12.20
600 22.57
8 SFRC –MK
(1.5 -80)
200 19.90
400 15.90
600 19.60

184
Table 4.6.2. Pulse velocity (m/sec) of OPCC, MKC, SFRC & SFRC-
MK mixes of M20 and M50 grade at elevated temperatures
Table 4.6.2.1. Variation in Pulse velocity of various types of M20
grade concrete due to temperature effects
Type of Mix
(Mix- ID) Temperature Exposure duration
0 Hrs 4 Hrs 8 Hrs 12 Hrs
OPCC
At room
Temperature 4325 - - -
2000C - 4099 4013 3927
4000C - 3553 3481 3335
6000C - 2907 2790 2571
MKC
At room
Temperature 4333 - - -
2000C - 4100 4015 3930
4000C - 3561 3502 3347
6000C - 2919 2802 2587
SFRC
(1.5-60)
At room
Temperature 4327 - - -
2000C - 4100 4014 3929
4000C - 3557 3492 3341
6000C - 2913 2796 2575
SFRC
(1.5-80)
At room
Temperature 4329 - - -
2000C - 4104 4014 3928
4000C - 3555 3487 3338
6000C - 2904 2793 2579
SFRC-MK
(1.5-60)
At room
Temperature 4338 - - -
2000C - 4101 4017 3934
4000C - 3570 3529 3361
6000C - 2933 2816 2599
SFRC-MK
(1.5-80)
At room
Temperature 4342 - - -
2000C - 4101 4016 3933
4000C - 3567 3520 3356
6000C - 2928 2811 2605

185
Table 4.6.2.2. Variation in Pulse velocity of various types of M50
grade concrete due to temperature effects
Type of Mix
(Mix ID) Temperature
Exposure duration
0 Hrs 4 Hrs 8 Hrs 12 Hrs
OPCC
At room
Temperature 4477 - - -
2000C 4145 4063 3989
4000C 3639 3531 3398
6000C 3026 2915 2767
MKC
At room
Temperature 4492 - - -
2000C 4147 4065 3993
4000C 3649 3539 3410
6000C 3032 2930 2780
SFRC
(1.5-60)
At room
Temperature 4481 - - -
2000C 4146 4064 3991
4000C 3644 3535 3404
6000C 3030 2923 2771
SFRC
(1.5-80)
At room
Temperature 4485 - - -
2000C 4146 4064 3990
4000C 3642 3533 3401
6000C 3029 2919 2773
SFRC-MK
(1.5-60)
At room
Temperature 4490 - - -
2000C 4147 4065 3994
4000C 3651 3540 3412
6000C 3033 2933 2778
SFRC-MK
(1.5-80)
At room
Temperature 4497 - - -
2000C 4143 4065 3993
4000C 3643 3539 3410
6000C 3024 2931 2783
186
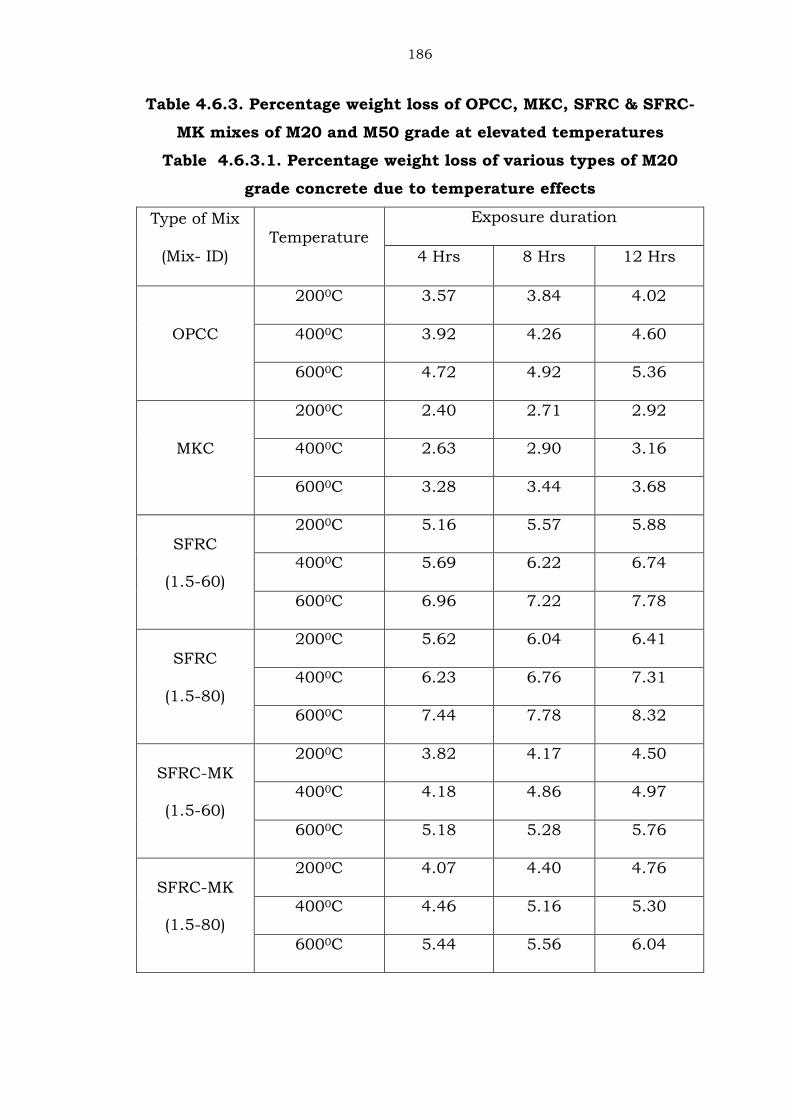
Table 4.6.3. Percentage weight loss of OPCC, MKC, SFRC & SFRC-
MK mixes of M20 and M50 grade at elevated temperatures
Table 4.6.3.1. Percentage weight loss of various types of M20
grade concrete due to temperature effects
Type of Mix
(Mix- ID)
Temperature
Exposure duration
4 Hrs 8 Hrs 12 Hrs
OPCC
2000C 3.57 3.84 4.02
4000C 3.92 4.26 4.60
6000C 4.72 4.92 5.36
MKC
2000C 2.40 2.71 2.92
4000C 2.63 2.90 3.16
6000C 3.28 3.44 3.68
SFRC
(1.5-60)
2000C 5.16 5.57 5.88
4000C 5.69 6.22 6.74
6000C 6.96 7.22 7.78
SFRC
(1.5-80)
2000C 5.62 6.04 6.41
4000C 6.23 6.76 7.31
6000C 7.44 7.78 8.32
SFRC-MK
(1.5-60)
2000C 3.82 4.17 4.50
4000C 4.18 4.86 4.97
6000C 5.18 5.28 5.76
SFRC-MK
(1.5-80)
2000C 4.07 4.40 4.76
4000C 4.46 5.16 5.30
6000C 5.44 5.56 6.04

187
Table 4.6.3.2. Percentage weight loss of various types of M50
grade concrete due to temperature effects
Type of Mix
(Mix –ID) Temperature
Exposure duration
4 Hrs 8 Hrs 12 Hrs
OPCC
2000C 5.40 5.85 6.21
4000C 6.38 7.04 7.76
6000C 7.88 8.45 9.49
MKC
2000C 2.86 3.04 3.18
4000C 3.28 3.60 3.93
6000C 3.97 4.25 4.75
SFRC
(1.5-60)
2000C 8.04 8.62 9.09
4000C 9.39 10.31 11.29
6000C 11.54 12.29 13.66
SFRC
(1.5-80)
2000C 8.80 9.46 9.98
4000C 10.38 11.42 12.55
6000C 12.73 13.50 15.09
SFRC-MK
(1.5-60)
2000C 5.52 5.85 6.16
4000C 6.36 7.09 7.65
6000C 7.78 8.30 9.24
SFRC-MK
(1.5-80)
2000C 5.94 6.31 6.66
4000C 6.84 7.64 8.25
6000C 8.38 8.95 9.96

188
TABLE 4.7. DURABILITY PROPERTIES OF OPCC, MKC, SFRC & SFRC-MK MIXES OF M20 AND
M50 GRADE
Table 4.7.1. Loss in weight of OPCC, MKC, SFRC & SFRC-MK mixes of M20 and M50 grade after immersion in
different solutions
Table 4.7.1.1. Loss in weight of OPCC, MKC, SFRC & SFRC-MK mixes of M20 grade due to acid attack (5 %
HCL)
S. No Mix- ID Wt. before
immersion
@ 30 days
(gms)
Wt. after
immersion
@ 30 days
% loss
in Wt.
@ 30
days
Wt. after
immersion
@ 60 days
(gms)
% loss
in Wt.
@ 60
days
Wt. after
immersio
n
@ 90
days
(gms)
% loss
in Wt.
@ 90
days
Wt. after
immersio
n
@ 120
days
(gms)
% loss in
Wt. @
120 days
1 OPCC 2468 2334 5.45 2325 5.82 2252 8.76 2215 10.23
2 MKC 2544 2484 2.37 2477 2.66 2444 3.90 2413 5.16
3 SFRC
(1.5-60) 2556 2507 1.93 2488 2.64 2470 3.37 2454 3.98
4 SFRC
(1.5-80) 2587 2543 1.69 2530 2.22 2515 2.78 2497 3.48
5 SFRC-MK
(1.5-60) 2604 2563 1.58 2550 2.08 2541 2.40 2527 2.95
6 SFRC-MK
(1.5-80) 2622 2589 1.26 2580 1.59 2574 1.83 2567 2.10

189
Table 4.7.1.2. Loss in weight of OPCC, MKC, SFRC & SFRC-MK mixes of M20 grade due to acid attack (5 %
H2SO4)
S. No Mix- ID
Wt.
before
immersion
@ 30 days
(gms)
Wt. after
immersion
@ 30 days
(gms)
% loss in
Wt.
@ 30
days
Wt.after
immersion
@ 60 days
(gms)
% loss in
Wt.
@ 60
days
Wt.after
immersion
@ 90 days
(gms)
% loss
in Wt.
@ 90
days
Wt.after
immersion
@ 120
days (gms)
% loss in
Wt.
@ 120
days
1 OPCC 2468 2241 9.22 2065 16.32 1854 24.86 1649 33.2
2 MKC 2544 2408 5.36 2250 11.58 2126 16.43 1942 23.69
3 SFRC (1.5-
60) 2556 2411 5.67 2255 11.78 2118 17.14 2013 21.22
4 SFRC (1.5-
80) 2587 2461 4.86 2315 10.52 2192 15.26 2075 19.8
5 SFRC-MK
(1.5-60) 2604 2494 4.22 2355 9.56 2287 12.16 2238 14.06
6 SFRC-MK
(1.5-80) 2622 2538 3.20 2437 7.04 2373 9.48 2325 11.34
Table 4.7.1.3. Loss in weight of OPCC, MKC, SFRC & SFRC-MK mixes of M50 grade due to acid attack (5 %
HCL)

190
S.No Mix- ID
Wt.
before
immersion
@ 30 days
(gms)
Wt. after
immersion
@ 30 days
(gms)
% loss in
Wt. @ 30
days
Wt. after
immersion
@ 60 days
(gms)
% loss in
Wt. @ 60
days
Wt. after
immersion
@ 90 days
(gms)
% loss in
Wt. @ 90
days
Wt. after
immersion
@ 120 days
(gms)
% loss in
Wt. @ 120
days
1 OPCC 2684 2577 3.97 2543 5.24 2457 8.44 2434 9.29
2 MKC 2622 2599 0.89 2567 2.08 2528 3.58 2511 4.22
3 SFRC
(1.5-60) 2780 2753 0.96 2739 1.48 2720 2.14 2707 2.62
4 SFRC
(1.5-80) 2816 2793 0.80 2782 1.22 2766 1.76 2765 1.88
5 SFRC-MK
(1.5-60) 2710 2689 0.76 2682 1.02 2673 1.36 2658 1.94
6 SFRC-MK
(1.5-80) 2738 2724 0.52 2717 0.78 2707 1.12 2700 1.38
Table 4.7.1.4.Loss in weight of OPCC, MKC, SFRC & SFRC-MK mixes of M50 grade due to acid attack (5 %
H2SO4)

191
S.
No Mix- ID
Wt. before
immersion
@ 30 days
(gms)
Wt. after
immersion
@ 30 days
(gms)
% loss in
Wt. @ 30
days
Wt. after
immersion
@ 60 days
(gms)
% loss in
Wt. @ 60
days
Wt. after
immersion
@ 90 days
(gms)
% loss in
Wt. @ 90
days
Wt. after
immersion
@ 120 days
(gms)
% loss in
Wt. @ 120
days
1 OPCC 2666 2587 2.96 2418 9.32 2193 17.74 1962 26.38
2 MKC 2600 2558 1.62 2504 3.69 2434 6.37 2343 9.88
3 SFRC
(1.5-60) 2792 2732 2.14 2599 6.92 2478 11.24 2386 14.54
4 SFRC
(1.5-80) 2830 2791 1.38 2653 6.26 2542 10.18 2441 13.76
5 SFRC-MK
(1.5-60) 2722 2680 1.52 2590 4.86 2576 5.36 2531 7.02
6 SFRC-MK
(1.5-80) 2762 2736 0.93 2663 3.60 2642 4.32 2599 5.90
Table 4.7.2. Percentage loss of compressive strength of OPCC, MKC, SFRC & SFRC-MK mixes of M20 and M50
grade after immersing in different solutions

192
Table 4.7.2.1. Loss in compressive strength of OPCC, MKC, SFRC & SFRC-MK mixes of M20 grade due to acid
attack (5% HCL)
S.
No Mix- ID
C.S.
before
immersi
on
@ 30
days
(MPa)
C.S. after
immersio
n
@ 30 days
(MPa)
% loss
in C.S
@ 30
days
C.S after
immersion
@ 60 days
(MPa)
% loss
in C.S @
60 days
C.S after
immersion
@ 90 days
(MPa)
% loss
in C.S @
90 days
C.S after
immersio
n
@ 120
days
(MPa)
% loss
in C.S @
120
days
1 OPCC 30.69 27.78 9.46 25.69 16.28 24.26 20.94 22.42 26.96
2 MKC 32.86 30.33 7.68 28.53 13.15 27.04 17.72 25.10 23.61
3 SFRC
(1.5-60) 33.66 31.10 7.58 29.42 12.58 27.85 17.25 26.09 22.47
4 SFRC
(1.5-80) 34.10 31.73 6.95 29.99 12.04 28.54 16.30 26.58 22.05
5 SFRC-MK
(1.5-60) 36.14 33.80 6.45 32.08 11.22 31.14 13.84 29.21 19.16
6 SFRC-MK
(1.5-80) 36.50 34.35 5.89 32.60 10.68 31.68 13.21 30.10 17.52

193
Table 4.7.2.2. Loss in compressive strength of OPCC, MKC, SFRC & SFRC-MK mixes of M20 grade due to acid
attack (5 % H2SO4)
S.No Mix- ID
C.S
.before
immersi
on @ 30
days
(MPa)
CS after
immersi
on
@ 30
days
(MPa)
% loss
in C.S
@ 30
days
C.S after
immersion
@ 60 days
(MPa)
% loss
in C.S
@ 60
days
C.S after
immersion
@ 90 days
(MPa)
% loss
in C.S @
90 days
C.S after
immersion
@ 120 days
(MPa)
% loss
in C.S
@ 120
days
1 OPCC 30.69 19.99 34.86 18.96 38.20 18.21 40.68 17.56 42.72
2 MKC 32.86 22.75 30.76 21.71 33.92 20.98 36.14 20.35 38.06
3 SFRC
(1.5-60) 33.66 22.76 32.39 21.53 36.05 20.34 39.56 19.53 41.98
4 SFRC
(1.5-80) 34.10 23.60 30.78 22.13 35.10 21.20 37.82 20.12 41.00
5 SFRC-MK
(1.5-60) 36.14 26.66 26.23 26.10 27.78 25.10 30.54 24.29 32.78
6 SFRC-MK
(1.5-80) 36.50 27.43 24.86 27.21 25.45 25.82 29.26 25.16 31.06

194
Table 4.7.2.3. Loss in compressive strength of OPCC, MKC, SFRC & SFRC-MK mixes of M50 grade due to acid
attack (5 % HCL)
S.
No Mix ID
C.S. before
immersion
@ 30 days
(MPa)
CS after
immersion
@ 30 days
(MPa)
% loss
in C.S
@ 30
days
C.S after
immersion
@ 60 days
(MPa)
% loss
in C.S
@ 60
days
C.S after
immersion
@ 90 days
(MPa)
% loss
in C.S
@ 90
days
C.S after
immersion
@ 120 days
(MPa)
% loss
in C.S @
120
days
1 OPCC 61.40 57.88 5.73 55.49 9.62 52.64 14.26 50.02 18.53
2 MKC 68.90 67.41 2.15 66.98 2.78 64.14 6.90 61.62 10.57
3 SFRC
(1.5-60) 67.72 66.50 1.79 65.93 2.64 63.20 6.67 60.92 10.03
4 SFRC
(1.5-80) 69.04 68.30 1.07 67.70 1.94 65.00 5.84 62.69 9.19
5 SFRC-MK
(1.5-60) 74.00 73.38 0.83 73.02 1.32 70.82 4.30 69.32 6.33
6 SFRC-MK
(1.5-80) 75.68 75.40 0.36 75.10 0.76 72.98 3.56 71.45 5.59

195
Table 4.7.2.4. Loss in compressive strength of OPCC, MKC, SFRC & SFRC-MK mixes of M50 grade due to acid
attack (5 % H2SO4 )
S.
No Mix- ID
C.S. before
immersion
@ 30 days
(MPa)
CS after
immersion
@ 30 days
(MPa)
% loss
in C.S
@ 30
days
C.S after
immersion
@ 60 days
(MPa)
% loss
in C.S
@ 60
days
C.S after
immersion
@ 90 days
(MPa)
% loss
in C.S
@ 90
days
C.S after
immersion
@ 120 days
(MPa)
% loss
in C.S
@ 120
days
1 OPCC 61.40 50.42 17.87 48.86 20.43 47.72 22.28 46.56 24.16
2 MKC 68.90 62.22 9.69 60.65 11.97 60.17 12.66 56.98 17.30
3 SFRC
(1.5-60) 67.72 60.85 10.13 58.88 13.05 57.77 14.68 55.73 17.70
4 SFRC
(1.5-80) 69.04 63.37 8.21 61.53 10.87 60.07 12.98 58.64 15.06
5 SFRC-MK
(1.5-60) 74.00 70.43 4.82 69.93 5.49 68.67 7.20 67.05 9.38
6 SFRC-MK
(1.5-80) 75.68 73.11 3.39 72.48 4.23 71.63 5.34 70.59 6.72

196
Table 4.7.2.5. Percentage increase in resistance of MKC, SFRC & SFRC-MK mixes against the loss of
compressive strength in comparison with OPC concrete of M20 and M50 grade.
Grade of
concrete Type of mix
Resistance against percentage loss of compressive strength
5% HCL solution 5% H2SO4 solution
30
days
60
days 90 days
120
days
30
days 60 days 90 days
120
days
M20
MKC 1.78 3.13 3.22 2.68 4.08 4.28 4.54 4.66
SFRC (1.5-60) 1.88 3.70 3.69 3.67 12.45 12.15 1.12 0.77
SFRC (1.5-80) 2.51 4.24 4.65 4.16 4.06 3.10 2.86 1.72
SFRC-MK(1.5-60) 3.01 5.06 7.10 6.80 8.61 10.42 10.14 9.94
SFRC-MK(1.5-80) 3.57 5.60 7.73 9.44 9.98 12.75 11.42 11.66
M50
MKC 3.58 6.84 7.36 7.98 8.18 8.46 9.62 6.86
SFRC (1.5-60) 3.94 6.98 7.60 8.50 7.74 7.38 7.60 6.44
SFRC (1.5-80) 4.66 7.68 8.42 9.34 9.67 9.56 9.30 9.10
SFRC-MK(1.5-60) 4.90 8.30 9.96 12.20 13.05 14.94 15.08 14.78
SFRC-MK(1.5-80) 5.37 8.86 10.70 13.01 14.48 16.20 16.94 17.44

197
Table 4.7.3. Durability factors of OPCC, MKC, SFRC & SFRC-MK
mixes of M20 grade after immersing in 5% HCL solution
S.
No Mix- ID
Days of
Immersio
n
Relative
Strength (Sr) N M ADF
1 OPCC
30 90.52 30 120 22.63
60 83.71 60 120 41.85
90 79.05 90 120 59.28
120 73.08 120 120 73.08
2
MKC
30 92.33 30 120 23.08
60 86.85 60 120 43.42
90 82.28 90 120 61.72
120 76.38 120 120 76.38
3 SFRC
(1.5-60)
30 92.42 30 120 23.10
60 87.40 60 120 43.71
90 82.74 90 120 62.05
120 77.51 120 120 77.51
4 SFRC
(1.5-80)
30 93.04 30 120 23.26
60 87.94 60 120 43.97
90 83.69 90 120 62.76
120 77.95 120 120 77.95
5
SFRC –
MK
(1.5-60)
30 93.55 30 120 23.38
60 88.76 60 120 44.36
90 86.16 90 120 64.62
120 80.85 120 120 80.85
6
SFRC-
MK
(1.5-80)
30 94.11 30 120 23.52
60 89.32 60 120 44.66
90 86.79 90 120 65.09
120 82.46 120 120 82.46

198
Table 4.7.4. Durability factors of OPCC, MKC, SFRC & SFRC-MK
mixes of M20 grade after immersing in 5% H2SO4 solution
S.No Mix- ID Days of
Immersion
Relative
Strength
(Sr)
N M ADF
1
OPCC
30 65.14 30 120 16.28
60 61.77 60 120 30.88
90 59.33 90 120 44.50
120 57.21 120 120 57.21
2
MKC
30 69.23 30 120 17.30
60 66.07 60 120 33.03
90 63.84 90 120 47.88
120 61.93 120 120 61.93
3 SFRC
(1.5-60)
30 67.62 30 120 16.90
60 63.96 60 120 31.98
90 60.42 90 120 45.32
120 58.02 120 120 58.02
4
SFRC
(1.5-80)
30 69.20 30 120 17.30
60 64.89 60 120 32.44
90 62.17 90 120 46.62
120 59.00 120 120 59.00
5
SFRC –
MK
(1.5-60)
30 73.76 30 120 18.44
60 72.22 60 120 36.11
90 69.45 90 120 52.08
120 67.21 120 120 67.21
6
SFRC-
MK
(1.5-80)
30 75.15 30 120 18.78
60 74.55 60 120 37.27
90 70.73 90 120 53.04
120 68.93 120 120 68.93

199
Table 4.7.5. Durability factors of OPCC, MKC, SFRC & SFRC-MK
mixes of M50 grade after immersing in 5 % HCL
S.No Mix- ID Days of
Immersion
Relative
Strength
(Sr)
N M ADF
1
OPCC
30 94.26 30 120 23.57
60 90.37 60 120 45.18
90 85.73 90 120 64.30
120 81.46 120 120 81.46
2
MKC
30 97.85 30 120 24.46
60 97.21 60 120 48.60
90 93.10 90 120 69.82
120 89.43 120 120 89.43
3
SFRC
(1.5-60)
30 98.19 30 120 24.55
60 97.35 60 120 48.67
90 93.34 90 120 70.00
120 89.97 120 120 89.97
4
SFRC
(1.5-80)
30 98.92 30 120 24.73
60 98.05 60 120 49.02
90 94.14 90 120 70.61
120 90.80 120 120 90.80
5
SFRC-
MK
(1.5-60)
30 99.16 30 120 24.79
60 98.67 60 120 49.33
90 95.70 90 120 71.78
120 93.67 120 120 93.67
6
SFRC-
MK
(1.5-80)
30 99.63 30 120 24.90
60 99.15 60 120 49.57
90 96.43 90 120 72.31
120 94.47 120 120 94.47

200
Table 4.7.6. Durability factors of OPCC, MKC, SFRC & SFRC-MK
mixes of M50 grade after immersing in 5% H2SO4 solution
S.No Mix- ID Days of
Immersion
Relative
Strength,
(Sr)
N M ADF
1 OPCC
30 82.12 30 120 20.53
60 79.58 60 120 39.80
90 77.72 90 120 58.29
120 75.83 120 120 75.83
2
MKC
30 90.30 30 120 22.57
60 88.02 60 120 44.01
90 87.22 90 120 65.42
120 82.58 120 120 82.58
3
SFRC
(1.5-60)
30 89.85 30 120 22.46
60 86.94 60 120 43.47
90 85.32 90 120 63.99
120 82.27 120 120 82.27
4
SFRC
(1.5-80)
30 91.80 30 120 22.96
60 89.12 60 120 44.56
90 87.00 90 120 65.25
120 84.94 120 120 84.94
5
SFRC-
MK
(1.5-60)
30 95.17 30 120 23.79
60 94.50 60 120 47.25
90 92.74 90 120 69.59
120 90.62 120 120 90.62
6
SFRC-
MK
(1.5-80)
30 96.60 30 120 24.15
60 95.77 60 120 47.88
90 94.66 90 120 70.99
120 93.27 120 120 93.27
Sr = Relative strength at N days (%),
N = No. of days at which the durability factors is required.
M = Maximum No. of days at which the exposer is to be
terminated. ADF = Acid durability factor.

201
TABLE 4.8. LOAD DEFLECTION CHARACTERISTICS FOR SFRC AND SFRC-MK BEAMS OF M20
AND M50 GRADE
Table 4.8.1. Load deflection characteristics of SFRC beams of M20 grade with fibres (AR-60)
Load in KN
Deflection of steel fibre reinforced concrete beams of M20 grade in mm
0.00% Remarks 0.50% Remarks 1.0% Remarks 1.50% Remarks
0 0
First crack load = 38.50
kN
Load @
failure =
66.50 kN
0
First crack load = 45.5
kN
Load @
failure =
76.0 kN
0
First crack
load = 54.5 kN
Load @ failure =
90.5 kN
0
First
crack load = 61.5 kN
Load @ failure =
102 kN
5 3.10 2.70 2.60 2..40
12 3.80 3.20 3.0 2.70
10 5.10 4.20 3.80 3.30
20 5.90 5.0 4.60 3.90
25 6.80 5.70 5.10 4.30
30 8.90 6.20 5.70 4.80
35 11.40 8.00 7.10 6.00
40 13.20 9.60 8.50 7.30
45 15.80 11.30 9.80 8.40
50 17.00 12.60 11.10 9.50
55 17.70 13.10 12.50 10.70
60 18.50 14.50 13.50 11.80
65 19.30 15.80 14.60 12.90
70 17.10 15.70 14.10
75 18.40 17.00 15.40
80 18.10 16.70
85 19.70 17.90
90 21.00 19.30
95 20.20
100 21.80

202
Table 4.8.2. Load deflection characteristics for SFRC beams of M20 grade with fibres (AR-80)
Load in KN
Deflection of steel fibre reinforced concrete beams of M20 grade in mm
0.00% Remarks 0.50% Remarks 1.0% Remarks 1.50% Remarks
0 0
First crack load =
38.50 KN
Load @ failure =
66.50 KN
0
First crack load = 48.0
KN
Load @ failure =
78.5 KN
0
First crack load =
56.5KN
Load @ failure = 96
KN
0
First crack load = 64.5
KN
Load @ failure =
106 KN
5 3.10 2.50 2.40 2.30
10 3.80 3.00 2.80 2.60
15 5.10 3.80 3.50 3.10
20 5.90 4.50 4.20 3.50
25 6.80 5.00 4.50 4.00
30 8.90 5.50 5.00 4.30
35 11.40 6.80 6.10 5.00
40 13.20 8.20 7.20 6.40
45 15.80 9.50 8.20 7.30
50 17.00 10.70 9.40 8.10
55 17.70 11.40 10.20 8.50
60 18.50 12.70 11.50 10.10
65 19.30 14.10 13.20 12.10
70 15.40 13.90 12.40
75 16.80 15.30 13.50
80 18.10 16.70 15.10
85 18.40 16.70
90 20.00 18.30
95 21.90 20.10
100 21.80
105 23.20
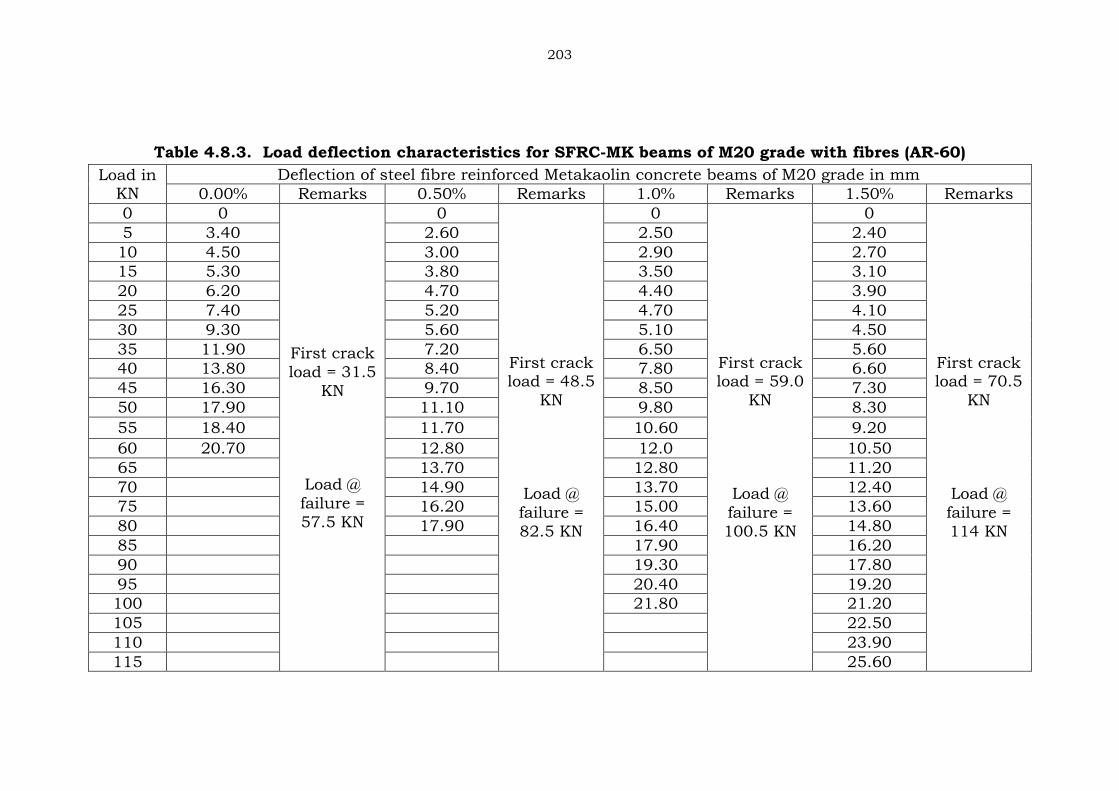
203
Table 4.8.3. Load deflection characteristics for SFRC-MK beams of M20 grade with fibres (AR-60)
Load in KN
Deflection of steel fibre reinforced Metakaolin concrete beams of M20 grade in mm
0.00% Remarks 0.50% Remarks 1.0% Remarks 1.50% Remarks
0 0
First crack
load = 31.5
KN
Load @
failure =
57.5 KN
0
First crack load = 48.5
KN
Load @
failure =
82.5 KN
0
First crack load = 59.0
KN
Load @
failure =
100.5 KN
0
First crack load = 70.5
KN
Load @
failure =
114 KN
5 3.40 2.60 2.50 2.40
10 4.50 3.00 2.90 2.70
15 5.30 3.80 3.50 3.10
20 6.20 4.70 4.40 3.90
25 7.40 5.20 4.70 4.10
30 9.30 5.60 5.10 4.50
35 11.90 7.20 6.50 5.60
40 13.80 8.40 7.80 6.60
45 16.30 9.70 8.50 7.30
50 17.90 11.10 9.80 8.30
55 18.40 11.70 10.60 9.20
60 20.70 12.80 12.0 10.50
65 13.70 12.80 11.20
70 14.90 13.70 12.40
75 16.20 15.00 13.60
80 17.90 16.40 14.80
85 17.90 16.20
90 19.30 17.80
95 20.40 19.20
100 21.80 21.20
105 22.50
110 23.90
115 25.60

204
Table 4.8.4. Load deflection characteristics for SFRC-MK beams of M20 grade with fibres (AR-80)
Load in KN
Deflection of steel fibre reinforced Metakaolin concrete beams of M20 grade in mm
0.00% Remarks 0.50% Remarks 1.0% Remarks 1.50% Remarks
0 0
First crack
load = 31.5 KN
Load @
failure =
57.5 KN
0
First crack load = 50.5
KN
Load @
failure = 86.0 KN
0
First crack
load = 65 KN
Load @
failure =
110 KN
0
First crack
load = 76 KN
Load @
failure =
122.5 KN
5 3.40 2.50 2.40 2.40
10 4.50 2.80 2.70 2.60
15 5.30 3.50 3.20 2.90
20 6.20 4.40 4.10 3.60
25 7.40 4.80 4.30 3.90
30 9.30 5.10 4.60 4.20
35 11.90 5.50 4.90 5.10
40 13.80 6.60 6.00 5.90
45 16.30 7.60 7.10 6.50
50 17.90 9.80 8.50 7.30
55 18.40 10.60 9.50 8.10
60 20.70 11.70 10.60 8.60
65 12.90 11.80 9.20
70 14.00 12.96 10.10
75 15.20 14.00 11.20
80 16.50 15.20 12.30
85 17.10 16.70 13.40
90 18.00 14.60
95 19.70 15.70
100 21.10 17.00
105 22.60 18.40
110 24.10 19.90
115 21.30
120 22.80
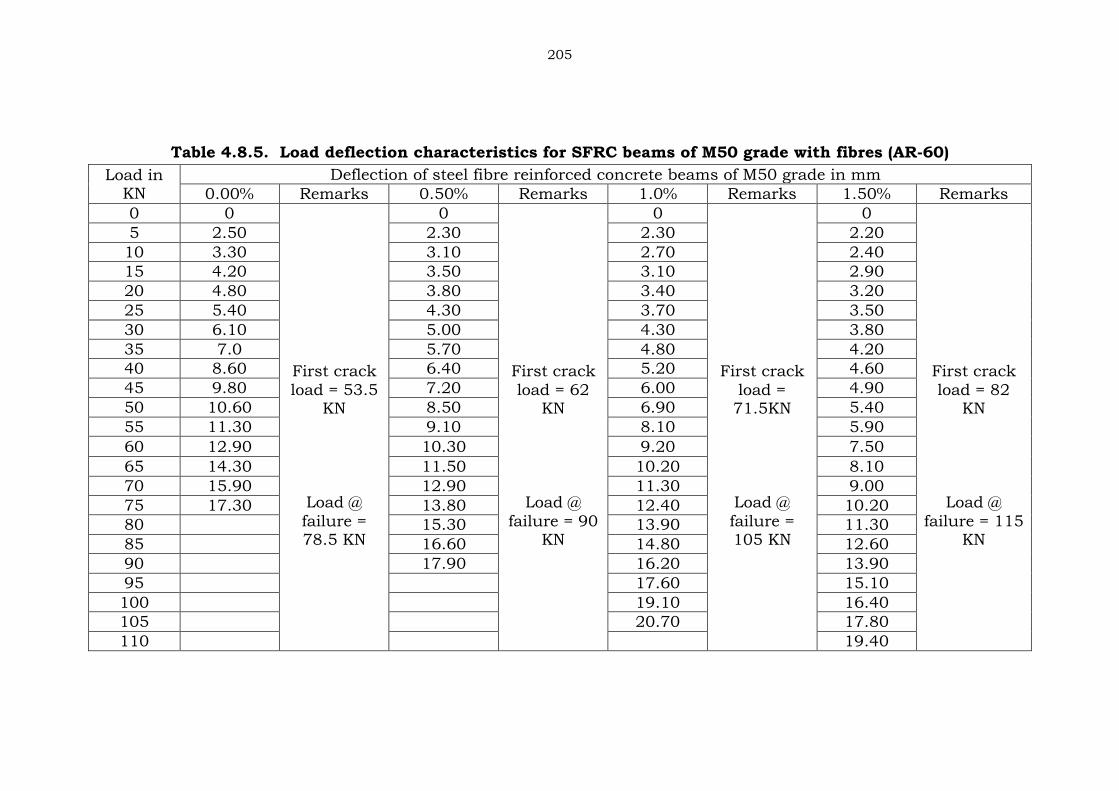
205
Table 4.8.5. Load deflection characteristics for SFRC beams of M50 grade with fibres (AR-60)
Load in KN
Deflection of steel fibre reinforced concrete beams of M50 grade in mm
0.00% Remarks 0.50% Remarks 1.0% Remarks 1.50% Remarks
0 0
First crack
load = 53.5 KN
Load @
failure = 78.5 KN
0
First crack
load = 62 KN
Load @
failure = 90 KN
0
First crack
load = 71.5KN
Load @
failure = 105 KN
0
First crack
load = 82 KN
Load @
failure = 115 KN
5 2.50 2.30 2.30 2.20
10 3.30 3.10 2.70 2.40
15 4.20 3.50 3.10 2.90
20 4.80 3.80 3.40 3.20
25 5.40 4.30 3.70 3.50
30 6.10 5.00 4.30 3.80
35 7.0 5.70 4.80 4.20
40 8.60 6.40 5.20 4.60
45 9.80 7.20 6.00 4.90
50 10.60 8.50 6.90 5.40
55 11.30 9.10 8.10 5.90
60 12.90 10.30 9.20 7.50
65 14.30 11.50 10.20 8.10
70 15.90 12.90 11.30 9.00
75 17.30 13.80 12.40 10.20
80 15.30 13.90 11.30
85 16.60 14.80 12.60
90 17.90 16.20 13.90
95 17.60 15.10
100 19.10 16.40
105 20.70 17.80
110 19.40

206
Table 4.8.6. Load deflection characteristics for SFRC beams of M50 grade with fibres (AR-80)
Load in
KN
Deflection of steel fibre reinforced concrete beams of M50 grade in mm
0.00% Remarks 0.50% Remarks 1.0% Remarks 1.50% Remarks
0 0
First crack load = 53.5
KN
Load @
failure =
78.5 KN
0
First crack load = 68
KN
Load @
failure = 96.5 KN
0
First crack load = 76
KN
Load @
failure = 112 KN
0
First crack load = 89 KN
Load @
failure = 122.5 KN
5 2.50 2.20 2.10 2.00
10 3.30 2.70 2.40 2.20
15 4.20 3.10 2.70 2.50
20 4.80 3.40 3.00 2.80
25 5.40 3.80 3.20 3.10
30 6.10 4.40 3.80 3.40
35 7.00 4.90 4.20 3.80
40 8.60 5.50 5.00 4.00
45 9.80 5.90 5.40 4.20
50 10.60 7.00 5.90 4.70
55 11.30 7.60 6.50 5.10
60 12.90 8.50 7.60 5.60
65 14.30 9.60 8.70 6.10
70 15.90 10.80 9.30 6.70
75 17.30 11.70 10.00 7.50
80 12.90 10.90 8.60
85 14.30 12.10 9.80
90 15.70 13.30 11.00
95 17.20 14.50 12.40
100 15.60 13.80
105 16.80 15.20
110 18.20 16.40
115 17.90
120 19.40
125 20.70

207
Table 4.8.7. - load deflection characteristics for SFRC-MK beams of M50 grade with fibres (AR-60)
Load in
KN
Deflection of steel fibre reinforced Metakaolin concrete beams of M50 grade in mm
0.00% Remarks 0.50% Remarks 1.0% Remarks 1.50% Remarks
0 0
First crack
load = 33.5
KN
0
First crack
load = 66
KN
0
First crack
load = 80.5
KN
0
First crack
load = 97.5
KN
5 2.60 2.30 2.30 2.20
10 3.50 2.80 2.50 2.40
15 4.60 3.10 2.70 2.70
20 5.50 3.30 2.90 3.00
25 6.30 3.70 3.10 3.20
30 7.10 4.20 3.50 3.50
35 8.30 4.70 3.80 3.80
40 9.40 5.10 4.10 4.10
45 10.50 5.60 4.70 4.30
50 11.80 6.40 5.30 4.70
55 13.90 7.30 6.10 5.00
60 15.20 8.50 6.80 5.80
65 17.00 9.60 7.70 6.50
70 10.70 8.50 7.20

208
75
Load @
failure = 65
KN
11.90
Load @
failure =
99.5 KN
9.60
Load @
failure =
118.5 KN
8.10
Load @
failure = 133
KN
80 13.10 10.80 9.20
85 14.40 11.80 10.30
90 15.80 12.90 11.50
95 17.00 14.10 12.60
100 18.20 15.30 13.80
105 16.50 14.90
110 17.80 16.20
115 19.00 17.50
120 18.40
125 19.70
130 21.66

209
Table 4.8.8. Load deflection characteristics for SFRC-MK beams of M50 grade with fibres (AR-80)
Load in
KN
Deflection of steel fibre reinforced Metakaolin concrete beams of M50 grade in mm
0.00% Remarks 0.50% Remarks 1.0% Remarks 1.50% Remarks
0 0
First crack
load = 33.5
KN
0
First crack
load =
72.5KN
0
First crack
load = 89
KN
0
First crack
load = 98
KN
5 2.60 2.20 2.10 2.10
10 3.50 2.50 2.30 2.20
15 4.60 2.80 2.50 2.30
20 5.50 3.10 2.80 2.60
25 6.30 3.30 3.00 2.70
30 7.10 3.80 3.40 3.00
35 8.30 4.20 3.70 3.20
40 9.40 4.70 3.90 3.50
45 10.50 5.00 4.30 3.80
50 11.80 5.70 4.60 4.10
55 13.90 6.10 4.90 4.30
60 15.20 6.80 5.50 4.80
65 17.00 7.70 6.20 5.10
70 8.60 6.80 5.60

210
75
Load @
failure =
65 KN
9.70
Load @
failure =
108 KN
7.50
Load @
failure =
129 KN
6.40
Load @
failure =
140 KN
80 10.60 8.20 7.20
85 11.60 8.90 8.00
90 12.80 9.70 8.90
95 13.90 11.00 10.00
100 15.30 11.90 11.10
105 16.60 13.00 12.30
110 17.90 14.20 13.50
115 15.50 14.60
120 16.60 15.80
125 17.90 17.10
130 19.20 18.50
135 19.80

211
Table 4.8.9. Ultimate flexural strength and deflection at ultimate flexural strength of SFRC & SFRC-MK beams
of M20 and M50 grade
Grade of
concrete
Type of mix
Ultimate flexural strength SFRC and
SFRC-MK beams (KN)
Deflections at maximum ultimate flexural
strength of SFRC and SFRC-MK beams (mm)
0% 0.50% 1.0% 1.5% 0% 0.50% 1.0% 1.5%
M20
SFRC (1.5-60) 66.50 76.50 90.50 101.8 19.30 19.70 22.70 23.10
SFRC (1.5-80) 66.50 78.50 96.0 106.0 19.30 18.16 21.90 22.80
SFRC-MK (1.5-60) 57.50 82.50 100.50 114 20.70 17.90 21.80 25.60
SFRC-MK (1.5-80) 57.50 86.0 110.0 122.5 20.70 17.10 22.60 21.30
M50
SFRC (1.5-60) 78.50 90 103.50 115.0 17.30 17.90 20.60 20.90
SFRC (1.5-80) 78.50 96.50 112.0 122.50 17.20 17.90 19.50 20.38
SFRC-MK (1.5-60) 65.0 99.5 118.50 133 17.00 18.20 19.00 21.60
SFRC-MK (1.5-80) 65.0 108.0 129.0 140 17.00 16.60 17.90 19.80

212
TABLE 4.9. LOAD DEFLECTION CHARACTERISTICS FOR SFRC AND SFRC-MK SLABS OF M20
AND M50 GRADE
Table 4.9.1. Load deflection characteristics of SFRC slabs of M20 grade with fibres (AR-80)
Load in
KN
Deflection of steel fibre reinforced concrete slabs of M20 grade in mm
0.00% Remarks 0.50% Remarks 1.0% Remarks 1.50% Remarks
0 0
First crack
load =
122.5 KN
Load @
failure =
195 KN
0
First crack
load =
147.5 KN
Load @
failure = 228
KN
0
First crack
load =
162.5 KN
Load @
failure =
242 KN
0
First crack
load =
178 KN
Load @
failure = 259
KN
15 0.20 0.10 0.05 0.05
30 0.30 0.20 0.20 0.15
45 0.40 0.30 0.25 0.20
60 0.50 0.40 0.30 0.25
75 0.60 0.50 0.40 0.35
90 0.80 0.60 0.50 0.45
105 1.30 0.9 0.70 0.60
120 2.10 1.3 0.90 0.80
135 3.10 1.8 1.40 1.10
150 4.40 2.6 1.60 1.30
165 5.60 3.5 2.0 1.50
180 7.80 4.6 2.90 1.80
195 10.20 5.8 3.70 2.20
210 6.9 4.60 2.80
225 8.0 5.80 3.80
240 9.20 7.0 4.90
255 8.60 6.20
270 7.40

213
Table 4.9.2. Load deflection characteristics of SFRC-MK slabs of M20 grade with fibres (AR-80)
Load in
KN
Deflection of steel fibre reinforced Metakaolin concrete slabs of M20 grade in mm
0.00% Remarks 0.50% Remarks 1.0% Remarks 1.50% Remarks
0 0
First crack
load =
97 KN
Load @
failure = 167
KN
0
First crack
load =
151 KN
Load @
failure = 225
KN
0
First crack
load =
169.5 KN
Load @
failure =
250 KN
0
First crack
load =
187.5 KN
Load @
failure = 269
KN
15 0.30 0.15 0.15 0.10
30 0.50 0.20 0.20 0.15
45 0.60 0.25 0.25 0.20
60 0.75 0.35 0.30 0.25
75 1.00 0.40 0.35 0.30
90 1.70 0.60 0.50 0.40
105 2.50 0.90 0.70 0.50
120 3.90 1.30 1.00 0.80
135 5.40 1.80 1.30 0.90
150 6.90 2.60 1.70 1.10
165 8.30 3.40 2.30 1.30
180 4.20 3.00 1.70
195 5.30 3.80 2.10
210 6.40 4.70 2.50
225 7.70 5.80 3.00
240 6.90 3.60
255 8.10 4.90
270 6.20

214
Table 4.9.3. Load deflection characteristics of SFRC slabs of M50 grade with fibres (AR-80)
Load in
KN
Deflection of steel fibre reinforced concrete slabs of M20 grade in mm
0.00% Remarks 0.50% Remarks 1.0% Remarks 1.50% Remarks
0 0
First crack
load = 219 KN
Load @
failure =
315 KN
0
First crack load =
237.5 KN
Load @ failure =
344 KN
0
First crack load =
244.5 KN
Load @ failure =
354 KN
0
First crack load = 262.5
KN
Load @ failure = 373
KN
15 0.15 0.08 0.05 0.05
30 0.30 0.15 0.15 0.10
45 0.40 0.25 0.20 0.15
60 0.50 0.30 0.25 0.20
75 0.70 0.50 0.35 0.30
90 1.10 0.70 0.50 0.40
105 1.70 1.00 0.75 0.60
120 2.40 1.40 1.00 0.80
135 3.80 2.00 1.30 1.00
150 4.30 2.20 1.60 1.20
165 5.10 2.90 2.00 1.50
180 6.00 4.00 2.60 1.90
195 7.20 4.50 3.30 2.20
210 8.60 6.20 4.00 2.70
225 10.00 7.90 4.90 3.20
240 11.70 9.00 5.80 3.70
255 13.00 10.10 6.70 4.50
270 14.40 11.20 7.90 5.30
285 15.70 12.50 9.10 6.40
300 16.90 13.40 10.30 7.30
315 18.20 14.70 11.60 8.50
330 15.90 12.80 9.80
345 17.40 14.10 11.00
360 15.50 12.30
375 13.60

215
Table 4.9.4. Load deflection characteristics of SFRC-MK slabs of M50 grade with fibres (AR-80)
Load in
KN
Deflection of steel fibre reinforced Metakaolin concrete slabs of M20 grade in mm
0.00% Remarks 0.50% Remarks 1.0% Remarks 1.50% Remarks
0 0
First crack
load = 143
KN
0
First crack
load =
267.5 KN
0
First crack
load =
276.5 KN
0
First crack
load = 300.5
KN
15 0.20 0.15 0.15 0.10
30 0.30 0.25 0.25 0.20
45 0.50 0.35 0.30 0.25
60 0.60 0.45 0.40 0.30
75 0.90 0.70 0.60 0.50
90 1.30 0.90 0.70 0.70
105 1.90 1.20 1.10 1.00
120 2.70 1.80 1.50 1.30
135 4.10 2.40 2.10 1.80
150 4.80 2.70 2.30 2.00
165 5.50 3.80 3.40 2.80
180 6.70 5.10 4.50 3.70
195 8.30 6.50 5.60 4.35
210 9.40 7.40 7.80 5.10
225 10.80 9.20 8.00 6.30
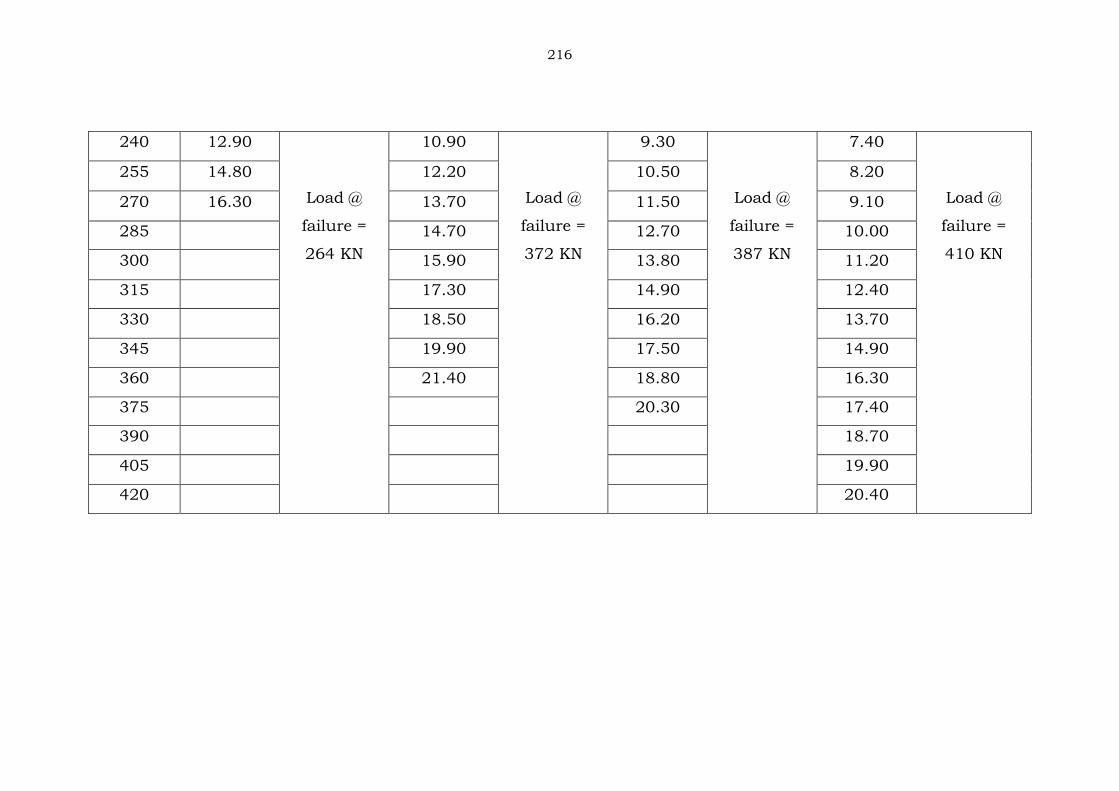
216
240 12.90
Load @
failure =
264 KN
10.90
Load @
failure =
372 KN
9.30
Load @
failure =
387 KN
7.40
Load @
failure =
410 KN
255 14.80 12.20 10.50 8.20
270 16.30 13.70 11.50 9.10
285 14.70 12.70 10.00
300 15.90 13.80 11.20
315 17.30 14.90 12.40
330 18.50 16.20 13.70
345 19.90 17.50 14.90
360 21.40 18.80 16.30
375 20.30 17.40
390 18.70
405 19.90
420 20.40

217
Table 4.9.5. Ultimate load and deflection at ultimate load of SFRC & SFRC-MK slabs of M20 and M50 grade
Grade of
concrete Type of mix
Ultimate load SFRC and SFRC-MK
slabs (KN)
Deflections at maximum ultimate load of
SFRC and SFRC-MK slabs (mm)
0% 0.50% 1.0% 1.5% 0% 0.50% 1.0% 1.5%
M20
SFRC (1.5-60) 195.0 211 231 249 10.20 9.70 8.60 7.70
SFRC (1.5-80) 195.0 228 242 259 10.20 10.50 7.0 6.20
SFRC-MK (1.5-60) 167.0 225 250 269 10.90 7.70 5.80 4.90
SFRC-MK (1.5-80) 167.0 238 255 275 10.90 6.50 4.60 3.80
M50
SFRC (1.5-80) 315.0 344 354 373 18.20 17.40 15.50 13.60
SFRC-MK (1.5-80) 264 372 387 410 16.30 22.80 21.60 20.40

218
0.0 0.2 0.4 0.6 0.8 1.0 1.2 1.4 1.6
0.86
0.88
0.90
0.92
0.94
0.96
0.98
Fig 1.0 Relation between workability of SFRC & SFRC-MK mixes of M20 grade
in terms of compacting factor and fibre content
SFRC(AR-60)
SFRC(AR-80)
SFRC-MK(AR-60)
SFRC-MK(AR-80)C
om
pacti
ng
fa
cto
r
Fiber content(%)
-0.2 0.0 0.2 0.4 0.6 0.8 1.0 1.2 1.4 1.6
0.72
0.74
0.76
0.78
0.80
0.82
0.84
0.86
0.88
0.90
Fig 2.0 Relation between workability of SFRC & SFRC-MK mixes
of M50 grade in terms of compacting factor and fiber content
SFRC(AR-60)
SFRC(AR-80)
SFRC-MK(AR-60)
SFRC-MK(AR-80)
Co
mp
acti
ng
facto
r
Fiber content(%)

219
0.0 0.2 0.4 0.6 0.8 1.0 1.2 1.4 1.6
20
30
40
50
60
70
80
90
100
Fig 3.0 Relation between workability of SFRC & SFRC-MK mixes
of M20 grade in terms of slump and fiber content
SFRC(AR-60)
SFRC(AR-80)
SFRC-mk(AR-60)
SFRC-mk(AR-80)
Slu
mp
(mm
)
Fiber content(%)
-0.2 0.0 0.2 0.4 0.6 0.8 1.0 1.2 1.4 1.60
10
20
30
40
50
60
70
80
90
100
110
120
Fig 4.0 Relation between workability of SFRC & SFRC-MK mixes
of M50 grade in terms of Vee-Bee time and fibre content
Ve
e-B
ee t
ime(s
ec
)
Fibre content(%)
SFRC(AR-60)
SFRC(AR-80)
SFRC-MK(AR-60)
SFRC-MK(AR-80)

220
-0.2 0.0 0.2 0.4 0.6 0.8 1.0 1.2 1.4 1.60.0
0.2
0.4
0.6
0.8
1.0
Fig 5.0 Relation between workability of SFRC & SFRC-MK mixes
of M20 grade in terms of compacting factor and fibre content
Co
mp
acti
ng
facto
r
Fibre content(%)
SFRC(AR-60)
SFRC(AR-80)
SFRC-MK(AR-60)
SFRC-MK(AR-80)
0.0 0.2 0.4 0.6 0.8 1.0 1.2 1.4 1.6
10
20
30
40
50
60
70
80
90
100
110
120
130
Fig 6.0 Relation between workability of SFRC & SFRC-MK mixes
of M50 grade in terms of Vee-Bee time and fiber content
SFRC(AR-60)
SFRC(AR-80)
SFRC-MK(AR-60)
SFRC-MK(AR-80)
Ve
e-B
ee t
ime
(se
c)
Fiber content(%)

221
-0.2 0.0 0.2 0.4 0.6 0.8 1.0 1.2 1.4 1.60
5
10
15
20
25
30
35
Fig 7.0 Relation between compressive strength of SFRC
mixes of M20 grade and fibre content
Co
mp
ress
ive
str
en
gth
(MP
a)
Fiber content(%)
(SFRC(AR-60)@ 7 days)
(SFRC(AR-60)@ 14 days)
(SFRC(AR-60)@ 28 days)
( SFRC(AR-80)@ 7 days)
(SFRC(AR-80)@ 14 days)
(SFRC(AR-80)@ 28 days)
0.0 0.2 0.4 0.6 0.80
5
10
15
20
25
30
35
Fig 8.0 Variation of compressive strength of SFRC Mixes @ 28 days of
M20 Grade with variation in fiber factor
Co
mp
ressiv
e s
tren
gth
(MP
a)
Fiber factor(F)
C S @ 28 DAYS
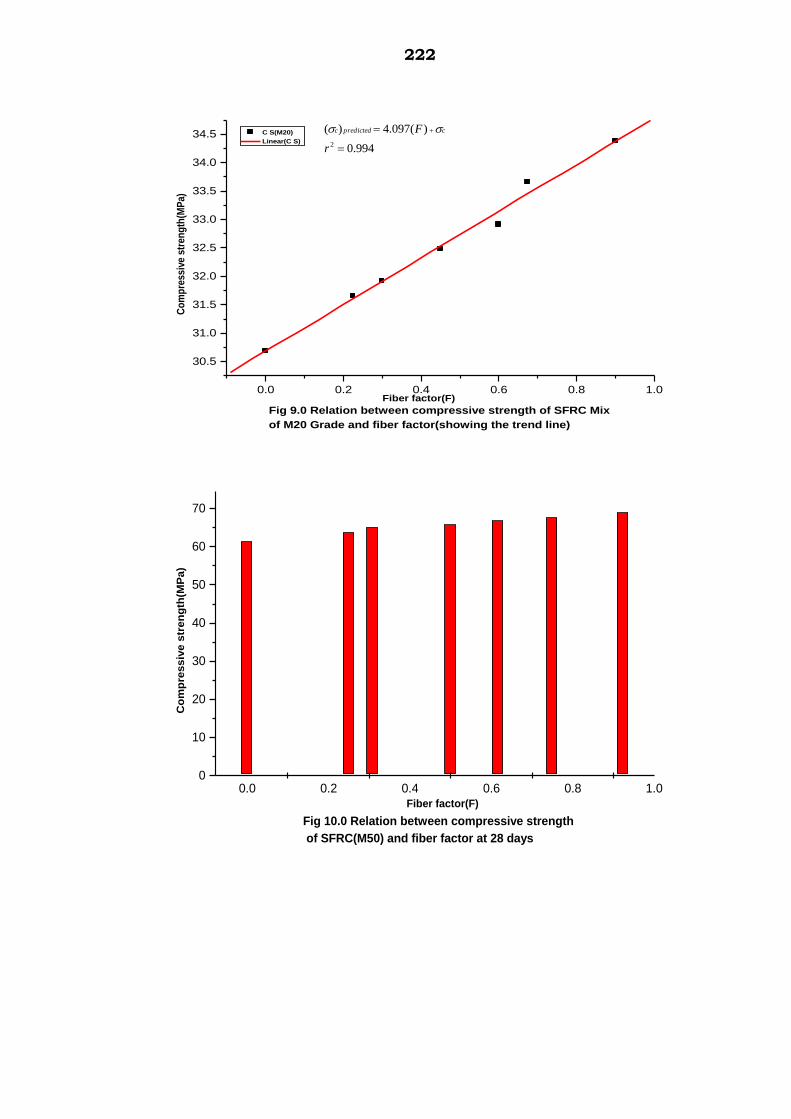
222
0.0 0.2 0.4 0.6 0.8 1.0
30.5
31.0
31.5
32.0
32.5
33.0
33.5
34.0
34.5
Fig 9.0 Relation between compressive strength of SFRC Mix
of M20 Grade and fiber factor(showing the trend line)
C S(M20)
Linear(C S)
Co
mp
ressiv
e s
tren
gth
(MP
a)
Fiber factor(F)
0.0 0.2 0.4 0.6 0.8 1.00
10
20
30
40
50
60
70
Fig 10.0 Relation between compressive strength
of SFRC(M50) and fiber factor at 28 days
Co
mp
ressiv
e s
tren
gth
(MP
a)
Fiber factor(F)
994.0
)(097.4)(
2
r
F cpredictedc

223
0.0 0.2 0.4 0.6 0.80
10
20
30
40
50
60
70
Fig 11.0 Variation of compressive strength of SFRC Mixes of
M50 Grade @ 28 days with variation in fiber factor
Co
mp
ress
ive
str
en
gth
(MP
a)
Fiber factor(F)
C S @ 28 DAYS
0.0 0.2 0.4 0.6 0.8 1.0
61
62
63
64
65
66
67
68
69
70
Fig 12.0 Relation between compressive strength of SFRC Mix of
M50 Grade and fiber factor(showing the trend line)
C S(M50)
Linear(C S)
Co
mp
ressiv
e s
tren
gth
(MP
a)
Fiber factor(F)
986.0
)(28.8)(
2
r
F cpredictedc

224
0.0 0.2 0.4 0.6 0.80
5
10
15
20
25
30
35
Fig 13.0 Variation of compressive strength of SFRC-MK Mixes of
M20 Grade @ 28 days with variation in fiber factor
Co
mp
res
siv
e s
tre
ng
th(M
Pa
)
Fiber factor(F)
C S(M20)@ 28 DAYS
0.0 0.2 0.4 0.6 0.8 1.00
5
10
15
20
25
30
35
Fig 14.0 Relation between compressive strength
of SFRC-MK(M20) and fiber factor at 28 days
Co
mp
ressiv
e s
tren
gth
(MP
a)
Fiber factor(F)
C S(M20)

225
0.0 0.2 0.4 0.6 0.8 1.0
32.5
33.0
33.5
34.0
34.5
35.0
35.5
36.0
36.5
37.0
Fig 15.0 Relation between compressive strength of SFRC-MK Mix
of M20 Grade and fiber factor(showing the trend line)
C S(M20)
Linear(C S)
Co
mp
ressiv
e s
tren
gth
(MP
a)
Fiber factor(F)
-0.2 0.0 0.2 0.4 0.6 0.8 1.0 1.2 1.4 1.60
10
20
30
40
50
60
70
80
Fig 16.0 Relation between compressive strength of SFRC-MK
mixes of M50 grade and fibre content
Co
mp
res
siv
e s
tre
ng
th(M
Pa
)
Fibre content(%)
SFRC-MK(AR-60)@ 7 days
SFRC-MK(AR-80)@ 7 days
SFRC-MK(AR-60)@ 14 days
SFRC-MK(AR-80)@ 14 days
SFRC-MK(AR-60)@ 28 days
SFRC-MK(AR-80)@ 28 days
982.0
)(95.3)(
2
r
F cpredictedc

226
0.0 0.2 0.4 0.6 0.8 1.0
68
69
70
71
72
73
74
75
76
Fig 17.0 Relation between compressive strength of SFRC-MK mixes
of M50 grade and fibre factor(showing the trend line)
C S(M50)
Data1B
Co
mp
ressiv
e s
tren
gth
(MP
a)
Fibre factor(F)
-0.2 0.0 0.2 0.4 0.6 0.8 1.0 1.2 1.4 1.60
1
2
3
4
5
6
7
Fig 18.0 Relation between split tensile strength of
SFRC mixes of M20 grade and fibre content
Sp
litt
ing
ten
sile s
tren
gth
(MP
a)
Fibre content(%)
SFRC(AR-60)(M20)
SFRC(AR-80)(M20)
SFRC(AR-60)(M50)
SFRC(AR-80)(M50)
991.0
)(097.2)(
2
r
F stpredictedst

227
0.0 0.2 0.4 0.6 0.8 1.0
2.6
2.8
3.0
3.2
3.4
3.6
3.8
4.0
4.2
4.4
4.6
4.8
Fig 19.0 Relation between split tensile strength of SFRC Mix
of M20 Grade and fiber factor(showing the trend line)
SPL.T S(M20)
Linear(SPL.T S)
Sp
lit t
ensi
le s
tren
gth
(MP
a)
Fiber factor(F)
0.0 0.2 0.4 0.6 0.80
1
2
3
4
5
Fig 20.0 Variation of split tensile strength of SFRC Mixes
of M20 Grade @ 28 days with variation in fiber factor
Sp
lit
ten
sil
e s
tre
ng
th(M
Pa
)
Fiber factor(F)
SPL.T S(M20)
991.0
)(097.2)(
2
r
F stpredictedst

228
0.0 0.2 0.4 0.6 0.8 1.00
1
2
3
4
5
6
7
8
Fig 21.0 Relation between splitting tensile strength
0f SFRC-MK OF M50 Grade in terms of fiber factor
Sp
litti
ng
ten
sile
str
eng
th(M
Pa)
Fiber factor(F)
SPL.T S(M50)
0.0 0.2 0.4 0.6 0.8 1.0
4.0
4.5
5.0
5.5
6.0
6.5
7.0
7.5
Fig 22.0 Relation between split tensile strength of SFRC Mix
of M50 Grade and fiber factor(showing the trend line)
SPL.T S(M50)
Linear(SPL.T S)
Sp
lit
ten
sile s
tren
gth
(MP
a)
Fiber factor(F)

229
0.0 0.2 0.4 0.6 0.8 1.00
1
2
3
4
5
6
7
Fig 23.0 Relation between splitting tensile strength of
SFRC Of M50 grade and fibre factor(showing the trend line)
Sp
litt
ing
ten
sil
e s
tre
ng
th(M
Pa
)
Fiber factor(F)
SPL.T S(M50)
0.0 0.2 0.4 0.6 0.8 1.0
3.0
3.5
4.0
4.5
5.0
Fig 24.0 Relation between split tensile strength of SFRC-MK Mix
of M20 Grade and fibre factor(showing the trend line)
SPL.T S(M20)
Linear(SPL.T S)
Sp
lit
ten
sile
str
en
gth
(MP
a)
Fiber factor(F)
993.0
)(125.2)(
2
r
F stpredictedst

230
0.0 0.2 0.4 0.6 0.80
1
2
3
4
5
Fig 25.0 Variation in split tensile strength of SFRC-MK Mixes of
M20 Grade @ 28 days with variation in fiber factor
Sp
lit
ten
sile
str
en
gth
(M2
0)
Fiber factor(F)
SPL.T S(M20)
-0.2 0.0 0.2 0.4 0.6 0.8 1.0 1.2 1.4 1.60
1
2
3
4
5
6
7
8
Fig 26.0 Relation between split tensile strength of SFRC-MK
mixes of M20 & M50 grade and fibre content
Sp
litt
ing
ten
sile s
tren
gth
(MP
a)
Fibre content(%)
SFRC(AR-60)(M20)
SFRC(AR-80)(M20)
SFRC(AR-60)(M50)
SFRC(AR-80)(M50)

231
0.0 0.2 0.4 0.6 0.80
1
2
3
4
5
6
7
8
Fig 27.0 Variation in split tensile strength of SFRC-MK Mixes of
M50 Grade @ 28 days with variation in fiber factor
Sp
lit
ten
sile s
tren
gth
(MP
a)
Fiber factor(F)
SPL.T S(M50)
0.0 0.2 0.4 0.6 0.8 1.0
4.5
5.0
5.5
6.0
6.5
7.0
7.5
8.0
Fig 28.0 Relation between split tensile strength of SFRC-MK Mix
of M50 Grade and fiber factor(showing the trend line)
SPL.T S(M50)
Linear(SPL.T S)
Sp
lit
ten
sile s
tren
gth
(MP
a)
Fiber factor(F)
982.0
)(30.3)(
2
r
F stpredictedst

232
0.0 0.2 0.4 0.6 0.8 1.0
4.0
4.5
5.0
5.5
6.0
6.5
7.0
Fig 29.0 Relation between modulus of rupture of SFRC Mix of
M20 Grade and fiber factor(showing the trend line)
MOR(M20)
Linear(MOR)
Mo
du
lus
of
rup
ture
(MP
a)
Fiber factor(F)
-0.2 0.0 0.2 0.4 0.6 0.8 1.0 1.2 1.4 1.60
1
2
3
4
5
6
7
8
9
Fig 30.0 Variation of modulus of rupture of SFRC Mixes of
M20 & M50 Grade with variation in fiber content
Mo
du
lus o
f ru
ptu
re(M
Pa)
Fiber content(%)
SFRC(AR-60)(M20)
SFRC(AR-80)(M20)
SFRC(AR-60)(M50)
SFRC(AR-80)(M50)
997.0
)(93.2)(
2
r
F rfpredictedrf

233
0.0 0.2 0.4 0.6 0.8 1.00
1
2
3
4
5
6
7
Fig 31.0 Relation between modulus of rupture of SFRC mixes
of M20 grade and fibre factor(showing the trend line)
Mo
du
lus
of
rup
ture
(MP
a)
Fiber factor(F)
M O R(M20)
0.0 0.2 0.4 0.6 0.8 1.0
5.0
5.5
6.0
6.5
7.0
7.5
8.0
8.5
9.0
9.5
Fig 32.0 Relation between modulus of rupture of SFRC Mix of
M50 Grade and fiber factor(showing the trend line)
MOR(M50)
Linear(MOR)
Mo
du
lus o
f ru
ptu
re(M
Pa)
Fiber factor(F)
992.0
)(32.4)(
2
r
F rfpredictedrf

234
0.0 0.2 0.4 0.6 0.8 1.00
2
4
6
8
Fig 33.0 Relation between modulus of rupture of
SFRC(M50)and fiber factor
Mo
du
lus o
f ru
ptu
re(M
Pa)
Fiber factor(F)
M O R(M50)
0.0 0.2 0.4 0.6 0.8 1.00
1
2
3
4
5
6
7
Fig 34.0 Relation between modulus of rupture of
SFRC-MK of M20 grade in terms of fiber factor
Mo
du
lus
of
rup
ture
(MP
a)
Fiber factor(F)
M O R(M20))

235
0.0 0.2 0.4 0.6 0.80
1
2
3
4
5
6
7
Fig 35.0 Relation between modulus of rupture of SFRC-MK mixes
of M20 grade and fibre factor
Mo
du
lus o
f ru
ptu
re(M
Pa)
Fibre factor(F)
M O R(M20)
0.0 0.2 0.4 0.6 0.8 1.0
4.0
4.5
5.0
5.5
6.0
6.5
7.0
Fig 36.0 Relation between modulus of rupture of SFRC-MK Mix
of M20 Grade and fiber factor(showing the trend line)
MOR(M20)
Linear(MOR)
Mo
du
lus o
f ru
ptu
re(M
Pa)
Fiber factor(F)
992.0
)(127.3)(
2
r
F rfpredictedrf

236
0.0 0.2 0.4 0.6 0.8 1.0
6
7
8
9
10
Fig 37.0 Relation between modulus of rupture of SFRC-MK Mix
of M50 Grade and fiber factor(showing the trend line)
MOR(M50)
Linear(MOR)
Mo
du
lus
of
rup
ture
(MP
a)
Fiber factor(F)
0.0 0.2 0.4 0.6 0.80
2
4
6
8
10
Fig 38.0 Variation of modulus of rupture of SFRC-MK Mixes of
M50 Grade with variation in fiber factor
Mo
du
lus
of
rup
ture
(MP
a)
Fiber factor(F)
M O R(M50)
992.0
)(47.4(
2
)
r
F rfpredictedrf

237
-0.2 0.0 0.2 0.4 0.6 0.8 1.0 1.2 1.4 1.60
5
10
15
20
25
30
35
40
Fig 39.0 Variation of modulus of elasticity of SFRC Mixes of
M20 & M50 Grade with variation in fiber content
Mo
du
lus
of
ela
sti
cit
y(G
Pa)
Fiber content(%)
SFRC(AR-60)(M20)
SFRC(AR-80)(M20)
SFRC(AR-60)(M50)
SFRC(AR-80)(M50)
0.0 0.2 0.4 0.6 0.80
5
10
15
20
25
Fig 40.0 Variation of modulus of elasticity of SFRC Mixes of
M20 Grade with variation in fiber factor
Mo
du
lus
of
ela
sti
cit
y(G
Pa
)
Fiber factor(F)
M O E(M20)
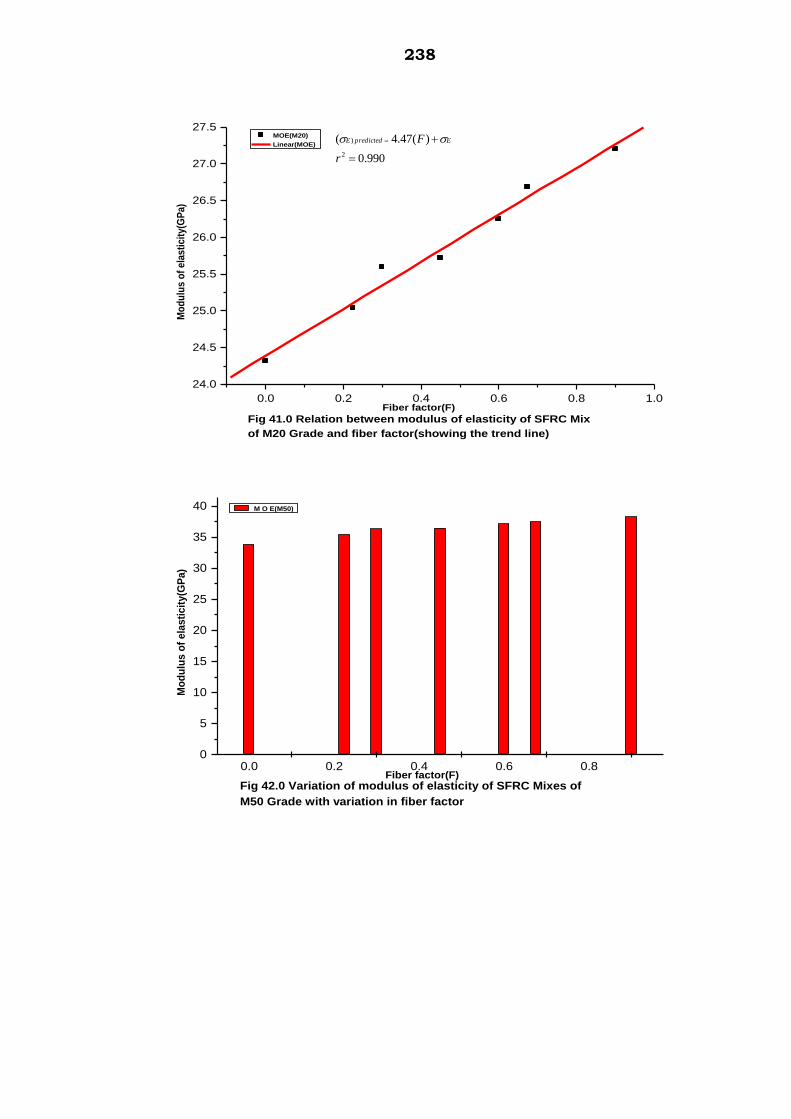
238
0.0 0.2 0.4 0.6 0.8 1.0
24.0
24.5
25.0
25.5
26.0
26.5
27.0
27.5
Fig 41.0 Relation between modulus of elasticity of SFRC Mix
of M20 Grade and fiber factor(showing the trend line)
MOE(M20)
Linear(MOE)
Mo
du
lus
of
ela
sti
cit
y(G
Pa)
Fiber factor(F)
0.0 0.2 0.4 0.6 0.80
5
10
15
20
25
30
35
40
Fig 42.0 Variation of modulus of elasticity of SFRC Mixes of
M50 Grade with variation in fiber factor
Mo
du
lus
of
ela
sti
cit
y(G
Pa)
Fiber factor(F)
M O E(M50)
990.0
)(47.4(
2
)
r
F EpredictedE

239
0.0 0.2 0.4 0.6 0.8 1.0
34
35
36
37
38
39
Fig 43.0 Relation between modulus of elasticity of SFRC mixes of
M50 grade and fibre factor(showing the trend line)
M O E(M50)
Data1B
Mo
du
lus
of
ela
sti
cit
y(G
Pa
)
Fibre factor(F)
-0.2 0.0 0.2 0.4 0.6 0.8 1.0 1.2 1.4 1.60
5
10
15
20
25
30
35
40
Fig 44.0 Variation of modulus of elasticity of SFRC-MK Mixes of
M20 & M50 Grade with variation in fiber content
Mo
du
lus o
f ela
sti
cit
y(G
Pa)
Fiber content(%)
SFRC-MK(AR-60)(M20)
SFRC-MK(AR-80)(M20)
SFRC-MK(AR-60)(M50)
SFRC-MK(AR-80)(M50)

240
0.0 0.2 0.4 0.6 0.80
5
10
15
20
25
30
Fig 45.0 Variation of modulus of elasticity of SFRC-MK Mixes of
M20 Grade with variation in fiber factor
Mo
du
lus
of
ela
sti
cit
y(G
Pa
)
Fiber factor(F)
M O E(M20)
0.0 0.2 0.4 0.6 0.8 1.0
25.0
25.5
26.0
26.5
27.0
27.5
28.0
Fig 46.0 Relation between modulus of elasticity of SFRC-MK Mix
of M20 Grade and fiber factor(showing the trend line)
MOE(M20)
Linear(MOE)
Mo
du
lus o
f ela
sti
cit
y(G
Pa)
Fiber factor(F)
983.0
)(68.2(
2
)
r
F EpredictedE

241
0.0 0.2 0.4 0.6 0.80
5
10
15
20
25
30
35
40
Fig 47.0 Variation of modulus of elasticity of SFRC-MK Mixes of
M50 Grade with variation in fiber factor
Mo
du
lus
of
ela
sti
cit
y(G
Pa
)
Fiber factor(F)
M O E(M50)
0.0 0.2 0.4 0.6 0.8 1.0
36
37
38
39
40
41
Fig 48.0 Relation between modulus of elasticity of SFRC-MK Mix
of M50 Grade and fiber factor(showing the trend line)
MOE(M50)
Linear(MOE)
Mo
du
lus
of
ela
sti
cit
y(G
Pa
)
Fiber factor(F)
993.0
)(51.4(
2
)
r
F EpredictedE

242
-0.2 0.0 0.2 0.4 0.6 0.8 1.0 1.2 1.4 1.60
50
100
150
200
250
300
350
400
450
500
Fig 49.0 Variation of impact resistance(No.of blows) of SFRC Mixes of
M20 & M50 Grade with variation in fiber content
Imp
act
resis
tan
ce(N
o.o
f b
low
s)
Fiber content(%)
SFRC(AR-60)(M20)(1 st crack)
SFRC(AR-60)(M20)(failure)
SFRC(AR-80)(M20)(1 st crack)
SFRC(AR-80)(M20)(failure)
SFRC(AR-60)(M50)(1 st crack)
SFRC(AR-60)(M50)(failure)
SFRC(AR-80)(M50)(1 st crack)
SFRC(AR-80)(M20)(failure)
0.0 0.2 0.4 0.6 0.80
50
100
150
200
Fig 50.0 Variation of impact resistance(No.of blows) of SFRC Mixes of
M20 Grade with variation in fiber factor
Imp
ac
t re
sis
tan
ce
(No
.of
blo
ws
)@ f
ail
ure
Fiber factor(F)
I R(M20)

243
0.0 0.2 0.4 0.6 0.8 1.0
0
50
100
150
200
250
Fig 51.0 Relation between impact resistance(number of blows) of SFRC
Mix of M20 Grade and fiber factor(showing the trend line)
I R(M20)
Linear(I R)
Imp
act
resis
tan
ce(n
um
ber
of
blo
ws)
Fiber factor(F)
0.0 0.2 0.4 0.6 0.80
100
200
300
400
500
Fig 52.0 Variation of impact resistance(No.of blows) of SFRC
Mixes of M50 Grade with variation in fiber factor
Imp
ac
t re
sis
tan
ce
(No
.of
blo
ws
)@ f
ail
ure
Fiber factor(F)
I R(M50)
993.0
)(243(
2
)
r
F IpredictedI

244
0.0 0.2 0.4 0.6 0.8 1.0
0
100
200
300
400
500
Fig 53.0 Relation between impact resistance(number of blows) of SFRC
Mix of M50 Grade and fiber factor(showing the trend line)
I R(M50)
Linear(I R)
Imp
act
resis
tan
ce(n
um
ber
of
blo
ws)
Fiber factor(F)
-0.2 0.0 0.2 0.4 0.6 0.8 1.0 1.2 1.4 1.60
50
100
150
200
250
300
350
400
450
500
550
600
650
700
750
800
850
900
Fig 54.0 Variation of impact resistance of SFRC-MK Mixes
of M20 & M50 Grade with variation in fiber content
Imp
act
resis
tan
ce(N
o.o
f b
low
s)@
failu
re
Fiber content(%)
SFRC-MK(AR-60)(M20)@ Failure
SFRC-MK(AR-80)(M20)@ Failure
SFRC-MK(AR-60)(M50)@ Failure
SFRC-MK(AR-80)(M50)@ Failure
994.0
)(523(
2
)
r
F IpredictedI

245
0.0 0.2 0.4 0.6 0.80
50
100
150
200
250
300
350
400
Fig 55.0 Variation of impact resistance(No.of blows) of SFRC-MK Mixes
of M20 Grade @ failure with variation in fiber factor
Imp
act
resis
tan
ce(N
o.o
f b
low
s)@
failu
re
Fiber factor(F)
I R(M20)
0.0 0.2 0.4 0.6 0.8 1.0
0
100
200
300
400
Fig 56.0 Relation between impact resistance(number of blows) of SFRC-MK
Mix of M20 Grade and fiber factor(showing the trend line)
I R(M20)
Linear(I R)
Imp
act
resis
tan
ce(n
um
ber
of
blo
ws)
Fiber factor(F)
998.0
)(461(
2
)
r
F IpredictedI
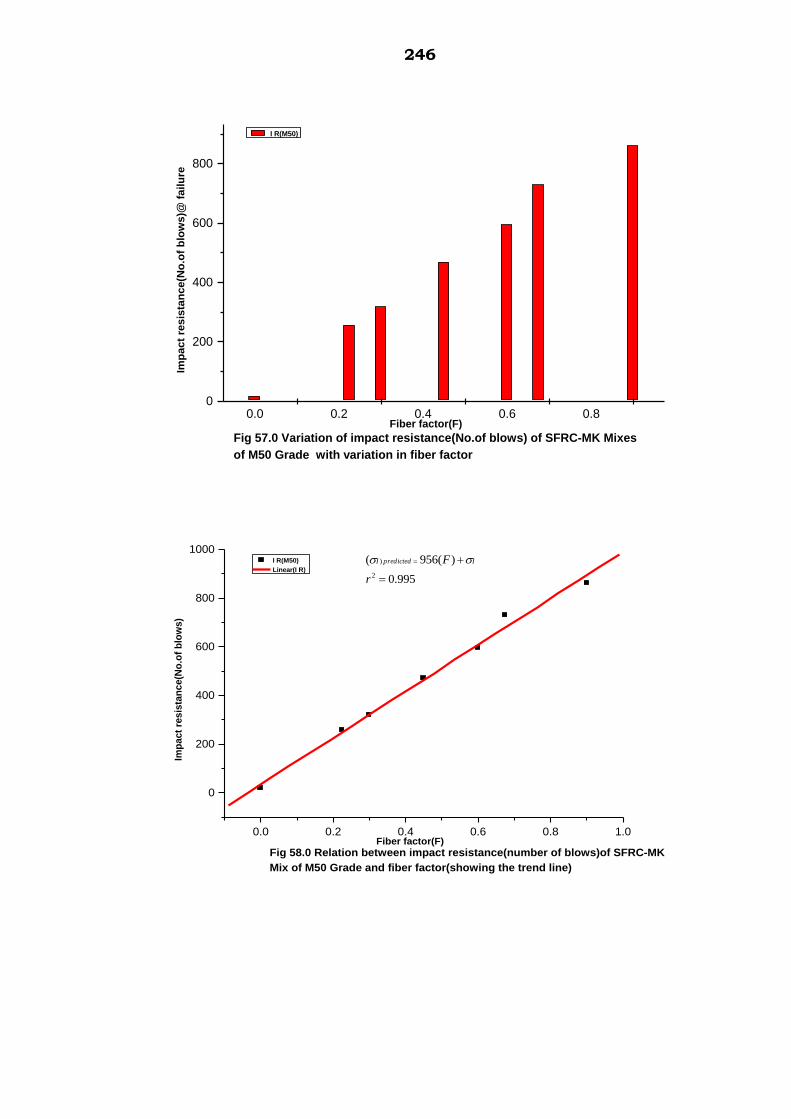
246
0.0 0.2 0.4 0.6 0.80
200
400
600
800
Fig 57.0 Variation of impact resistance(No.of blows) of SFRC-MK Mixes
of M50 Grade with variation in fiber factor
Imp
act
resis
tan
ce(N
o.o
f b
low
s)@
failu
re
Fiber factor(F)
I R(M50)
0.0 0.2 0.4 0.6 0.8 1.0
0
200
400
600
800
1000
Fig 58.0 Relation between impact resistance(number of blows)of SFRC-MK
Mix of M50 Grade and fiber factor(showing the trend line)
I R(M50)
Linear(I R)
Imp
act
resis
tan
ce(N
o.o
f b
low
s)
Fiber factor(F)
995.0
)(956(
2
)
r
F IpredictedI

247
20 40 60 80 100 1200
5
10
15
20
25
Fig 59.0 Percentage loss in compressive strength of OPCC,MKC,SFRC & SFRC-MK Mixes
of M20 Grade after immersion in 5% HCL for 30,60,90 & 120 days
Perc
en
tag
e lo
ss in
co
mp
ressiv
e s
tren
gth
Days of immersion
OPCC
MKC
SFRC(AR-60)(1.5% Fibres)
SFRC(AR-80)(1.5% Fibres)
SFRC-MK(AR-60)(1.5% Fibres)
SFRC-MK(AR-80)(1.5% Fibres)
20 40 60 80 100 1200
10
20
30
40
Fig 60.0 Percentage loss in compressive strength of OPCC,MKC,SFRC &
SFRC-MK mixes of M20 grade when immersed in 5% H2SO
4 Solution
% L
os
s i
n c
om
pre
ss
ive
str
en
gth
Days of immersion
OPCC
MKC
SFRC(AR-60)(1.5% Fibres)
SFRC(AR-80)(1.5% Fibres)
SFRC-MK(AR-60)(1.5% Fibres)
SFRC-MK(AR-80)(1.5% Fibres)

248
20 40 60 80 100 1200
2
4
6
8
10
12
14
16
18
20
Fig 61.0 Percentage loss in compressive strength of OPCC,MKC,SFRC & SFRC-MK Mixes
of M50 Grade after immersion in 5% HCL for 30,60,90 & 120 days
Perc
en
tag
e lo
ss in
co
mp
ressiv
e s
tren
gth
Days of immersion
OPCC
MKC
SFRC(AR-60)
SFRC(AR-80)
SFRC-MK(AR-60)
SFRC-MK(AR-80)
20 40 60 80 100 1200
5
10
15
20
25
Fig 62.0 Percentage loss in compressive strength of OPCC,MKC,SFRC & SFRC-MK
Mixes of M50 Grade after immersion in 5% H2SO
4 for 30,60,90 & 120 days
Perc
en
tag
e lo
ss in
co
mp
ressiv
e s
tren
gth
Days of immersion
OPCC
MKC
SFRC(AR-60)
SFRC(AR-80)
SFRC-MK(AR-60)
SFRC-MK(AR-80)

249
20 40 60 80 100 1200
2
4
6
8
10
12
14
Fig 63.0 Percentage increase in resistance of MKC,SFRC & SFRC-MK Mixes of
M20 & M50 Grade after immersion in 5% HCL for 30,60,90 & 120 days
when compared with their respective OPCC Mixes
% i
ncre
ase in
re
sis
tan
ce t
o c
om
pre
ssiv
e s
tren
gth
Days of immersion
MKC(M20)
MKC(M50)
SFRC(AR-60)(M20)
SFRC(AR-60)(M50)
SFRC(AR-80)(M20)
SFRC(AR-80)(M50)
SFRC-MK(AR-60)(M20)
SFRC-MK(AR-60)(M50)
SFRC-MK(AR-80)(M20)
SFRC-MK(AR-80)(M50)
20 40 60 80 100 1200
1
2
3
4
5
6
7
8
9
10
11
12
13
14
15
16
17
18
Fig 64.0 Percentage increase in resistance of MKC,SFRC & SFRC-MK Mixes
of M20 & M50 Grade after immersion in 5% H2SO
4 for 30,60,90 & 120
days when compared with their respective OPCC Mixes
% in
crea
se in
res
ista
nce
of
com
pre
ssiv
e st
ren
gth
Days of immersion
OPCC(M20)
OPCC(M50)
MKC(M20)
MKC(M50)
SFRC(AR-60)(M20)
SFRC(AR-60)(M50)
SFRC(AR-80)(M20)
SFRC(AR-80)(M50)
SFRC-MK(AR-60)(M20)
SFRC-MK(AR-60)(M50)

250
20 40 60 80 100 1200
2
4
6
8
10
Fig 65.0 Percentage loss in weight of OPCC,MKC,SFRC & SFRC-MK mixes
of M20 grade when immersed in 5% HCL for 30,60,90 & 120 days
% L
os
s i
n w
eig
ht
Days of immersion
OPCC
MKC
SFRC(AR-60)(1.5% Fibres)
SFRC(AR-80)(1.5% Fibres)
SFRC-MK(AR-60)(1.5% Fibres)
SFRC-MK(AR-80)(1.5% Fibres)
20 40 60 80 100 1200
5
10
15
20
25
30
35
Fig 66.0 Percentage loss in weight of OPCC,MKC,SFRC & SFRC-MK mixes
of M20 grade when immersed in 5% H2SO
4 Solution for 30,60,90 & 120 days
% L
os
s i
n w
eig
ht
Days of immersion
OPCC
MKC
SFRC(AR-60)(1.5% Fibres)
SFRC(AR-80)(1.5% Fibres)
SFRC-MK(AR-60)(1.5% Fibres)
SFRC-MK(AR-80)(1.5% Fibres)

251
20 40 60 80 100 1200
2
4
6
8
10
Fig 67.0 Percentage loss in weight of OPCC,MKC,SFRC & SFRC-MK mixes
of M50 grade when immersed in 5% HCL for 30,60,90 & 120 days.
% L
oss in
weig
ht
Days of immersion
OPCC
MKC
SFRC(AR-60)(1.5% Fibres)
SFRC(AR-80)(1.5% Fibres)
SFRC-MK(AR-60)(1.5% Fibres)
SFRC-MK(AR-80)(1.5% Fibres)
20 40 60 80 100 1200
5
10
15
20
25
Fig 68.0 Percentage loss in weight of OPCC,MKC,SFRC & SFRC-MK mixes
of M50 grade when immersed in 5% H2SO
4 solution for 30,60,90 & 120 days
% L
oss i
n w
eig
ht
Days of immersion
OPCC
MKC
SFRC(AR-60)(1.5% Fibres)
SFRC(AR-80)(1.5% Fibres)
SFRC-MK(AR-60)(1.5% Fibres)
SFRC-MK(AR-80)(1.5% Fibres)

252
20 40 60 80 100 1200
10
20
30
40
50
60
70
80
Fig 69.0 Acid durability factors of OPCC,MKC,SFRC & SFRC-MK mixes
of M20 grade when immersed in 5% HCL solution for 30,60,90 & 120 days
Ac
id d
ura
bil
ity f
ac
tor
Days of immersion
OPCC
MKC
SFRC(AR-60)(1.5% Fibres)
SFRC(AR-80)(1.5% Fibres)
SFRC-MK(AR-60)(1.5% Fibres)
SFRC-MK(AR-80)(1.5% Fibres)
20 40 60 80 100 1200
10
20
30
40
50
60
70
Fig 70.0 Acid durability factors of OPCC,MKC,SFRC & SFRC-MK mixes
of M20 grade when immersed in 5% H2SO4 solution for 30,60,90 & 120 days
Acid
du
rab
ilit
y f
acto
r
Days of immersion
OPCC
MKC
SFRC(AR-60)(1.5% Fibres)
SFRC(AR-80)(1.5% Fibres)
SFRC-MK(AR-60)(1.5% Fibres)
SFRC-MK(AR-80)(1.5% Fibres)

253
20 40 60 80 100 1200
10
20
30
40
50
60
70
80
90
100
Fig 71.0 Acid durability factors of OPCC,MKC,SFRC & SFRC-MK mixes
of M50 grade when immersed in 5% HCL solution for 30.60.90 & 120 days
Acid
du
rab
ilit
y f
acto
r
Days of immersion
OPCC
MKC
SFRC(AR-60)(1.5% Fibres)
SFRC(AR-80)(1.5% Fibres)
SFRC-MK(AR-60)(1.5% Fibres)
SFRC-MK(AR-80)(1.5% Fibres)
20 40 60 80 100 1200
10
20
30
40
50
60
70
80
90
100
Fig 72.0 Acid durability factors of OPCC,MKC,SFRC & SFRC-MK mixes
of M50 grade when immersed in 5% H2SO
4 solution for 30,60,90 & 120 days
Ac
id d
ura
bilit
y f
ac
tor
Days of immersion
OPCC
MKC
SFRC(AR-60)(1.5% Fibres)
SFRC(AR-80)(1.5% Fibres)
SFRC-MK(AR-60)(1.5% Fibres)
SFRC-MK(AR-80)(1.5% Fibres)

254
0 100 200 300 400 500 6000
5
10
15
20
25
30
35
Fig 73.0 Variation in compressive strength of OPCC,MKC,SFRC & SFRC-MK mixes
of M20 grade with variation in temperature at 2000C,400
0C, & 600
0C
Re
sid
ua
l co
mp
ress
ive
str
en
gth
(MP
a)
Temperature in 0C
OPCC
MKC
SFRC(AR-60)(1.5% Fibres)
SFRC(AR-80)(1.5% Fibres)
SFRC-MK(AR-60)(1.5% Fibres)
SFRC-MK(AR-80)(1.5% Fibres)
0 100 200 300 400 500 6000
5
10
15
20
25
30
35
40
Fig 74.0 Variation of compressive strength of OPCC,MKC,SFRC & SFRC-MK mixes of
M20 grade after exposing to elevated temperatures and alternately cooled @ 2000C,400
0C&600
0C
Resid
ual co
mp
ressiv
e s
tren
gth
(MP
a)
Temperature in 0C
OPCC @ elevated temperature
OPCC after cooling
MKC @ elevated temperature
MKC after cooling
SFRC(AR-60) @ elevated temperature
SFRC after cooling
SFRC-MK(AR-80) @ elevated temperature
SFRC(AR-80) after cooling
SFRC-MK(AR-60) @ elevated temperature
SFRC-MK(AR-60)after cooling
SFRC-MK(AR-80) @ elevated temperature
SFRC-MK(AR-80)after cooling

255
0 100 200 300 400 500 6000
10
20
30
40
50
60
70
80
Fig 75.0 Variation of compressive strength of OPCC,MKC,SFRC & SFRC-MK mixes of
M50 grade with variation in temperature @ 2000C, 400
0C & 600
0C
Resid
ual co
mp
ressiv
e s
tren
gth
(MP
a)
Temperature in 0C
OPCC
MKC
SFRC(AR-60)(1.5% Fibres)
SFRC(AR-80)(1.5% Fibres)
SFRC-MK(AR-60)(1.5% Fibres)
SFRC-MK(AR-80)(1.5% Fibres)
0 100 200 300 400 500 6000
10
20
30
40
50
60
70
80
Fig 76.0 Variation in compressive strength of OPCC,MKC,SFRC & SFRC-MK mixes of
M50 grade when exposed to elevated temperature and alternately cooled @ 2000C,400
0C&600
0C
Resid
ual co
mp
ressiv
e s
tren
gth
(MP
a)
Temperature in 0C
OPCC @ elevated temperature
OPCC after cooling
MKC @ elevated temperature
MKC after cooling
SFRC(AR-60)@ elevated temperature
SFRC(AR-60)After cooling
SFRC(AR-80)@ elevated temperature
SFRC(AR-80) after cooling
SFRC-MK(AR-60)@ elevated temperature
SFRC(AR-60) after cooling
SFRC-MK(AR-80)@ elevated temperature
SFRC-MK(AR-80) after cooling

256
0 100 200 300 400 500 600
-1
0
1
2
3
4
5
6
7
8
9
10
11
12
13
14
15
16
Fig 77.0 Variation of % weight loss of OPCC,MKC,SFRC & SFRC-MK Mixes of M20 & M50
Grade with variation in temperature @ 2000C,400
0C & 600
0C by using fibers
of aspect ratio 60 & 80
OPCC(M20)
OPCC(M50)
MKC(M20)
MKC(M50)
SFRC(20-60)
SFRC(50-60)
SFRC(20-80)
SFRC(50-60)
SFRC-MK(20-60)
SFRC-MK(50-60)
SFRC-MK(20-80)
SFRC-MK(50-80)
% W
eig
ht
loss
Temperature in 0C
0 100 200 300 400 500 6000
1
2
3
4
5
6
7
8
9
10
11
12
13
14
15
16
Fig 78.0 Variation of % weight loss of OPCC,MKC,SFRC & SFRC-MK Mixes of M20 & M50 Grade
with variation in temperature @ 2000c,400
0c & 600
0c by using fibers of aspect
ratio 60 & 80
% W
eig
ht
los
s
Temperature in 0C
OPCC(M20)
OPCC(M50)
MKC(M20)
MKC(M50)
SFRC(20-60)
SFRC(50-60)
SFRC(20-80)
SFRC(50-80)
SFRC-MK(20-60)
SFRC-MK(50-60)
SFRC-MK(20-80)
SFRC-MK(20-80)

257
0 100 200 300 400 500 6000
1000
2000
3000
4000
Fig 79.0 Variation in pulse velocity of OPCC,MKC,SFRC & SFRC-MK Mixes of M20 & M50 Grade
with variation in temperature @ 2000C,400
0C & 600
0C by using fibers of aspect
ratio 60 & 80
Pu
lse
ve
loc
ity(m
/s)
Temperature in 0C
OPCC(M20)
OPCC(M50)
MKC(M20)
MKC(M50)
SFRC(20-60)
SFRC(50-60)
SFRC(20-80)
SFRC(50-80)
SFRC-MK(20-60)
SFRC-MK(50-60)
SFRC-MK(20-80)
SFRC-MK(50-80)
-20 0 20 40 60 80 100 120 140 160 180 200
-20
-15
-10
-5
0
5
10
15
Fig 80.0 % increase/decrease in compressive strength of OPCC,MKC,SFRC & SFRC-MK Mixes of M20 & M50 Grade
with variation in 0,28,90 & 180 thermal cycles when exposed to 500C by using fibers of
aspect ratio 60 & 80
OPCC(M20)
OPCC(M50)
MKC(M20)
MKC(M50)
SFRC(20-60)
SFRC(50-60)
SFRC(20-80)
SFRC(50-80)
SFRC-MK(20-60)
SFRC-MK(50-60)
SFRC-MK(20-80)
SFRC-MK(50-80)
Incre
ase/d
ecre
ase in
co
mp
ressiv
e s
tren
gth
(%)
Number of thermal cycles

258
-20 0 20 40 60 80 100 120 140 160 180 200
-40
-35
-30
-25
-20
-15
-10
-5
0
5
10
15
20
Fig 81.0 % increase/decrease in compressive strength of OPCC,MKC,SFRC & SFRC-MK Mixes of M20 & M50 Grade
with variation in 0,28,90 & 180 thermal cycles @ 1000C by using fibers of aspect ratio 60 & 80
OPCC(M20)
OPCC(M50)
MKC(M20)
MKC(M50)
SFRC(20-60)
SFRC(50-60)
SFRC(20-80)
SFRC(50-80)
SFRC-MK(20-60)
SFRC-MK(50-60)
SFRC-MK(20-80)
SFRC-MK(50-80)
Incre
ase/d
ecre
ase in
co
mp
ressiv
e s
tren
gth
(%)
Number of thermal cycles
-20 0 20 40 60 80 100 120 140 160 180 200
-30
-25
-20
-15
-10
-5
0
5
10
15
20
Fig 82.0 % Variation in split tensile strength of various mixes of M20 & M50
grade at 28, 90 & 180 thermal cycles when exposed to 500C
OPCC(M20)
OPCC(M50)
MKC(M20)
MKC(M50)
SFRC(AR-60)(M20)
SFRC(AR-60)(M50)
SFRC(AR-80)(M20)
SFRC(AR-80)(M50)
SFRC-MK(AR-60)(M20)
SFRC-MK(AR-60)(M50)
SFRC-MK(AR-80)(M20)
SFRC-MK(AR-80)(M50)
% V
ari
ati
on
in
sp
lit
ten
sil
e s
tre
ng
th
Thermal cycles

259
-20 0 20 40 60 80 100 120 140 160 180 200
-40
-35
-30
-25
-20
-15
-10
-5
0
5
10
15
20
25
Fig 83.0 % Variation in split tensile strength of various mixes of M20 & M50)
grade at 28, 90 & 180 thermal cycles when exposed to 1000C
OPCC(M20)
OPCC(M50)
MKC(M20)
MKC(M50)
SFRC(AR-60)(M20)
SFRC(AR-60)(M50)
SFRC(AR-80)(M20)
SFRC(AR-80)(M50)
SFRC-MK(AR-60)(M20)
SFRC-MK(AR-60)(M50)
SFRC-MK(AR-80)(M20)
SFRC-MK(AR-80)(M50)
% V
ari
ati
on
in
sp
lit
ten
sile s
tren
gth
Thermal cycles
-20 0 20 40 60 80 100 120 140 160 180 200
-30
-25
-20
-15
-10
-5
0
5
10
15
Fig 84.0 % Variation of modulus of rupture of various mixes of M20 & M50 grade
at 0, 28, 90 and 180 thermal cycles when exposed to 500C
OPCC(M20)
OPCC(M50)
MKC(M20)
MKC(M50)
SFRC(AR-60)(M20)
SFRC(AR-60)(M50)
SFRC(AR-80)(M20)
SFRC(AR-80)(M50)
SFRC-MK(AR-60)(M20)
SFRC-MK(AR-60)(M50)
SFRC-MK(AR-80)(M20)
SFRC-MK(AR-80)(M50)
% V
aria
tio
n in
mo
du
lus
of
rup
ture
Thermal cycles

260
-20 0 20 40 60 80 100 120 140 160 180 200
-40
-35
-30
-25
-20
-15
-10
-5
0
5
10
15
20
Fig 85.0 % Variation of modulus of rupture of various mixes of M20
and M50 grade at 0,28,90 & 180 thermal cycles at 1000C
OPCC(M20)
OPCC(M50)
MKC(M20)
MKC(M50)
SFRC(AR-60)(M20)
SFRC(AR-60)(M50)
SFRC(AR-80)(M20)
SFRC(AR-80)(M50)
SFRC-MK(AR-60)(M20)
SFRC-MK(AR-60)(M50)
SFRC-MK(AR-80)(M20)
SFRC-MK(AR-80)(M50)
% V
ari
ati
on
in
mo
du
lus o
f ru
ptu
re
Thermal cycles
-0.2 0.0 0.2 0.4 0.6 0.8 1.0 1.2 1.4 1.60
10
20
30
40
50
60
70
80
90
100
110
120
130
Fig 86.0 Comparison of first crack load and ultimate fiexural load of
SFRC & SFRC-MK Beams of M20 Grade using fibres of aspect ratio 60 & 80
Lo
ad
(KN
)
Deflection(mm)
SFRC(M20)(60)(0-1.5ibres)(First crack)
SFRC(M20)(60)(0-1.5% Fibers)(ultimate)
SFRC(AR-80)(0-1.5% Fibers)(first crack)
SFRC(AR-80)(0-1.5% Fibers)(ultimate)
SFRC-MK(AR-60)(0-1.5% Fibers)(first crack)
SFRC-MK(AR-60)(0-1.5% Fibers)(ultimate)
SFRC-MK(AR-80)(0-1.5% Fibers)(first crack)
SFRC-MK(AR-80)(0-1.5% Fibers)(ulimate)

261
-0.2 0.0 0.2 0.4 0.6 0.8 1.0 1.2 1.4 1.60
10
20
30
40
50
60
70
80
90
100
110
120
130
140
150
Fig 87.0 Comparison of first crack and ultimate flexural load of SFRC
& SFRC-MK Beams of M50 Grade using fibres of aspect ratio 60 & 80
Lo
ad
(KN
)
Deflection(mm)
SFRC(M50)(AR-60)(First crack)
SFRC(M50)(AR-60)(ultimate)
SFRC(M50)(AR-80)(First crack)
SFRC(M50)(AR-80)(ultimate)
SFRC-MK(M50)(AR-60)(First crack)
SFRC-MK(M50)(AR-60)(ultimate)
SFRC-MK(M50)(AR-80)(First crack)
SFRC-MK(M50)(AR-80)(ultimate)
0
10
20
30
40
50
60
70
80
90
100
110
120
0 5 10 15 20 25 30
Fig 88.0 Load-deflection curves of SFRC & SFRC-MK Beams
of M20 Grade using fibres of aspect ratio 60
OPCC(M20)
SFRC(AR-60)(0.5% Fibers)
SFRC(AR-60)(1.0% Fibers)
SFRC(AR-60)(1.5% Fibers)
MKC(M20)
SFRC-MK(AR-60)(0.5% Fibers)
SFRC-MK(AR-60)(1.0% Fibers)
SFRC-MK(AR-60)(1.5% Fibers)
Deflection(mm)
Lo
ad
(KN
)

262
0
10
20
30
40
50
60
70
80
90
100
110
120
130
0 5 10 15 20 25
Fig 89.0 Load-deflection curves of SFRC & SFRC-MK Beams of
M20 Grade using fibres of aspect ratio 80
OPCC(M20)
SFRC(AR-80)(0.5% Fibers)
SFRC(AR-80)(1.0% Fibers)
SFRC(AR-80)(1.5% Fibers)
MKC(M20)
SFRC-MK(AR-80)(0.5% Fibers)
SFRC-MK(AR-80)(1.0% Fibers)
SFRC-MK(AR-80)(1.5% Fibers)
Deflection(mm)
Lo
ad
(KN
)
0
10
20
30
40
50
60
70
80
90
100
110
120
0 5 10 15 20 25 30
Fig 89A.0 Load-deflection characteristics of SFRC & SFRC-MK Beams
of M20 Grade using fibres of aspect ratio 60 & 80
OPCC(M20)
SFRC(AR-60)(0.5% Fibers)
SFRC(AR-60)(1.0% Fibers)
SFRC(AR-60)(1.5% Fibers)
MKC(M20)
SFRC-MK(AR-60)(0.5% Fibers)
SFRC-MK(AR-60)(1.0% Fibers)
SFRC-MK(AR-60)(1.5% Fibers)
Deflection(mm)
Lo
ad
(KN
)

263
0
20
40
60
80
100
120
140
0 5 10 15 20 25
Fig 90.0 Load-deflection curves of SFRC & SFRC-MK Beams of
M50 Grade using fibres of aspect ratio 60
OPCC(M50)
SFRC(AR-60)(0.5% Fibers)
SFRC(AR-60)(1.0% Fibers)
SFRC(AR-60)(1.5% Fibers)
MKC(M50)
SFRC-MK(AR-60)(0.5% Fibers)
SFRC-MK(AR-60)(1.0% Fibers)
SFRC-MK(AR-60)(1.5% Fibers)
Deflection(mm)
Lo
ad
(KN
)
0
10
20
30
40
50
60
70
80
90
100
110
120
130
140
150
0 2 4 6 8 10 12 14 16 18 20 22
Fig 91.0 Load-deflection curves of SFRC & SFRC-MK Beams
of M50 Grade using fibres of aspect ratio 80
OPCC(M50)
SFRC(AR-80)(0.5% Fibres)
SFRC(AR-80)(1.0% Fibres)
SFRC(AR-80)(1.5% Fibres)
MKC(M50)
SFRC-MK(AR-80)(0.5% Fibres)
SFRC-MK(AR-80)(1.0% Fibres)
SFRC-MK(AR-80)(1.5% Fibres)
Deflection(mm)
Lo
ad
(KN
)

264
0
50
100
150
200
250
300
0 2 4 6 8 10 12
Fig 92.0 Load-deflection curves of SFRC & SFRC-MK slabs of
M20 Grade using fibres of aspect ratio 80
OPCC(M20)
SFRC(AR-80)(0.5% fibres)
SFRC(AR-80)(1.0% fibres)
SFRC(AR-80)(1.5% fibres)
MKC(M20)
SFRC-MK(AR-80)(0.5% fibres)
SFRC-MK(AR-80)(1.0% fibres)
SFRC-MK(AR-80)(1.5% fibres)
Deflection(mm)
Lo
ad
(KN
)
0
50
100
150
200
250
300
350
400
450
0 5 10 15 20 25
Fig 93.0 Load-deflection curves of SFRC & SFRC-MK Slabs
of M50 Grade using fibres of aspect ratio 80
OPCC(M50)
SFRC(AR-80)(0.5% fibres)
SFRC(AR-80)(1.0% fibres)
SFRC(AR-80)(1.5% fibres)
MKC(M50)
SFRC-MK(AR-80)(0.5% fibres)
SFRC-MK(AR-80)(1.0% fibres)
SFRC-MK(AR-80)(1.5% fibres)
Fiber content(%)
Lo
ad
(KN
)