4.0 transportation facilities and travel … section presents an overview of the transportation...
TRANSCRIPT

I-20 EAST TRANSIT INITIATIVE Purpose and Need Report
RFP P5413 / Contract No. 200703566 4-1 October 2011
4.0 TRANSPORTATION FACILITIES AND TRAVEL TRENDS This section presents an overview of the transportation facilities and travel trends within the I-20 East Corridor and how these factors contribute to the purpose and need for premium transit investment in the corridor. To understand the existing transportation system, an inventory of facilities and an assessment of system attributes were conducted. The assessment of system attributes includes identification of the planned and programmed projects in the study area, analysis of travel trend data as well identification of major origins and destinations and respective travel times.
4.1 Transportation System This section presents an overview of the current and future roadway and transit systems within the I-20 East Corridor study area. A thorough inventory and assessment of the transportation network allows for a better understanding of the transportation options and obstacles facing those who live, work and play in the study area.
4.1.1 Existing Roadway Network The following subsection provides an overview of the major roadway network in the I-20 East Corridor study area. Roadways reviewed in the network include I-20, other major east-west facilities, and major north-south facilities. For each of these roadways, the Annual Average Daily Traffic (AADT) and Level of Service (LOS) for current and future year are analyzed.
I-20
I-20 is the major transportation facility in the study area, and connects the Downtown Atlanta on the western end of the study area with the cities of Lithonia and Conyers to the east. This Interstate is the principal east-west roadway in the study area and is used by both automobile and transit commuters, as well as motor freight operators. It is the only facility that provides an east-west connection that runs the entire length of the study area. Table 4-1 below provides further information about I-20. Classifications for this and other roadways can be found in Figure 4-1 on page 4-2 and lane configurations can be found in Figure 4-2 on page 4-3.
Table 4-1: Roadway Characteristics for I-20
Roadway State Route Functional Class Travel Lanes Speed Limit I-20 SR 402/SR 12/US 278 Interstate 6-10* 55
Source: Georgia Department of Transportation (GDOT) Office of Transportation Data 2009 *- Lane Segmentation provided in Figure 4-2 on page 4-3.

I-20 EAST TRANSIT INITIATIVE Purpose and Need Report
RFP P5413 / Contract No. 200703566 4-2 October 2011
Figure 4-1: Functional Classifications Map

I-20 EAST TRANSIT INITIATIVE Purpose and Need Report
RFP P5413 / Contract No. 200703566 4-3 October 2011
Figure 4-2: Lane Configurations Map

I-20 EAST TRANSIT INITIATIVE Purpose and Need Report
RFP P5413 / Contract No. 200703566 4-4 October 2011
Major East-West Facilities
Other than I-20, there are few east-west roadway options for drivers in the study area, and of these, few extend across a significant portion of the study area or offer multiple lanes. Multi-lane roadway options for east-west travel within the study area are limited to Covington Highway in the central portion, and Memorial Drive in the western portion. There are no multi-lane east-west roadways in the eastern end of the study area. Furthermore, Sigman Road, on the eastern end of the study area, is the only east-west facility classified as a Principal Arterial. The remaining east-west facilities are Minor Arterials or local roads. Therefore, the existing transportation network does not provide a viable parallel route to I-20 for traversing the study area. Table 4-2 below provides further information about major study area east-west facilities.
Table 4-2: Roadway Characteristics for Major East-West Facilities
Roadway Segment State Route
Functional Class
Travel Lanes
Speed Limit
Browns Mill Rd Snapfinger Road to Klondike Rd SR 212 Minor Arterial 2 45 mph
Glenwood Rd Moreland Ave to Covington Hwy SR 12/ US 278 Minor Arterial 4 40 mph
Memorial Dr I-85 to I-285 SR 154 Minor Arterial 4 35 mph
Covington Hwy Glenwood Rd to Evans Mill Rd SR 12/ US 278 Minor Arterial 4 40 mph
Old Covington Hwy/Green St Evans Mill Rd to I-20
SR 12/ US 278 Minor Arterial 2 35 mph
DeKalb Ave I-85 to East Lake Dr SR 42/ US 278 Minor Arterial 3 35 mph
College Ave East Lake Dr to Covington Hwy SR 42/ US 278 Minor Arterial 4 35 mph
Flat Shoals Rd Glenwood to Candler Rd SR 155 Minor Arterial 2 45 mph Flat Shoals Pkwy Candler Rd to Browns Mill Rd SR 155 Minor Arterial 4 45 mph Rockbridge Rd Memorial Dr to Deshon Rd - Minor Arterial 2 35 mph Rockbridge Rd Deshon Rd to Rock Chapel Rd - Minor Arterial 4 45 mph
Redan Rd Covington Hwy to Stone Mountain Lithonia Rd - Minor Arterial 2 45 mph
Hurst Rd/ Klondike Rd I-20 to Flat Bridge Rd - Minor Arterial 2 40 mph
Sigman Rd NW I-20 to I-20 SR 20 Principal Arterial 2 45 mph
Pleasant Hill Rd Rockbridge Rd to Humphries Rd - Minor Arterial 2 40 mph Source: GDOT Office of Transportation Data 2009
Major North-South Facilities
The transportation network offers many connections to and from I-20 and options for north-south travel. I-285 is a major facility that accommodates north-south travel in the central portion of the study area. In addition, Candler Road, Columbia Drive, Hairston Road, Wesley Chapel Road, Panola Road, and Rock Chapel Road are multi-lane, north-south roadways. In the eastern portion of the study area, McDonough Highway is a multi-lane north-south roadway. Of these arterials, only Hairston Road and Rock Chapel Road are classified as Principal Arterials. Table 4-3 on page 4-5 provides further information about major north-south facilities in the study area.

I-20 EAST TRANSIT INITIATIVE Purpose and Need Report
RFP P5413 / Contract No. 200703566 4-5 October 2011
Table 4-3: Roadway Characteristics for Major North-South Facilities
Roadway Segment State Route Functional Class Travel Lanes
Speed Limit
I-285 Moreland Ave to Rockbridge Rd - Interstate 8
55 mph
Bouldercrest Dr Flat Shoals Rd to Constitution Road - Minor Arterial 2
35 mph
Bouldercrest Dr Constitution Road to I-285 - Minor Arterial 4
45 mph
Bouldercrest Dr I-285 to Forest Pkwy/Panola Rd - Minor Arterial 2
35 mph
Candler Rd College Ave to Flat Shoals Rd SR 155 Minor Arterial 4
45 mph
Hairston Rd
Stone Mountain Pkwy to Wesley Chapel Rd - Principal Arterial 4
40 mph
McDonough Hwy Honey Creek Rd to Lakefield Dr SR 138 Principal Arterial 4
45 mph
McDonough Hwy Lakefield Dr to I-20 SR 138 Principal Arterial 6 45 mph
Walnut Grove Rd I-20 to Board Tusk Rd SR 138 Principal Arterial 4
Moreland Ave Ponce de Leon Ave to Conley Road - Minor Arterial 4
45 mph
Panola Rd
Stone Mountain Lithonia Rd to Winslow Crossing - Minor Arterial 4
40 mph
Panola Rd Winslow Crossing to Snapfinger Rd - Minor Arterial 2
40 mph
Panthersville Rd Bouldercrest Rd to Flat Shoals Pkwy - Minor Arterial 2
45 mph
Rock Chapel Rd/ Turner Hill Rd
Rockbridge Rd to Mall Pkwy SR 124 Minor Arterial 4
45 mph
Turner Hill Rd Mall Pkwy to Rockland Rd SR 124 Minor Arterial 2
45 mph
Snapfinger Rd Panola Rd to Old Lantern Dr SR 155 Principal Arterial 4
45 mph
Snapfinger Rd Old Lantern Dr to Browns Mill Rd SR 155 Principal Arterial 2
45 mph
Snapfinger Rd Browns Mill Rd to Flat Shoals Pkwy SR 155 Principal Arterial 4
45 mph
Snapfinger Rd Flat Shoals Pkwy to I-20 SR 155 Principal Arterial 2
45 mph
Snapfinger Rd I-20 to Columbia Dr SR 155 Principal Arterial 2 45 mph
Wesley Chapel Rd
Covington Hwy to Kelley Chapel Rd/ Boring Rd - Minor Arterial 4
45 mph
Wesley Chapel Rd
Kelley Chapel Rd/Boring Rd to Flat Shoals Pkwy - Minor Arterial 2
45 mph
Pleasant Hill Rd Rockbridge Rd to Loganville Hwy - Minor Arterial 2
45 mph
Flakes Mill Rd Amsler Rd to Wesley Chapel Rd - Minor Arterial 2
35 mph
Source: GDOT Office of Transportation Data 2009
4.1.2 Roadway AADT and LOS AADT is the measure of average daily traffic volume on a roadway segment over the course of a year. LOS is a qualitative measure of traffic flow that describes operating
I-20 EAST TRANSIT INITIATIVE Purpose and Need Report
RFP P5413 / Contract No. 200703566 4-6 October 2011
conditions with six levels of service defined by Federal Highway Administration (FHWA) in the Highway Capacity Manual (HCM). LOS is described by letter designations from A to F, with LOS A representing the best operating conditions and F the worst. A facility may operate at a range of LOS depending upon time of day, day of week or period of the year. As such, the LOS is generally regarded as a standard measure for congestion.
I-20
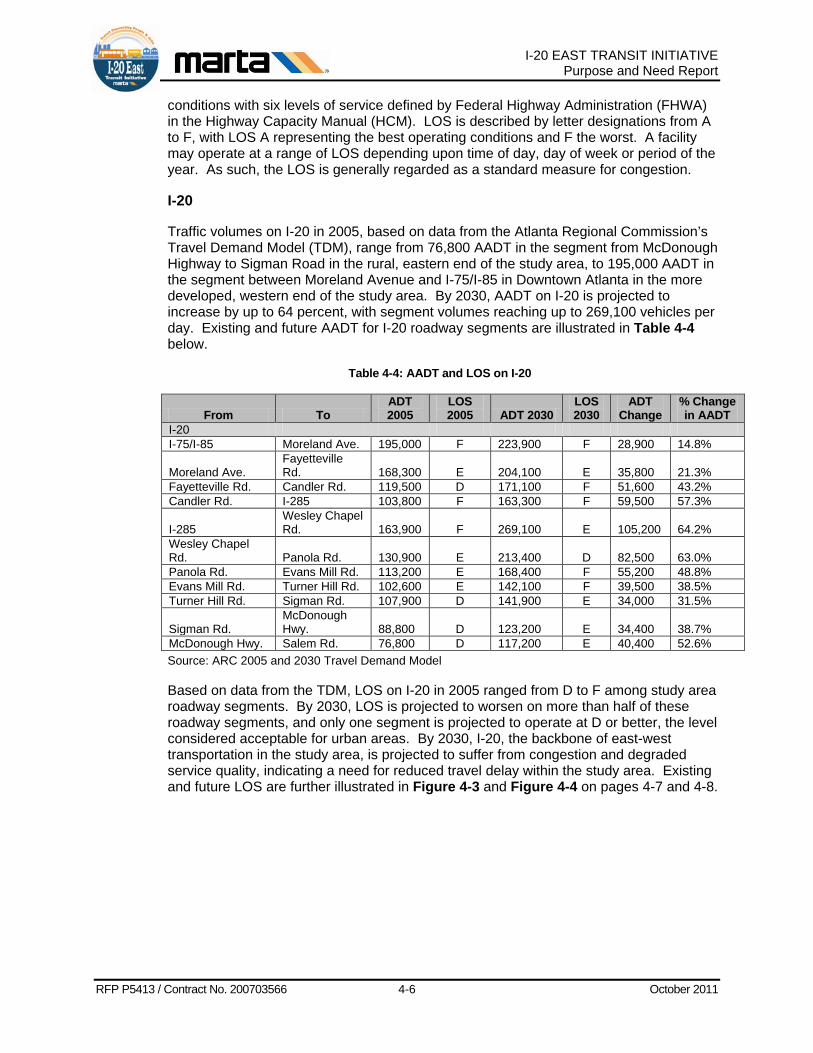
Traffic volumes on I-20 in 2005, based on data from the Atlanta Regional Commission’s Travel Demand Model (TDM), range from 76,800 AADT in the segment from McDonough Highway to Sigman Road in the rural, eastern end of the study area, to 195,000 AADT in the segment between Moreland Avenue and I-75/I-85 in Downtown Atlanta in the more developed, western end of the study area. By 2030, AADT on I-20 is projected to increase by up to 64 percent, with segment volumes reaching up to 269,100 vehicles per day. Existing and future AADT for I-20 roadway segments are illustrated in Table 4-4 below.
Table 4-4: AADT and LOS on I-20
From To ADT 2005
LOS 2005 ADT 2030
LOS 2030
ADT Change
% Change in AADT
I-20 I-75/I-85 Moreland Ave. 195,000 F 223,900 F 28,900 14.8%
Moreland Ave. Fayetteville Rd. 168,300 E 204,100 E 35,800 21.3%
Fayetteville Rd. Candler Rd. 119,500 D 171,100 F 51,600 43.2% Candler Rd. I-285 103,800 F 163,300 F 59,500 57.3%
I-285 Wesley Chapel Rd. 163,900 F 269,100 E 105,200 64.2%
Wesley Chapel Rd. Panola Rd. 130,900 E 213,400 D 82,500 63.0% Panola Rd. Evans Mill Rd. 113,200 E 168,400 F 55,200 48.8% Evans Mill Rd. Turner Hill Rd. 102,600 E 142,100 F 39,500 38.5% Turner Hill Rd. Sigman Rd. 107,900 D 141,900 E 34,000 31.5%
Sigman Rd. McDonough Hwy. 88,800 D 123,200 E 34,400 38.7%
McDonough Hwy. Salem Rd. 76,800 D 117,200 E 40,400 52.6% Source: ARC 2005 and 2030 Travel Demand Model
Based on data from the TDM, LOS on I-20 in 2005 ranged from D to F among study area roadway segments. By 2030, LOS is projected to worsen on more than half of these roadway segments, and only one segment is projected to operate at D or better, the level considered acceptable for urban areas. By 2030, I-20, the backbone of east-west transportation in the study area, is projected to suffer from congestion and degraded service quality, indicating a need for reduced travel delay within the study area. Existing and future LOS are further illustrated in Figure 4-3 and Figure 4-4 on pages 4-7 and 4-8.

I-20 EAST TRANSIT INITIATIVE Purpose and Need Report
RFP P5413 / Contract No. 200703566 4-7 October 2011
Figure 4-3: Level of Service in the Study Area, 2005

I-20 EAST TRANSIT INITIATIVE Purpose and Need Report
RFP P5413 / Contract No. 200703566 4-8 October 2011
Figure 4-4: Level of Service in the Study Area, 2030
I-20 EAST TRANSIT INITIATIVE Purpose and Need Report
RFP P5413 / Contract No. 200703566 4-9 October 2011
Major East-West Roadways
Overall, the AADT on east-west facilities in the corridor is projected to increase. Traffic growth is projected to be particularly strong on roadway segments in the eastern end of the study area. For example, AADT on Browns Mill Road is projected to increase by 68 to 86 percent by 2030 and on Pleasant Hill Road by 59 and 85 percent. These increases are indicative of substantial growth in the eastern portion of the study area, which is producing more vehicular trips on a limited number of facilities, and in turn, a need to increase the mobility options for east-west trips in the corridor.
Based on data from the TDM, 2005 LOS on all segments of east-west roadways in the study area was at C or below, with LOS F on Redan Road between Hairston Road and Panola Road. Covington Highway in the vicinity of Hairston Road and Memorial Drive in the vicinity of Candler Road were also operating at LOS F, as were some smaller east-west roadway segments in the study area. However, by 2030, travel conditions in the corridor are projected to worsen significantly, and the majority of east-west roadway segments evaluated in the study area are projected to operate at LOS D or below. Travel on east-west facilities during peak hours is accompanied by an increasing level of delay. Existing and future AADT and LOS for major east-west roadway segments in the study area are listed in Table 4-5 on page 4-10.
Major North-South Roadways
Based on data from the TDM, AADT on north-south roadways in the corridor is projected to increase, with stronger traffic growth projected for roadway segments on the eastern end of the study area. AADT on I-285 is projected to increase from 20 to 43 percent over 2005 volumes, to volumes of 216,300 vehicles per day. Further east, Panola Road AADT is projected to increase by 39 to 89 percent to volumes up to 46,800 vehicles a day and Rock Chapel Road AADT is projected to increase by 34 to 118 percent to volumes up to 49,200 vehicles per day.
2005 LOS on all segments of north-south roadways in the study area was at C or below. Some north-south roadway segments, such as Panola Road just south of I-20 and Wesley Chapel Road at Rainbow Drive, were operating at LOS F. By 2030, LOS on major study area roadways is projected to decline, especially for north-south roadway segments on the western side of the study area, which already carry heavy loads of traffic. Existing and future AADT and LOS for major north-south roadway facilities in the study are illustrated in Table 4-6 on page 4-11.

I-20 EAST TRANSIT INITIATIVE Purpose and Need Report
RFP P5413 / Contract No. 200703566 4-10 October 2011
Table 4-5: AADT & LOS on Major East-West Facilities
From To AADT 2005
LOS 2005
AADT 2030
LOS 2030
% Change
in AADT
Browns Mill Rd./Scott Hwy. Evans Mill Rd. Klondike Rd. 11,000 C 18,500 E 68.2% Klondike Rd. Smyrna Rd. SW 10,800 C 20,100 D 86.1% Covington Hwy. Memorial Dr. I-285 27,500 D 46,800 F 70.2% I-285 Glenwood Rd. 44,400 D 43,200 E -2.7% Glenwood Rd. Hairston Rd. 35,600 D 35,700 D 0.3% Hairston Rd. Panola Rd. 50,200 E 55,000 E 9.6% Panola Rd. Lithonia Industrial Blvd. 36,500 C 46,300 D 26.8% Lithonia Industrial Blvd. Main St. 30,400 D 35,500 D 16.8% DeKalb Ave/College Ave. Moreland Ave. Lake Rd. 12,800 E 12,100 E -5.5% Lake Rd. Candler Rd. 12,000 D 16,500 F 37.5% Candler Rd. Arcadia Rd. 26,700 E 35,700 F 33.7% Flat Shoals Pkwy. Glenwood Rd. Bouldercrest Rd. 2,700 D 5,100 E 88.9% I-285 Clifton Church Rd. 8,700 C 10,900 C 25.3% Glenwood Rd. Moreland Ave. I-20 3,200 C 6,000 E 87.5% I-20 Candler Rd. 21,800 D 29,200 E 33.9% Candler Rd. I-285 11,400 C 13,900 C 21.9% Memorial Dr. Moreland Ave. Candler Rd. 35,100 D 26,200 E -25.4% Candler Rd. College Ave. 37,200 C 37,300 D 0.3% Pleasant Hill Rd. Rock Chapel Rd. Union Grove Rd. 9,800 C 15,600 C 59.2% Union Grove Rd. Centerville Hwy./Norris Lake Rd. 9,600 C 17,800 F 85.4% Redan Rd. I-285 Indian Creek Rd. 13,100 E 14,700 E 12.2% Indian Creek Rd. Hairston Rd. 14,600 E 17,100 E 17.1% Hairston Rd. Panola Rd. 13,100 F 16,800 F 28.2% Panola Rd. Wellborn Rd. 9,200 D 13,600 E 47.8% Wellborn Rd. Marbut Rd. 3,500 C 5,700 C 62.9% Rockbridge Rd. Memorial Dr. Hairston Rd. 9,300 D 13,300 E 43.0% Hairston Rd. S. Stone Mountain Lithonia Rd. 10,900 E 14,800 F 35.8% S. Stone Mountain Lithonia Rd. Deshon Rd. 12,600 D 14,600 E 15.9% Deshon Rd. Rock Chapel Rd. 5,000 C 7,800 C 56.0% Union Grove Rd. Lake Capri Rd. 3,600 C 6,700 C 86.1% Lake Capri Rd. Sigman Rd. 2,600 C 6,900 C 165.4% Sigman Rd. Old Covington Hwy. 4,700 C 7,600 C 61.7% Sigman Rd. Covington Hwy. Rockbridge Rd. 13,600 C 15,700 C 15.4% Rockbridge Rd. Irwin Bridge Rd. 14,800 D 15,100 D 2.0% Irwin Bridge Rd. Loganville Hwy. 9,100 C 12,700 C 39.6% Loganville Hwy. McDonough Hwy. 16,400 D 24,000 E 46.3% McDonough Hwy. I-20 13,700 C 19,400 D 41.6%
Source: ARC Travel Demand Model

I-20 EAST TRANSIT INITIATIVE Purpose and Need Report
RFP P5413 / Contract No. 200703566 4-11 October 2011
Table 4-6: AADT and LOS on Major North-South Facilities
From To AADT 2005
LOS 2005
AADT 2030
LOS 2030
Percent Change in
AADT I-285 Rockbridge Rd. I-20 167,800 F 208,200 F 24.1% I-20 Flat Shoals Pkwy. 149,300 E 212,700 E 42.5% Flat Shoals Pkwy. I-675 180,500 E 216,300 F 19.8% I-675 Moreland Ave. 139,000 D 189,100 E 36.0% Bouldercrest Rd. Flat Shoals Rd. Constitution Rd. 6,100 D 12,700 F 108.2% Candler Rd. College Ave. I-20 34,800 D 41,600 E 19.5% Hairston Rd. Rockbridge Rd. Redan Rd. 29,500 D 42,000 C 42.4% Redan Rd. Wesley Chapel Rd. 31,400 C 43,000 D 36.9% Hurst Rd./Klondike Rd. I-20 Browns Mill Rd. 9,500 D 13,100 E 37.9% Browns Mill Rd. Flat Bridge Rd 11,200 D 14,700 E 31.3% McDonough Hwy. Flat Shoals Rd. I-20 46,200 E 61,500 F 33.1% I-20 Eastview Rd. 27,100 C 45,600 D 68.3% Moreland Ave. DeKalb Rd. Memorial Dr. 56,900 E 57,300 E 0.7% Memorial Dr. Constitution Rd. 44,700 D 57,700 E 29.1% Constitution Rd. I-285 50,100 E 65,700 F 31.1% Panola Rd. Rockbridge Rd. Redan Rd. 17,300 C 25,700 C 48.6% Redan Rd. Covington Hwy. 22,100 C 34,000 D 53.8% Covington Hwy. I-20 28,300 C 39,400 C 39.2% I-20 Browns Mill Rd. 24,800 F 46,800 F 88.7% Panthersville Rd./Candler Rd. I-20 I-285 42,400 F 50,200 F 18.4% I-285 River Rd. 7,500 D 15,500 E 106.7% River Rd. Bouldercrest Rd. 5,300 C 13,400 E 152.8% Rock Chapel Rd./Turner Hill Rd. Rockbridge Rd. Old Covington Hwy. 36,600 C 49,200 E 34.4% Old Covington Hwy. Rockland Rd. 11,300 D 24,600 E 117.7% Snapfinger Rd. Wesley Chapel Rd. Browns Mill Rd. 23,600 E 35,500 E 50.4% Browns Mill Rd. Panola Rd. 13,800 C 23,100 C 67.4% Panola Rd. River Rd. 24,800 D 45,900 F 85.1% Wesley Chapel Rd./Flakes Mill Rd. Rainbow Rd. Flat Shoals Pkwy. 17,900 C 29,300 D 63.7% Flat Shoals Pkwy. River Rd. 14,400 D 25,600 E 77.8%
Source: ARC Travel Demand Model
4.1.3 Planned and Programmed Roadway Network The ARC RTP includes a number of planned and programmed roadway improvements within the I-20 East Corridor. Three of the planned and programmed projects in the study area are on the I-20 roadway:
• Projects DK–AR-241 and DK-AR-242, consist of improvements to existing I-20 interchanges, and
• Project AR-ML-500, for managed lanes to I-20 East between I-85/I-75 and I-285.

I-20 EAST TRANSIT INITIATIVE Purpose and Need Report
RFP P5413 / Contract No. 200703566 4-12 October 2011
Planned and programmed roadway projects in the study area are presented in Figure 4-5 on page 4-13 and in Table 4-7 on page 4-14.
As shown in Figure 4-5, few of the planned and programmed projects on other study area roadways would substantially address east-west mobility within the study area since most of these projects target north-south roadways. The widening of Sigman Road in Conyers (RO-235C, RO-235D) and the widening of Covington Highway near Lithonia are the only two projects that would occur on major east-west roadways for a significant length.

I-20 EAST TRANSIT INITIATIVE Purpose and Need Report
RFP P5413 / Contract No. 200703566 4-13 October 2011
Figure 4-5: Planned and Programmed Roadway Improvements Map

I-20 EAST TRANSIT INITIATIVE Purpose and Need Report
RFP P5413 / Contract No. 200703566 4-14 October 2011
Table 4-7: Planned and Programmed Roadway Improvements ARC ID Name Project Type Description Status
AR-ML-500
I-20 East Managed Lanes
Roadway/Managed Lanes
Managed lanes on I-20 from I-75/I-85 to I-285 Programmed
DK-065B Panola Rd.: Segment 2 Roadway Capacity Widen road from 2 to 4 lanes Programmed DK-065C Panola Rd.: Segment 3 Roadway Capacity Widen road from 4 to 6 lanes Programmed DK-065E Panola Rd.: Segment 5 Roadway Capacity Widen road from 4 to 6 lanes Programmed
DK-327A Hayden Quarry Rd. / Sigman Rd. Extension
Roadway Capacity New 4-lane roadway alignment Programmed
DK-328 Lithonia Ind. Blvd. Extension: Phase III
Roadway Capacity New 4-lane roadway alignment Programmed
DK-330 Turner Hill Rd. Roadway Capacity Widen road from 2 to 4 lanes Programmed
DK-342A Rockbridge Rd. Roadway Operations
Widen road from 2 to 4 lanes Programmed
DK-AR-206 I-285 South
Interchange Capacity
Additional turn lanes, added capacity on the bridge & improved signalization Programmed
DK-AR-241 I-285 East
Interchange Capacity
Comprehensive interchange reconstruction Programmed
DK-AR-242 I-20 East
Interchange Capacity
Add left turn lane from NB Panola Road to WB I-20. Programmed
RO-015E Parker Rd.: Phase III Roadway Capacity Widen Road from 2 to 4 lanes Programmed RO-034 Old Covington Hwy. Roadway Capacity Widen Road from 2 to 4 lanes Programmed
RO-138B SR 138 (Stockbridge Hwy.)
Roadway Operations
Operational improvements to SR 138 Programmed
RO-235C Sigman Rd. Roadway Capacity Widen Road from 2 to 4 lanes
Programmed RO-235E2 Sigman Rd.
Roadway Operations
Add left and right turn lanes at all intersection approaches. Programmed
RO-237 Klondike Rd. Roadway Operations Realign intersection approaches Programmed
RO-238 Old Covington Rd. Roadway Operations
Add left and right turn lanes and realign intersection. Programmed
DK-030A Covington Hwy./US 278 Roadway Capacity Widen road from 2 to 4 lanes with center turn lane Programmed
DK-030B Covington Hwy./US 278 Roadway Capacity Widen road from 2 to 4 lanes
with center turn lane Long Range DK-065A Panola Rd.: Segment 1 Roadway Capacity Widen road from 2 to 4 lanes Long Range DK-162 Bouldercrest Rd. Roadway Capacity Widen road from 2 to 4 lanes Long Range DK-340 Wesley Chapel Rd. Roadway Capacity Widen road from 2 to 4 lanes Long Range
DK-341A Flakes Mill Rd. Roadway Capacity Widen road from 2 to 4 lanes
Long Range DK-AR-207 I-285 South Interchange
Upgrade Additional turn lanes on bridge and improved signalization Long Range
RO-217A Old Salem Rd.: Segment I Roadway Capacity Widen Road from 2 to 4 lanes Long Range
RO-222B East Freeway Dr. Extension: Phase II Roadway Capacity New 4-lane roadway linking
Long Range
RO-235A Sigman Rd. Extension / Hayden Quarry Rd.
Roadway Capacity New four-lane parkway Long Range
RO-235E1 Sigman Rd. Roadway Capacity Widen Road from 2 to 4 lanes Long Range
RO-235D SR 20/Sigman Rd. Roadway Capacity Widen Road from 2 to 4 lanes
Long Range
RO-243 Salem Gate Extension and I-20 Overpass Roadway Capacity New 4-lane connection Long Range
RO-AR-138 SR 138/20 at I-20 Roadway/Interchan
ge Capacity Bridge widening and ramp improvements Long Range
Source: Plan 2040 RTP/TIP

I-20 EAST TRANSIT INITIATIVE Purpose and Need Report
RFP P5413 / Contract No. 200703566 4-15 October 2011
Of note is the absence of any widening or addition of HOV/managed lanes along I-20. The lack of planned and programmed projects to increase east-west capacity or mobility further highlights the need for additional east-west mobility options in the study area.
4.1.4 Existing Transit Services The following section summarizes the existing transit service within the I-20 East Corridor. This analysis is based on an inventory of current services provided by MARTA and GRTA and is organized by rail, bus, and express bus services. MARTA services are presented as they existed in September of 2010. Because MARTA undertook a major restructuring of services in October 2010, examining the network as it existed in September of 2010 allows for a more accurate picture of growth in transit travel demand in the corridor.
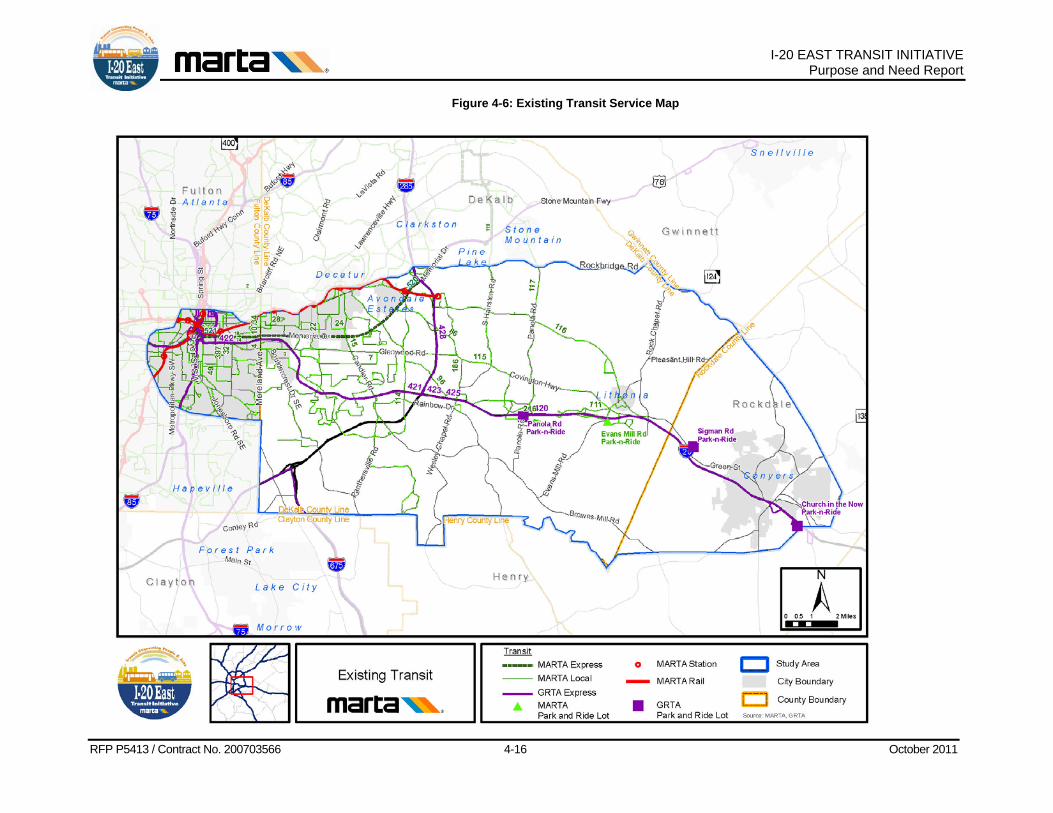
As shown on Figure 4-6 on page 4-16, the western portion of the study area is currently served by both MARTA heavy-rail and bus services. The heavy-rail lines and stations are located in the western end of the study area and along its northwestern perimeter. The easternmost rail station is found at Indian Creek, alongside I-285, at a point approximately one-third of the distance from the study area’s western boundary. In contrast, MARTA bus service extends as far east as Lithonia. Bus service to the east of Lithonia consists solely of GRTA Xpress commuter bus service.
I-20 EAST TRANSIT INITIATIVE Purpose and Need Report
RFP P5413 / Contract No. 200703566 4-16 October 2011
Figure 4-6: Existing Transit Service Map

I-20 EAST TRANSIT INITIATIVE Purpose and Need Report
RFP P5413 / Contract No. 200703566 4-17 October 2011
MARTA Rail
MARTA offers north-south rail service on its red and yellow lines, and east-west service on its blue and green lines. The red line extends north to North Springs Station, which is on GA-400 north of I-285 in Sandy Springs, and the gold line extends northeast to Doraville Station just south of I-285; both red and gold lines extend south to the Hartsfield-Jackson Atlanta International Airport (HJAIA), which is owned by the City of Atlanta and located in Clayton County north of I-285. The green line extends west to Bankhead Station at Donald Lee Hollowell Parkway NW in west Atlanta, and east to Edgewood/Candler Park Station on DeKalb Avenue NE in eastern Atlanta. The blue line extends west to Hamilton E. Homes Station east of I-285 in west Atlanta; and east to Indian Creek station east of I-285 in Stone Mountain. A map of existing MARTA heavy rail service in the Atlanta metropolitan area can be found in Figure 4-7 on page 4-18.
MARTA Bus
The I-20 East Corridor is currently served by 21 MARTA bus routes. MARTA bus service primarily connects activity centers to the MARTA rail line, with some local service also offered. In the fall of 2010, MARTA introduced peak-hour limited routes 520 and 521 along Memorial Drive from Kensington Station to points east, Memorial Drive Park-and-Ride and East Ponce de Leon at Mountain Industrial Boulevard. Extension of this service westward into downtown Atlanta is included in the planned and programmed transit projects in the RTP. MARTA bus routes that serve the study area and their service types are listed in Table 4-9 below.
As can be seen from Figure 4-6, MARTA service is strongest within the I-285 perimeter. East of I-285, MARTA bus service primarily provides feeder service from the Lithonia area and other locations north of I-20 to rail stations along the MARTA east line. The area south of I-20 and east of I-285 has little to no MARTA bus service to connect potential riders with local destinations or the MARTA rail network.
Table 4-9: MARTA Bus Routes that Serve the Study Area Route Name Termini Type 2 Ponce de Leon Ave/Moreland Ave North Avenue Station and Edgewood/Candler Park Station Rail Feeder 4 McDonough Blvd/Moreland Ave Inman Park Station and Five Points Station Rail Feeder 9 Toney Valley Toney Dr and Five Points Station Rail Feeder 15 Candler Rd/South DeKalb Clevemont Rd to Decatur Station Rail Feeder 21 Memorial Drive Kensington Station to Five Points Rail Feeder 24 East Lake/Hosea Williams East Lake Station and Edgewood/Candler Park Station 32 Eastland/Bouldercrest Bouldercrest to King Memorial Rail Feeder 34 Gresham Rd Gresham to Inman Park Station Rail Feeder 49 McDonough Blvd Moreland Drive at Woodland Ave to Alabama and Forsyth 74 Flat Shoals/South DeKalb Flat Shoals and Five Points Station Local/Express 86 Fairington Rd/Lithonia Lithonia to Indian Creek Station Rail Feeder 107 Glenwood Rd Indian Creek Station to Inman Park Station Rail Feeder 111 Hillandale Dr/Stonecrest Stonecrest Mall to Indian Creek Station Rail Feeder 114 Columbia Dr Clifton Springs Rd to Avondale Station Rail Feeder 115 Covington Hwy Lithonia to Kensington Station Rail Feeder 116 Redan Rd/Stonecrest Stonecrest Mall to Indian Creek Station Rail Feeder 117 Rockbridge Rd/Panola Rd GRTA Park and Ride to Kensington Station Rail Feeder 119 Kensington Road/Hairston Road Memorial drive PNR to Indian Creek Station 186 Rainbow Dr./Wesley Chapel Rd Indian Creek Station to Spring St. & Poplar Local/Express 520 Q Memorial Drive Limited Ponce de Leon Ave at N Hairston Rd to Kensington Station Express 521 Q Memorial Drive Express Memorial Drive Park-and-Ride to Kensington Station Express
Source: MARTA

I-20 EAST TRANSIT INITIATIVE Purpose and Need Report
RFP P5413 / Contract No. 200703566 4-18 October 2011
Figure 4-7: MARTA Heavy Rail Service
Source: MARTA

I-20 EAST TRANSIT INITIATIVE Purpose and Need Report
RFP P5413 / Contract No. 200703566 4-19 October 2011
GRTA Xpress Bus Service
GRTA began operating its Xpress-branded express bus service within the I-20 East Corridor in 2006. GRTA Xpress operates service from the Panola Road, Sigman Road and East Conyers Park & Ride lots in the corridor to the Downtown, Midtown and Perimeter Center employment centers. These commuter-driven, express routes offer one-way service during AM and PM peak hours. GRTA routes do not offer reverse-commute options, local service, or weekend operations. Xpress bus riders can transfer to MARTA rail and bus services for free using the Breeze Smartcard. GRTA bus routes that serve the study area are shown in Table 4-10 below.
Table 4-10: GRTA Bus Routes in the Study Area Route Name Termini
420 W. Conyers to Downtown Sigman P&R to Five Points & Civic Center 421 W. Conyers to Midtown Sigman P&R to Civic Center & Arts Center 422 Panola Rd to Downtown Panola P&R to Five Points & Civic Center 423 E. Conyers/Panola to Midtown Panola P&R to Civic Center & Arts Center 425 E. Conyers to Downtown Church in the Now to Five Points & Civic Center 428 Panola Rd to Perimeter Panola P&R to Dunwoody & Medical Center
Source: GRTA
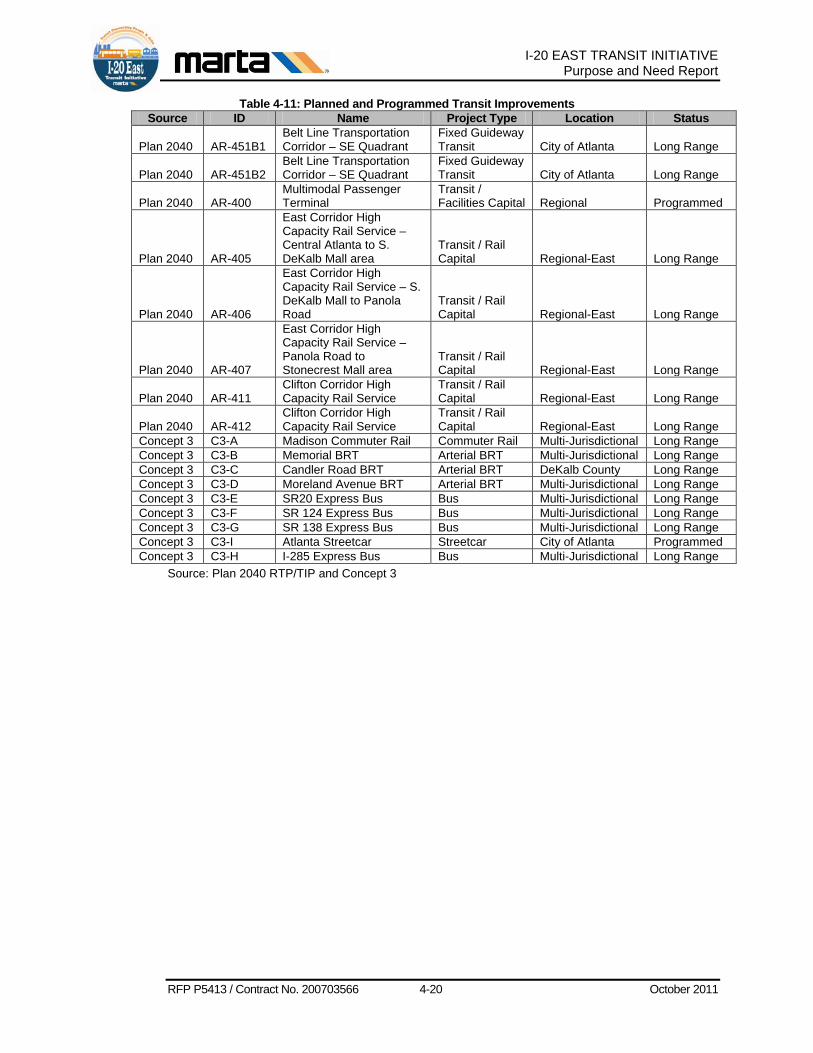
4.1.5 Planned and Programmed Transit Services There are several additions to the transit network that are planned and programmed within the study area. These transit projects find their source in the Plan 2040 RTP and TIP (2011) and the Concept 3 Regional Transit Vision Plan (2008). The Plan 2040 projects are programmed and long range, while the projects included in Concept 3 represent a vision for the Atlanta metropolitan area’s potential transit future. Planned and programmed transit improvements are listed in Table 4-11 on page 4-20 and mapped in Figure 4-8 on page 4-21. Among these projects is the I-20 East Corridor High Capacity Rail Service.
Of the transit improvements planned and programmed for the study area, the Atlanta BeltLine project is of special importance to this study, due to the possibility of a direct connection with the I-20 East transit alignment. The Atlanta BeltLine project would provide a network of public parks, multi-use trails and transit along a 22-mile railroad corridor circling downtown. Due to its presence in the western end of the I-20 East Corridor study area, the Atlanta BeltLine has the potential to be a transfer point where the two alignments are in close proximity or intersect.
The ongoing Clifton Corridor Transit Imitative has proposed a connection from the Emory university area to the existing MARTA Avondale station. In the case that the In-20 East Transit Initiative elects an LPA which extends the existing MARTA east-west line, riders would then be able to transfer to that proposed transit line at Avondale station.
I-20 EAST TRANSIT INITIATIVE Purpose and Need Report
RFP P5413 / Contract No. 200703566 4-20 October 2011
Table 4-11: Planned and Programmed Transit Improvements Source ID Name Project Type Location Status
Plan 2040 AR-451B1 Belt Line Transportation Corridor – SE Quadrant
Fixed Guideway Transit City of Atlanta Long Range
Plan 2040 AR-451B2 Belt Line Transportation Corridor – SE Quadrant
Fixed Guideway Transit City of Atlanta Long Range
Plan 2040 AR-400 Multimodal Passenger Terminal
Transit / Facilities Capital Regional Programmed
Plan 2040 AR-405
East Corridor High Capacity Rail Service –Central Atlanta to S. DeKalb Mall area
Transit / Rail Capital Regional-East Long Range
Plan 2040 AR-406
East Corridor High Capacity Rail Service – S. DeKalb Mall to Panola Road
Transit / Rail Capital Regional-East Long Range
Plan 2040 AR-407
East Corridor High Capacity Rail Service – Panola Road to Stonecrest Mall area
Transit / Rail Capital Regional-East Long Range
Plan 2040 AR-411 Clifton Corridor High Capacity Rail Service
Transit / Rail Capital Regional-East Long Range
Plan 2040 AR-412 Clifton Corridor High Capacity Rail Service
Transit / Rail Capital Regional-East Long Range
Concept 3 C3-A Madison Commuter Rail Commuter Rail Multi-Jurisdictional Long Range Concept 3 C3-B Memorial BRT Arterial BRT Multi-Jurisdictional Long Range Concept 3 C3-C Candler Road BRT Arterial BRT DeKalb County Long Range Concept 3 C3-D Moreland Avenue BRT Arterial BRT Multi-Jurisdictional Long Range Concept 3 C3-E SR20 Express Bus Bus Multi-Jurisdictional Long Range Concept 3 C3-F SR 124 Express Bus Bus Multi-Jurisdictional Long Range Concept 3 C3-G SR 138 Express Bus Bus Multi-Jurisdictional Long Range Concept 3 C3-I Atlanta Streetcar Streetcar City of Atlanta Programmed Concept 3 C3-H I-285 Express Bus Bus Multi-Jurisdictional Long Range
Source: Plan 2040 RTP/TIP and Concept 3

I-20 EAST TRANSIT INITIATIVE Purpose and Need Report
RFP P5413 / Contract No. 200703566 4-21 October 2011
Figure 4-8: Planned and Programmed Transit Services

I-20 EAST TRANSIT INITIATIVE Purpose and Need Report
RFP P5413 / Contract No. 200703566 4-22 October 2011
4.2 Travel Trends The purpose of this section is to examine the current travel trends and travel patterns along with transit service patronage levels to provide insight into the future mobility needs within the I-20 East Corridor. The subsections that follow describe the range of data used, the methodology and analysis results.
4.2.1 Analysis Methodology An analysis of the travel patterns, demands, and mobility constraints within the study area will allow this study to better identify the location and type of transit investments that would most effectively address the transportation needs within the corridor. The source of information for this analysis was the ARC regional TDM in conjunction with current and historical trip demand, mode share, and transit ridership data. Projections from the TDM utilize a horizon year of 2030, because when this analysis began, data to support a horizon year of 2040 were not yet available. Table 4-12 below summarizes the data and resources used in this report.
Table 4-12: Data Summary
Data Time Period Source Trip Tables, Travel Times, Mode Share 2005, 2035 ARC TDM GRTA Xpress Routes Monthly Ridership and Average Daily Boardings 2006 -2009 GRTA ARC On-Board Survey, Weekday trips between stations Oct. 2009 ARC Daily Rail Station Entries 2007- 2009 MARTA
his analysis involves a large study area. As such, the traffic analysis zones (TAZs) used to determine the major origins and destinations were aggregated into larger travel districts (see Figure 4-9 on page 4-24). The ARC’s travel districts were used as the basis and tailored to better represent the trip-makings between the I-20 East Corridor and other travel districts in the region. Within the study area, 10 districts were created to better capture the travel markets in the corridor. These districts include:
• I-20 CBD: Includes the entirety of the downtown Central Business District (CBD) area as defined by ARC.
• I-20 Fulton: Is comprised of the remaining portion of Fulton County within the study area.
• I-20 S DeKalb Mall: Refers to the TAZs that make up the South DeKalb Mall area as defined by ARC.
• I-20 DeKalb Inside the Perimeter (ITP): Refers to the remaining portion of DeKalb County area inside the I-285 Perimeter.
• I-20 S DeKalb/W Panola: Includes the area within the study area south of I-20, generally west of I-285 and bound by Panola Road to the west.
• I-20 N DeKalb/W Panola: Includes the area within the study area north of I-20, generally west of I-285 and bound by Panola Road to the west.
• I-20 N DeKalb/E Panola: Includes the remaining portion of DeKalb County within the study area north of I-20 and east of Panola Road.
• I-20 Stonecrest: Refers to the TAZs that make up the Mall at Stonecrest area as defined by ARC.
• I-20 S DeKalb/E Panola: Includes the remaining portion of DeKalb County within the study area south of I-20 and east of Panola Road.
I-20 EAST TRANSIT INITIATIVE Purpose and Need Report
RFP P5413 / Contract No. 200703566 4-23 October 2011
• I-20 Rockdale: Refers to the TAZs within the study area that are located in Rockdale County and the City of Conyers.
4.2.2 Major Origins and Destinations The I-20 East Corridor is characterized by inadequate access to Downtown Atlanta and other major employment centers because the transportation system that serves the corridor has been unable to keep pace with the increasing travel demand from growth and development. This affects travelers that use the corridor to reach their origins or destinations, particularly those traveling to and from Downtown Atlanta and other activity centers.
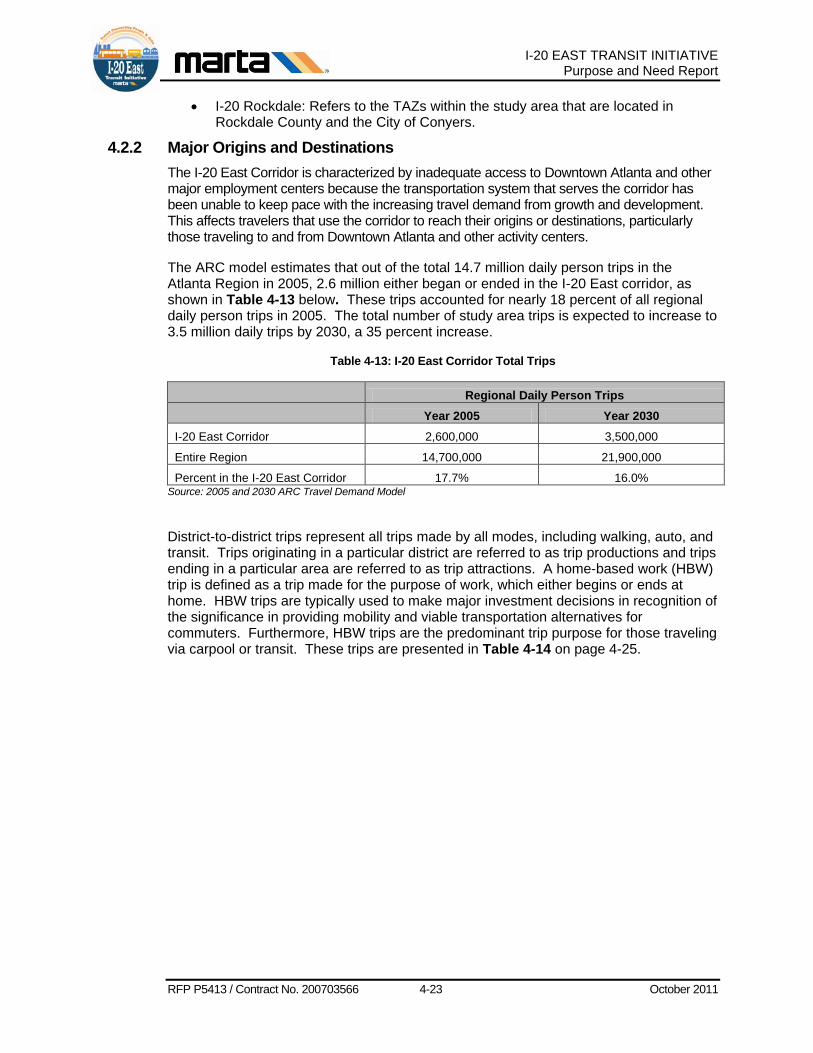
The ARC model estimates that out of the total 14.7 million daily person trips in the Atlanta Region in 2005, 2.6 million either began or ended in the I-20 East corridor, as shown in Table 4-13 below. These trips accounted for nearly 18 percent of all regional daily person trips in 2005. The total number of study area trips is expected to increase to 3.5 million daily trips by 2030, a 35 percent increase.
Table 4-13: I-20 East Corridor Total Trips
Regional Daily Person Trips
Year 2005 Year 2030
I-20 East Corridor 2,600,000 3,500,000
Entire Region 14,700,000 21,900,000
Percent in the I-20 East Corridor 17.7% 16.0% Source: 2005 and 2030 ARC Travel Demand Model
District-to-district trips represent all trips made by all modes, including walking, auto, and transit. Trips originating in a particular district are referred to as trip productions and trips ending in a particular area are referred to as trip attractions. A home-based work (HBW) trip is defined as a trip made for the purpose of work, which either begins or ends at home. HBW trips are typically used to make major investment decisions in recognition of the significance in providing mobility and viable transportation alternatives for commuters. Furthermore, HBW trips are the predominant trip purpose for those traveling via carpool or transit. These trips are presented in Table 4-14 on page 4-25.

I-20 EAST TRANSIT INITIATIVE Purpose and Need Report
RFP P5413 / Contract No. 200703566 4-24 October 2011
Figure 4-9: Travel Districts

I-20 EAST TRANSIT INITIATIVE Purpose and Need Report
RFP P5413 / Contract No. 200703566 4-25 October 2011
Table 4-14: Home-Based Work Trip Productions
Production District 2005 2030
Change Growth Trips Share Trips Share Internal 82,200 27% 133,400 31% 51,200 62%
I-20 DeKalb ITP 17,100 6% 24,900 6% 7,800 46% I-20 N DeKalb W of Panola 12,700 4% 17,600 4% 4,900 39% I-20 N DeKalb E of Panola 12,700 4% 21,100 5% 8,400 66%
I-20 Fulton 11,600 4% 19,100 4% 7,500 65% I-20 S DeKalb W of Panola 11,100 4% 16,300 4% 5,200 47%
I-20 Rockdale 8,400 3% 18,800 4% 10,400 124% I-20 S DeKalb E of Panola 4,700 2% 8,800 2% 4,100 87%
I-20 CBD 1,800 1% 3,400 1% 1,600 89% I-20 S DeKalb Mall 1,500 0% 2,000 0% 500 33%
I-20 Stonecrest 600 0% 1,400 0% 800 133% External 218,500 73% 299,600 69% 81,100 37%
N Fulton 28,100 9% 32,900 8% 4,800 17% S Fulton 26,500 9% 36,900 9% 10,400 39%
N DeKalb 25,300 8% 31,200 7% 5,900 23% Gwinnett 23,500 8% 26,400 6% 2,900 12%
Cobb 22,000 7% 23,900 6% 1,900 9% Clayton 20,900 7% 25,000 6% 4,100 20%
Remain Rockdale/Newton 20,000 7% 42,500 10% 22,500 113% Henry 16,300 5% 33,900 8% 17,600 108%
Coweta/Fayette/Spalding 11,700 4% 12,900 3% 1,200 10% Other 29,700 10% 39,500 9% 9,800 33% Total 300,700 100% 433,000 100% 132,300 44%
Source: 2005 and 2030 Travel Demand Model
Table 4-14 presents the origins or production districts and the corresponding number of HBW trips into the I-20 East Corridor. The table is organized by production trip types – internal and external. Overall, work trips to the corridor are expected to increase by 44 percent by 2030. Internal trip growth (62 percent) is expected to be much higher than external trip growth (32 percent), a phenomenon which reflects the significant number of employment centers and their associated employment growth in the corridor, especially within and surrounding the I-20 CBD (Downtown Atlanta). The highest share of trips from within the study area originates from the residential areas concentrated in the I-20 DeKalb ITP district, followed by the districts north of I-20. As would be expected of employment centers such as the I-20 CBD, South DeKalb Mall and Mall at Stonecrest, very few HBW trips originate in these districts.
Not surprisingly, the commuters traveling into the corridor are spread fairly evenly throughout the neighboring counties, including Fulton, DeKalb, Gwinnett, Cobb, Clayton, and remaining Rockdale/Newton. By 2030, the remaining Rockdale/Newton area is expected to emerge as the external district with the highest share of work trips to the corridor. This trend will continue to place pressure on the I-20 East corridor to accommodate traffic growth.
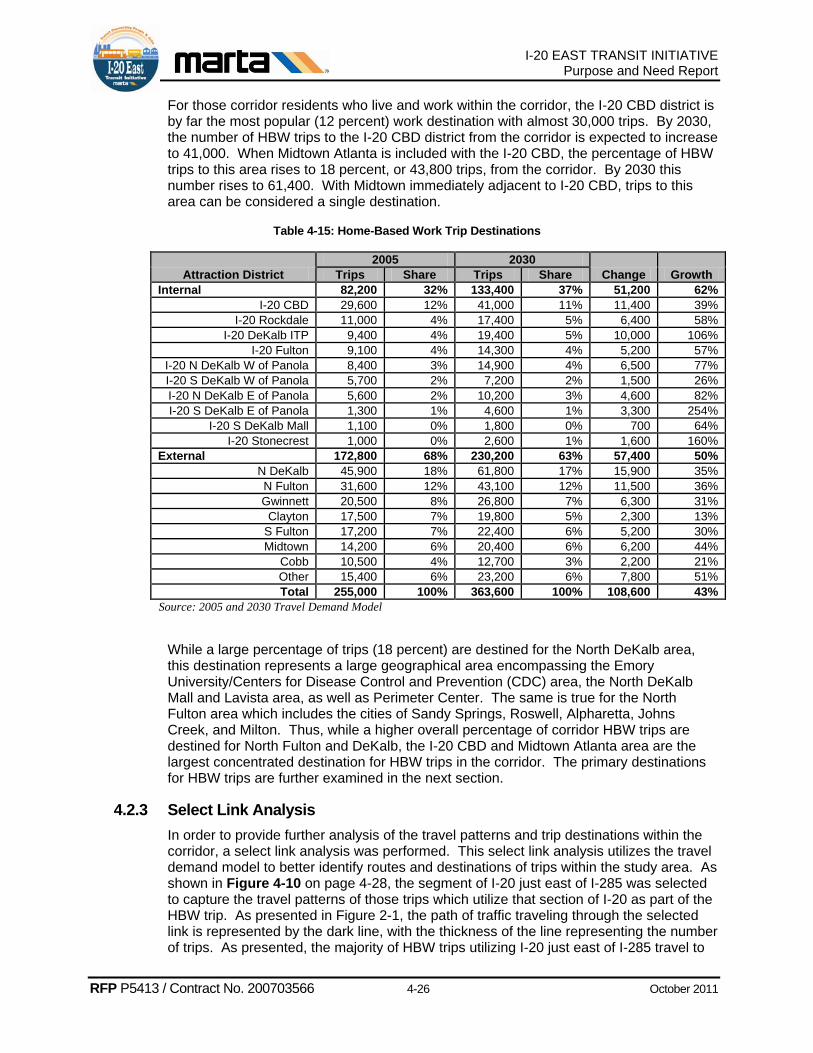
Table 4-15 on page 4-26 presents the destinations and the number of HBW trips that originate from within the corridor. In 2005, approximately 255,000 HBW trips were made from the corridor. This number is expected to be 363,600 by 2030, an increase of 43 percent. This is representative of the high level of growth expected in the study area. It is important to note that the I-20 CBD is a primary destination for many HBW trips in the region, attracting 12 percent of all HBW trips made into the corridor.
I-20 EAST TRANSIT INITIATIVE Purpose and Need Report
RFP P5413 / Contract No. 200703566 4-26 October 2011
For those corridor residents who live and work within the corridor, the I-20 CBD district is by far the most popular (12 percent) work destination with almost 30,000 trips. By 2030, the number of HBW trips to the I-20 CBD district from the corridor is expected to increase to 41,000. When Midtown Atlanta is included with the I-20 CBD, the percentage of HBW trips to this area rises to 18 percent, or 43,800 trips, from the corridor. By 2030 this number rises to 61,400. With Midtown immediately adjacent to I-20 CBD, trips to this area can be considered a single destination.
Table 4-15: Home-Based Work Trip Destinations
Attraction District 2005 2030
Change Growth Trips Share Trips Share Internal 82,200 32% 133,400 37% 51,200 62%
I-20 CBD 29,600 12% 41,000 11% 11,400 39% I-20 Rockdale 11,000 4% 17,400 5% 6,400 58%
I-20 DeKalb ITP 9,400 4% 19,400 5% 10,000 106% I-20 Fulton 9,100 4% 14,300 4% 5,200 57%
I-20 N DeKalb W of Panola 8,400 3% 14,900 4% 6,500 77% I-20 S DeKalb W of Panola 5,700 2% 7,200 2% 1,500 26% I-20 N DeKalb E of Panola 5,600 2% 10,200 3% 4,600 82% I-20 S DeKalb E of Panola 1,300 1% 4,600 1% 3,300 254%
I-20 S DeKalb Mall 1,100 0% 1,800 0% 700 64% I-20 Stonecrest 1,000 0% 2,600 1% 1,600 160%
External 172,800 68% 230,200 63% 57,400 50% N DeKalb 45,900 18% 61,800 17% 15,900 35% N Fulton 31,600 12% 43,100 12% 11,500 36% Gwinnett 20,500 8% 26,800 7% 6,300 31% Clayton 17,500 7% 19,800 5% 2,300 13%
S Fulton 17,200 7% 22,400 6% 5,200 30% Midtown 14,200 6% 20,400 6% 6,200 44%
Cobb 10,500 4% 12,700 3% 2,200 21% Other 15,400 6% 23,200 6% 7,800 51% Total 255,000 100% 363,600 100% 108,600 43%
Source: 2005 and 2030 Travel Demand Model
While a large percentage of trips (18 percent) are destined for the North DeKalb area, this destination represents a large geographical area encompassing the Emory University/Centers for Disease Control and Prevention (CDC) area, the North DeKalb Mall and Lavista area, as well as Perimeter Center. The same is true for the North Fulton area which includes the cities of Sandy Springs, Roswell, Alpharetta, Johns Creek, and Milton. Thus, while a higher overall percentage of corridor HBW trips are destined for North Fulton and DeKalb, the I-20 CBD and Midtown Atlanta area are the largest concentrated destination for HBW trips in the corridor. The primary destinations for HBW trips are further examined in the next section.
4.2.3 Select Link Analysis In order to provide further analysis of the travel patterns and trip destinations within the corridor, a select link analysis was performed. This select link analysis utilizes the travel demand model to better identify routes and destinations of trips within the study area. As shown in Figure 4-10 on page 4-28, the segment of I-20 just east of I-285 was selected to capture the travel patterns of those trips which utilize that section of I-20 as part of the HBW trip. As presented in Figure 2-1, the path of traffic traveling through the selected link is represented by the dark line, with the thickness of the line representing the number of trips. As presented, the majority of HBW trips utilizing I-20 just east of I-285 travel to

I-20 EAST TRANSIT INITIATIVE Purpose and Need Report
RFP P5413 / Contract No. 200703566 4-27 October 2011
and from the I-20 CBD. While a large percentage of trips do utilize I-285 to travel north or south, the majority of HBW trips on I-20 travel to or from the I-20 CBD.
Figure 4-11 on page 4-29 presents another select link analysis in which the dots represent the number of trip ends (destinations) for HBW trips utilizing this same segment of I-20. The findings of this analysis clearly indicate that the I-20 CBD and Midtown Atlanta area represent the highest concentration of HBW trip destinations within the corridor. A second concentration of trip ends can be seen within the study area north of I-20 and east of I-285 in the Snapfinger Woods Drive industrial area.
4.2.4 Travel Times Corridor stakeholder interviews held in the Spring and Summer of 2010 identified improved mobility and access as a primary transportation need within the corridor. Previous studies in the corridor, the South DeKalb-Lindbergh Major Investment Study (2000) and the I-20 East Corridor Alternatives Analysis (2004) have also concluded that the corridor has significant mobility constraints. Mobility and access have decreased within the corridor over the past 20 years for several reasons. These include increasing traffic congestion, lack of east-west transportation facilities, and the lack of rapid transit service along most of the corridor.
In order to quantify the mobility constraints within the corridor as well as identify which areas of the corridor are most impacted by these constraints, an analysis of existing and future travel times was performed. In order to better understand the mobility and access constraints facing the corridor, both highway and transit travel times were analyzed. Since travel times are affected by congestion, the highway network, and the transit facilities and service, it is an invaluable measure of the level of mobility constraints within a study area.
Travel times were analyzed during the AM and PM peak travel hours for this analysis since mobility within the corridor and access to jobs and housing is most affected during these periods. Congestion on study area roadways was identified as the primary cause of slow travel times, both for automobiles and local and express bus transit. While traffic congestion does not hinder travel times on the MARTA Blue Line within the study area, access to stations via automobile or bus are influenced by this congestion.
Travel times between the I-20 CBD and the Mall at Stonecrest, a trip of 18 miles, were analyzed to quantify the declining mobility between these two major activity centers within the corridor. Table 4-16 on page 4-30 presents the peak period travel times for both automobiles and transit in 2005 and 2030 in the corridor. The table shows that trips into the I-20 CBD in the AM period experience significant delay compared to travel in the non-peak direction. The same is true for the PM peak period, with eastbound trips taking appreciably longer than westbound trips. Furthermore, peak direction travel times are expected to worsen considerably more than non-peak directional travel times between 2005 and 2030. This deterioration of travel times is a direct result of increasing traffic congestion.

I-20 EAST TRANSIT INITIATIVE Purpose and Need Report
RFP P5413 / Contract No. 200703566 4-28 October 2011
Figure 4-10: Select Link Analysis – Trip Destinations (2005 AM Peak Period)

I-20 EAST TRANSIT INITIATIVE Purpose and Need Report
RFP P5413 / Contract No. 200703566 4-29 October 2011
Figure 4-11: Select Link Analysis – Trip Destinations (2030 AM Peak Period)

I-20 EAST TRANSIT INITIATIVE Purpose and Need Report
RFP P5413 / Contract No. 200703566 4-30 October 2011
Table 4-16: Travel Times from Mall at Stonecrest to I-20 CBD (2005 & 2030) in Minutes
Mode 2005 2030 % Change 2005 - 2030
AM PM AM PM AM PM Car
Mall at Stonecrest to I-20 CBD 51.55 35.52 63.49 37.51 23% 6% I-20 CBD to Mall at Stonecrest 30.29 49.86 31.13 66.26 3% 33%
Transit
Mall at Stonecrest to I-20 CBD 58.11 43.11 65.98 45.40 14% 5% I-20 CBD to Mall at Stonecrest 38.56 56.72 39.77 68.16 3% 20%
Source: 2005 and 2030 Travel Demand Model
Transit travel times for this analysis are only slightly longer. Since the primary mode of transit between the Mall at Stonecrest and the I-20 CBD is express bus, it is not surprising that the travel times would be similar to automobile travel since these buses operate in the same congested conditions as automobiles.
While an analysis of travel times between the Mall at Stonecrest and the I-20 CBD does quantify the mobility constraints between these two activity centers, this analysis does not represent travel within the entire corridor. As the previous sections highlight, the I-20 CBD represents the largest single destination for travel within the corridor; however, in order to quantify mobility throughout the corridor, travel times to and from the I-20 CBD for the entire corridor must be quantified.
The average length of trips made inside the corridor to and from the I-20 CBD is projected to lengthen considerably over the next 20 years. In 2005, just four percent of automobile trips to and from downtown from within the corridor took longer than one hour. By 2030, however, 21 percent of the AM trips and 28 percent of the PM trips to the I-20 CBD from within the corridor are projected to take one hour or more. The increase in travel times from 2005 to 2030 highlights the reduction in mobility expected for study area residents. Table 4-17 below presents travel times to and from the I-20 CBD for automobile trips from the entire study corridor during peak hours in 2005 and 2030.
Table 4-17: AM and PM Peak Hour Automobile Travel Times between Study Area and the I-20 CBD
Year 2005 Year 2030
Travel Time Range
(minutes)
AM Trips to Downtown
Atlanta
PM Trips from Downtown
Atlanta
AM Trips to Downtown
Atlanta
PM Trips from Downtown
Atlanta 0 - 15 9% 19% 6% 11% 15 - 30 37% 34% 28% 26% 30 - 45 29% 24% 21% 16% 45 - 60 21% 18% 24% 19%
> 60 4% 4% 21% 28% Source: 2005 and 2030 Travel Demand Model
Figure 4-12 on page 4-31 presents corridor automobile travel times to and from Downtown Atlanta for 2005 and 2030 in both AM and PM peak periods. This analysis was prepared to better quantify the mobility constraints of the corridor, and identify which areas within the corridor experience the highest mobility constraints. Figure 4-12 reveals that, in 2005, only the eastern travel districts experience travel times of greater than 50 minutes. By 2030 however, most travel districts west of I-285 are expected to experience travel times of greater than 50 minutes with much of the area experiencing travel times of 60 - 80+ minutes.

I-20 EAST TRANSIT INITIATIVE Purpose and Need Report
RFP P5413 / Contract No. 200703566 4-31 October 2011
Figure 4-12: 2005/2030 Peak Period Automobile Travel Times to and from Downtown Atlanta

I-20 EAST TRANSIT INITIATIVE Purpose and Need Report
RFP P5413 / Contract No. 200703566 4-32 October 2011
In order to further identify which areas of the study corridor are expected to experience the greatest loss of mobility by 2030, average travel times to and from Downtown Atlanta for all travel districts were calculated. Table 4-18 below lists the average travel time by automobile to and from Downtown Atlanta from each I-20 travel district. As presented in this table, all travel districts east of I-285 are expected to experience travel times approaching or exceeding one hour by 2030.
Table 4-18: AM and PM Peak Hour Average Automobile Travel Times to and from Downtown Atlanta by I-20 Travel Districts (2005 & 2030) in Minutes
Source: 2005 and 2030 Travel Demand Model
Figure 4-13 on page 4-33 presents transit travel times to and from Downtown Atlanta for 2005 and 2030 in both AM and PM peak periods. The transit travel accounts for local and express bus as well as travel on the existing MARTA heavy rail (Blue Line) within the corridor. As shown in Figure 4-32, transit travel times in the eastern portion of the corridor are extremely long. This is expected to worsen by 2030 since transit service to this area of the corridor is provided by buses operating on congested roadways. It is important to note that transit travel times within 2-3 miles of the existing MARTA heavy rail line are not expected to decline between 2005 and 2030. This is expected since heavy rail service is not affected by increasing traffic congestion. Additionally, 2030 transit travel times in the areas surrounding the eastern end of the MARTA heavy rail line are expected to be shorter than automobile travel times. This further highlights the detrimental effect that congestion will have on automobile travel in the study area.
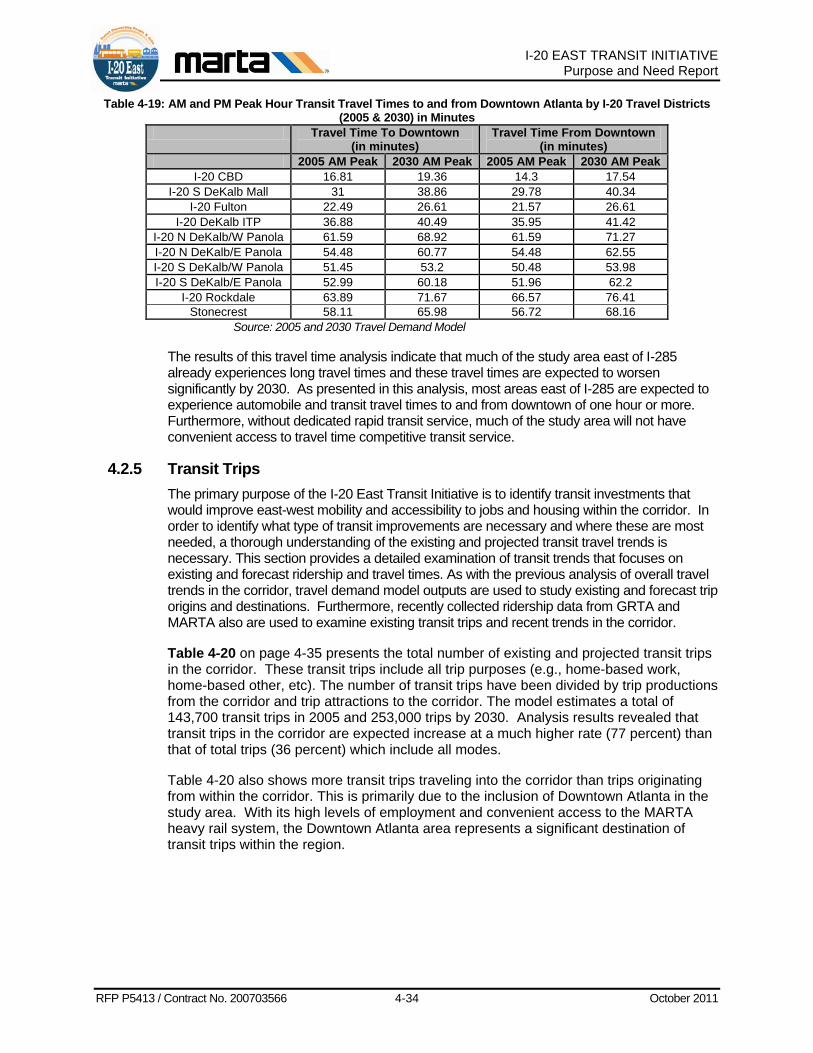
Table 4-19 on page 4-34 lists the average travel time by transit to and from downtown Atlanta from each I-20 travel district. As with automobile travel times, the travel districts east of I-285 are expected to experience transit travel times approaching or exceeding one hour.
Travel District Travel Time To Downtown (in minutes)
Travel Time From Downtown (in minutes)
2005 AM Peak 2030 AM Peak 2005 PM Peak 2030 PM Peak I-20 CBD 12.12 14.45 8.39 11.38
I-20 Fulton 20.75 28.18 17.80 26.57 I-20 S DeKalb Mall 31.72 43.84 29.82 46.05
I-20 DeKalb ITP 33.85 45.72 31.03 49.10 I-20 N DeKalb/W Panola 47.51 58.82 47.31 63.22 I-20 N DeKalb/E Panola 45.56 58.36 45.35 62.40 I-20 S DeKalb/W Panola 48.54 59.97 46.74 61.78 I-20 S DeKalb/E Panola 50.40 63.08 48.61 65.59
I-20 Rockdale 53.14 70.54 55.74 76.03 Stonecrest 51.55 63.49 49.86 66.26

I-20 EAST TRANSIT INITIATIVE Purpose and Need Report
RFP P5413 / Contract No. 200703566 4-33 October 2011
Figure 4-13: 2005/2030 Peak Period Transit Travel Times to and from Downtown Atlanta
I-20 EAST TRANSIT INITIATIVE Purpose and Need Report
RFP P5413 / Contract No. 200703566 4-34 October 2011
Table 4-19: AM and PM Peak Hour Transit Travel Times to and from Downtown Atlanta by I-20 Travel Districts (2005 & 2030) in Minutes
Travel Time To Downtown (in minutes)
Travel Time From Downtown (in minutes)
2005 AM Peak 2030 AM Peak 2005 AM Peak 2030 AM Peak I-20 CBD 16.81 19.36 14.3 17.54
I-20 S DeKalb Mall 31 38.86 29.78 40.34 I-20 Fulton 22.49 26.61 21.57 26.61
I-20 DeKalb ITP 36.88 40.49 35.95 41.42 I-20 N DeKalb/W Panola 61.59 68.92 61.59 71.27 I-20 N DeKalb/E Panola 54.48 60.77 54.48 62.55 I-20 S DeKalb/W Panola 51.45 53.2 50.48 53.98 I-20 S DeKalb/E Panola 52.99 60.18 51.96 62.2
I-20 Rockdale 63.89 71.67 66.57 76.41 Stonecrest 58.11 65.98 56.72 68.16
Source: 2005 and 2030 Travel Demand Model
The results of this travel time analysis indicate that much of the study area east of I-285 already experiences long travel times and these travel times are expected to worsen significantly by 2030. As presented in this analysis, most areas east of I-285 are expected to experience automobile and transit travel times to and from downtown of one hour or more. Furthermore, without dedicated rapid transit service, much of the study area will not have convenient access to travel time competitive transit service.
4.2.5 Transit Trips The primary purpose of the I-20 East Transit Initiative is to identify transit investments that would improve east-west mobility and accessibility to jobs and housing within the corridor. In order to identify what type of transit improvements are necessary and where these are most needed, a thorough understanding of the existing and projected transit travel trends is necessary. This section provides a detailed examination of transit trends that focuses on existing and forecast ridership and travel times. As with the previous analysis of overall travel trends in the corridor, travel demand model outputs are used to study existing and forecast trip origins and destinations. Furthermore, recently collected ridership data from GRTA and MARTA also are used to examine existing transit trips and recent trends in the corridor.
Table 4-20 on page 4-35 presents the total number of existing and projected transit trips in the corridor. These transit trips include all trip purposes (e.g., home-based work, home-based other, etc). The number of transit trips have been divided by trip productions from the corridor and trip attractions to the corridor. The model estimates a total of 143,700 transit trips in 2005 and 253,000 trips by 2030. Analysis results revealed that transit trips in the corridor are expected increase at a much higher rate (77 percent) than that of total trips (36 percent) which include all modes.
Table 4-20 also shows more transit trips traveling into the corridor than trips originating from within the corridor. This is primarily due to the inclusion of Downtown Atlanta in the study area. With its high levels of employment and convenient access to the MARTA heavy rail system, the Downtown Atlanta area represents a significant destination of transit trips within the region.

I-20 EAST TRANSIT INITIATIVE Purpose and Need Report
RFP P5413 / Contract No. 200703566 4-35 October 2011
Table 4-20: Total Transit Attractions to and Productions from the I-20 East Corridor
Total Transit Attractions Total Transit Productions 2005 2030 Growth 2005 2030 Growth
83,200 145,000 74% 60,500 108,000 79% Source: 2005 and 2030 Travel Demand Model
Transit trip characteristics are further examined in this section by analyzing HBW trips. As noted previously, HBW trips are made for the purpose of accessing employment that end or begin at home. According to the Transit On-Board Survey, 44,800 (74 percent) of the 60,500 transit trips that originated in the study area in 2005 were taken for work purposes. These HBW trips represent the largest travel market for transit trips within the Atlanta Region. Therefore, HBW trips are commonly used for making major transit investment decisions due to the value in providing access to jobs.
Table 4-21 below provides a breakdown of the origins of commuters who are using transit to access jobs within the corridor. In 2005, the majority (70 percent) of commuters taking transit to work in the corridor did so from outside the study area. The remaining 30 percent of the trip attractions translate to 13,700 transit trips that begin and end in the corridor. By 2030, the number of internal transit trips in the corridor will increase to 25,300, a growth of 83 percent.
Table 4-21: HBW Transit Trip Productions for Travel into the Corridor
Production District 2005 2030 Change Growth Trips Share Trips Share Internal 13,700 30% 25,300 33% 11,200 83% I-20 DeKalb ITP 4,700 10% 8,000 11% 3,300 70% I-20 Fulton 4,100 9% 8,500 11% 4,400 107% I-20 N DeKalb W of Panola 2,000 4% 3,000 4% 1,000 50% I-20 N DeKalb E of Panola 800 2% 1,400 2% 600 75% I-20 CBD 700 2% 1,400 2% 700 100% I-20 S DeKalb W of Panola 600 1% 1,300 2% 700 117% I-20 S DeKalb Mall 300 1% 500 1% 200 67% I-20 S DeKalb E of Panola 200 0% 500 1% 300 150% I-20 Rockdale 100 0% 300 0% 200 200% I-20 Stonecrest 200 0% 400 0% 200 0% External 31,300 70% 51,300 67% 20,000 63% N Fulton 8,700 19% 13,000 17% 4,300 49% S Fulton 8,100 18% 13,600 18% 5,500 68% N DeKalb 6,100 14% 9,500 13% 3,400 56% Clayton 2,100 5% 3,400 4% 1,300 62% Cobb 2,100 5% 3,900 5% 1,800 86% Gwinnett 1,300 3% 1,600 2% 300 23% Midtown 1,000 2% 2,300 3% 1,300 130% Other 1,900 4% 4,000 5% 2,100 111% Total 44,800 100% 75,700 100% 30,900 69%
Source: 2005 and 2030 ARC Travel Demand Model
As transit accessibility is required for both trip ends to complete the trip, it is no surprise that the top transit origins are located within the MARTA service area (DeKalb and Fulton Counties). Within the corridor, the highest number of HBW transit trips originates from Fulton and DeKalb Counties inside I-285. This is mainly due to the access to MARTA heavy rail and the extensive local bus service within these areas. In 2030, these areas will continue to have the highest transit trip productions, not to mention gain the most

I-20 EAST TRANSIT INITIATIVE Purpose and Need Report
RFP P5413 / Contract No. 200703566 4-36 October 2011
number of trips, with an additional 4,400 and 3,300 trips, respectively. This is likely due to projected increases in the density of land uses surrounding central Atlanta.
The 2005 and 2030 model data reveals relatively few HBW transit trips from the areas in the eastern portions of the study area. This suggests a lack of convenient transit options and travel time competitive transit service. As detailed earlier in this report, areas east of I-285 currently experience long travel times and these are expected to worsen by 2030.
Table 4-22 below details the HBW transit trips that originate from the study area. This table provides a breakdown of where the study area residents are taking transit for work. Unlike auto travel and transit trip attractions, an analysis of transit trip productions shows that about half of the corridor transit work trips begin and end within the corridor; this is expected to remain constant in 2030.
Table 4-22: Home Based Work Transit Destination for Travel from within the Corridor
Attraction District 2005 2030 Change Growth Trips Share Trips Share Internal 13,600 51% 24,900 50% 11,300 83% I-20 CBD 10,000 37% 15,400 31% 5,400 54% I-20 Fulton 1,700 6% 4,500 9% 2,800 165% I-20 DeKalb ITP 1,000 4% 2,900 6% 1,900 190% I-20 N DeKalb W of Panola 500 2% 1,200 2% 700 140% I-20 N DeKalb E of Panola 200 1% 300 1% 100 50% I-20 S DeKalb Mall 100 0% 300 1% 200 200% I-20 S DeKalb W of Panola 100 0% 300 1% 200 200% I-20 Stonecrest 10 0% 40 0% 30 0% I-20 S DeKalb E of Panola 10 0% 40 0% 30 0% I-20 Rockdale - 0% - 0% - 0% External 13,100 49% 25,100 50% 12,000 50% N Fulton 3,600 13% 7,800 16% 4,200 117% Midtown 3,300 12% 5,400 11% 2,100 64% N DeKalb 3,300 12% 6,000 12% 2,700 82% S Fulton 1,600 6% 3,100 6% 1,500 94% Clayton 700 3% 1,200 2% 500 71% Cobb 400 1% 1,300 3% 900 225% Gwinnett 200 1% 300 1% 100 50% Other - 0% - 0% - 0% Total 26,700 100% 50,000 100% 23,300 87%
Source: 2005 and 2030 ARC Travel Demand Model
MARTA Rail Ridership
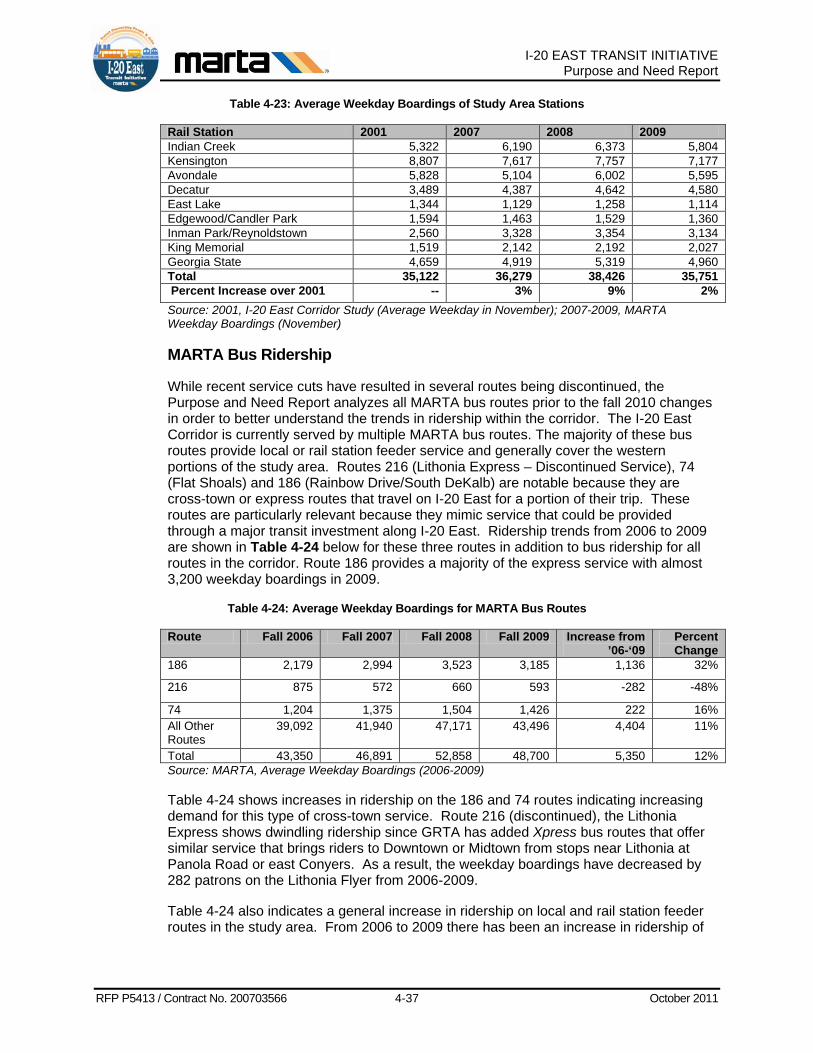
MARTA rail boardings have increased in the study area since the last major corridor study was conducted using 2001 ridership data (Table 4-23 on page 4-37). In 2009, an average of 36,000 weekday boardings occurred in the nine study area rail stations. A comparison of the boardings at stations has shown a significant ridership increase (nine percent) from 2001 to 2008. MARTA heavy rail ridership dipped in 2009 for reasons assumed to be attributable to decreases in area gasoline prices and increases in the regional unemployment. In spite of this dip, ridership remained greater than in 2001. The long term trend of increasing ridership is expected as gas prices increase and the unemployment rate decreases.
I-20 EAST TRANSIT INITIATIVE Purpose and Need Report
RFP P5413 / Contract No. 200703566 4-37 October 2011
Table 4-23: Average Weekday Boardings of Study Area Stations
Rail Station 2001 2007 2008 2009 Indian Creek 5,322 6,190 6,373 5,804 Kensington 8,807 7,617 7,757 7,177 Avondale 5,828 5,104 6,002 5,595 Decatur 3,489 4,387 4,642 4,580 East Lake 1,344 1,129 1,258 1,114 Edgewood/Candler Park 1,594 1,463 1,529 1,360 Inman Park/Reynoldstown 2,560 3,328 3,354 3,134 King Memorial 1,519 2,142 2,192 2,027 Georgia State 4,659 4,919 5,319 4,960 Total 35,122 36,279 38,426 35,751 Percent Increase over 2001 -- 3% 9% 2% Source: 2001, I-20 East Corridor Study (Average Weekday in November); 2007-2009, MARTA Weekday Boardings (November)
MARTA Bus Ridership
While recent service cuts have resulted in several routes being discontinued, the Purpose and Need Report analyzes all MARTA bus routes prior to the fall 2010 changes in order to better understand the trends in ridership within the corridor. The I-20 East Corridor is currently served by multiple MARTA bus routes. The majority of these bus routes provide local or rail station feeder service and generally cover the western portions of the study area. Routes 216 (Lithonia Express – Discontinued Service), 74 (Flat Shoals) and 186 (Rainbow Drive/South DeKalb) are notable because they are cross-town or express routes that travel on I-20 East for a portion of their trip. These routes are particularly relevant because they mimic service that could be provided through a major transit investment along I-20 East. Ridership trends from 2006 to 2009 are shown in Table 4-24 below for these three routes in addition to bus ridership for all routes in the corridor. Route 186 provides a majority of the express service with almost 3,200 weekday boardings in 2009.
Table 4-24: Average Weekday Boardings for MARTA Bus Routes
Route Fall 2006 Fall 2007 Fall 2008 Fall 2009 Increase from ’06-‘09
Percent Change
186 2,179 2,994 3,523 3,185 1,136 32%
216 875 572 660 593 -282 -48%
74 1,204 1,375 1,504 1,426 222 16% All Other Routes
39,092 41,940 47,171 43,496 4,404 11%
Total 43,350 46,891 52,858 48,700 5,350 12% Source: MARTA, Average Weekday Boardings (2006-2009)
Table 4-24 shows increases in ridership on the 186 and 74 routes indicating increasing demand for this type of cross-town service. Route 216 (discontinued), the Lithonia Express shows dwindling ridership since GRTA has added Xpress bus routes that offer similar service that brings riders to Downtown or Midtown from stops near Lithonia at Panola Road or east Conyers. As a result, the weekday boardings have decreased by 282 patrons on the Lithonia Flyer from 2006-2009.
Table 4-24 also indicates a general increase in ridership on local and rail station feeder routes in the study area. From 2006 to 2009 there has been an increase in ridership of

I-20 EAST TRANSIT INITIATIVE Purpose and Need Report
RFP P5413 / Contract No. 200703566 4-38 October 2011
11 percent for these routes, indicating an increasing demand for local transit service, in addition to express cross-town trips.
GRTA Xpress Bus Ridership
During the time period (2002 – 2004) in which the previous I-20 East Corridor Study was conducted, the GRTA Xpress service was only in the planning stages. Ridership data is now available from 2006 to 2009 and the data show an increasing demand for work trip alternatives in the corridor. Xpress ridership levels and trends are particularly relevant for this study because they mimic commuter service that could be provided through a major transit investment running parallel to I-20 East.
GRTA began operating its Xpress bus service within the I-20 East Corridor in 2006, when it introduced Routes 420 and 421 to Downtown and Midtown Atlanta from the Sigman Road Park and Ride. In 2007 and 2008 GRTA added Routes 422 and 423 from the Panola Road Park and Ride, and Route 425 from East Conyers. Due to demand GRTA has increased trips on these routes and has expanded the Sigman Road P&R to meet increased demand as part of the Congestion Reduction Demonstration project.
As shown in Table 4-25 below, Xpress service ridership (expressed in boardings) has significantly increased (300 percent) within the I-20 East Corridor from 2006 to 2009. As with MARTA rail ridership, in the fall of 2008, there was a marked reduction in the number of monthly boardings. More recently, in spite of these economic factors, ridership has held steady at levels seen in the beginning of 2008. As the unemployment rate decreases and gas prices rise again it is expected that express bus ridership will increase to levels seen in 2008 or above.
Table 4-25: GRTA Xpress Bus Ridership Trends 2006 2007 2008 2009 Monthly Boardings 11,216 26,196 57,207 44,903 Yearly Percent Increase -- 134% 118% -22% Increase over 2006 ridership -- 134% 410% 300% Source: Georgia Regional Transportation Authority, Monthly Boardings in July
Despite the temporary downturn in overall ridership, several Xpress routes met with success during the 2006 to 2009 period. As can be seen from Table 4-26 below, route 423, which runs from East Conyers to Midtown Atlanta, has seen an increase in ridership from 2007 to 2009, despite a downturn in ridership in 2009. Ridership on this route rose despite the introduction of Route 425, which provides service from the same general area to Downtown Atlanta. The combination of these two routes displays the demand for transit service from along the corridor. The success of these routes are important for this study due to the similarities of the service to those contemplated along the I-20 East corridor.
Table 4-26: GRTA Average Monthly Study Area Bus Route Ridership
GRTA Route Number Nov-07 Nov-08 Nov-09 2007-2008
2008-2009
2007-2009
420 - W. Conyers to Downtown 10,881 6,437 5,336 -40.8% -17.1% -51.0% 421 - W. Conyers to Midtown 4,799 4,331 3,784 -9.8% -12.6% -21.2% 422 - Panola to Downtown 6,104 6,284 5,372 2.9% -14.5% -12.0% 423 - E. Conyers to Midtown 3,065 5,700 4,548 86.0% -20.2% 48.4% 425 - E. Conyers to Downtown -- 7,752 8,067 NA 4.1% NA 428 - Panola to Perimeter 3,627 4,211 2,706 16.1% -35.7% -25.4%
Total Study Area Ridership 28,476 34,715 29,813 21.9% -14.1% 4.7% Source: GRTA

I-20 EAST TRANSIT INITIATIVE Purpose and Need Report
RFP P5413 / Contract No. 200703566 4-39 October 2011
These trends in bus and rail ridership within the corridor support the travel demand modeling results which indicate that transit demand is growing within the corridor.
4.3 Major Findings The following details the key findings of the transportation facilities and travel trends section as it pertains to the project purpose and need.
• With the exception of I-20, there are limited roadway options for drivers traveling east-west in the study area, and of these, few extend across a significant portion of the study area or offer multiple lanes. Since the existing transportation network does not provide a viable parallel route to I-20 for traversing the study area, the need exists to increase travel choices for east-west mobility in the corridor.
• The ARC model estimated a total of 2.6 million daily person trips that originated and terminated within the study area in 2005. By 2030, the number of trips associated with the corridor is expected to increase to 3.5 million trips, an increase of 36 percent.
• AADT for study area roadways are projected to increase significantly in 2030 as development in the area continues to increase. Volumes on I-20 in 2005 range from 76,800 AADT in the rural, eastern end of the study area to 195,000 AADT in Downtown Atlanta. By 2030, AADT on I-20 is projected to increase by up to 64 percent to volumes of up to 269,100 vehicles per day. Similar or greater increases in volume are projected for many of the area major roadways.
• A degradation in LOS is projected for most major roadways in the study area. The LOS on I-20 in 2005 ranged from D to F among study area roadway segments. By 2030, LOS is projected to worsen on more than half of these roadway segments, and only one segment is projected to operate at D or better, the level considered acceptable for urban areas. This projection for 2030 roadway conditions is typical in the study area for major east-west roadway segments, most of which are projected to operate at LOS E or F.
• While there are planned and programmed roadway capacity projects in the study area, the lack of east-west movement is projected to remain an issue due to the projects’ emphasis on north-south roadways. There are no projects planned to add general use lanes or managed lanes to I-20 by 2030.
• Downtown and Midtown Atlanta represent the largest concentrated destination for travel within the corridor during peak and off-peak hours. This is especially true for transit trips, with 49 percent of transit trips originating in the corridor destined for Downtown and Midtown Atlanta. As automobile and transit travel times to central Atlanta continue to lengthen, access to this important employment center will become increasingly difficult.
• East-west travel along I-20 is the predominant travel pattern within the corridor. This demonstrates that east-west travel along I-20 within the study area is the predominant travel pattern. With no other facilities providing significant east-west mobility, I-20 remains the only real choice for east-west travel within the corridor.
• By 2030, the largest source of trips (work trips and non-work trips) coming into the study area will be from Rockdale and Newton Counties to the east. Approximately 10 percent of all trips destined for the study corridor will come from these areas. This represents a 113 percent increase in trips from Rockdale and Newton Counties from 2005 and 2030. With I-20 the main option for travel into the study area from these

I-20 EAST TRANSIT INITIATIVE Purpose and Need Report
RFP P5413 / Contract No. 200703566 4-40 October 2011
counties, congestion will continue to increase, causing mobility and access to decrease. This confirms the need for transportation improvements to address east-west mobility along I-20.
• Automobile and transit travel times limit mobility and access within much of the corridor. Much of the study area already experiences long travel times to and from downtown. These travel times are expected to increase significantly by 2030. By 2030, most of the corridor west of I-285 is expected to experience automobile travel times to downtown of greater than 50 minutes with much of this area experiencing travel times of 60 - 80+ minutes. The same is true for transit travel times.
• The eastern portion of the study area is the most mobility and access constrained. The results of this analysis indicate that much of the study area east of I-285 already experiences long travel times and these travel times are expected to worsen significantly by 2030. By 2030, the average automobile travel times to and from downtown are expected to be greater than one hour for those residents living east of I-285. Transit travel times surrounding the existing MARTA heavy rail line are not expected to lengthen by 2030. However, by 2030 local and express bus service in much of the eastern portion of the corridor is expected to experience considerably longer travel times, primarily due to the fact that these services operate on congested roadways and there are few capacity-adding roadway improvements planned for the study area by 2030. Furthermore, no managed lanes or HOV lanes are planned along I-20 east of I-285 by 2030. This further highlights the need for travel time competitive transit service to address the mobility and access needs of the study area.
• Transit travel times are longer than automobile travel in the corridor. Overall, existing and future transit travel times are considerably longer than automobile travel times, illustrating that current transit service is not travel time competitive.
• Transit travel is expected to increase significantly in the corridor. In 2005 there were 143,700 daily transit trips in the I-20 East Corridor. By 2030, it is projected that there will be 253,000 daily transit trips in the study area, a 77 percent increase from 2005. Transit travel growth will far outpace the 36 percent growth for trips of all modes, which includes automobile trips. Over the past five to ten years, significant increases in ridership have been seen on express bus services offered by GRTA and MARTA that travel on I-20 East. These increases have occurred despite the fact that these buses operate on congested roadways. This demonstrates the strong demand for transit service within the corridor despite the fact that the existing transit service is not travel time competitive.