401(k) matching contributions in company stock: costs...
TRANSCRIPT

Journal of Public Economics 90 (2006) 1315–1346
www.elsevier.com/locate/econbase
401(k) matching contributions in company stock:
Costs and benefits for firms and workers
Jeffrey R. Brown a,b, Nellie Liang c, Scott Weisbenner a,b,*
aUniversity of Illinois, United StatesbNBER, United States
cBoard of Governors of the Federal Reserve System, United States
Received 18 August 2004; received in revised form 2 May 2005; accepted 3 May 2005
Available online 7 July 2005
Abstract
This paper tests for important determinants of why some employers provide matching
contributions for 401(k) plans in company stock. We find that firms that match in company
stock have lower stock price volatility and lower bankruptcy risk and are also more likely to
offer a defined benefit plan, consistent with a recognition that imposing a concentrated portfolio
can be costly for employees. Evidence also indicates that firms match with company stock to
help deter takeovers by putting stock into friendly hands. Simulation results suggest that while
portfolio-optimizing employees are made worse off by having their match restricted to company
stock, sufficiently risk tolerant employees who follow naı̈ve investment strategies might prefer a
401(k) plan at a company with a company stock match to a plan at a company with an
unrestricted match.
D 2005 Elsevier B.V. All rights reserved.
JEL classification: G11; J30; J32
Keywords: Pension; 401(k) plan; ESOP; Company stock; Match policy
0047-2727/$ -
doi:10.1016/j.
* Correspon
W. Gregory D
E-mail add
see front matter D 2005 Elsevier B.V. All rights reserved.
jpubeco.2005.05.007
ding author. University of Illinois-Department of Finance, 304C David Kinley Hall, MC-706, 1407
rive, Urbana, IL 61801, United States. Tel.: +1 217 333 0872; fax: +1 217 244 9867.
ress: [email protected] (S. Weisbenner).

J.R. Brown et al. / Journal of Public Economics 90 (2006) 1315–13461316
1. Introduction
The desirability of allowing employers to require employer contributions in 401(k)
plans to be held in company stock has come under scrutiny in recent years, largely in
response to several high profile bankruptcies of companies that had a large fraction of plan
assets invested in company stock. In response, numerous lawmakers have called for new
regulations and restrictions on company stock ownership in 401(k) plans.1
In part motivated by these events, a growing number of academic papers have begun to
examine asset holdings in 401(k) plans in general, and the effects of employer match policy
in particular. Recent research papers have examined the relative adequacy of retirement
wealth for defined benefit versus defined contribution plans (Even and Macpherson, 2003a;
Samwick and Skinner, 2004), the importance of plan design and employee inertia (Choi et
al., 2001; Agnew et al., 2003), the effect of 401(k) match policy on employee purchases of
company stock (Benartzi, 2001; Liang and Weisbenner, 2002), and the role of company
stock in 401(k) portfolios (Mitchell and Utkus, 2004; Poterba, 2003; VanderHei, 2002).
Less well understood is why companies choose to provide their match in company stock
in the first place. After all, standard portfolio theory suggests that there are potentially large
welfare costs from holding company stock in defined contribution plans (Poterba, 2003,
2004; Meulbroek, 2002; Even and Macpherson, 2003b) because it exposes employees to
idiosyncratic risk and introduces a positive correlation between labor income and retirement
wealth. Presumably, there must be benefits of providing a match in company stock to offset
the potential welfare costs, or else profit-maximizing companies would not compensate their
employees in a form that may not be valued fully. At the individual level, one such benefit is
the potential for preferential capital gains tax treatment of company stock relative to other
401(k) assets at retirement.2 From the firm’s perspective, a match in company stock has
lower administrative costs, frees up cash for other uses, boosts employee ownership, and
may reduce corporate taxes if the firm pays dividends. These potential benefits suggest
that many firms might prefer to match with company stock, but these benefits have to be
weighed against the potential welfare cost to employees due to a high concentration in
company stock. Thus, firms that are less risky or provide other retirement benefits may be
more likely to match in company stock, as the cost of a concentration of 401(k) wealth in
company stock is lower for these types of firms. We test this cost–benefit tradeoff,
providing evidence of how a company’s decision to provide its match in company stock or
to instead offer an unrestricted match is affected by company characteristics.3
1 For example, Senators Boxer and Corzine introduced legislation that would place a 20% cap on the share of
401(k) plan balances invested in company stock.2 If the company stock is distributed in-kind as a lump sum, only the cost basis, not the market value, of the
stock is taxed at the ordinary income tax rate. The net unrealized capital appreciation in company stock qualifies
for the capital gains rate, which for many individuals is substantially lower than the ordinary income tax rate that
applies to withdrawals of all other assets.3 In a paper written concurrently with this one, Even and Macpherson (2003b) examine why company stock is
held in defined contribution plans, but do not specifically focus on match policy. Our study focuses on why,
conditional on offering company stock as an investment option, firms decide to offer a match in company stock.
Most large publicly-traded corporations offer company stock as an investment option while approximately one-
third require that the match be held in company stock (Profit Sharing/401(k) Council of America, 2002).

J.R. Brown et al. / Journal of Public Economics 90 (2006) 1315–1346 1317
Using a sample of all publicly traded companies that filed an 11-k statement with the
U.S. Securities and Exchange Commission (SEC) from 1994 to 2001,4 we find that the
firms that match in company stock are less risky, in terms of lower stock price volatility
and a lower expected bankruptcy rate, than firms that offer an unrestricted employer
match. In addition, we find that firms that have a defined benefit plan are significantly
more likely to provide the match in company stock. These findings suggest that firms
consider the costs of a company stock match on the retirement security of plan
participants, either because firms want to minimize the chance of being considered in
violation of their fiduciary responsibility under the Employee Retirement Income Security
Act (ERISA) or because employees at these firms more fully value company stock because
of the lower firm-specific risk.
On the benefit side, our results suggest that firms may match in company stock to put
stock in bfriendly handsQ to help thwart takeovers. Specifically, firms with multiple classes
of stock, which confer superior voting rights to management, are less likely to match with
company stock. This reinforces the findings of Rauh (2003) who found that state takeover
laws and the company stock holdings in defined contribution (DC) plans of firms
incorporated in those states are substitutes. Learning which factors do not appear to
explain variation in match policy is also valuable in understanding the match decision. We
find little evidence that firms provide the employer match in company stock due to cash
flow constraints or to increase employee ownership to better align incentives. This is in
contrast to the literature that finds these factors to be important determinants of stock
option grants to non-executive employees (Core and Guay, 2001). Nor do we find robust
evidence that the corporate tax benefit associated with dividends paid on stock in
leveraged ESOP plans promotes an employer match in company stock.5
Having established the determinants of match policy, we then confirm the findings of
prior work concerning the effect of the 401(k) match on participant behavior. Consistent
with past research (Benartzi, 2001; Liang and Weisbenner, 2002), we show that
employees, on average, invest more of their own contributions in company stock when
the employer matches with company stock, resulting in even more concentrated holdings.
This finding has been attributed to a match in company stock being interpreted by
employees as implicit investment advice that company stock is a good investment. Further,
we document that about two-fifths of this boost in company stock purchases comes from a
reduction in contributions to the safest, lowest-return asset in the plan, typically a money
market fund.
Using our data on firm characteristics and the effect of the employer match on
employees’ contributions, we present simulations of the expected distribution of 401(k)
account balances at retirement in order to assess the effect of an employer match in
company stock on participant retirement security. We first demonstrate the well-known
4 As described further below, an 11-k is an annual report of a firm’s defined contribution plan that details
changes in plan assets over the past year such as employee and employer contributions to the various investment
options.5 The firm is allowed to deduct dividends paid on stock contributed to leveraged ESOP plans from taxable
income. The match component of a defined contribution plan can be converted to a leveraged ESOP to reap this
tax deduction for dividends.

J.R. Brown et al. / Journal of Public Economics 90 (2006) 1315–13461318
fact that investors who follow an optimal portfolio allocation strategy are clearly made
worse off by being exposed to excessive idiosyncratic risk of the employer stock. We also
show, however, that the results differ substantially when we parameterize the simulations
to reflect the available evidence that many 401(k) plan participants follow a naı̈ve 1 /n
diversification heuristic (Benartzi and Thaler, 2001; Liang and Weisbenner, 2002), rarely
rebalance assets (Samuelson and Zeckhauser, 1988; Ameriks and Zeldes, 2001), and invest
more of own contributions in company stock when the match is in company stock
(Benartzi, 2001; Liang and Weisbenner, 2002).
These simulations demonstrate the dual effect of matching in company stock—an
increase in both the mean account balance and the variance of the distribution. The
simulated account balances for bnaı̈ve participantsQ at retirement age indicate that, given
the historical equity premium, sufficiently risk-tolerant participants would prefer a plan
that offers a company stock match to a plan that offers an unrestricted match. A naı̈ve
investor’s preference for a plan at a firm with a company stock match rather than at a firm
with an unrestricted choice match reflects two factors. First, firms that match with
company stock have lower stock price volatility and lower bankruptcy risk than firms with
a choice match. Second, given participant behavior, the effect of a match in company stock
is to increase the share of assets held in equities and to reduce the share in lower-yielding
and lower-risk fixed-income securities (e.g., money market funds and bonds). The
assumed equity premium plays a key role in assessing the preference for a match in
company stock. Imposing a four-percentage point reduction in the equity premium, i.e.,
cutting the historical premium in half, significantly reduces the risk aversion level at which
participants would prefer the distribution of outcomes under a company stock match to an
unrestricted match.
Although we find that participation in a 401(k) plan at companies that restrict the match
to employer stock may lead to a more favorable distribution of outcomes for naı̈ve
investors than at choice companies, this finding is not meant to suggest that matching with
company stock is optimal policy for the firms that do it. Portfolio concentration does not
yield a mean-variance efficient portfolio, and even naı̈ve participants would clearly be
better off if the match were provided in a diversified equity portfolio. Rather, our results
simply suggest that a participant’s distribution of retirement wealth may be improved by a
company stock match only if his portfolio otherwise would have had too little invested in
stock, either because he followed a 1 /n investment rule or because he concentrated his
investments in a lower-return portfolio. If companies that currently match in company
stock would instead match in a diversified equity portfolio, participants would be even
better off. However, a firm currently has little incentive to provide such a diversified
match, as such a policy does not provide the firm with any of the benefits that accrue from
restricting the match to employer stock (e.g., thwarting takeover attempts).
In addition, our results do not indicate that workers would want firms that currently
provide an unrestricted match to switch to requiring that employer contributions be in
company stock. Indeed, the higher risk of firms that offer an unrestricted match would
substantially increase the variance of account balances if these firms were to switch match
policy, and only the most risk-tolerant employees would prefer such a change.
Overall, the simulations show that while the restricted employer stock match is clearly
sub-optimal, it may still be better than the alternative asset composition under a choice

J.R. Brown et al. / Journal of Public Economics 90 (2006) 1315–1346 1319
match, particularly if participants stick with low-yielding default investment options (Choi
et al., 2001). The results also show that the desirability of participating in plans that restrict
the match versus those that do not depends importantly on the characteristics of the firms
that provide the match.
The paper proceeds as follows. In Section 2, we discuss the potential costs and benefits
of providing a match in company stock. In Section 3, we provide further details on the
data. Section 4 presents our empirical analysis of employer match policy. Section 5 traces
the effect of employer match policy on employee investment choices. We provide
simulations of 401(k) account balances at retirement under alternative match policies in
Section 6. Section 7 concludes and discusses policy implications.
2. The costs and benefits of matching in employer stock
The decision by a firm to provide a match in company stock involves a tradeoff
between a number of potential costs and benefits. There are three related reasons that
providing a match in company stock may be costly for a firm. First, elementary portfolio
theory makes it clear that an optimizing agent should prefer a diversified portfolio to one
that is highly concentrated in a single asset. Rational employees would recognize that a
match in company stock substantially increases the concentration of assets and therefore
the volatility of their future retirement wealth and, as a result, would value a match in
company stock less than a match in cash, which allows them to diversify their portfolio.
Second, having a substantial part of one’s retirement wealth concentrated in the stock of
one’s employer may result in a positive correlation between one’s future labor earnings, or
human capital, and retirement wealth. In other words, when an employer becomes
financially distressed, employees risk simultaneously losing their job and suffering a
decline in their 401(k) wealth. For both of these reasons, if the company stock match is not
fully valued, companies might need to provide a larger match than if it were made in cash
or increase other compensation. Third, firms might be concerned that in the case of poor
stock price performance, the plan sponsor could be considered by the courts to be in
violation of their fiduciary responsibilities if they had provided a match in company
stock.6
To the extent that these potential costs are important to the firm, one might expect
that less risky firms—those with lower stock price volatility or bankruptcy risk—would
be more likely to match with company stock because the additional risk imposed on
workers is lower. In addition, a firm might not be as concerned about these costs if it
also provides other retirement benefits, such as a defined benefit (DB) plan, which
reduces the importance of 401(k) plan assets for financial security. In particular, the
presence of a DB plan means that the 401(k) plan participants have an additional asset
that is largely uncorrelated with company stock performance, because DB plans are
prohibited by ERISA to have more than ten percent of plan assets invested in company
6 Section 404(c) of ERISA generally relieves employers from liability for fiduciary error when the employer
permits participants to exercise control over their retirement plan accounts. If a firm requires the match to be in
company stock, however, the safe harbor provisions may no longer apply (Purcell, 2002).

J.R. Brown et al. / Journal of Public Economics 90 (2006) 1315–13461320
stock. In addition, DB plans, unlike 401(k) plans, are insured by the Pension Benefit
Guaranty Corporation (PBGC). While the benefits from DB plans are at some risk if the
company fails because of the fact that DB benefits are back-loaded and the PBGC is
responsible for obligations incurred only up to the time at which the firm fails, the
provision of these benefits mitigates the risk to retirement wealth from a high
concentration in company stock.7 Thus, firms that provide DB plans, as well as firms that
have less volatile stock, may feel less constrained in providing the employer match in
company stock.
Firms must trade off these costs against several potential benefits from providing
the employer match to 401(k) plans in company stock. One potential benefit for all
participants is that only the cost basis—not the market value—of company stock is
taxed at ordinary income rates at distribution. The net unrealized capital appreciation
in company stock qualifies for the capital gains rate, which for many individuals is
substantially lower than the ordinary income tax rate that applies to withdrawals of all
other assets.8 Thus, after-tax retirement wealth will be higher, ceteris paribus, for a
portfolio invested more heavily in company stock. Another direct benefit is a cost
reduction for all firms, because administrative fees for company stock are negligible
and considerably less than fees associated with providing other investment options,
such as equity and bond mutual funds. There are also other potential benefits to
matching in company stock that likely vary across firms, which we now discuss.
First, it may be cheaper for a firm to issue stock to fund its 401(k) match than to
raise funds from outside investors to provide an unrestricted match, perhaps because
of asymmetric information (Myers and Majluf, 1984). This argument would predict
that firms with less excess cash flow and greater asymmetric information would be
more likely to offer a match in company stock, consistent with the use of stock
options (Core and Guay, 2001). Low cash flow firms may also be more likely to
match in company stock because of less ability to raise funds via debt.
Second, for firms that pay dividends, there is a tax advantage to matching in company
stock. Any contribution to a 401(k) plan, whether paid in cash or in company stock, is
initially deductible from corporate income taxes. However, by making the contribution in
the form of company stock, a dividend paying firm may be able to bdouble dipQ by
receiving a future tax deduction for all dividends paid on shares held within the plan in
addition to the initial deduction for the value of the shares themselves. Specifically, while
dividends paid on stock are not usually tax deductible, if firms contribute the employer
match in company stock to a leveraged employee stock ownership plan (ESOP), dividends
paid on that stock to repay debt may be tax-deductible (Beatty, 1995; Schultz and Francis,
7 There is also a statutory limit on the amount of benefits that the PBGC can guarantee. For plans with a 2004
termination date, the maximum guarantee is just under $45,000 annually for a single life annuity at age 65.8 The special tax treatment for company stock is defined in the net unrealized appreciation (NUA) rule. Under
this rule, the distribution of stock must generally be as a lump sum, and must be made in-kind (i.e., in certificate
form). If the stock is liquidated and taken in cash, or the stock is rolled into an IRA, then company stock does not
receive the special tax treatment. Though the tax savings might be considerable, the distribution will generate an
immediate tax bill and could move an individual into a higher tax bracket, and thus may not be a preferred
strategy for all individuals.
J.R. Brown et al. / Journal of Public Economics 90 (2006) 1315–1346 1321
2002; Iwry, 2003).9 Recent business press cites that such tax savings may be significant for
some firms (Schultz and Francis, 2002). We test for the importance of this tax advantage
by looking at whether a firm’s dividend policy helps to explain the likelihood of a
company stock match.
Third, a company stock match likely leads to a greater share of the firm being held by
employees. As we will later document in Section 4.1, the average percent of total company
stock held in the 401(k) plan is almost three times higher for firms that match in company
stock relative to those that do not (4.5% and 1.6%, respectively). There are several
potential advantages of greater stock holding by employees, including having stock in
bfriendly handsQ to help protect the firm from hostile takeovers (Rauh, 2003). We also test
for this motive by examining whether firms that have multiple classes of stock, and thus
already have a mechanism to thwart takeovers (DeAngelo and DeAngelo, 1985), are less
likely to have a company stock match. Firms may also encourage or mandate holdings of
company stock because of the perceived benefits from aligning workers and stakeholders’
interests (Jensen and Meckling, 1976; Demsetz and Lehn, 1985; Smith and Watts, 1992).
Firms with greater monitoring difficulties, as measured by number of employees (Lazear,
1979, 1983), or greater noise in the operating environment, as measured by idiosyncratic
risk (Demsetz and Lehn, 1985), might benefit more from aligning incentives. In addition,
firms with a larger value in growth opportunities and intangible assets may benefit more
from employee stock ownership due to the asymmetric information between insiders, i.e.,
employees, and outside shareholders (Holmstrom and Milgrom, 1987). As applied to our
question, their model would predict that firms with higher market-to-book ratios would be
more likely to offer a match in company stock (Smith and Watts, 1992).
A key objective of this paper is to determine which of these potential costs and benefits
appear to be quantitatively important in explaining the cross sectional variation in
employer match policy decisions. In the next section, we explain the data that we will use
to undertake this analysis.
3. Data and sample characteristics
Our primary data source is collected from 11-k forms. Sponsors of 401(k) plans file an
11-k form with the SEC when the option to invest in company stock is deemed an offering
of securities. We collect participant contributions to company stock, money market funds
or GICs, and all other funds, the employer’s match policy (i.e., whether restricted to
company stock), employer contributions to company stock and all other assets, total plan
assets, total company stock holdings, and the number of investment options. For the few
firms with multiple plans, we collect data for the largest plan.
Starting with all U.S. firms listed in Compustat any year from 1993 to 1999, we identify
firms that filed an 11-k at least once during 1994 to 2001. We were able to hand-collect
data for 946 companies that offered a match to employee contributions, yielding 3179
9 While this benefit is not likely to encourage dividend payments, since most stock is held outside of ESOP
plans and so is subject to double taxation, the benefit could encourage companies that already pay dividends to
provide a 401(k) employer match in company stock in order to qualify for this deduction.

Table 1a
Characteristics of 1998 sample, S&P 1500, and public firms
1998 sample S&P 1500 Public firms
Market value ($ millions)
Mean 5435 7283 2438
Median 734 1329 192
[10th %–90th %] [69–9574] [238–14,211] [26–3260]
Employees (000s)
Mean 13.1 19.9 5.4
Median 4.3 6.6 0.5
[10th %–90th %] [0.5–30.3] [0.9–45] [0.02–10.2]
Member of S&P 1500 (%) 51 100 20
Technology sector (%) 15 19 24
Repurchase yield (%, mean) 1.76 1.82 1.77
Data are from Compustat. The share repurchase yield is the amount spent to repurchase shares divided by the
average of the beginning- and end-of-year market value. Public firms include 7501 U.S. firms.
J.R. Brown et al. / Journal of Public Economics 90 (2006) 1315–13461322
firm-year observations. Most of the data are in the period 1993 to 1998, with the largest
number of firms, 635, in 1998.10 On average, there are 3.4 observations per firm, with 42%
of the firms with 2 observations or less and 58% of the firms with 3 or more observations.
The information provided on the 11-k is in accordance with ERISA reporting guidelines.
In 1999, there was a change in ERISA reporting requirements that led to fewer companies
reporting contributions by asset category, leaving us with contribution data for far fewer
plans in 1999 and 2000 than in 1998.11
Information on stock prices and return variance are from the Center for Research in
Security Prices (CRSP) database. Other firm financial data, including market-to-book
ratios, assets, employees, debt ratings, dividends, cash flow (operating income before
depreciation) and details on defined benefit plans are from Compustat.
To characterize our sample, we focus on firms in the sample in 1998, a recent year with
the largest number of firms. As shown in Table 1a, about one-half of the sample was a
member of the S&P 1500 during 1998.12 Thus, the typical firm in our sample is smaller,
measured by both market value and employees, than the typical S&P 1500 firm, but is
larger than the average of all public companies, as available from Compustat. The sample
represents a broad cross-section of industries. As noted in the table, 15% of the sample is
in the technology sector, somewhat less than the overall market.
Companies that issue shares for their retirement plan, rather than purchase shares on the
open market, are required to file an 11-k. This raises the possibility that the sample could be
biased toward firms that do not repurchase stock. While data on plans that exclusively buy
10 11-k filings are available on the SEC’s EDGAR website starting in 1994. Companies were phased into filing
11-k reports over a three-year period ending in 1996, resulting in a sample size that increases steadily from just
under 300 firms in 1993 (the 1994 filing reports plan activity during 1993) to 537 firms in 1996. While reporting
plan activity in 1993, some of the 1994 filings report activity over 1992 and 1991 as well. Thus, we have 174
observations in 1992 and 49 observations in 1991.11 SEC Statement of Position 99-3 allows retirement plans to no longer report annual contributions broken down
by fund starting in 1999.12 The S&P 1500 consists of the 1500 stocks that comprise the S&P 500 index, the S&P 400 MidCap index, and
the S&P 600 SmallCap index.

Table 1b
Aggregate 401(k) plan assets and contributions for 1998 sample, public firms, and all firms
1998 sample: 635 firms Public firms All firms
Total 401(k) assets ($ billions) 264 698 1377
Total 401(k) assets in company stock ($ billions) 97 207 207
Employee and employer contributions ($ billions) 15 49 111
Contributions in company stock ($ billions) 4.9 NA NA
Data on 401(k) assets for all firms and public firms are from 1998 5500 filings with the Department of Labor for
plans with participants of 100 or more (Table D9 of the 1998 Form 5500 Annual Reports). Public firms are
defined as those that had CUSIPs and EINs that could be matched with Compustat. Company stock for public
firms and all firms excludes stock indirectly held in trusts and pooled accounts; company stock for public firms
assumes that company stock is held only at public firms. Employer contributions constitute 30% of total
contributions for the 1998 sample and 31% for all public firms.
J.R. Brown et al. / Journal of Public Economics 90 (2006) 1315–1346 1323
shares on the openmarket for the plan are not available, we document that repurchase activity
by firms in our sample does not differ from that at other publicly-traded firms.13 Specifically,
we find that roughly half of the firms in the sample repurchased stock in 1998 (just
evidently not in conjunction with their retirement plan), and as shown in the bottom row of
Table 1a, the share repurchase yield (an estimate of the fraction of shares repurchased) for
the sample was 1.8%, similar to the yield for the S&P 1500 and all public firms.
We also compare our sample of plans to those at publicly-traded firms and all firms
(public and private) as reported on Form 5500 filed with the Department of Labor
(DOL).14 In the aggregate, for our sample of the largest plans at 635 companies in 1998,
total plan assets were $264 billion, representing 38% of plan assets at all publicly-traded
companies and 20% of all plans (Table 1b). Total contributions by participants and
employers for our sample totaled $15 billion, about 30% of the $49 billion for publicly-
traded firms and 14% of all firms. In addition, company stock totaled $97 billion, or 37%
of plan assets for our 1998 sample. This is a bit higher than the 30% of 401(k) assets
estimated to be held in company stock at all public firms, and likely reflects that not all
public companies offer company stock in their 401(k) plan.
4. Empirical analysis of employer match policy
4.1. Summary statistics regarding 401(k) plans and employer match policy
As noted in the first row of Table 2, 39.3% of the 3179 firm-year observations required
that the entire employer match be in company stock, comparable to the one-third reported
by the Profit Sharing/401(k) Council of America (2002).15 Such a requirement has
15 Firms rarely change their match policy, as only 41 of 946 firms switched from an all company stock match to
an unrestricted match or vice versa during the sample period.
13 In the uncommon event that the plan does not allow employees to purchase company stock but does provide
the employer match in company stock, it would generally not be deemed an offer of securities, and the plan would
not be required to file an 11-k. In our discussion with SEC staff, the onus is on the company to determine whether
it needs to file an 11-k.14 Publicly-traded companies in the DOL Form 5500 data set were identified by whether they had a CUSIP and
matching EINs with those in Compustat.

Table 2
Relation between match policy and 401(k) asset allocation, full sample
Mean Median
Match all
Co. stock
Match
choice
Difference Match all
Co. stock
Match
choice
Difference
Full sample 1991–2000 (3179 observations)
(1) Percent of firm-year observations 39.3 60.7 39.3 60.7
(2) Percent of employee contributions
invested in Co. stock
25.0 15.5 9.5*** 19.9 11.3 8.6***
(3) Percent of total contributions
invested in Co. stock
45.5 17.0 28.5*** 43.8 12.2 31.6***
(4) Percent of total contributions
required in Co. stock
28.1 1.8 26.4*** 26.8 0.0 26.8***
(5) Percent of total assets invested in
company stock
42.4 18.2 24.2*** 39.7 11.7 28.0***
(6) Ratio of total employer to total
employee contributions
46.0 52.8 �6.8 36.7 39.7 �3.0***
(7) Percent of total firm stock held in
401(k) plan
4.5 1.6 2.9*** 2.9 0.8 2.1***
(8) Percent of total firm stock used for
401(k) contributions
0.56 0.20 0.36*** 0.36 0.11 0.25***
(9) Number of investment options offered 6.8 8.0 �1.2*** 6.0 7.0 �1.0***
***, **, * denote difference is significant at the 1%, 5%, and 10% levels, respectively.
J.R. Brown et al. / Journal of Public Economics 90 (2006) 1315–13461324
substantial consequences because, for a typical employee who contributes six percent of
salary and receives a match of $0.50 per dollar up to this limit, the match would account
for one-third of the total (employee plus employer) contributions. However, match policy
has an even larger effect because employees at firms with a match in company stock boost
their own voluntary purchases, perhaps because they interpret the employer match as
implicit investment advice that company stock is a good investment. Rows 2 through 8 of
Table 2 assess the effect of match policy upon the concentration of company stock
holdings in 401(k) plans.
In row 2 of Table 2, we show that participants at firms with the employer match in
company stock allocated 9.5 percentage points more of their own contributions to
company stock. Thus, after factoring in the match, participants at firms with a company
stock match had on average 45.5% of their total annual contributions being invested in
company stock, compared to 17% at firms with an unrestricted match (row 3). Required
company stock purchases account for 28% of total annual contributions, or three-fifths of
the observed company stock purchases.16 Row 5 shows similar patterns in asset holdings,
with 42% of plan assets held in company stock at firms with a restricted match, versus
18% at firms with an unrestricted match. Row 6 shows that the size of the employer match
16 The percent of total contributions required to be in company stock is non-zero for some firms with a choice
match because about 10% of these firms also have a small profit sharing plan that when triggered (e.g., company
profit targets are met) provides the employee with company stock. In other words, a small fraction of firms that
allow choice in their main 401(k) plan may have a small additional plan that occasionally provides additional
benefits in the form of company stock.

J.R. Brown et al. / Journal of Public Economics 90 (2006) 1315–1346 1325
relative to employee contributions does not differ substantially across firms by match
policy.
Rows 7 and 8 show that, as expected, firms that match in company stock have a
significantly higher fraction of their total outstanding shares held inside the 401(k) plan.
The amount of company stock held inside the 401(k) plan at company stock match firms
averaged 4.5%, exceeding that for choice match firms by 2.9 percentage points. The
annual purchase of company stock via employee and employer contributions represented
nearly 0.6% of the shares of company stock match firms. Within 401(k) plans of firms
with a restricted match, the number of shares held in the plans is comparable to the number
of outstanding employee stock options held by non-executives (Core and Guay, 2001;
Liang and Weisbenner, 2001). This suggests that when studying stock-based compensation
to lower-level employees, incorporating stock received through the pension plan could be
important.
The difference in the amount of stock held in 401(k) plans across match policy is of
sufficient magnitude to help deter hostile takeover attempts. Shivdasani (1993) finds that
the probability of a hostile takeover is significantly lower when a greater share of stock is
held by affiliated stockholders (i.e., family trusts, company retirement plans, etc.);
differences in ownership of affiliated holders amounted to four percentage points, 3.2% at
firms that received a hostile takeover bid compared to 7.3% at firms that were not subject
to a bid.
Row 9 shows that firms with a company stock match offer, on average, one fewer
investment option to their plan participants. To the extent that participants follow naı̈ve
diversification rules (i.e., follow 1 /n behavior), this would lead to a greater investment of
employee contributions in company stock, which would be of potential value to managers
interested in boosting the stock held in bfriendly handsQ.
4.2. Which factors matter? An empirical analysis of match policy
We are interested in determining empirically which potential costs and benefits are
most relevant to the firm’s decision about whether to offer their match in company stock
or cash. As shown in Appendix Table 1, firms that match in company stock generally
have less volatile stock prices and idiosyncratic risk (as measured over the past 24 months)
and are considerably more likely to also sponsor a defined benefit plan, have an
investment-grade debt rating, and pay dividends. They are also less likely to have multiple
classes of stock. To assess the quantitative importance of these factors and other firm
characteristics in explaining firm match policy, Table 3 presents coefficient estimates from
a regression of match policy upon these firm attributes. The first ten columns report
univariate results one at a time (columns 1 to 10). Because many of these firm
characteristics are correlated, we then turn to a multivariate analysis (column 11 of Table
3). Standard error calculations in all pooled cross-section regressions allow for
heteroskedasticity as well as correlation across observations of the same firm (i.e.,
firm-level clustering). In columns 1 to 11 we estimate linear probability models to
provide easy-to-interpret estimates of the marginal effects of firm characteristics on the
choice of match policy. Column 12 reports the marginal effects (evaluated at the sample
means) for a probit model.

Table 3
Regression of company stock match on firm characteristics (likelihood company stock match in percentage points)
(1) (2) (3) (4) (5) (6) (7) (8) (9) (10) (11) (12)
Defined benefit plan? 22.3***
(3.3)
21.3*** (4.9) 24.7*** (5.5)
Std. dev.
of returns
�130.2***(48.4)
2.7 (69.1) 5.3 (79.9)
Idiosyncratic
risk
�125.3***(48.8)
Beta �1.9(2.7)
Investment grade debt? 18.1***
(3.6)
11.1** (5.6) 12.7** (6.2)
Cash flow-to-assets 8.6
(14.3)
Maximum (CF/AS, 0) 33.1*
(18.1)
51.4* (31.5) 56.8 (38.0)
Minimum (CF/AS, 0) �20.2***(8.0)
�10.8 (74.1) �10.9 (78.0)
Dividend yield (in %) 3.3***
(1.0)
�1.0 (1.4) �1.5 (1.7)
Market-to-book ratio �0.5
(1.4)
0.4 (1.8) 0.7 (2.0)
Log (employees) 1.9*
(1.1)
�1.1 (3.0) �0.9 (3.7)
Multiple classes of
stock?
�17.0**(7.0)
�15.0 (11.0) �19.7 (12.1)
Past 5-year stock return �0.3 (0.3) �0.4 (0.5)
S&P 500? 4.9 (6.1) 6.1 (7.0)
Log (assets) �4.3 (3.0) �5.3 (3.7)
Dummies for firm age No No No No No No No No No No Y, (p=0.09) Y, (p=0.10)
2-digit industry effects No No No No No No No No No No Y, (p=0.00) Y, (p=0.00)
Model OLS OLS OLS OLS OLS OLS OLS OLS OLS OLS OLS Probit
R2 0.0708 0.0311 0.0312 0.0521 0.0209 0.0246 0.0359 0.0208 0.0227 0.0261 0.2267 0.1605
# of observations 3179 2679 2679 3179 3098 3098 3170 3141 2993 3179 2089 2089
Regressions include year effects. Marginal effects evaluated at the sample means are reported for the probit model. Standard errors, listed in parentheses, allow for heteroskedasticity and
correlation across observations of the same firm over time. ***, **, * denote significance at the 1, 5, and 10% levels, respectively.
J.R.Brownet
al./JournalofPublic
Economics
90(2006)1315–1346
1326

J.R. Brown et al. / Journal of Public Economics 90 (2006) 1315–1346 1327
The first four columns of Table 3 explore firm characteristics that are relevant to the
bcostQ of having a match in company stock. As shown in column 1, whether the firm
already provides retirement benefits through a defined benefit plan appears to be very
important.17 The estimated effect is positive and large in both the univariate and
multivariate specifications, suggesting that firms that have a defined benefit plan are
substantially more likely, by 21 to 22 percentage points, to require the match to be in
company stock.18 This is consistent with the hypothesis that providing a DB plan
significantly mitigates the risk to employee retirement wealth of having 401(k) plan assets
concentrated in company stock.
Columns 2 and 3 show a significant negative relation between stock price volatility
(measured over the past 24 months) and the probability of matching in company stock. In
a multivariate setting, however, stock price volatility does not have a significant effect,
suggesting that this lower volatility is not a major reason that these firms choose to match
in company stock (column 11). A more robust finding is that firms with an investment-
grade bond rating, as gauged by Standard and Poor’s, are 18 percentage points (11
percentage points in the multivariate setting) more likely to require the match in company
stock (columns 4 and 11).
Turning now to the benefits of matching in company stock, we find no direct evidence
that cash constraints are an important factor in setting employer match policy (column 5),
as there is no direct correlation between cash flow (i.e., operating income before
depreciation) and match policy. To explore this relation further, we split the sample into
firms by whether cash flow is positive or negative, allowing the coefficient on cash flow to
vary across these two types of firms.19 For the small segment of the sample (3.5%) that has
negative cash flow, we find that the probability of a match in company stock increases as
cash flow decreases (i.e., the coefficient is negative), possibly suggesting some role for
cash constraints for a select minority of firms. However, this correlation is insignificant in
the multivariate setting. Moreover, if cash flow is positive, the coefficient estimate is
positive, indicating that higher cash flow increases the likelihood of a company stock
match. Ceteris paribus, more profitable firms matching with company stock runs counter
17 One could envision a scenario in which firms face the choice of offering a 401(k) plan with a match in
employer stock or a defined benefit plan as alternative means to tie the worker to the firm. In our sample,
however, DB plans have been in place for some time and so we are not concerned with potential endogeneity of
the DB plan variable.18 The multivariate specification also includes dummy variables for whether the firm went public in the 1970s,
1980s, or 1990s (going public prior to the 1970s is the omitted category), and dummy variables for the firm’s two-
digit SIC industry classification (the sample spans 66 distinct two-digit industries). The firm age variables are
meant to control for differences in pension plan policy that may depend upon a firm’s age or legacy effects (e.g.,
DB plans were far more common 20 years ago, the accounting and tax treatment of ESOP plans has changed over
time), while the industry variables loosely control for differences in worker characteristics across industries that
may influence pension plan design. Both the firm age variables and the industry indicator variables are significant,
with p-values of 0.09 and 0.00, respectively. For example, a firm that went public in the 1990s is 18.8 percentage
points less likely to match with company stock than is a firm that went public in the 1970s or earlier, and firms in
the telecommunications, utilities, and retail trade industries are more apt to match with company stock.19 We also examined excess cash flow (cash flow less capital expenditures) and found qualitatively similar
results.

J.R. Brown et al. / Journal of Public Economics 90 (2006) 1315–13461328
to what we would expect if companies matched with stock because they were cash
constrained and so had no other means to provide a match.20
Consistent with Rauh (2003), we find little robust evidence to suggest that the tax-
based motivation to match in company stock if dividends are paid is a significant
determinant of match policy. In the univariate setting (column 7), coefficient estimates
suggest that a one percentage point increase in the dividend yield is associated with a 3.3
percentage point increase in the probability that a firm’s match is all company stock (the
sample average is 39%). This variable, however, is highly correlated with measures of firm
risk and the presence of a DB plan, and thus the estimate becomes less precisely measured
and actually flips sign once these other variables are included in the regression.
There is also little evidence that motivations to boost employee ownership guide the
match decision. The market-to-book ratio, a proxy for the presence of growth
opportunities and intangible assets, is not statistically significant, while the coefficient
on log(employees) is only marginally significant on its own, with the coefficient flipping
signs in the multivariate specification. Thus, the desire to align incentives and better
monitor employees, as proxied for by these two variables, does not appear to be an
important factor in explaining match policy.
Finally, the effect of multiple classes of stock is compelling, decreasing the probability
of a match by 17 percentage points (column 10). This result is consistent with the presence
of multiple classes of shares and boosting stock in bfriendly handsQ (i.e., through a
company stock match) as being substitutes in preventing unwanted takeover attempts.
While the estimated effect of multiple classes of stock is little changed, the coefficient
loses significance in the multivariate regression ( p-value=0.17). This bfriendly handsQeffect reinforces the findings of Rauh (2003) that were identified through legislative
changes in the takeover environment.
As shown in column (12), the results obtained in column (11) are not model-dependent.
The marginal effects of key variables are very similar across the linear probability and
probit models.21
On balance, the coefficients suggest that firms may be concerned about the risk of
company stock in retirement portfolios and/or the risk of being considered a poor
20 This is not to say that cash flow is not an important determinant of whether a firm offers a 401(k) plan or a
match at all, but only that it is not an important determinant of the type of match that is provided. Surveys suggest
that cash flow constraints are an important determinant of providing 401(k) benefits to employees (see U. S.
Department of Labor, 2001a,b), and studies have identified cash flow constraints as an important factor for
terminating defined benefit pension plans (see e.g., Petersen, 1992).21 In unreported results, we also find that a logit model yields very similar results. All the conclusions and
statistical significance obtained over the full sample 1991–2000 also obtain in the sample period 1993–1998 when
11-k reporting requirements are more uniform. Throughout the regressions, the standard errors are calculated to
allow for heteroskedasticity as well as correlation across observations of the same firm (i.e., firm-level clustering).
Given that firms very rarely change match policy, this error-structure assumption is appropriate. We also
considered alternative error structures. For example, allowing for correlation of observations within a year
(beyond the inclusion of year dummies in the regression) instead of across firms yields smaller standard errors
(i.e., more significant coefficients), as does assuming an AR(1) process for serial correlation of residuals within
firms over time and allowing for correlations within a year. Thus, the error structure assumed in the regressions
yielded the largest standard errors on the coefficients (i.e., the smallest t-statistics).
J.R. Brown et al. / Journal of Public Economics 90 (2006) 1315–1346 1329
fiduciary, and thus provide the match in company stock only when employees have a fall-
back retirement plan or when the firm is less likely to experience financial distress. These
considerations appear to be traded off against a desire to place a greater share of stock in
friendly hands, with little evidence to support other bbenefitQ side stories. Lower
administrative costs and lower personal tax liabilities for company stock may also be
important benefits, though these do not vary across firms. The implications of the lower
risk and other sources of retirement income for employee welfare are examined in
simulations of retirement wealth by match policy presented later in Section 6.
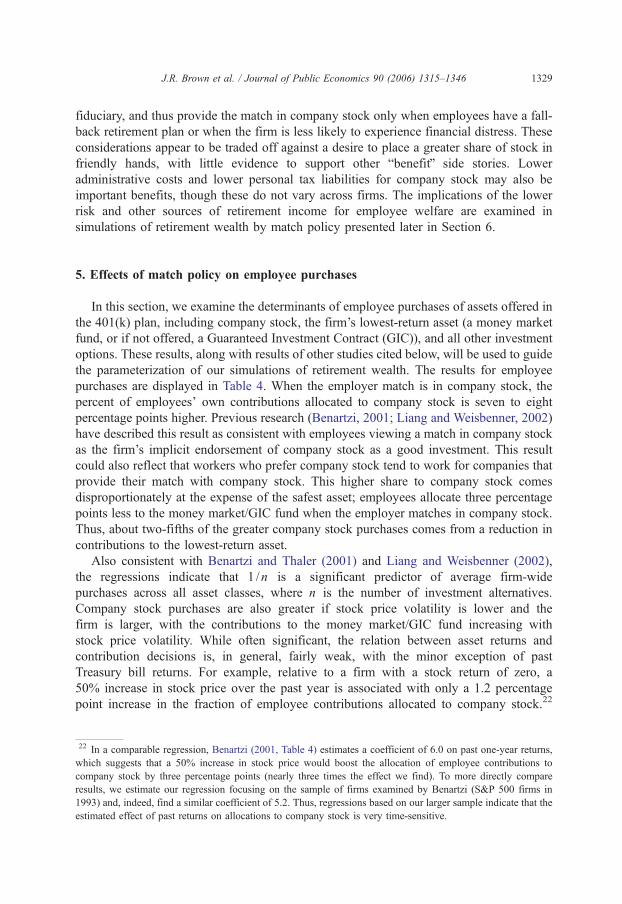
5. Effects of match policy on employee purchases
In this section, we examine the determinants of employee purchases of assets offered in
the 401(k) plan, including company stock, the firm’s lowest-return asset (a money market
fund, or if not offered, a Guaranteed Investment Contract (GIC)), and all other investment
options. These results, along with results of other studies cited below, will be used to guide
the parameterization of our simulations of retirement wealth. The results for employee
purchases are displayed in Table 4. When the employer match is in company stock, the
percent of employees’ own contributions allocated to company stock is seven to eight
percentage points higher. Previous research (Benartzi, 2001; Liang and Weisbenner, 2002)
have described this result as consistent with employees viewing a match in company stock
as the firm’s implicit endorsement of company stock as a good investment. This result
could also reflect that workers who prefer company stock tend to work for companies that
provide their match with company stock. This higher share to company stock comes
disproportionately at the expense of the safest asset; employees allocate three percentage
points less to the money market/GIC fund when the employer matches in company stock.
Thus, about two-fifths of the greater company stock purchases comes from a reduction in
contributions to the lowest-return asset.
Also consistent with Benartzi and Thaler (2001) and Liang and Weisbenner (2002),
the regressions indicate that 1 /n is a significant predictor of average firm-wide
purchases across all asset classes, where n is the number of investment alternatives.
Company stock purchases are also greater if stock price volatility is lower and the
firm is larger, with the contributions to the money market/GIC fund increasing with
stock price volatility. While often significant, the relation between asset returns and
contribution decisions is, in general, fairly weak, with the minor exception of past
Treasury bill returns. For example, relative to a firm with a stock return of zero, a
50% increase in stock price over the past year is associated with only a 1.2 percentage
point increase in the fraction of employee contributions allocated to company stock.22
22 In a comparable regression, Benartzi (2001, Table 4) estimates a coefficient of 6.0 on past one-year returns,
which suggests that a 50% increase in stock price would boost the allocation of employee contributions to
company stock by three percentage points (nearly three times the effect we find). To more directly compare
results, we estimate our regression focusing on the sample of firms examined by Benartzi (S&P 500 firms in
1993) and, indeed, find a similar coefficient of 5.2. Thus, regressions based on our larger sample indicate that the
estimated effect of past returns on allocations to company stock is very time-sensitive.

Table 4
Regression of percent of employee contributions in company stock, money market/GIC, and other options on plan characteristics, past asset returns, and firm characteristics
Variable Percent of employee contributions
in company stock
Percent of employee contributions
in money market/GIC
Percent of employee contributions in other options
Average per option Other options in total
Match required to be in
company stock?
8.1*** (1.2) 6.5*** (1.2) �2.9*** (0.9) �2.8*** (1.0) �1.6*** (0.4) �1.2*** (0.4) �5.5*** (1.2) �4.0*** (1.2)
1/# of investment options 79.8*** (8.6) 88.5*** (10.4) 84.6*** (7.5) 69.7*** (9.0) 82.4*** (4.3) 80.7*** (4.8) �177.0*** (7.5) �172.6*** (8.2)
Safest option is GIC (rather
than money market)?
10.3*** (0.9) 10.7*** (1.0)
Monthly standard deviation
of past stock returns
�32.4*** (12.7) 26.0** (11.7) 5.1 (4.4) 11.9 (13.1)
Own company stock return
over past year
2.4*** (0.5) �0.4 (0.4) �0.4** (0.2) �1.9*** (0.6)
Value-weighted market return
over past year
4.7 (6.1) �38.9*** (5.6) 8.8*** (2.5) 32.2*** (5.6)
Treasury bill return over
past year
�43.5 (43.5) 142.6*** (50.7) �61.2*** (25.0) �100.1** (50.2)
Gov’t bond return over
past year
�4.4 (3.5) 22.9*** (3.1) �4.2*** (1.3) �17.6*** (3.4)
Market-to-book ratio 1.5*** (0.4) �0.2 (0.3) �0.4*** (0.2) �1.1*** (0.4)
Log (assets) 2.6*** (0.3) 0.9*** (0.3) �0.8*** (0.1) �3.4*** (0.3)
Constant 3.1** (1.3) �14.2*** (3.5) 0.8 (1.1) �6.4* (3.6) 2.0*** (0.6) 9.7*** (1.5) 92.9*** (1.3) 116.4*** (3.9)
R2 0.1830 0.2929 0.2729 0.3337 0.4766 0.5240 0.3339 0.4709
Number of observations 3133 2629 3133 2629 3117 2616 3117 2616
Coefficient estimates and standard errors (in parentheses) from regressions of the percent of employee contributions allocated to various investment options on pension plan characteristics, past
asset returns, and firm characteristics. In the second set of columns, we relate employee contributions in the firm’s lowest-return asset (typically a money market fund, or if not offered, a
Guaranteed Investment Contract (GIC)) to plan and firm characteristics and past asset returns. Standard error calculations in the pooled cross-section regressions allow for heteroskedasticity as
well as correlation across observations of the same firm.
***, **, * denote significance at the 1%, 5%, and 10% levels, respectively.
J.R.Brownet
al./JournalofPublic
Economics
90(2006)1315–1346
1330
J.R. Brown et al. / Journal of Public Economics 90 (2006) 1315–1346 1331
Past five-year Treasury bill returns are positively correlated with the percent of employee
contributions allocated to the money market/GIC fund and negatively related with other
investment options.
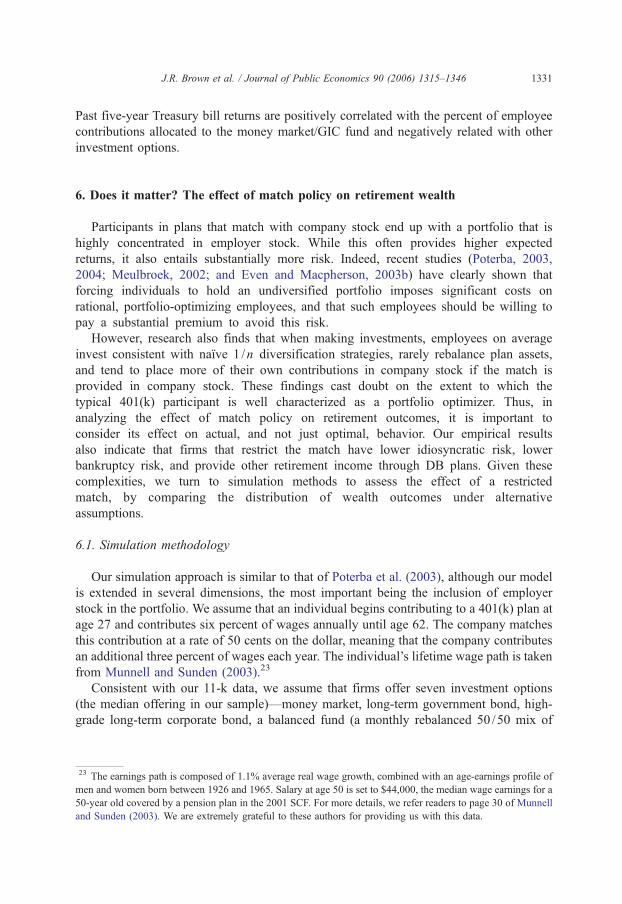
6. Does it matter? The effect of match policy on retirement wealth
Participants in plans that match with company stock end up with a portfolio that is
highly concentrated in employer stock. While this often provides higher expected
returns, it also entails substantially more risk. Indeed, recent studies (Poterba, 2003,
2004; Meulbroek, 2002; and Even and Macpherson, 2003b) have clearly shown that
forcing individuals to hold an undiversified portfolio imposes significant costs on
rational, portfolio-optimizing employees, and that such employees should be willing to
pay a substantial premium to avoid this risk.
However, research also finds that when making investments, employees on average
invest consistent with naı̈ve 1 /n diversification strategies, rarely rebalance plan assets,
and tend to place more of their own contributions in company stock if the match is
provided in company stock. These findings cast doubt on the extent to which the
typical 401(k) participant is well characterized as a portfolio optimizer. Thus, in
analyzing the effect of match policy on retirement outcomes, it is important to
consider its effect on actual, and not just optimal, behavior. Our empirical results
also indicate that firms that restrict the match have lower idiosyncratic risk, lower
bankruptcy risk, and provide other retirement income through DB plans. Given these
complexities, we turn to simulation methods to assess the effect of a restricted
match, by comparing the distribution of wealth outcomes under alternative
assumptions.
6.1. Simulation methodology
Our simulation approach is similar to that of Poterba et al. (2003), although our model
is extended in several dimensions, the most important being the inclusion of employer
stock in the portfolio. We assume that an individual begins contributing to a 401(k) plan at
age 27 and contributes six percent of wages annually until age 62. The company matches
this contribution at a rate of 50 cents on the dollar, meaning that the company contributes
an additional three percent of wages each year. The individual’s lifetime wage path is taken
from Munnell and Sunden (2003).23
Consistent with our 11-k data, we assume that firms offer seven investment options
(the median offering in our sample)—money market, long-term government bond, high-
grade long-term corporate bond, a balanced fund (a monthly rebalanced 50 /50 mix of
23 The earnings path is composed of 1.1% average real wage growth, combined with an age-earnings profile of
men and women born between 1926 and 1965. Salary at age 50 is set to $44,000, the median wage earnings for a
50-year old covered by a pension plan in the 2001 SCF. For more details, we refer readers to page 30 of Munnell
and Sunden (2003). We are extremely grateful to these authors for providing us with this data.

J.R. Brown et al. / Journal of Public Economics 90 (2006) 1315–13461332
stocks and bonds), large-cap equities, small-cap equities, and employer stock. Based on
our empirical results, we assume initially that participants invest their own contributions
using a simple 1 /n diversification heuristic.24 Except where otherwise noted, we assume
that when the company provides an unrestricted match the individual invests the employer
match in the same 1 /n manner as their employee contributions. The assumptions of 1 /n
allocations and seven investment options lead to one-half of annual employee and
employer contributions directed toward equities and one-half toward fixed income
securities at firms that match in cash. For firms that require a match in company stock, this
leads to two-thirds of total (employer plus employee) contributions being directed toward
equities and one-third toward fixed income. In our base case simulation, we assume that
the company’s decision to match in company stock has no effect on an employee’s own
contribution allocation, although we later relax this assumption. These assumptions
closely approximate the actual contribution and account balances that we observe by asset
class in actual 401(k) plans. We assume that participants do not rebalance, which is
consistent with previous research (Samuelson and Zeckhauser, 1988; Ameriks and Zeldes,
2001), and with many firms’ prohibition against diversifying out of the employer match
until certain age and service requirements were met.
To estimate retirement wealth, we need to specify processes for asset returns. Monthly
returns to the major assets are reported in Ibbotson Associates (2002) from January 1927
through December 2001. The historical annual returns averaged approximately 12% for
large-cap equities, 17% for small cap equities, 4% for money market (i.e., Treasury bills),
just below 6% for long-term government bonds, and just above 6% for high-grade corporate
bonds.
For each of the 420 months of an employee’s simulated career, we make a single
draw (with replacement) from the historical Ibbotson distributions of monthly returns,
treating all asset returns and inflation as a bpackageQ. For this same historically drawn
month, we record the returns of four brisk factorQ portfolios (explained below) that are
used to generate an expected return for each company stock in that month. This
method retains all within-month, cross-asset correlations for all of our investment
options, including employer stock. To compute the expected return for each
company in our sample for a given month, we follow the standard approach in
the finance literature of implementing a four-factor model, proposed by Carhart
(1997).25 Specifically, for each of the firms that had at least 24 months of stock returns
over the period 1991–2001 and whose match policy did not change over the sample, we
24 Aggregate evidence of 1 /n portfolio diversification does not necessarily imply that each individual
participant invests 1 /n in every asset. Thus we also simulate outcomes for participants who would otherwise
invest all of their own contributions in only one asset. Participants who otherwise would have invested only in a
fixed-income security would benefit most from a company stock match because of the equity exposure and
diversification gains (albeit very inefficient equity exposure). In contrast, for participants who otherwise would
concentrate their investments in a small-cap equity fund, a company stock match is much less desirable due to the
addition of idiosyncratic risk with little, if any, incremental return. These results are available in NBER working
paper 10419.25 The four factor returns are taken from http://mba.tuck.dartmouth.edu/pages/faculty/ken.french/data_library.
html.

Table 5
Relation between match policy and stock returns and risk
Mean Median
Match all
Co. stock
293 firms
Match choice
574 firms
Difference Match all
Co. stock
293 firms
Match
choice 574
firms
Difference
Average monthly return (in %) 1.58 1.60 �0.02 1.51 1.53 �0.02Average monthly excess
return (in %)
0.32 0.29 0.04 0.32 0.25 0.07
Market (market minus
risk-free rate) beta
0.98 1.04 �0.06 1.01 1.02 �0.01
Size (small minus big) beta 0.37 0.59 �0.22*** 0.28 0.50 �0.22***Book-to-market
(high minus low) beta
0.47 0.53 �0.06 0.55 0.61 �0.06
Momentum (up
minus down) beta
�0.17 �0.18 0.01 �0.10 �0.12 0.02
Standard deviation of
monthly returns (%)
11.4 13.0 �1.6*** 9.9 11.9 �2.0***
Monthly idiosyncratic risk
(in %)
10.1 11.6 �1.5*** 8.6 10.7 �2.1***
The average monthly excess return and idiosyncratic risk are calculated from a four-factor (i.e., market, size,
book-to-market, and momentum) model proposed by Carhart (1997).
***, **, * denote difference is significant at the 1%, 5%, and 10% levels, respectively.
J.R. Brown et al. / Journal of Public Economics 90 (2006) 1315–1346 1333
estimate the following regression of monthly stock returns from CRSP on the four
factors.26
Ri;t � Rf ;t ¼ ai þ bmkti Rm;t � Rf ;t
� �þ bsmb
i Rsmall;t � Rbig;t
� �þ bhml
i Rhigh;t � Rlow;t
� �
þ bumdi Rup;t � Rdown;t
� �þ ei;t
In words, the excess stock return (stock return less the risk-free rate) is regressed
against the excess market return, the return of small capitalization minus big capitalization
stocks (SMB), the return of high book-to-market minus low book-to-market stocks
(HML), and the return of stocks that have risen the past eleven months minus those that
have fallen (UMD). As shown in Table 5, average raw returns and excess returns
computed from the four-factor model do not differ significantly across match policy. With
the exception of the size factor, there is no difference in systematic risk across the two
groups of firms. The SMB beta is significantly smaller for firms with a company stock
match, reflecting that firms that match with company stock tend to be somewhat larger.
However, total risk (the standard deviation of monthly returns) and idiosyncratic risk (the
standard deviation of the residual from the four-factor return model) are both significantly
lower for firms with a company stock match, on the order of 1.5 to 2.1 percentage points
per month.
26 Of the original 946 firms, 41 had a change in match policy, 23 could not be linked with CRSP, and 15 were
successfully merged with CRSP but did not have 24 months of returns, resulting in the final sample of 867 firms.

J.R. Brown et al. / Journal of Public Economics 90 (2006) 1315–13461334
Each firm’s estimated coefficients from this four-factor model are then applied to the
randomly drawn factor returns in the simulation to generate an expected return for that
month of the simulation for each firm. In order to convert each firm-month expected return
into a brealizedQ return, we make a new random draw, this time from each company’s error
distribution, a normal distribution with variance based on the estimated variance of
idiosyncratic risk (ei,t) of the firm.27 These brealizedQ rates of return are then applied to
existing account balances and new contributions. This process is repeated for each month
that the individual is contributing from age 27 through age 61. We save the total account
balance at age 62, and repeat this process 100,000 times for each of the 867 firms in our
sample.28
6.2. Simulation results: distributions of 401(k) account balances
In the first column of Table 6, we report the distribution of retirement account balances
for the 293 companies that require that the match be held in the form of employer stock,
where the individual’s own contributions are made according to the 1 /n rule. For each
firm, we sort the 100,000 simulated final account balances at age 62 from lowest to
highest, and then construct, for each point in the distribution, the median across the firms.
Thus, the 1st percentile represents the median of the 1st percentile for the 293 companies,
and similarly for the other reported points in the distribution. As can be seen, the
distribution of outcomes is highly skewed. While the median account balance is $494,000,
the mean account balance is well over twice that amount, exceeding $1.2 million. At the
1st percentile of the distribution the individual has only $108,000 in retirement wealth,
while at the 99th percentile, wealth is $12.5 million.
Whether this wealth distribution is desirable or not depends on the alternative
investment strategies available. We begin by demonstrating the well-known result that
exposing an individual investor to a high level of idiosyncratic risk is clearly inferior to
allowing them to hold a well-diversified portfolio (column 2). Specifically, while the
investor in column (2) continues to allocate their non-match portfolio according to a 1 /n
heuristic, we show what would happen if the entire match were placed into a diversified
equity fund rather than into employer stock. The diversified equity portfolio is represented
by 75% from the S&P 500, and 25% from the small cap equity fund.29
The b% higher wealthQ reports the percent of the time that the individual has a higher
wealth outcome under the restricted company stock match (col. 1) than under the
diversified equity match (col. 2). The company stock match is preferred only 19% of the
time, indicating that in the vast majority of cases the individual ends up with more
retirement wealth by holding a diversified equity match. A comparison of the full
27 The inclusion of the years 1997 to 2000, when realized stock returns were high, does not materially affect our
estimates of expected returns (i.e., excess returns and betas). Estimating excess returns and betas using stock
returns over the subsample 1991 to 1996 results in total and idiosyncratic risk that are a bit lower, but the
difference in risk across match policy is quite similar to that estimated using the full sample of returns.28 We found that 100,000 simulations is sufficient for the distribution of account balances to stabilize.29 The S&P 500 represents approximately 75% of total U.S. market capitalization, small stocks represent less
than 10%, while mid-caps represent the remainder. Because historical mid-cap returns are not available, we chose
a 75 /25 portfolio to illustrate the cost of holding an undiversified portfolio.

Table 6
Distribution of 401(k) plan assets by match policy and firm characteristics
Base case Vary match policy for same firms Vary firm Vary match
Diversified equity
match
Naı̈ve diversificationcharacteristics policy and firm
characteristics
Co. stock firm
and Co. stock
match (1)
Co. stock firm
and diversified
match (2)
Co. stock firm
and choice
match (3)
Choice firm
and Co. stock
match (4)
Choice firm
and choice
match (5)
% higher wealth
with base case
– 19 59 89 70
Account balance at age 62 ($000s)
Mean 1240 1042 908 1427 974
1st % 108 128 134 102 131
5th % 151 181 177 140 172
10th % 185 222 209 169 203
25th % 280 333 296 253 285
50th % 494 579 490 462 466
75th % 1036 1079 887 980 880
90th % 2299 2058 1736 2383 1815
95th % 3804 3138 2660 4380 2867
99th % 12,533 7760 7104 15,419 8062
Constant relative risk aversion such that indifferent across firms and/or match policy
Uncorrelated
wealth ($000s)
Prefer co. stock
match if
CRRAbX
Prefer co. stock
match if
CRRAbX
Prefer co.
stock firm
if CRRANX*
Prefer co.
stock match
if CRRAbX
0 – 0.6 1.5 0.6 1.8
250 – 0.7 2.3 0.6 3.0
500 – 0.8 3.0 0.7 4.0
1000 – 0.9 4.4 0.8 6.1
Source: authors’ calculations as described in text. * Note that the inequality of the utility comparison is reversed
for column (4), signifying that, conditional on a company stock match, more risk-averse individuals prefer the
company stock match firms to the choice firms due to their lower idiosyncratic risk.
J.R. Brown et al. / Journal of Public Economics 90 (2006) 1315–1346 1335
distribution of outcomes (col. 1 vs. col. 2) illustrates the magnitude of the wealth
differentials at each point in the distribution. For instance, at the 1st percentile, the
individual ends up with $20,000, or 16%, less when forced to match in company stock,
reflecting the much higher downside risk to portfolio concentration. This is all the more
striking considering that, by assumption, contributions made by the employee (which
represent 2 /3 of total contributions) under these two scenarios are being invested in
identical 1 /n portfolios. At the median, the difference is $85,000. While the restricted
employer stock match leads to a larger outcome in only the upper 19% of cases, the
differences are sufficiently large that a comparison of the mean account balance favors the
restricted company match.
Recognizing that most investors are risk averse, the bottom panel of Table 6 reports the
coefficient of relative risk aversion (CRRA) such that the individual would be indifferent

J.R. Brown et al. / Journal of Public Economics 90 (2006) 1315–13461336
between the two distributions of wealth at retirement.30 Specifically, we use the isoelastic
utility function of the form:
U Wð Þ ¼ W 1�cð Þ � 1
1� cð Þ
The individual is risk neutral when c=0 and c =1 corresponds to log utility (with highervalues of c indicate greater risk aversion). We search for the value of c such that the
expected utility from the two distributions is the same. With CRRA utility, what matters is
the size of the gains and losses relative to total wealth, so we report these results
conditional on having varying amounts of additional uncorrelated wealth at retirement,
such as Social Security, defined benefit plans, and home equity. To the extent that some
of this wealth, such as Social Security wealth, is uncorrelated with 401(k) account
balances, it increases a participant’s tolerance for risk within the 401(k) plan.31 We
therefore report risk aversion results for a range of uncorrelated outside wealth.
Poterba (2003) reports simulations in which company stock is inferior to a market
portfolio at all levels of risk aversion. This result arises because his company stock was
modeled in a CAPM framework with b =1. Thus, the addition of idiosyncratic risk simply
generates a company stock return distribution that is a mean preserving spread of overall
equity market returns. By definition, any risk-averse individual will prefer the distribution
with the same mean but a lower variance.
In contrast, our model of stock returns is considerably richer, due to the use of the
multi-factor model with company-specific betas that are empirically estimated and applied
to historical data. In general, the expected returns for each company’s stock differs from
the S&P 500, and are higher on average. In addition, the company specific betas, in
general, are not equal to one. Thus, the distribution of company stock outcomes can have
higher means, as well as much higher variances, than the market portfolio. For reasonable
levels of risk aversion, however, the higher return on company stock is swamped by the
higher idiosyncratic risk. Even with additional uncorrelated wealth of $1 million, an
individual exhibiting log utility (c =1) would prefer the diversified equity match to a
company stock match.
Given the empirical evidence that many investors do not hold optimal portfolios, it is
also interesting to compare the wealth distribution from a restricted match to the wealth
distribution associated with an empirically motivated parameterization of how individuals,
on average, actually invest the match in the absence of restrictions. Thus, in column (3) we
30 We recognize, of course, that if individual investors were choosing optimal portfolios based on this
specification of lifetime utility, they would not follow a 1 /n strategy, fail to rebalance, and so forth. Our use of
this utility function is simply meant to provide a stylized representation of the fact that risk-averse consumers care
about the entire distribution of outcomes, and place particularly heavy weight on bbadQ outcomes.31 Using the Health and Retirement Study (HRS), Poterba et al. (2003) estimate the wealth holdings of
households with a male at retirement age (i.e., between 63 and 67). Annuitized wealth is $240,800 for the median
household with less than a high school education and $375,500 for those with at least a college degree. Total
household wealth excluding DC plan accounts ranges from $362,300 for the median household with less than a
high school education to $1,102,400 for households with at least a college degree. This suggests that for utility
comparisons, a reasonable range of uncorrelated wealth is $250,000 or $500,000.

J.R. Brown et al. / Journal of Public Economics 90 (2006) 1315–1346 1337
report the distribution of wealth for the same set of firms, but under the assumption that
individuals allocate their match according to the same 1 /n rule that they use to allocate
their own contributions. By comparing column (1) with column (3), we learn how match
policy restrictions would affect the outcome for naı̈ve investors, holding firm stock return
characteristics constant, and find that the results differ markedly from the diversified
equity match in column (2). For this set of firms, the company stock match beats the 1 /n
allocation 59% of the time, with both the mean and the median delivering higher wealth.
The bindifference risk aversionQ level is substantially higher as well. With $250,000 of
uncorrelated outside wealth, an individual with c b2.3 would prefer the company stock
match. This rises as high as 4.4 with $1 million in outside wealth.
Up until this point, we have been focusing on the comparison of outcomes within the
set of firms that, in reality, provide the match in company stock. However, as our empirical
work demonstrates, it is not random which firms choose to restrict their match. A
comparison of column (1) with column (4) illustrates the importance of these firm
characteristics by comparing a brestricted match policyQ of the 293 firms that actually
match in company stock to the sample of 574 firms that actually allow choice. Note that
column (4) is a counterfactual exercise, because it assumes that these 574 choice
companies force a match in company stock. By holding match policy constant, but varying
firm characteristics, this comparison illustrates the important role of firm characteristics, as
89% of the time, an individual would be better off in the set of restricted match companies.
Clearly, if an employee were forced to work at a company where the match was in
employer stock, he or she is generally better off doing so at a company with the risk
characteristics of those companies that, in reality, do force such a match. In other words,
companies are at least partially sorting on the basis of just how bad a company stock match
is—those firms that allow choice are particularly wise to do so. Note that the direction of
the risk aversion comparison is, in this case, reversed—given the higher idiosyncratic risk
of the choice companies, any individual with risk aversion greater than 0.6–0.8 would
prefer the firms that match in company stock.
In the final column of Table 6, we now make the breal worldQ comparison between a
restricted match at the restricted match companies to an unrestricted, choice match at the
choice companies, assuming naı̈ve diversification. A comparison of columns (1) and (5)
now captures both the difference in firm return characteristics and the difference in the
firm’s match policy. The results suggest that, given a choice between working for a firm
with a restricted match and working for a firm with a choice match, and accounting for the
differences in firm characteristics, an individual would end up with a larger account
balance 70% of the time with the company stock match firm. Both the mean and median
differences in account balances are substantial. With $250,000 in outside wealth, it
requires a risk aversion level of 3 or greater for the choice match at the choice firms to be
the preferred distribution. With $1 million of uncorrelated wealth, the CRRA below which
the individual prefers the company stock match is 6.1. With no uncorrelated wealth,
individuals with a risk aversion coefficient below 1.8 prefer the company stock match. The
outperformance of the retirement portfolio at company stock match firms reflects two
factors. First, more contributions are directed toward higher-yielding assets when the
match is provided in company stock, which implies that less is invested in lower-yielding
assets. Second, company stock match firms have lower risk, which, for an equal share in

J.R. Brown et al. / Journal of Public Economics 90 (2006) 1315–13461338
company stock, reduces the likelihood that the portfolio balance at these firms will fall
below the balance at unrestricted match firms.
6.3. Robustness checks
The results from Table 6 made several simplifying assumptions, including no
differential administrative costs associated with alternative match policies, no indirect
effects of match policy on an employee’s own contributions, no risk of bankruptcy, and a
large historical equity premium. In this section, we relax a number of these assumptions in
order to examine the robustness of our findings. The dominance of a diversified equity
match over an employer stock match is, as expected, robust across all assumptions. As
such, we limit our attention here to the bnaı̈ve diversificationQ scenarios.In the first set of three columns in Table 7, we examine sensitivity to adding differential
administrative costs and indirect effects of an employer match on a participant’s own
portfolio allocation. To consider fund management expenses, we assume zero costs for
company stock, and set management expenses of other assets according to the costs at
corporate plans reported in a confidential industry study. Given the assumed asset
composition of total contributions (i.e., employee and employer), these assumed fees
translate into a $0.21 reduction per $100 of contributions for company stock match firms
compared to a $0.31 reduction for choice match firms, a difference of ten basis points.32
This scenario also incorporates the indirect effects of a company stock match policy
that were discussed in Sections 4 and 5. Specifically, we recognize that own voluntary
purchases of company stock are higher when the match is in company stock, and that firms
that match in company stock typically offer one fewer alternative investment choice in
their plan. Since we only observe how participants invest given the match policy of their
firm, but not under the counterfactual, an implicit assumption underlying the utility
comparisons for this scenario is that employees in a firm with a company stock match
would invest their contributions differently if they switched to an unrestricted match firm,
and vice versa. These indirect effects lead to greater purchases of company stock in
company stock match firms, boosting the annual share of employee contributions invested
in company stock from 14% to 24%, and the share of total contributions invested in
company stock from 42% to 49%.33
32 Samwick and Skinner (2004) assume expenses of 42, 71, and 92 basis points for money market, bond, and
equity funds, respectively, based on Investment Company Institute (ICI) data for funds outside of 401(k) plans.
Using these higher expenses would increase the advantage of company stock relative to these alternative assets,
roughly doubling the difference in total fees across match policy.33 Under this scenario, it is assumed that participants at a firm that matches with company stock boost their own
allocations to company stock by seven percentage points (14.3% to 21.3%). Two-fifths of this boost comes from
a reduction in contributions to the money market fund, with the remaining evenly distributed across the other five
options. Because the company stock match plan offers one fewer option, employee contributions to company
stock increase by an additional 2.4 percentage points (i.e., 16.7�14.3=2.4). Rather than eliminate one of the six
non-company stock assets, we reduce employee contributions to these six assets by approximately 0.4 percentage
points each, i.e., (16.7�14.3) /6. Thus, the share of total employer plus employee contributions allocated to
company stock is 49.1% after incorporating both indirect effects. This leads to a portfolio allocation for both
contributions and account balances that closely match those of actual 401(k) plans.
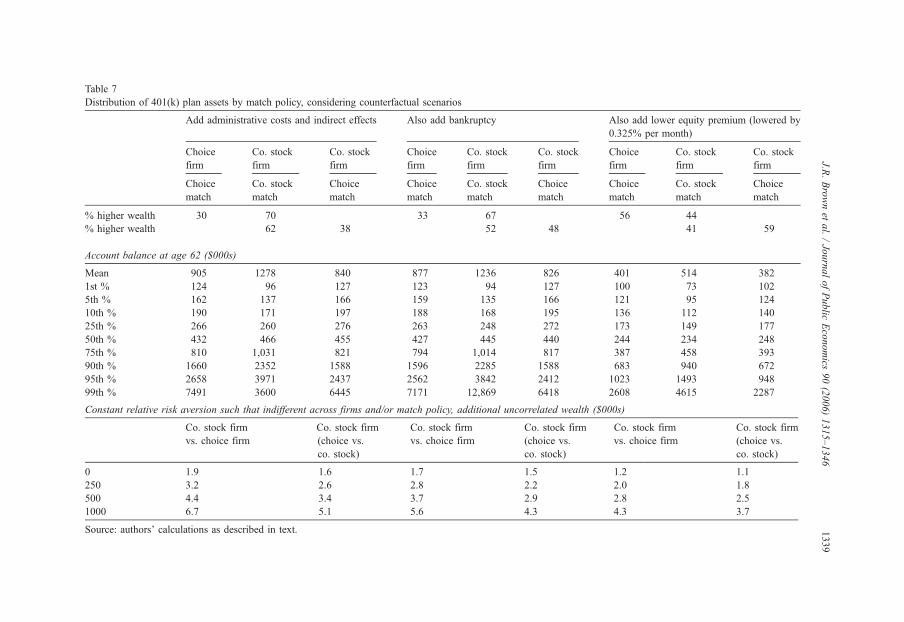
Table 7
Distribution of 401(k) plan assets by match policy, considering counterfactual scenarios
Add administrative costs and indirect effects Also add bankruptcy Also add lower equity premium (lowered by
0.325% per month)
Choice
firm
Co. stock
firm
Co. stock
firm
Choice
firm
Co. stock
firm
Co. stock
firm
Choice
firm
Co. stock
firm
Co. stock
firm
Choice
match
Co. stock
match
Choice
match
Choice
match
Co. stock
match
Choice
match
Choice
match
Co. stock
match
Choice
match
% higher wealth 30 70 33 67 56 44
% higher wealth 62 38 52 48 41 59
Account balance at age 62 ($000s)
Mean 905 1278 840 877 1236 826 401 514 382
1st % 124 96 127 123 94 127 100 73 102
5th % 162 137 166 159 135 166 121 95 124
10th % 190 171 197 188 168 195 136 112 140
25th % 266 260 276 263 248 272 173 149 177
50th % 432 466 455 427 445 440 244 234 248
75th % 810 1,031 821 794 1,014 817 387 458 393
90th % 1660 2352 1588 1596 2285 1588 683 940 672
95th % 2658 3971 2437 2562 3842 2412 1023 1493 948
99th % 7491 3600 6445 7171 12,869 6418 2608 4615 2287
Constant relative risk aversion such that indifferent across firms and/or match policy, additional uncorrelated wealth ($000s)
Co. stock firm
vs. choice firm
Co. stock firm
(choice vs.
co. stock)
Co. stock firm
vs. choice firm
Co. stock firm
(choice vs.
co. stock)
Co. stock firm
vs. choice firm
Co. stock firm
(choice vs.
co. stock)
0 1.9 1.6 1.7 1.5 1.2 1.1
250 3.2 2.6 2.8 2.2 2.0 1.8
500 4.4 3.4 3.7 2.9 2.8 2.5
1000 6.7 5.1 5.6 4.3 4.3 3.7
Source: authors’ calculations as described in text.
J.R.Brownet
al./JournalofPublic
Economics
90(2006)1315–1346
1339

J.R. Brown et al. / Journal of Public Economics 90 (2006) 1315–13461340
In the first set of three columns, we report the results for 1) choice firms with a choice
match, 2) firms with a restricted match in company stock, and 3) the counterfactual world
in which the company stock match firms provide an unrestricted match. A comparison of
the first two scenarios provides information about the difference in retirement wealth from
working for the two different types of firms, and it accounts for differences in firm
characteristics as well as match policy. From this, we see that the outcomes under the
restricted match are higher 70% of the time, and that individuals with risk aversion less
than 3.2 would prefer the company match if they had $250,000 in uncorrelated wealth. As
such, these results are quite similar to the base case comparison of columns (1) and (5) of
Table 6.
A comparison of the second column with the third column in Table 7 provides different
information; namely, whether conditional on working at a company stock match firm, a
naı̈ve investor would be better off with the company stock match or an unrestricted match.
This comparison shows that, holding firm characteristics constant, the restricted match in
employer stock is preferred 62% of the time. The indifference risk aversion level is also
somewhat lower indicating that the desirability of a company stock match relative to a
choice match discussed above in part reflects the differences in risk across the two types of
firms.
An important omission from our simulations thus far is the possibility of the bankruptcy
of the firm and the associated loss in value of company stock holdings in the 401(k)
account, such as that experienced by 401(k) participants at companies like Enron and
Worldcom. To address this, we allow firms to go bankrupt which zeroes out the value of
company stock in the 401(k) plan. In order to further capture the risk that arises from the
correlation between human capital (i.e., earnings) and financial capital (i.e., 401(k)
wealth), we also assume that when a firm goes bankrupt, the employee experiences a six-
month period of unemployment, during which he has no additional earnings, and therefore
no additional contributions to the 401(k) plan. We introduce a bankruptcy probability by
designating each firm as being included in one of three groups—those with investment-
grade bonds, speculative-grade bonds, and non-rated bonds—and applying the expected
default probability for that group to the firm.34 The expected default probabilities used for
each group represent the median rate for that group during 1997 and 1998, as estimated by
KMV Corporation, a group that implements a method that measures the likelihood that the
market value of a firm’s assets falls short of its liabilities. The expected default
probabilities for the year ahead are 0.15% for investment-grade firms, 1.93% for
speculative-grade firms, and 1.61% for firms with no bond rating. Across the 867 firms,
the average expected bankruptcy rate is 1.1% per year, roughly in line with realized bond
default rates that averaged about 1.3% per year from 1981 to 2000 according to Standard
and Poor’s, and the aggregate business failure rate from 1990 to 1997 reported by Dun and
Bradstreet.35 These rates imply that a firm has a 32% chance of failure over the 35-year
investment horizon.
34 Bond ratings are from Standard and Poor’s and available in Compustat. A rating of BBB- or better is classified
as investment grade. For firms that changed bond rating over the period, we used their average rating.35 See Standard and Poor’s (2001) and Dun & Bradstreet, Table B-96 in the Economic Report of the President,
2002.

J.R. Brown et al. / Journal of Public Economics 90 (2006) 1315–1346 1341
We implement this bankruptcy procedure by calculating a return cut-off that
corresponds to the monthly equivalent of the 0.15%, 1.93%, or 1.61% annual bankruptcy
probability of each group. When the random return draw for a particular company is
lower than the bankruptcy return cutoff for that firm, we set the company stock account
balance to zero. Variation in bankruptcy rates across firms therefore depends both on
which default group the firm is in and the firm’s stock price volatility, as firms with
greater volatility are more likely to hit the bankruptcy return cutoff. For our sample, the
expected annual default probability averages 0.59% for company stock match firms, and
1.41 for choice match firms, substantially higher both because there are fewer
investment-grade firms in the choice match group and because these firms have higher
idiosyncratic risk.
The middle scenario of Table 7 (columns 4, 5 and 6) shows that bankruptcy risk,
even with reduced contributions, only slightly reduces the mean and median account
balances, with the balances for the company stock match plan still exceeding the
choice match plan balance two-thirds of the time. It is still the case that sufficiently
risk-tolerant individuals (CRRA of 2.8 with $250,000 of uncorrelated wealth) would
prefer the company stock match. This comparison, of course, assumes that they
continue to follow a naı̈ve diversification strategy in the absence of a forced match—it
of course continues to be true that the individual would do even better if the match
were instead invested in a diversified equity portfolio. The influence of bankruptcy is
somewhat larger when we hold firm characteristics constant and vary the match policy.
For example, the b% higher wealthQ drops from 62% without bankruptcy to only 52%
with it.
On net, the bankruptcy effect is not as large as one might have expected. This
limited effect can be explained by two factors. First, the firms that match with
company stock have a substantially lower risk of bankruptcy, as reflected in their
greater likelihood of being rated investment grade and lower stock price volatility.
Thus, while employees at company stock match firms have more of their account
subject to bankruptcy risk (i.e., invested in company stock), bankruptcy happens less
frequently. Second, bankruptcy, which reduces company stock holdings to zero, is
related to the realization of a very bad outcome, which, in the absence of the forced
bankruptcy, would already have reduced company stock holdings substantially. In our
previous simulations, it was possible to have monthly return realizations at the bottom
tail of the distribution as low as �100%; our implementation of bankruptcy effectively
treats monthly return realizations beyond �65% to �70% as if they were �100%.
Thus, the marginal effect of this bimposedQ bankruptcy is not that large because the
stock would have performed poorly anyway (i.e., whereas a �80% return wipes out
four-fifths of the account balance in the first scenario in Table 7, it would lead to
bankruptcy in the middle scenario and thus wipe out the entire company stock
balance).
Of course, there are at least two direct effects of bankruptcy. We focus on the
reduction in utility that comes with lower retirement wealth. A second effect, which we
do not measure, is the direct loss in utility at the time of the unemployment spell itself
due to the loss of one’s job. Of course, this loss exists irrespective of the company’s
match policy. Indeed, given that the probability of bankruptcy is higher for the set of

J.R. Brown et al. / Journal of Public Economics 90 (2006) 1315–13461342
choice firms, accounting for this effect would simply make the restricted match
companies look even more appealing to a prospective employee. An open question is
whether, for psychological reasons, there is an additional loss in utility that arises from
watching one’s 401(k) balance decline at the same time one loses a job, even after
controlling for the loss in retirement wealth. To the extent that such factors are
important, our estimates understate the negative utility consequences of bankruptcy on
match policy.
Another concern is that we draw from the distribution of historical returns in which
there was a sizeable equity premium, and that this premium may be lower going forward
than it has been in the past (Blanchard, 1993; Campbell, 2001; Diamond, 2001; Fama and
French, 2002). To account for the possibility that the equity premium will be lower in the
future, we reduce the historical gap between the equity return and Treasury bill rate of
approximately eight percentage points to approximately four percentage points for our
simulations.36
This four-percentage point cut, which we layer on top of a possibility of
bankruptcy, dramatically reduces expected retirement account balances, more so for
company stock match firms due to the larger share of holdings in equity. The median
balance for the company stock match firms is $234,000 (versus $445,000 before the
halving of the equity premium), just about equal to the median balance for the choice
match firms. Thus, the company stock match exceeds the choice match only 44% of
the time. The mean balance for the company stock match firm still exceeds that for
the choice match firm. When additional uncorrelated wealth of $250,000 is assumed,
the reduction of the equity premium reduces the CRRA at which participants are
indifferent to match policy from 2.8 to 2.0. This simulation underscores that a lower
equity premium is a greater source of risk to a match in company stock than firm
bankruptcy.
7. Conclusion and policy implications
In deciding whether to offer an employer matching contribution in company stock
in their 401(k) plans, plan sponsors must trade off a number of costs and benefits. We
find that firms are more likely to restrict the match to company stock if firm risk is
low and employees are also covered by a defined benefit plan. This is consistent with
firms considering the effect of match policy on participant retirement security, either
because of concerns over fiduciary liability under ERISA or because employees at
these firms more fully value company stock because of the lower firm-specific risk.
Unlike stock option grants to non-executives, the firm’s decision to match in company
stock does not appear to be correlated with cash flow or with measures of the benefits
36 The equity premium reduction of 32.5 basis points per month is applied to all equity instruments. We have not
altered the return on the money market or bond investments, although in general equilibrium one might expect
these returns to change if the equity premium is reduced. Nor have we altered the variance of the various asset
classes.

J.R. Brown et al. / Journal of Public Economics 90 (2006) 1315–1346 1343
of aligning incentives of employees and owners. We do not find robust evidence that
the potential tax deduction for firms paying dividends to shares held in the 401(k)
plan is an important determinant of a company stock match. However, we do find
evidence that a company stock match is more likely if the firm does not have multiple
classes of stock, which is an alternative mechanism to reduce hostile takeover
attempts.
We use simulation methods to assess the effect of match policy on the distribution
of participant account balances at retirement, incorporating both behavioral responses
to match policy by participants and the characteristics of the firms offering the plan.
While restrictions on choice reduce welfare for portfolio-optimizing individuals, our
results suggest that for sufficiently risk-tolerant individuals who behave in a manner
consistent with the data, participating in a 401(k) plan at a company that restricts the
match is often preferable to participating in a plan at a company with an unrestricted
match. This result is attributable to several factors. First, the firms that match in
company stock have lower bankruptcy risk and stock price volatility. Second, the
match in company stock increases the equity exposure of participants, often by
reducing the share of assets held in lower-return fixed-income securities. Lower
administrative costs for company stock holdings also contribute to the desirability of a
company stock match. However, a lower equity premium reduces the preference for a
company stock match. Of course, our finding that individuals would be even better off
if companies provided a match in a diversified equity portfolio suggests that policies to
encourage a match with a diversified equity portfolio would be welfare enhancing
relative to the current hands-off policy.
Indeed, while a company stock match offers some benefits, such as more stock in
friendly hands for management, lower transaction costs, and favorable tax treatment, it is
not clear that these benefits are sufficient to outweigh cost of non-diversification for
portfolio-optimizing employees. This raises the question of why this outcome could persist
if moving from a company stock match to a broadly diversified equity portfolio match
represents a potential Pareto improvement. One likely explanation, which is supported by
survey evidence from Vanguard (2002), is that many employees substantially underes-
timate the risk of undiversified company stock holdings. If employees view their
company’s stock as safer than a diversified portfolio of stocks, this likely alters the
perceived cost–benefit tradeoff.
Disentangling the alternative hypotheses for firms’ choice of match policy is
important for guiding public policy. Our evidence that cash flow constraints are not
important suggests that policy prescriptions to prohibit a match in company stock
would be unlikely to lead to a less generous employer match, which might have been
the case if these firms had no other means to contribute to the plan. However, our
evidence consistent with a firm matching in company stock to deter a takeover attempt
by increasing the shares held in bfriendly handsQ suggests that a cap on company
stock may make offering an employer match less desirable for the firm. The lack of
evidence supporting the traditional equity incentive view suggests that a prohibition on
a match in company stock is unlikely to lead firms to increase equity-based
compensation to employees through other means, such as by granting more stock
options.

J.R. Brown et al. / Journal of Public Economics 90 (2006) 1315–13461344
Appendix A
Appendix Table 1
Summary statistics of firm characteristics by match policy, full sample
Variable (in %) Mean Median
Match all
Co. stock
Match
choice
Difference Match all
Co. stock
Match
choice
Difference
Defined benefit plan? 68.3 44.0 24.3*** 100.0 0.0 100.0***
Total monthly volatility 9.3 10.2 �0.9*** 8.2 9.5 �1.3***Idiosyncratic monthly risk 8.5 9.5 �1.0*** 7.3 8.8 �1.5***Market beta 0.86 0.88 �0.02 0.86 0.87 �0.01Investment grade debt? 48.9 30.2 18.8*** 0.0 0.0 0.0
Cash flow/assets 12.6 12.2 0.4 12.5 12.3 0.3
Is cash flow/assetsb0? 3.5 3.5 �0.1 0.0 0.0 0.0
Cash flow/assets (if N0) 14.0 13.0 1.0 12.9 12.5 0.4
Cash flow/assets (if b0) �26.7 �11.0 �15.7 �8.8 �6.6 �2.2Pay dividends? 70.6 57.5 13.1*** 100.0 100.0 0.0
Dividend yield 1.94 1.36 0.58*** 1.57 0.63 0.94***
Market-to-book ratio 1.68 1.73 �0.06 1.30 1.33 �0.03Total employees (000s) 18.0 13.0 5.0 5.0 4.0 1.0**
Multiple classes of stock? 3.0 6.5 �3.5** 0.0 0.0 0.0
Past 5-year stock return 137.4 177.0 �39.5* 95.0 92.8 2.6
S&P 500? 35.0 21.9 13.1*** 0.0 0.0 0.0
Firm market cap ($ mil) 4191 4258 �67 1068 619 452***
Firm assets ($ mil) 8261 6828 1433 1469 900 570***
***, **, * denote difference is significant at the 1%, 5%, and 10% levels, respectively.
References
Agnew, Julie, Balduzzi, Pierluigi, Sunden, Annika, 2003. Portfolio choice and trading in a large 401(k) plan.
American Economic Review 93 (1), 193–215.
Ameriks, John, Zeldes, Stephen, 2001. How do household portfolio shares vary with age? Working paper.
Columbia University. December.
Beatty, Anne, 1995. The cash flow and informational effects of employee stock ownership plans. Journal of
Financial Economics 38, 211–240.
Benartzi, Shlomo, 2001. Excessive extrapolation and the allocation of 401(k) accounts to company stock. Journal
of Finance 56, 1747–1764.
Benartzi, Shlomo, Thaler, Richard H., 2001. Naı̈ve diversification strategies in retirement savings plans.
American Economic Review 91-1, 79–98.
Blanchard, O.J., 1993. Movements in the equity premium. Brookings Papers on Economic Activity 2, 75–138.
Campbell, John, 2001. Forecasting US equity returns in the 21st century. In: Social Security Advisory Board,
John (Ed.), Estimating the Real Rate of Return on Stocks over the Long Term, August, 3–10.
Carhart, Mark M., 1997. On persistence in mutual fund performance. Journal of Finance 52, 57–82.
Choi, James, Laibson, David, Madrian, Brigitte, Metrick, Andrew, 2001. For better or for worse: default effects
and 401(k) savings behavior. NBER Working Paper, vol. 8651. December.
Core, John E., Guay, Wayne R., 2001. Stock option plans for non-executive employees. Journal of Financial
Economics 61, 253–287.
Profit Sharing/401(k) Council of America, 2002. 44th Annual Survey of Profit Sharing and 401(k) Plans.

J.R. Brown et al. / Journal of Public Economics 90 (2006) 1315–1346 1345
Council of Economic Advisors, 2002. Economic Report of the President. United States Government Printing
Office, Washington, DC.
DeAngelo, H., DeAngelo, L., 1985. Managerial ownership of voting rights: a study of public corporations with
dual classes of common stock. Journal of Financial Economics 14, 33–69.
Demsetz, Harold, Lehn, Kenneth, 1985. The structure of corporate ownership: causes and consequences. Journal
of Political Economy 93 (6), 1155–1177.
Diamond, Peter, 2001. What stock market returns to expect for the future: an update. In: Social Security Advisory
Board, Peter (Ed.), Estimating the Real Rate of Return on Stocks over the Long Term, August, 11–16.
Even, William, Macpherson, David, 2003a. The distributional consequences of the shift to defined contribution
plans. Working paper. Miami University. July.
Even, William, Macpherson, David, 2003b. The causes and consequences of company stock holdings in pension
funds. Working paper. Miami University. November.
Fama, Eugene, French, Kenneth, 2002. The equity premium. Journal of Finance 62, 637–659.
Holmstrom, Bengt, Milgrom, Paul, 1987. Aggregation and linearity in the provision of intertemporal incentives.
Econometrica 55, 303–328.
Ibbotson Associates, 2002. SBBI (Stocks, Bonds, Bills, and Inflation) 2002 Yearbook: Market Results for 1926–
2001. Ibbotson Associates, Chicago, IL.
Iwry, Mark, 2003. Promoting 401(k) security. Tax Policy Issues and Options, Urban-Brookings Tax Policy
Center, September, vol. 7.
Jensen, Michael C., Meckling, William H., 1976. Theory of the firm: managerial behavior, agency costs and
ownership structure. Journal of Financial Economics 3 (4), 305–360.
Lazear, Edward P., 1979. Why is there mandatory retirement? Journal of Political Economy 87 (6), 1261–1284
(December).
Lazear, Edward P., 1983. Pensions as severance pay. In: Bodie, Zvi, Shoven, John B., Wise, David A.
(Eds.), Financial Aspects of the United States Pension System. University of Chicago Press, Chicago,
pp. 57–85.
Liang, Nellie, Weisbenner, Scott, 2001. Who benefits from a bull market? An analysis of employee stock option
grants and stock prices. Federal Reserve Board working paper 2001-57.
Liang, Nellie, Weisbenner, Scott, 2002. Investor behavior and the purchase of company stock in 401(k) plans—
the importance of plan design. NBER Working Paper, vol. 9131.
Meulbroek, Lisa, 2002. Company stock in pension plans: how costly is it? Working paper. Harvard University.
Mitchell, Olivia S., Utkus, Stephen, 2004. Lessons from behavioral finance for retirement plan design. In:
Mitchell, Olivia S., Uktus, Stephen (Eds.), Pension Design and Structure: New Lessons from Behavioral
Finance. Oxford University Press, Oxford, UK, pp. 3–41.
Munnell, Alicia H., Sunden, Annika, 2003. Coming Up Short: the Challenge of 401(k) Plans. Brookings
Institution Press, Washington, D.C.
Myers, Stewart, Majluf, Nicholas, 1984. Corporate financing and investment decisions when firms have
information that investors do not have. Journal of Financial Economics 13 (2), 182–221.
Petersen, M.A., 1992. Pension reversions and worker-stockholder wealth transfers. Quarterly Journal of
Economics 35, 1035–1056.
Poterba, James, 2003. Employer stock and 401(k) plans. American Economic Review 93 (2), 398–404.
Poterba, James, 2004. Portfolio risk and self-directed retirement savings programmes. Economic Journal 114,
C26–C51.
Poterba, James, Rauh, Joshua, Venti, Steven, Wise, David, 2003. Utility Evaluation of Risk in Retirement Saving
Accounts. NBER working paper, vol. 9892.
Purcell, Patrick, 2002. Employer stock in retirement plans: investment risk and retirement security. CRS Report
for Congress. June.
Rauh, Joshau, 2003. Own company stock in defined contribution pension plans: a takeover defense? Working
paper. MIT.
Samuelson, William, Zeckhauser, Richard, 1988. Status quo bias in decision making. Journal of Risk and
Uncertainty 1, 7–59.
Samwick, Andrew, Skinner, Jonathan, 2004. How will 401(k) pension plans affect retirement income? American
Economic Review 94 (1), 329–343.

J.R. Brown et al. / Journal of Public Economics 90 (2006) 1315–13461346
Schultz, Ellen E., Francis, Theo, 2002. Hot tax break: 401(k)s—why firms stuff plans with stock. Wall Street
Journal. January.
Shivdasani, Anil, 1993. Board composition, ownership structure, and hostile takeovers. Journal of Accounting
and Economics 16, 167–198.
Smith, Clifford W., Watts, Ross, 1992. The investment opportunity set and corporate financing, dividend and
compensation policies. Journal of Financial Economics 32 (3), 262–292.
Standard Poor’s, 2001. Ratings Performance 2000: Default, Transition, Recovery, and Spreads, January.
United States Department of Labor, Employee Benefits Security Administration, 2001a. Report of the Working
Group on Increasing Pension Coverage, Participation and Benefits, Nov. 13.
United States Department of Labor, Pension and Welfare Benefits Administration, 2001. Private pension plan
bulletin. Abstract of 1998 Form 5500 Annual Reports. Winter.
VanderHei, Jack, 2002. The role of company stock in 401(k) plans. Risk Management and Insurance Review 5
(1), 1–20.
Vanguard, 2002. Vanguard Participant Monitor: Expecting Lower Market Returns in the Near Term. January.