401(k) plan asset allocation, account balances, and … · 401(k) plan asset allocation, account...
TRANSCRIPT

A research report from the EBRI Education and Research Fund © 2017 Employee Benefit Research Institute
August 3, 2017 • No. 436
401(k) Plan Asset Allocation, Account Balances, and Loan
Activity in 2015
By Jack VanDerhei, EBRI; Sarah Holden, ICI; Luis Alonso, EBRI; and Steven Bass, ICI
A T A G L A N C E
The bulk of 401(k) assets were invested in stocks. On average, at year-end 2015, 66 percent of 401(k)
participants’ assets were invested in equity securities through equity funds, the equity portion of balanced
funds, and company stock. Twenty-seven percent was in fixed-income securities such as stable-value
investments, bond funds, and money funds.
More 401(k) plan participants held equities at year-end 2015 than before the financial market
crisis (year-end 2007), and most had the majority of their accounts invested in equities. For
example, about three-quarters of participants in their 20s had more than 80 percent of their 401(k) plan
accounts invested in equities at year-end 2015, up from less than half of participants in their 20s at year-end
2007. Overall, more than 90 percent of 401(k) participants had at least some investment in equities at year-end
2015.
Nearly 65 percent of 401(k) plans, covering nearly three-quarters of 401(k) plan participants,
included target-date funds in their investment lineup at year-end 2015. At year-end 2015, 20 percent
of the assets in the EBRI/ICI 401(k) database were invested in target-date funds and about half of 401(k)
participants in the database held target-date funds. Also known as lifecycle funds, these funds are designed to
offer a diversified portfolio that automatically rebalances to be more focused on income over time.
A majority of new or recent hires invested their 401(k) assets in balanced funds, including target-
date funds. For example, at year-end 2015, 70 percent of recently hired participants held balanced funds in
their 401(k) plan accounts. Balanced funds comprised 41 percent of the account balances of recently hired
401(k) participants at year-end 2015. A significant subset of that balanced fund category is invested in target-
date funds. At year-end 2015, 34 percent of the account balances of recently hired participants were invested in
target-date funds.
401(k) participants’ investment in company stock continued at historically low levels. Less than
7 percent of 401(k) assets were invested in company stock at year-end 2015, roughly the same share as in
2012, 2013, and 2014. This share has fallen by 63 percent since 1999 when company stock accounted for
19 percent of assets. Recently hired 401(k) participants contributed to this trend: they tend to be less likely to
hold company stock. At year-end 2015, about one-quarter of recently hired 401(k) plan participants in plans
offering company stock held company stock, compared with about 43 percent of all 401(k) participants.
401(k) participants were less likely to have loans outstanding at year-end 2015 than at year-end
2014. At year-end 2015, 18 percent of all 401(k) participants who were eligible for loans had loans outstanding
against their 401(k) plan accounts, down from 20 percent at year-end 2014. Loans outstanding amounted to

ebri.org Issue Brief • August 3, 2017 • No. 436 2
12 percent of the remaining account balance, on average, at year-end 2015, up 1 percentage point from year-
end 2014. Loan amounts also edged up a bit in 2015.
The year-end 2015 average 401(k) plan account balance in the database was 3.8 percent lower
than the year before, reflecting in large part the changing composition of the sample rather than
the experience of typical 401(k) participants in 2015. To understand changes in 401(k) participants’
average account balances, it is important to analyze a sample of consistent participants. For 401(k) participants
present in both 2014 and 2015, the average account balance increased by 3.1 percent. As with previous
EBRI/ICI updates, analysis of a sample of consistent 401(k) plan participants is expected to be published later
this year.
The average 401(k) plan account balance tends to increase with participant age and tenure. For
example, at year-end 2015, participants in their 40s with more than two to five years of tenure had an average
401(k) plan account balance of close to $35,000, compared with an average 401(k) plan account balance of
more than $280,000 among participants in their 60s with more than 30 years of tenure.

ebri.org Issue Brief • August 3, 2017 • No. 436 3
Jack VanDerhei is director of Research at the Employee Benefit Research Institute (EBRI). Sarah Holden is senior
director of Retirement and Investor Research at the Investment Company Institute (ICI). Luis Alonso is director of
Information Technology and Research Databases at EBRI. Steven Bass is an associate economist at ICI. This Issue Brief
was written with assistance from the Institute’s research and editorial staffs. Any views expressed in this report are
those of the authors, and should not be ascribed to the officers, trustees, or other sponsors of EBRI, EBRI-ERF, or their
staffs. Neither EBRI nor EBRI-ERF lobbies or takes positions on specific policy proposals. EBRI invites comment on this
research.
Suggested citation: Jack VanDerhei, Sarah Holden, Luis Alonso, and Steven Bass. “401(k) Plan Asset Allocation,
Account Balances, and Loan Activity in 2015.” EBRI Issue Brief, no. 426, and ICI Research Perspective, Vol. 23, no. 6
(August 2017).
Copyright Information: This report is copyrighted by the Employee Benefit Research Institute (EBRI) and by the
Investment Company Institute (ICI). It may be used without permission but citation of the source is required.
Report availability: This report is available on the Internet at www.ebri.org and at www.ici.org
Since 1996, the Employee Benefit Research Institute (EBRI) and the Investment Company Institute (ICI) have worked
together on collecting and analyzing annual data on millions of 401(k) plan participants’ accounts. This report reflects
the year-end 2015 update of these data and EBRI’s and ICI’s ongoing research into 401(k) plan participants’ activity.
Table of Contents Introduction .......................................................................................................................................................... 7
EBRI/ICI 401(k) Database ...................................................................................................................................... 7
Sources and Types of Data ................................................................................................................................. 7
Investment Options ........................................................................................................................................... 7
About the EBRI/ICI Database ................................................................................................................................. 8
Distribution of Plans, Participants, and Assets by Plan Size .................................................................................... 8
About Changes in Account Balances ...................................................................................................................... 10
Relationship of EBRI/ICI 401(k) Database Plans to the Universe of All 401(k) Plans .............................................. 10
Age and Tenure of 401(k) Plan Participants ....................................................................................................... 10
Year-End 2015 Snapshot of 401(k) Participants’ Account Balances .......................................................................... 10
Factors That Affect 401(k) Participants’ Account Balances ................................................................................... 10
Definition of 401(k) Plan Account Balance .......................................................................................................... 13
Size of 401(k) Plan Account Balances .................................................................................................................... 13
Relationship of Age and Tenure to 401(k) Plan Account Balances ........................................................................ 13
Relationship Between 401(k) Plan Account Balances and Salary .......................................................................... 17
Year-End 2015 Snapshot of 401(k) Participants’ Asset Allocation ............................................................................. 17
Changes in Asset Allocation Between Year-End 2014 and Year-End 2015 ............................................................. 21
Asset Allocation and Participant Age .................................................................................................................. 21
Asset Allocation and Investment Options ........................................................................................................... 21
Asset Allocation by Investment Options and Age, Salary, and Plan Size ................................................................ 21
Distribution of Equity Fund Allocations and Participant Exposure to Equities ......................................................... 23
Asset Allocation to Equity Funds .................................................................................................................... 23
Asset Allocation of 401(k) Plan Participants Without Equity Funds .................................................................... 28

ebri.org Issue Brief • August 3, 2017 • No. 436 4
Asset Allocation to Equities ........................................................................................................................... 28
Changes in Concentrations in Equities Since the Financial Crisis ....................................................................... 28
Distribution of 401(k) Participants’ Balanced Fund Allocations by Age .................................................................. 28
Distribution of 401(k) Participants’ Company Stock Allocations ............................................................................ 31
Asset Allocations of Recently Hired Participants .............................................................................................. 31
Year-End 2015 Snapshot of 401(k) Plan Loan Activity ............................................................................................. 35
Availability and Use of 401(k) Plan Loans by Plan Size ........................................................................................ 35
401(k) Plan Loan Activity Varies with Participant Age, Tenure, Account Balance, and Salary .................................. 35
Average Loan Balances .................................................................................................................................... 35
References ......................................................................................................................................................... 499
Endnotes .......................................................................................................................................................... 555
Figures
Figure 1, 401(k) Plan Characteristics, by Number of Plan Participants, 2015 ............................................................... 9
Figure 2, Distribution of 401(k) Plans, Participants, and Assets ................................................................................ 9
Figure 3, 401(k) Plan Characteristics, by Plan Assets, 2015 ....................................................................................... 9
Figure 4, EBRI/ICI 401(k) Database Represents a Wide Cross Section of the 401(k) Universe ................................... 11
Figure 5, 401(k) Participants Represent a Range of Ages ........................................................................................ 12
Figure 6, 401(k) Participants Represent a Range of Job Tenures ............................................................................ 12
Figure 7, Domestic Stock and Bond Market Indexes ............................................................................................... 14
Figure 8, Percent Change in Total Return Indexes .................................................................................................. 14
Figure 9, Snapshot of Year-End 401(k) Plan Account Balances ................................................................................ 15
Figure 10, Distribution of 401(k) Plan Account Balances, by Size of Account Balance ............................................ 16
Figure 11, Age Composition of Selected 401(k) Plan Account Balance Categories ................................................. 16
Figure 12, Tenure Composition of Selected 401(k) Plan Account Balance Categories ................................................. 18
Figure 13, 401(k) Plan Account Balances Increase With Participant Age and Tenure ................................................. 18
Figure 14, 401(k) Plan Account Balances Less Than $10,000, by Participant Age and Tenure .................................... 19
Figure 15, 401(k) Plan Account Balances Greater Than $100,000, by Participant Age and Tenure .......................... 19
Figure 16, Median 401(k) Plan Account Balance Among Longer-Tenured Participants, by Age and Salary, 2015 .......... 20
Figure 17, Ratio of 401(k) Plan Account Balance to Salary, by Participant Age and Tenure ..................................... 20
Figure 18, Ratio of 401(k) Plan Account Balance to Salary for Participants in Their 20s, by Tenure....................... 22
Figure 19, Ratio of 401(k) Plan Account Balance to Salary for Participants in Their 60s, by Tenure....................... 22
Figure 20, 401(k) Plan Assets Are Concentrated in Equities ..................................................................................... 23

ebri.org Issue Brief • August 3, 2017 • No. 436 5
Figure 21, Average Asset Allocation of 401(k) Plan Accounts, by Participant Age ...................................................... 24
Figure 22, Distribution of 401(k) Plans, Participants, and Assets, by Investment Options, 2015 ................................. 24
Figure 23, Average Asset Allocation of 401(k) Plan Accounts, by Participant Age and Investment Options .................. 25
Figure 24, Average Asset Allocation of 401(k) Plan Accounts, by Participant Salary and Investment Options ............... 26
Figure 25, Average Asset Allocation of 401(k) Plan Accounts, by Plan Size and Investment Options ........................... 27
Figure 26, Asset Allocation Distribution of 401(k) Participant Account Balance to Equity Funds, by Participant Age ...... 27
Figure 27, Asset Allocation Distribution of 401(k) Participant Account Balance to Equity Funds, by Participant Age,
Tenure, or Salary .................................................................................................................................... 29
Figure 28, Percentage of 401(k) Plan Participants Without Equity Fund Balances Who Have Equity Exposure, by
Participant Age or Tenure, 2015 ............................................................................................................... 29
Figure 29, Average Asset Allocation for 401(k) Plan Participants Without Equity Fund Balances, by Participant Age or
Tenure ................................................................................................................................................... 30
Figure 30, Asset Allocation to Equities Varied Widely Among 401(k) Plan Participants ............................................... 32
Figure 31, Exposure to Equities Increased Among 401(k) Participants Between 2007 and 2015 ................................. 32
Figure 32, Asset Allocation Distribution of 401(k) Participant Account Balance to Balanced Funds, by Age .................. 33
Figure 33, Asset Allocation Distribution of 401(k) Participant Account Balance to Balanced Funds, by Tenure ............. 34
Figure 34, Asset Allocation Distribution of 401(k) Participant Account Balance to Company Stock in 401(k) Plans With
Company Stock, by Participant Age .......................................................................................................... 35
Figure 35, Many Recently Hired 401(k) Plan Participants Hold Balanced Funds ......................................................... 35
Figure 36, Many Recently Hired 401(k) Plan Participants Hold Target-Date Balanced Funds ...................................... 37
Figure 37, Many Recently Hired 401(k) Participants Hold High Concentrations in Balanced Funds .............................. 38
Figure 38, Many Recently Hired 401(k) Participants Hold High Concentrations in Target-Date Funds .......................... 40
Figure 39, Asset Allocation Distribution of 401(k) Plan Account Balance to Balanced Funds Among Recently Hired
Participants, by Participant Age ................................................................................................................ 41
Figure 40, Average Asset Allocation of 401(k) Plan Accounts, by Participant Age Among Recently Hired 401(k) Plan
Participants With Two or Fewer Years of Tenure ....................................................................................... 42
Figure 41, Recently Hired 401(k) Participants Tend to Be Less Likely to Hold Company Stock ...................................... 42
Figure 42, New 401(k) Participants Tend Not to Hold High Concentrations in Company Stock ................................ 43
Figure 43, Asset Allocation Distribution of Recently Hired 401(k) Participant Account Balance to Company Stock in
401(k) Plans With Company Stock, by Participant Age ............................................................................... 43
Figure 44, Percentage of 401(k) Plans Offering Loans, by Plan Size, 2015 ............................................................ 44
Figure 45, Percentage of Eligible 401(k) Plan Participants With 401(k) Plan Loans, by Plan Size, 2015 ................... 44

ebri.org Issue Brief • August 3, 2017 • No. 436 6
Figure 46, 401(k) Loan Balances as a Percentage of 401(k) Plan Account Balances for Participants With 401(k)
Loans, by Plan Size, 2015 ........................................................................................................................ 45
Figure 47, Few 401(k) Participants Had Outstanding 401(k) Loans; Loans Tended to Be Small, Selected Years ....... 45
Figure 48, 401(k) Loan Activity Varied Across 401(k) Plan Participants ..................................................................... 46
Figure 49, 401(k) Loan Balances .............................................................................................................................. 47
Figure 50, 401(k) Loan Amounts Varied Across 401(k) Participants ......................................................................... 48
Figure 51, Loans From 401(k) Plans Tended to Be Small ........................................................................................ 47

ebri.org Issue Brief • August 3, 2017 • No. 436 7
401(k) Plan Asset Allocation, Account Balances, and Loan
Activity in 2015
By Jack VanDerhei, EBRI; Sarah Holden, ICI; Luis Alonso, EBRI; and Steven Bass, ICI
Introduction
Over the past three decades, 401(k) plans have become the most widespread private-sector employer-sponsored
retirement plan in the United States.1 In 2015, an estimated 54 million American workers were active 401(k) plan
participants.2 By year-end 2015, 401(k) plan assets had grown to $4.4 trillion, representing 19 percent of all retirement
assets.3
In an ongoing collaborative effort, the Employee Benefit Research Institute (EBRI)4 and the Investment Company
Institute (ICI)5 collect annual data on millions of 401(k) plan participants as a means to examine how these participants
manage their 401(k) plan accounts. This report is an update of EBRI’s and ICI’s ongoing research into 401(k) plan
participants’ activity through year-end 2015.6 The report is divided into four sections: the first describes the EBRI/ICI
401(k) database; the second presents a snapshot of participant account balances at year-end 2015; the third looks at
participants’ asset allocations, including analysis of 401(k) participants’ use of target-date, or lifecycle, funds; and the
fourth focuses on participants’ 401(k) loan activity.
EBRI/ICI 401(k) Database
Sources and Types of Data
Several recordkeeping organizations provided records on active participants in 401(k) plans at year-end 2015. These
plan recordkeepers include mutual fund companies, banks, insurance companies, and consulting firms. Although the
EBRI/ICI project has collected data from 1996 through 2015, the universe of data providers may vary from year to
year. In addition, the plans with any given provider may change from year to year, which changes the plans provided.
Thus, aggregate figures in this report generally should not be used to estimate time trends.
Records were encrypted before inclusion in the database to conceal the identity of employers and employees, but were
coded so that both could be tracked by researchers over multiple years.7 Data provided for each participant included
date of birth, from which an age group is assigned; date of hire, from which a tenure range is assigned; outstanding
loan balance; funds in the participant’s investment portfolios; and asset values attributed to those funds. An account
balance for each participant is the sum of the participant’s assets in all funds.8 Plan balances are constructed as the
sum of all participant balances in the plan. Plan size is estimated as the sum of active participants in the plan and, as
such, does not necessarily represent the total number of employees at the sponsoring firm.
Within the year-end 2015 EBRI/ICI database, it is possible to link individuals across plans across a majority of the
recordkeepers. This improves the identification of active participants and resulted in the reclassification of 1.1 million
participant accounts that were multiple accounts owned by single individuals. This procedure allows EBRI and ICI to
begin to consolidate account balances for individuals across data providers to provide a more accurate estimate of
average account balances per individual.9
Investment Options
Investment options are grouped into eight broad categories.10
Equity funds consist of pooled investments primarily invested in stocks, including equity mutual funds, bank
collective trusts, life insurance separate accounts, and other pooled investments.
Bond funds are any pooled account primarily invested in bonds.

ebri.org Issue Brief • August 3, 2017 • No. 436 8
Balanced funds are pooled accounts invested in both stocks and bonds. They are classified into two
subcategories: target-date funds and non–target-date balanced funds.
A target-date fund pursues a long-term investment strategy, using a mix of asset classes, or asset allocation,
that the fund provider adjusts to become less focused on growth and more focused on income over time.11
Non–target-date balanced funds include asset allocation, or hybrid, funds in addition to lifestyle funds.12
Company stock is equity in the plan’s sponsor (the employer).
Money funds consist of those funds designed to maintain a stable share price.
Stable-value products, such as guaranteed investment contracts (GICs)13 and other stable-value
funds,14 are reported as one category.
Other is the residual for other investments, such as real estate funds.
Unknown, which is the final category, consists of assets that could not be identified.15
About the EBRI/ICI Database
The EBRI/ICI Participant-Directed Retirement Plan Data Collection Project is the largest, most representative repository
of information about individual 401(k) plan participant accounts. As of December 31, 2015, the EBRI/ICI database
included statistical information about:
• 26.1 million 401(k) plan participants, in
• 101,625 employer-sponsored 401(k) plans, holding
• $1.9 trillion in assets.
The 2015 EBRI/ICI database covers 48 percent of the universe of 401(k) plan participants, 18 percent of plans, and
43 percent of 401(k) plan assets. The EBRI/ICI project is unique because it includes data provided by a wide variety of
plan recordkeepers and, therefore, represents the activity of participants in 401(k) plans of varying sizes—from very
large corporations to small businesses—with a variety of investment options.
Distribution of Plans, Participants, and Assets by Plan Size
The 2015 EBRI/ICI 401(k) database contains information on 101,625 401(k) plans with $1.9 trillion in assets and
26.1 million participants (Figure 1). As in the 401(k) universe at large, most of the plans in the database are small:
59 percent of the plans have 25 or fewer participants, and 24 percent have 26 to 100 participants (Figure 2). In
contrast, only 2 percent of the plans have more than 2,500 participants.
However, participants and assets are concentrated in large plans. For example, 66 percent of participants are in plans
with more than 2,500 participants, and these same plans account for 68 percent of all plan assets.
Because most of the plans have a small number of participants, the asset size for many plans is modest. One-quarter of
the plans have assets of $250,000 or less, and another 29 percent have plan assets between $250,001 and $1,250,000
(Figure 3).

Number of Plan Participants Total Plans Total Participants Total Assets* Average Account Balance1–10 37,299 183,472 $15,199,012,058 $82,84111–25 22,661 379,336 $29,231,758,328 $77,06026–50 14,176 510,903 $37,160,101,117 $72,73451–100 9,918 704,912 $48,369,878,150 $68,618101–250 7,863 1,241,634 $80,931,056,172 $65,181251–500 3,691 1,297,953 $81,319,803,031 $62,652501–1000 2,458 1,724,490 $113,626,446,289 $65,8901,001–2,500 1,906 2,969,211 $211,861,220,666 $71,3532,501–5,000 818 2,883,401 $211,488,103,027 $73,3475,001–10,000 457 3,149,425 $239,898,519,944 $76,172> 10,000 378 11,091,709 $848,198,372,615 $76,471
All 101,625 26,136,446 $1,917,284,271,397 $73,357Source: Tabulations from EBRI/ICI Participant-Directed Retirement Plan Data Collection Project.Note: The median account balance at year-end 2015 was $16,732.
Total Plan Assets Total Plans Total Participants Total Assets* Average Account Balance$0-$250 25,421 165,084 $2,281,392,080 $13,820$250-$625 15,208 215,627 $6,404,566,546 $29,702$625-$1,250 14,719 326,062 $13,376,319,694 $41,024$1,250-$2,500 14,572 537,251 $26,038,716,458 $48,467$2,500-$6,250 14,360 1,064,449 $56,569,883,213 $53,145$6,250-$12,500 6,661 1,134,792 $58,420,112,123 $51,481$12,500-$25,000 4,006 1,339,327 $70,309,390,837 $52,496$25,000-$62,500 3,205 2,302,859 $124,609,075,745 $54,111$62,500-$125,000 1,391 2,114,232 $122,791,809,419 $58,079$125,000-$250,000 923 2,503,912 $161,576,476,861 $64,530>$250,000 1,159 14,432,851 $1,274,906,528,419 $88,334All 101,625 26,136,446 1,917,284,271,397 $73,357Source: Tabulations from EBRI/ICI Participant-Directed Retirement Plan Data Collection Project.Note: The median account balance at year-end 2015 was $16,732.* Assets do not add to the total because of rounding.
Figure 3401(k) Plan Characteristics, by Plan Assets, 2015
Figure 1401(k) Plan Characteristics, by Number of Plan Participants, 2015
* Assets do not add to the total because of rounding.
0.4%
42.4% 44.2%
1.3%
23.1%23.5%
15.7%
27.7% 25.4%
23.7%
4.7% 4.5%
59.0%
2.2% 2.3%
Plans Participants Assets
1–2526–100101–2,5002,501–10,000>10,000
Number of Plan Participants
Figure 2Distribution of 401(k) Plans, Participants, and Assets
Percentage of plans, participants, and assets by number of plan participants, 2015
Source: Tabulations from EBRI/ICI Participant-Directed Retirement Plan Data Collection Project.
ebri.org Issue Brief • August 3, 2017 • No. 436 9
ebri.org Issue Brief • August 3, 2017 • No. 436 10
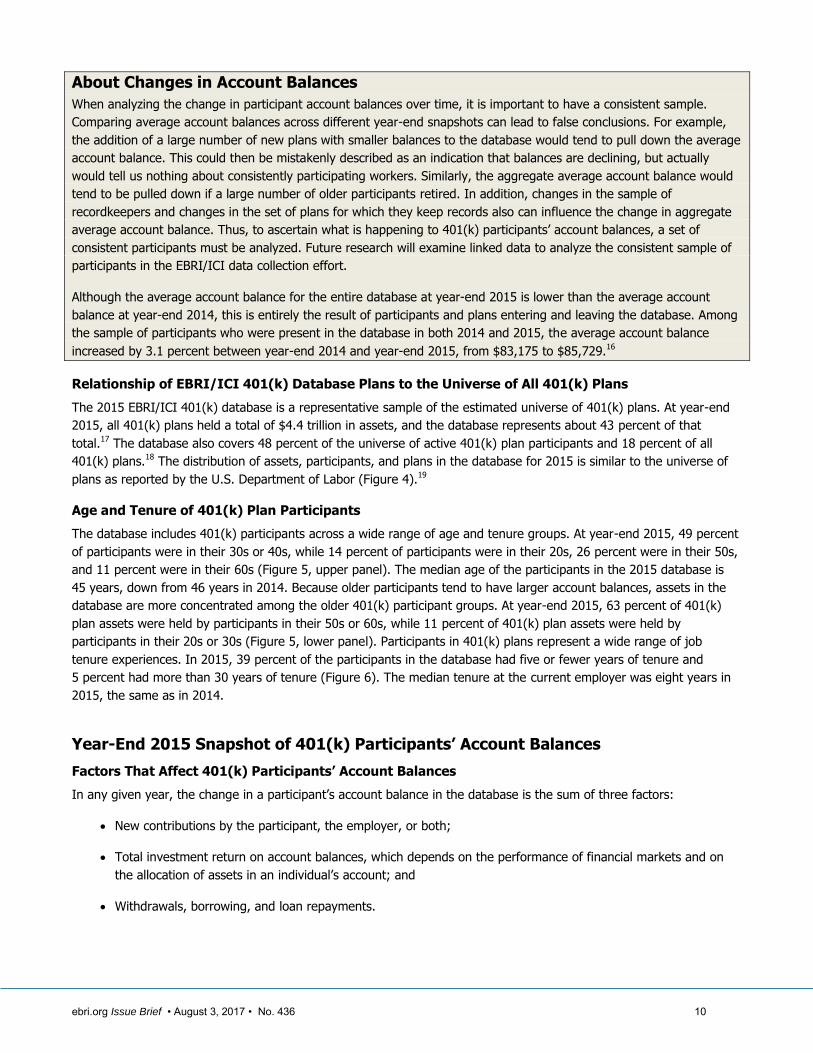
About Changes in Account Balances
When analyzing the change in participant account balances over time, it is important to have a consistent sample.
Comparing average account balances across different year-end snapshots can lead to false conclusions. For example,
the addition of a large number of new plans with smaller balances to the database would tend to pull down the average
account balance. This could then be mistakenly described as an indication that balances are declining, but actually
would tell us nothing about consistently participating workers. Similarly, the aggregate average account balance would
tend to be pulled down if a large number of older participants retired. In addition, changes in the sample of
recordkeepers and changes in the set of plans for which they keep records also can influence the change in aggregate
average account balance. Thus, to ascertain what is happening to 401(k) participants’ account balances, a set of
consistent participants must be analyzed. Future research will examine linked data to analyze the consistent sample of
participants in the EBRI/ICI data collection effort.
Although the average account balance for the entire database at year-end 2015 is lower than the average account
balance at year-end 2014, this is entirely the result of participants and plans entering and leaving the database. Among
the sample of participants who were present in the database in both 2014 and 2015, the average account balance
increased by 3.1 percent between year-end 2014 and year-end 2015, from $83,175 to $85,729.16
Relationship of EBRI/ICI 401(k) Database Plans to the Universe of All 401(k) Plans
The 2015 EBRI/ICI 401(k) database is a representative sample of the estimated universe of 401(k) plans. At year-end
2015, all 401(k) plans held a total of $4.4 trillion in assets, and the database represents about 43 percent of that
total.17 The database also covers 48 percent of the universe of active 401(k) plan participants and 18 percent of all
401(k) plans.18 The distribution of assets, participants, and plans in the database for 2015 is similar to the universe of
plans as reported by the U.S. Department of Labor (Figure 4).19
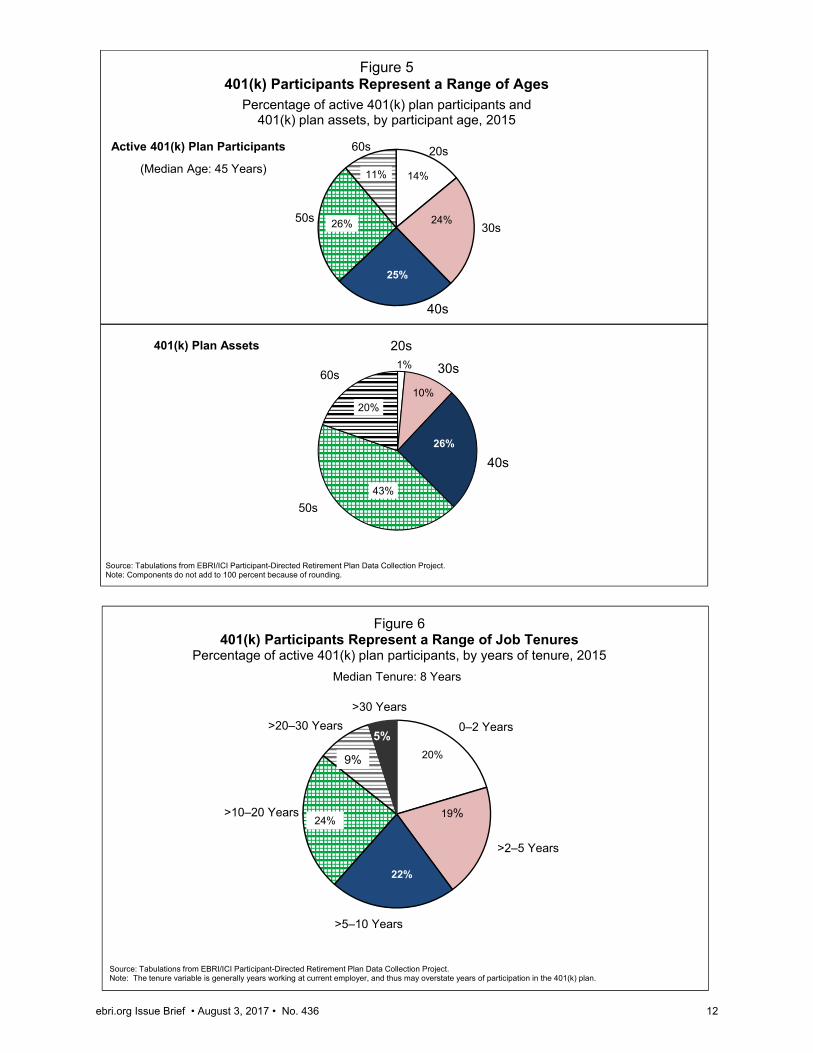
Age and Tenure of 401(k) Plan Participants
The database includes 401(k) participants across a wide range of age and tenure groups. At year-end 2015, 49 percent
of participants were in their 30s or 40s, while 14 percent of participants were in their 20s, 26 percent were in their 50s,
and 11 percent were in their 60s (Figure 5, upper panel). The median age of the participants in the 2015 database is
45 years, down from 46 years in 2014. Because older participants tend to have larger account balances, assets in the
database are more concentrated among the older 401(k) participant groups. At year-end 2015, 63 percent of 401(k)
plan assets were held by participants in their 50s or 60s, while 11 percent of 401(k) plan assets were held by
participants in their 20s or 30s (Figure 5, lower panel). Participants in 401(k) plans represent a wide range of job
tenure experiences. In 2015, 39 percent of the participants in the database had five or fewer years of tenure and
5 percent had more than 30 years of tenure (Figure 6). The median tenure at the current employer was eight years in
2015, the same as in 2014.
Year-End 2015 Snapshot of 401(k) Participants’ Account Balances
Factors That Affect 401(k) Participants’ Account Balances
In any given year, the change in a participant’s account balance in the database is the sum of three factors:
New contributions by the participant, the employer, or both;
Total investment return on account balances, which depends on the performance of financial markets and on
the allocation of assets in an individual’s account; and
Withdrawals, borrowing, and loan repayments.

0.1915319 19.153190.1548561 15.4856050.0773281 7.73280610.2011285 20.1128490.3751555 37.51555
Sources: Tabulations from EBRI/ICI Participant-Directed Retirement Plan Data Collection Project and U.S. Department of Labor
Figure 4EBRI/ICI 401(k) Database Represents
a Wide Cross Section of the 401(k) Universe
401(k) plan characteristics by number of participants: EBRI/ICI 401(k) database in 2015 versus 2014 DOL Form 5500 for all 401(k) plans
0
20
40
60
80
100
100 or fewer 101 to 500 501 to 1,000 1,001 to 5,000 >5,000Number of plan participants
Plan AssetsPercentage of plan assets
2014 Form 5500
2015 EBRI/ICI
0
20
40
60
80
100
100 or fewer 101 to 500 501 to 1,000 1,001 to 5,000 >5,000Number of plan participants
ParticipantsPercentage of participants
2015 EBRI/ICI
2014 Form 5500
0
20
40
60
80
100
100 or fewer 101 to 500 501 to 1,000 1,001 to 5,000 >5,000Number of plan participants
PlansPercentage of plans
2015 EBRI/ICI
2014 Form 5500
ebri.org Issue Brief • August 3, 2017 • No. 436 11
20s
30s50s
60s
11%
26%
25%
24%
14%(Median Age: 45 Years)
Active 401(k) Plan Participants
40s
Figure 5401(k) Participants Represent a Range of Ages
Percentage of active 401(k) plan participants and 401(k) plan assets, by participant age, 2015
1%
10%
26%
43%
20%
60s
50s
20s
40s
401(k) Plan Assets
Source: Tabulations from EBRI/ICI Participant-Directed Retirement Plan Data Collection Project.Note: Components do not add to 100 percent because of rounding.
30s
0–2 Years
>2–5 Years
>5–10 Years
>10–20 Years
>20–30 Years
>30 Years
Source: Tabulations from EBRI/ICI Participant-Directed Retirement Plan Data Collection Project.Note: The tenure variable is generally years working at current employer, and thus may overstate years of participation in the 401(k) plan.
20%
19%
22%
9%
5%
24%
Figure 6401(k) Participants Represent a Range of Job Tenures
Percentage of active 401(k) plan participants, by years of tenure, 2015
Median Tenure: 8 Years
ebri.org Issue Brief • August 3, 2017 • No. 436 12

ebri.org Issue Brief • August 3, 2017 • No. 436 13
The change in any individual participant’s account balance in the database is influenced by the magnitude of these
three factors relative to the starting account balance.20 For example, a contribution of a given dollar amount produces a
larger growth rate when added to a smaller account. On the other hand, investment returns of a given percentage
produce larger dollar increases (or decreases) when compounded on a larger asset base.
Asset allocation also influences investment returns and changes in assets. For example, stocks (as measured by the
S&P 500 total return index) increased 1.4 percent during 2015, while bonds (as measured by the Barclays Capital U.S.
Aggregate Bond Index) increased 0.5 percent (Figures 7 and 8).
Definition of 401(k) Plan Account Balance
As a cross section, or snapshot, of the entire population of 401(k) plan participants, the database includes 401(k)
participants who are young and those who are new to their jobs, as well as older participants and those who have been
with their current employers for many years. These annual updates of the database provide snapshots of 401(k) plan
account balances, asset allocation, and loan activity across wide cross sections of participants.
However, the cross-sectional analysis is not well suited to addressing the question of the impact of participation in
401(k) plans over time. Cross sections change in composition over time because the selection of data providers and
sample of plans using a given provider vary from year to year and because 401(k) participants join or leave plans.21 In
addition, the database contains only the account balances held in the 401(k) plans at participants’ current employers.
Retirement savings held in plans at previous employers or rolled over into individual retirement accounts (IRAs) are not
included in the analysis.22 Furthermore, account balances are net of unpaid loan balances. Because of all these factors,
it is not correct to presume that the change in the average or median account balance for the database as a whole
reflects the experience of “typical” 401(k) plan participants.
Size of 401(k) Plan Account Balances
At year-end 2015, the average account balance was $73,357 and the median account balance was $16,732 (Figure 9),
but balances varied widely. For example, about three-quarters of the participants in the 2015 EBRI/ICI 401(k) database
had account balances that were lower than $73,357, the size of the average account balance. In fact, 41.3 percent of
participants had account balances of less than $10,000, while 19.3 percent of participants had account balances greater
than $100,000 (Figure 10). The variation in account balances partly reflects the effects of participant age, tenure,
salary, contribution behavior, rollovers from other plans, asset allocation, withdrawals, loan activity, and employer
contribution rates. This paper examines the relationship between account balances and participants’ age, tenure, and
salary.
Relationship of Age and Tenure to 401(k) Plan Account Balances
Age and account balance are positively correlated among participants covered by the 2015 database.23 Examination of
the age composition of account balances finds that 54 percent of participants with account balances of less than
$10,000 were in their 20s or 30s (Figure 11). Similarly, 61 percent of participants with account balances greater than
$100,000 were in their 50s or 60s. The positive correlation between age and account balance is expected because
younger workers are likely to have lower incomes and to have had less time to accumulate a balance with their current
employer. In addition, they are less likely to have rollovers from a previous employer’s plan in their current plan
accounts.
Account balance and tenure are also positively correlated among participants in the 2015 database. A participant’s
tenure with an employer serves as a proxy for the length of time a worker has participated in the 401(k) plan.24 Indeed,
66 percent of participants with account balances of less than $10,000 had five or fewer years of tenure, while
75 percent of participants with account balances greater than $100,000 had more than 10 years of tenure
(Figure 12).25

Month-end level, a December 2002 to December 2016
ebri.org Issue Brief • August 3, 2017 • No. 436 14

$37,323
$55,502
$39,885
$65,454
$45,519
$60,329 $63,929
$72,383
$76,293 $73,357
$0
$10,000
$20,000
$30,000
$40,000
$50,000
$60,000
$70,000
$80,000
$90,000
1996 1999 2002 2007 2008 2010 2012 2013 2014 2015
Figure 9Snapshot of Year-End 401(k) Plan Account Balances
401(k) plan participant account balances,a selected yearsb
$0
$10,000
$20,000
$30,000
$40,000
$50,000
$60,000
$70,000
1996 1999 2002 2007 2008 2010 2012 2013 2014 2015
Source: Tabulations from EBRI/ICI Participant-Directed Retirement Plan Data Collection Project.a Account balances are participant account balances held in 401(k) plans at the participants' current employers and are net of plan loans. Retirement savings held in plans at previous employers or rolled over into IRAs are not included.b The sample of participants changes over time.
Median(mid-point)
Average
ebri.org Issue Brief • August 3, 2017 • No. 436 15

41.3%
11.9%
7.3%5.1%
3.9% 3.1% 2.5% 2.1% 1.8% 1.6%
9.1% 10.2%
Size of Account Balance
Source: Tabulations from EBRI/ICI Participant-Directed Retirement Plan Data Collection Project.Note: At year-end 2015, the average account balance among all 26.1 million 401(k) particiants was $73,357; the median account balance was $16,732. Account balances are participant account balances held in 401(k) plans at the participants’ current employers and are net of plan loans. Retirement savings held in plans at previous employers or rolled over into IRAs are not included. Components may not add to 100 percent because of rounding.
Figure 10Distribution of 401(k) Plan Account Balances, by Size of Account Balance
Percentage of participants with account balances in specified ranges, 2015
27%
4% <0.5%
27%
26%
10%
21%
29%
29%
17%
29%
43%
8% 12%18%
0%
10%
20%
30%
40%
50%
60%
70%
80%
90%
100%
Size of Account Balance
60s
50s
40s
30s
20s
Source: Tabulations from EBRI/ICI Participant-Directed Retirement Plan Data Collection Project.Note: Account balances are participant account balances held in 401(k) plans at the participants’ current employers and are net of plan loans. Retirement savings held in plans at previous employers or rolled over into IRAs are not included. Percentages may not add to 100 percent because of rounding.
Less Than $10,000 >$40,000–$50,000 More Than $100,000
Age Group
Figure 11Age Composition of Selected 401(k) Plan Account Balance CategoriesPercentage of participants with account balances in specified ranges, 2015
ebri.org Issue Brief • August 3, 2017 • No. 436 16

ebri.org Issue Brief • August 3, 2017 • No. 436 17
Examining the interaction of both age and tenure with account balances reveals that, for a given age group, average
account balances tend to increase with tenure. For example, the average account balance of participants in their 60s
with up to two years of tenure was $37,976, compared with $280,976 for participants in their 60s with more than 30
years of tenure (Figure 13).26 Similarly, the average account balance of participants in their 40s with up to two years of
tenure was $19,088, compared with $158,182 for participants in their 40s with more than 20 years of tenure.
The distribution of account balances underscores the effects of age and tenure on account balances. In a given age
group, shorter tenure tends to mean that a higher percentage of participants will have account balances of less than
$10,000. For example, 88 percent of participants in their 20s with two or fewer years of tenure had account balances of
less than $10,000 in 2015, compared with 55 percent of participants in their 20s with between five and 10 years of
tenure (Figure 14). Older workers display a similar pattern. For example, 59 percent of participants in their 60s with
two or fewer years of tenure had account balances of less than $10,000. In contrast, less than one-sixth of those in
their 60s with more than 20 years of tenure had account balances of less than $10,000.27
In a given age group, longer tenure tends to mean that a higher percentage of participants will have account balances
greater than $100,000. For example, 20 percent of participants in their 60s with five to 10 years of tenure had account
balances in excess of $100,000 in 2015 (Figure 15). However, 46 percent of participants in their 60s with between
20 and 30 years of tenure with their current employer had account balances greater than $100,000. The percentage
increases to 57 percent for participants in their 60s with more than 30 years of tenure.
Relationship Between 401(k) Plan Account Balances and Salary
Participants’ account balances vary not only with age and tenure, but also with salary. Figure 16 reports the account
balances of longer-tenured participants at their current employers’ 401(k) plans. Retirement savings held at previous
employers or amounts rolled over to IRAs are not included in the analysis. To capture as long a savings history as
possible, only longer-tenured participants are included in this analysis. However, it is important to note that the tenure
variable indicates the time that individuals have been with their current employers and may not reflect the length of
time they have participated in a 401(k) plan. One reason that job tenure may not reflect length of participation in the
401(k) plan, particularly among older participants, is that the proposed regulations for 401(k) plans were not introduced
until 1981.28
Older, longer-tenured, and higher-income participants tend to have larger account balances, which are important for
meeting their income-replacement needs in retirement.29 For longer-tenured participants in their 20s with salaries
between $20,000 and $40,000, the median account balance was $6,764 in 2015 (Figure 16). Longer-tenured
participants in their 20s earning more than $80,000 to $100,000 had a median account balance of $50,348, while those
earning more than $100,000 had a median account balance of $40,378. Among longer-tenured participants in their 60s
with $20,000 to $40,000 in salary in 2015, the median account balance was $60,585. For longer-tenured participants in
their 60s earning more than $100,000, the median account balance was $376,091.
The ratio of participant account balance to salary tends to be positively correlated with age and tenure.30 Participants in
their 50s and 60s—having had more time to accumulate assets—tended to have higher ratios, while those in their 20s
had the lowest ratios (Figure 17). In addition, for any given age and tenure combination, the ratio of account balance
to salary varies somewhat with salary. For example, among participants in their 20s, the ratio tends to increase slightly
with salary for low-to-moderate salary groups (Figure 18). However, at high salary levels the ratio tends to decline
somewhat. A similar pattern occurs among participants in their 60s (Figure 19).31
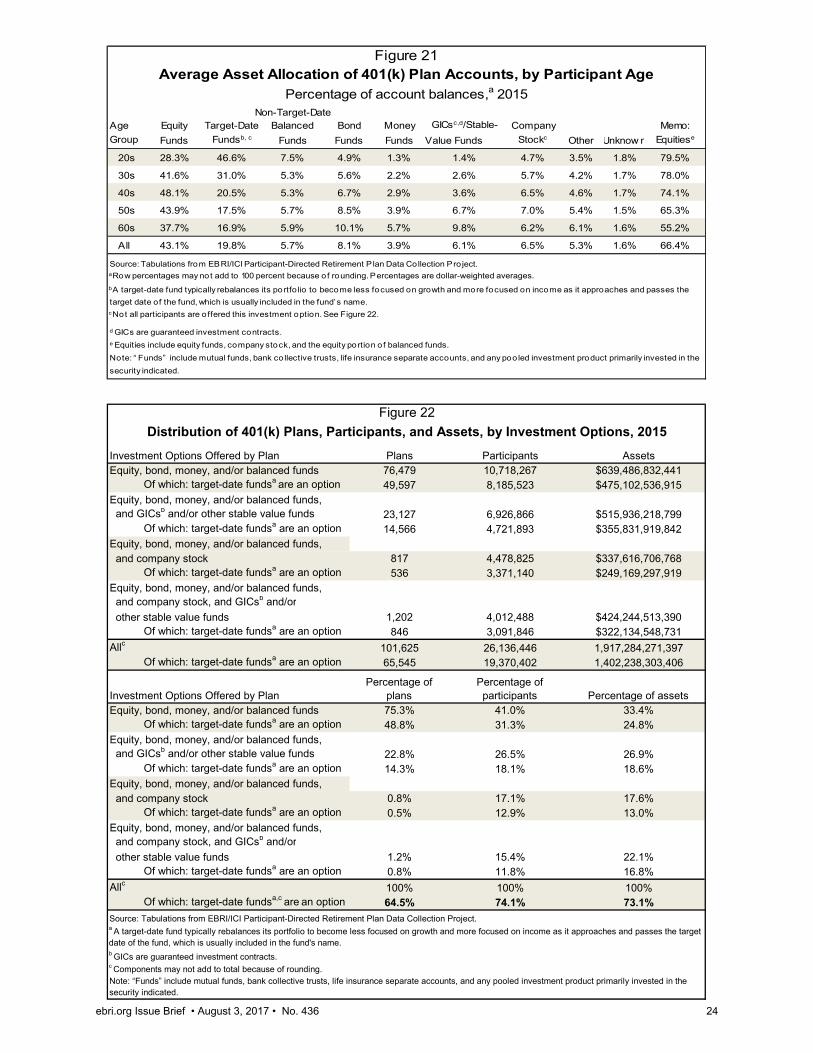
Year-End 2015 Snapshot of 401(k) Participants’ Asset Allocation
At year-end 2015, 43 percent of 401(k) plan participants’ account balances were invested in equity funds, on average,
the same as in 2014, and compared with 44 percent at year-end 2013, 37 percent at year-end 2008, and 48 percent at
year-end 2007 (Figure 20). Altogether, equity securities—equity funds, the equity portion of balanced funds,32 and
company stock—represented 66 percent of 401(k) plan participants’ assets at year-end 2015 (Figure 21).

40%
9% 3%
26%
18%6%
18%
28%
17%
12%
31%
38%
3%10%
23%
1%4%
14%
Less Than $10,000 >$40,000–$50,000 More Than $100,000
Size of Account Balance
Figure 12Tenure Composition of Selected 401(k) Plan Account Balance Categories
Percentage of participants with account balances in specified ranges, 2015
>30 Years
>20–30 Years
>10–20 Years
>5–10 Years
>2–5 Years
0–2 Years
Source: Tabulations from EBRI/ICI Participant-Directed Retirement Plan Data Collection Project.Note: Percentages may not add to 100 percent because of rounding. Account balances are participant account balances held in 401(k) plans at the participants’ current employers and are net of plan loans. Retirement savings held in plans at previous employers or rolled over into IRAs are not included. The tenure variable is generally years working at current employer, and thus may overstate years of participation in the 401(k) plan.
Tenure
ebri.org Issue Brief • August 3, 2017 • No. 436 18

0%
10%
20%
30%
40%
50%
60%
70%
80%
90%
100%
0–2 >2–5 >5–10 >10–20 >20–30 >30
Years of Tenure
20s
30s
60s40s
50s
Source: Tabulations from EBRI/ICI Participant-Directed Retirement Plan Data Collection Project.Note: Account balances are participant account balances held in 401(k) plans at the participants’ current employers and are net of plan loans. Retirement savings held in plans at previous employers or rolled over into IRAs are not included.The tenure variable is generally years working at current employer, and thus may overstate years of participation in the 401(k) plan.
Figure 14401(k) Plan Account Balances Less Than $10,000, by Participant Age and Tenure
Percentage of participants with account balances less than $10,000 at year-end 2015
0%
10%
20%
30%
40%
50%
60%
70%
80%
90%
100%
0–2 >2–5 >5–10 >10–20 >20–30 >30
Years of Tenure
20s
30s
40s
50s
60s
Source: Tabulations from EBRI/ICI Participant-Directed Retirement Plan Data Collection Project.Note: Account balances are participant account balances held in 401(k) plans at the participants’ current employers and are net of plan loans. Retirement savings held in plans at previous employers or rolled over into IRAs are not included. The tenure variable is generally years working at current employer, and thus may overstate years of participation in the 401(k) plan.
Figure 15401(k) Plan Account Balances Greater Than $100,000,
by Participant Age and TenurePercentage of participants with account balances
greater than $100,000 at year-end 2015
ebri.org Issue Brief • August 3, 2017 • No. 436 19

Salary Range 20s 30s 40s 50s 60s
$20,000–$40,000 $6,764 $19,797 $52,783 $78,077 $60,585
>$40,000–$60,000 $15,225 $33,715 $74,541 $109,075 $95,357
>$60,000–$80,000 $29,126 $57,952 $119,778 $174,458 $149,997
>$80,000–$100,000 $50,348 $89,604 $179,981 $255,631 $222,328
>$100,000 $40,378 $141,511 $305,302 $420,852 $376,091Source: Tabulations from EBRI/ICI Participant-Directed Retirement Plan Data Collection Project.
b Longer-tenured participants are used in this analysis to capture the longest possible work and savings history (see note a). The tenure variable tends to be years with the current employer rather than years of participation in the 401(k) plan. One reason that job tenure may not reflect length of participation in the 401(k) plan, particularly among older participants, is that the proposed regulations for 401(k) plans were not introduced until 1981.
Figure 16Median 401(k) Plan Account Balancea Among Longer-Tenuredb
Participants, by Age and Salary, 2015
Participant Age Group
a Account balances are participant account balances held in 401(k) plans at the participants’ current employers and are net of plan loans. Retirement savings held in plans at previous employers or rolled over into IRAs are not included.
0%
50%
100%
150%
200%
250%
300%
0–2 >2–5 >5–10 >10–20 >20–30 >30
Years of Tenure
Figure 17Ratio of 401(k) Plan Account Balance to Salary,
by Participant Age and TenurePercentage, 2015
50s
40s
60s
30s
20s
Source: Tabulations from EBRI/ICI Participant-Directed Retirement Plan Data Collection Project.Note: Account balances are participant account balances held in 401(k) plans at the participants’ current employers and are net of plan loans. Retirement savings held in plans at previous employers or rolled over into IRAs are not included. The tenure variable is generally years working at current employer, and thus may overstate years of participation in the 401(k) plan.
ebri.org Issue Brief • August 3, 2017 • No. 436 20

ebri.org Issue Brief • August 3, 2017 • No. 436 21
Changes in Asset Allocation Between Year-End 2014 and Year-End 2015
Investment performance likely explains a good deal of the fluctuation in 401(k) participants’ asset allocations over time.
Much of the movement in the largest component, equity funds, tends to reflect overall equity market prices, which
generally rose from 2003 through 2007, dropped in 2008, rose from 2009 through 2010, moderated in 2011, rose from
2012 through 2014, and moderated in 2015 (Figures 7, 8, and 20). At year-end 2015, equity funds were 43 percent of
the assets in the EBRI/ICI 401(k) database, the same as in 2014. Balanced funds, which invest in both equities and
fixed-income securities, increased slightly in share, accounting for 26 percent of the assets in the database at year-end
2015. Despite minor shifts, most 401(k) participants appeared not to have made dramatic shifts in their asset
allocations in 2015.33
Asset Allocation and Participant Age
As in previous years, the database for year-end 2015 shows that participants’ asset allocation varied considerably with
age.34 Younger participants tended to favor equity funds and balanced funds, while older participants were more likely
to invest in fixed-income securities such as bond funds, GICs and other stable-value funds, or money funds (Figure 21).
For example, among participants in their 20s, the average allocation to equity and balanced funds was more than
80 percent of assets, compared with about 60 percent of assets among participants in their 60s.
Younger participants had consistently higher allocations to target-date funds. A target-date, or lifecycle, fund pursues a
long-term investment strategy, using a mix of asset classes that follow a predetermined reallocation, typically
rebalancing to shift its focus from growth to income as the fund approaches and passes its target date.35 At year-end
2015, 20 percent of 401(k) assets in the database were invested in target-date funds, up from 18 percent at year-end
2014.36 Among participants in their 20s, 47 percent of their 401(k) assets were invested in target-date funds at year-
end 2015; among participants in their 60s, 17 percent of their 401(k) assets were invested in target-date funds.
Asset Allocation and Investment Options
The investment options that a plan offers can significantly affect how participants allocate their 401(k) assets. Figure 22
presents the distribution of plans, participants, and assets by four combinations of investment offerings.
The first category is the base group, which consists of plans that offer neither company stock nor GICs or other stable-
value funds. Forty-one percent of participants in the 2015 EBRI/ICI 401(k) database were in these plans, which
generally offer equity funds, bond funds, money funds, and balanced funds as investment options.
Another 27 percent of participants were in plans that offer GICs and other stable-value funds as an investment option,
in addition to the base options.
Alternatively, 17 percent of participants were in plans that offer company stock but no stable-value products, while the
remaining 15 percent of participants were in plans that offered both company stock and stable-value products in
addition to the base options.
Target-date funds were available in 65 percent of the 401(k) plans in the year-end 2015 database (Figure 22).37 These
plans offered target-date funds to 74 percent of the participants in the database.38 Among participants who were
offered target-date funds, 67 percent held them at year-end 2015. Target-date fund assets represented 27 percent of
the assets of plans offering such funds in their investment lineups.
Asset Allocation by Investment Options and Age, Salary, and Plan Size
Asset allocation also varies with participant age; Figure 23 demonstrates this with an analysis of asset allocation by
investment options and also by participant age. Because asset allocation is influenced by the investment options
available to participants, Figure 24 presents asset allocation by salary range and by investment options. Salary
information is available for a subset of participants in the 2015 EBRI/ICI 401(k) database.

0%
10%
20%
30%
40%
50%
60%
70%
Salary Range
Source: Tabulations from EBRI/ICI Participant-Directed Retirement Plan Data Collection Project.Note: Account balances are participant account balances held in 401(k) plans at the participants’ current employers and are net of plan loans. Retirement savings held in plans at previous employers or rolled over into IRAs are not included. The tenure variable is generally years working at current employer, and thus may overstate years of participation in the 401(k) plan.
0–2 Years
>2–5 Years
>5–10 Years
Figure 18Ratio of 401(k) Plan Account Balance to Salary for Participants in Their 20s, by Tenure
Percentage, 2015
0%
50%
100%
150%
200%
250%
300%
350%
400%
Salary Range
Source: Tabulations from EBRI/ICI Participant-Directed Retirement Plan Data Collection Project.Note: Account balances are participant account balances held in 401(k) plans at the participants’ current employers and are net of plan loans. Retirement savings held in plans at previous employers or rolled over into IRAs are not included. The tenure variable is generally years working at current employer, and thus may overstate years of participation in the 401(k) plan.
0–2 Years
>2–5 Years
>5–10 Years
>10–20 Years>20 Years
Figure 19Ratio of 401(k) Plan Account Balance to Salary for Participants in Their 60s, by Tenure
Percentage, 2015
ebri.org Issue Brief • August 3, 2017 • No. 436 22

ebri.org Issue Brief • August 3, 2017 • No. 436 23
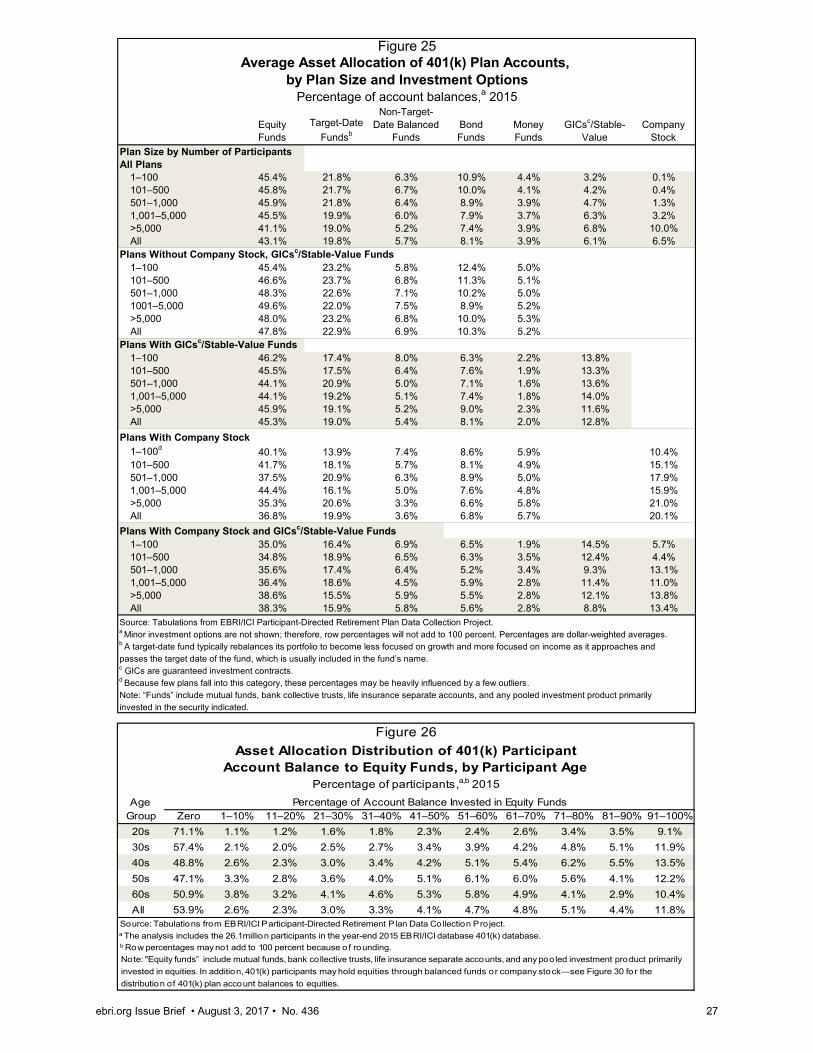
Participant asset allocation also varies with plan size (Figure 25, top panel), but much of the variation can be explained
by differences in the investment options offered by plan sponsors. For example, the percentage of plan assets invested
in company stock rises with plan size, in part, because few small plans offered company stock as an investment option.
For example, 1 percent of participants in small plans (100 participants or fewer) were offered company stock as an
investment option, while 51 percent of participants in plans with more than 5,000 participants were offered company
stock as an investment option in 2015. Thus, to analyze the potential effect of plan size, the remaining panels of Figure
25 group plans by investment options and plan size.
Distribution of Equity Fund Allocations and Participant Exposure to Equities
Participants in 401(k) plans may hold equities through a variety of options including equity funds, company stock, and
balanced funds. This section focuses first on the investing pattern of 401(k) plan participants with respect to equity
funds. The asset allocation of participants without equity funds is explored next, because 401(k) participants holding no
equity funds may hold equities in the form of company stock or through balanced funds. Finally, the overall investment
in equities across all 401(k) plan participants is presented.
Asset Allocation to Equity Funds
The year-end 2015 EBRI/ICI 401(k) database shows that, on average, 43 percent of participant account balances were
allocated to equity funds (Figure 21), which is one way to hold equities. However, individual asset allocations varied
widely across participants. For example, 54 percent of participants held no equity funds, while about 16 percent of
participants held more than 80 percent of their balances in equity funds (Figures 26 and 27).
Furthermore, the percentage of participants holding no equity funds varied with age, with 71 percent of participants in
their 20s, 49 percent of participants in their 40s, and 51 percent of participants in their 60s holding no equity funds.
The percentage of 401(k) participants holding no equity funds also varied with tenure—participants with five or fewer
years of tenure were more likely not to be invested in equity funds (Figure 27). The percentage of participants holding
no equity funds tends to fall as salary increases.
Investment Options Offered by Plan Plans Participants AssetsEquity, bond, money, and/or balanced funds 76,479 10,718,267 $639,486,832,441
Of which: target-date fundsa are an option 49,597 8,185,523 $475,102,536,915Equity, bond, money, and/or balanced funds, and GICsb and/or other stable value funds 23,127 6,926,866 $515,936,218,799
Of which: target-date fundsa are an option 14,566 4,721,893 $355,831,919,842Equity, bond, money, and/or balanced funds, and company stock 817 4,478,825 $337,616,706,768
Of which: target-date fundsa are an option 536 3,371,140 $249,169,297,919Equity, bond, money, and/or balanced funds, and company stock, and GICsb and/or
other stable value funds 1,202 4,012,488 $424,244,513,390 Of which: target-date fundsa are an option 846 3,091,846 $322,134,548,731
Allc 101,625 26,136,446 1,917,284,271,397 Of which: target-date fundsa are an option 65,545 19,370,402 1,402,238,303,406
Investment Options Offered by PlanEquity, bond, money, and/or balanced funds 75.3% 41.0% 33.4%
Of which: target-date fundsa are an option 48.8% 31.3% 24.8%Equity, bond, money, and/or balanced funds, and GICsb and/or other stable value funds 22.8% 26.5% 26.9%
Of which: target-date fundsa are an option 14.3% 18.1% 18.6%Equity, bond, money, and/or balanced funds, and company stock 0.8% 17.1% 17.6%
Of which: target-date fundsa are an option 0.5% 12.9% 13.0%Equity, bond, money, and/or balanced funds, and company stock, and GICsb and/or
other stable value funds 1.2% 15.4% 22.1% Of which: target-date fundsa are an option 0.8% 11.8% 16.8%
Allc 100% 100% 100% Of which: target-date fundsa,c are an option 64.5% 74.1% 73.1%
Source: Tabulations from EBRI/ICI Participant-Directed Retirement Plan Data Collection Project.
b GICs are guaranteed investment contracts.c Components may not add to total because of rounding.Note: “Funds” include mutual funds, bank collective trusts, life insurance separate accounts, and any pooled investment product primarily invested in the security indicated.
Figure 22
Distribution of 401(k) Plans, Participants, and Assets, by Investment Options, 2015
Percentage of plans
Percentage of participants Percentage of assets
a A target-date fund typically rebalances its portfolio to become less focused on growth and more focused on income as it approaches and passes the target date of the fund, which is usually included in the fund's name.
Non-Target-DateAge Equity Target-Date Balanced Bond M oney GICsc,d/Stable- Com pany Memo:
Group Funds Fundsb, c Funds Funds Funds Value Funds Stockc Other Unknow n Equitiese
20s 28.3% 46.6% 7.5% 4.9% 1.3% 1.4% 4.7% 3.5% 1.8% 79.5%
30s 41.6% 31.0% 5.3% 5.6% 2.2% 2.6% 5.7% 4.2% 1.7% 78.0%
40s 48.1% 20.5% 5.3% 6.7% 2.9% 3.6% 6.5% 4.6% 1.7% 74.1%
50s 43.9% 17.5% 5.7% 8.5% 3.9% 6.7% 7.0% 5.4% 1.5% 65.3%
60s 37.7% 16.9% 5.9% 10.1% 5.7% 9.8% 6.2% 6.1% 1.6% 55.2%
All 43.1% 19.8% 5.7% 8.1% 3.9% 6.1% 6.5% 5.3% 1.6% 66.4%
Figure 21Average Asset Allocation of 401(k) Plan Accounts, by Participant Age
Percentage of account balances,a 2015
Source: Tabulations from EBRI/ICI Participant-Directed Retirement P lan Data Collection Pro ject.a Row percentages may not add to 1 00 percent because o f rounding. Percentages are dollar-weighted averages.
b A target-date fund typically rebalances its portfo lio to become less focused on growth and more focused on income as it approaches and passes the
target date of the fund, which is usually included in the fund’s name. c Not all participants are o ffered this investment option. See Figure 22.
d GICs are guaranteed investment contracts. e Equities include equity funds, company stock, and the equity portion o f balanced funds.
Note: “ Funds” include mutual funds, bank co llective trusts, life insurance separate accounts, and any poo led investment product primarily invested in the
security indicated.
ebri.org Issue Brief • August 3, 2017 • No. 436 24

Equ
ityTa
rget
-Dat
eN
on-T
arge
t-Dat
eB
ond
Mon
eyG
ICsc
/Sta
ble-
Com
pany
Fund
sFu
ndsb
Bal
ance
d Fu
nds
Fund
sFu
nds
Val
ue F
unds
Sto
ckIn
vest
men
t O
pti
on
s, A
ll A
ges
Equ
ity, b
ond,
mon
ey, a
nd/o
rba
lanc
ed fu
nds
47.8
%22
.9%
6.9%
10.3
%5.
2%E
quity
, bon
d, m
oney
, and
/or
bala
nced
fund
s; a
nd G
ICsc a
nd/o
r ot
her s
tabl
e-va
lue
fund
s45
.3%
19.0
%5.
4%8.
1%2.
0%12
.8%
Equ
ity, b
ond,
mon
ey, a
nd/o
r ba
lanc
ed fu
nds;
and
com
pany
sto
ck36
.8%
19.9
%3.
6%6.
8%5.
7%20
.1%
Equ
ity, b
ond,
mon
ey, a
nd/o
rba
lanc
ed fu
nds,
com
pany
sto
ck; a
nd
GIC
sc and
/or o
ther
sta
ble-
valu
e fu
nds
38.3
%15
.9%
5.8%
5.6%
2.8%
8.8%
13.4
%P
lan
s W
ith
ou
t C
om
pan
y S
tock
, an
d G
ICs,
c an
d/o
r O
ther
Sta
ble
-Val
ue
Fu
nd
s A
ge G
roup
20s
29.0
%50
.4%
8.4%
4.9%
1.8%
30s
43.8
%34
.7%
6.6%
6.5%
2.8%
40s
52.2
%23
.4%
6.4%
8.0%
3.7%
50s
49.7
%20
.9%
6.7%
10.9
%5.
1%60
s43
.6%
19.9
%7.
3%13
.9%
7.7%
Pla
ns
Wit
h G
ICs
c an
d/o
r O
ther
Sta
ble
-Val
ue
Fu
nd
s20
s32
.6%
40.6
%9.
0%6.
2%0.
9%3.
5%30
s45
.0%
28.1
%5.
3%6.
7%1.
4%5.
8%40
s51
.0%
19.4
%4.
9%7.
4%1.
9%7.
9%50
s46
.3%
17.4
%5.
3%8.
4%2.
1%13
.3%
60s
38.1
%16
.5%
5.9%
9.2%
2.5%
20.2
%P
lan
s W
ith
Co
mp
any
Sto
ck20
s21
.4%
48.4
%5.
0%4.
5%1.
4%16
.2%
30s
35.4
%31
.4%
3.1%
4.4%
2.9%
18.3
%40
s41
.3%
20.3
%3.
1%5.
7%4.
1%20
.0%
50s
37.2
%17
.2%
3.9%
7.5%
5.9%
20.6
%60
s32
.1%
16.7
%3.
8%8.
7%9.
2%20
.4%
Pla
ns
Wit
h C
om
pan
y S
tock
an
d G
ICs,
c an
d/o
r O
ther
Sta
ble
-Val
ue
Fu
nd
s20
s27
.9%
46.3
%6.
1%3.
3%0.
8%2.
7%8.
7%30
s39
.3%
28.2
%5.
4%4.
0%1.
6%5.
1%11
.2%
40s
44.1
%17
.5%
5.9%
4.8%
2.1%
7.2%
12.9
%50
s38
.4%
13.3
%5.
9%6.
1%2.
8%13
.1%
13.9
%60
s31
.8%
12.9
%5.
4%6.
4%4.
3%18
.6%
13.8
%S
ourc
e: T
abul
atio
ns fr
om E
BR
I/IC
I Par
ticip
ant-D
irect
ed R
etire
men
t Pla
n D
ata
Col
lect
ion
Pro
ject
.a M
inor
inve
stm
ent o
ptio
ns a
re n
ot s
how
n; th
eref
ore,
row
per
cent
ages
will
not
add
to 1
00 p
erce
nt. P
erce
ntag
es a
re d
olla
r-w
eigh
ted
aver
ages
.
usua
lly in
clud
ed in
the
fund
’s n
ame.
c G
ICs
are
guar
ante
ed in
vest
men
t con
tract
s.
Figu
re 2
3A
vera
ge
Ass
et A
lloca
tio
n o
f 40
1(k)
Pla
n A
cco
un
ts, b
y P
arti
cip
ant
Ag
e an
d In
vest
men
t O
pti
on
sP
erce
ntag
e of
acc
ount
bal
ance
s,a 2
015
Not
e: "F
unds
" inc
lude
mut
ual f
unds
, ban
k co
llect
ive
trust
s, li
fe in
sura
nce
sepa
rate
acc
ount
s, a
nd a
ny p
oole
d in
vest
men
t pro
duct
prim
arily
inve
sted
in th
e se
curit
y in
dica
ted.
b A
targ
et-d
ate
fund
typi
cally
reba
lanc
es it
s po
rtfol
io to
bec
ome
less
focu
sed
on g
row
th a
nd m
ore
focu
sed
on in
com
e as
it a
ppro
ache
s an
d pa
sses
the
targ
et d
ate
of th
e fu
nd, w
hich
is
ebri.org Issue Brief • August 3, 2017 • No. 436 25

Equ
ityTa
rget
-dat
eN
on-T
arge
t-dat
eB
ond
Mon
eyG
ICsd /S
tabl
e-C
ompa
nyS
alar
ybFu
nds
Fund
scB
alan
ced
Fund
sFu
nds
Fund
sV
alue
Fun
dsS
tock
Pla
ns
Wit
ho
ut
Co
mp
any
Sto
ck, G
ICs,
d o
r O
ther
Sta
ble
-Val
ue
Fu
nd
s$2
0,00
0–$4
0,00
041
.8%
30.9
%7.
2%8.
8%7.
8%>$
40,0
00–$
60,0
0040
.3%
29.9
%8.
2%9.
1%7.
5%>$
60,0
00–$
80,0
0044
.0%
26.6
%7.
8%9.
9%6.
7%>$
80,0
00–$
100,
000
47.5
%23
.0%
7.9%
10.6
%6.
1%>$
100,
000
52.4
%18
.4%
6.9%
10.6
%5.
7%A
ll47
.8%
22.9
%6.
9%10
.3%
5.2%
Pla
ns
Wit
h G
ICs
d an
d/o
r O
ther
Sta
ble
-Val
ue
Fu
nd
s$2
0,00
0–$4
0,00
035
.8%
32.7
%3.
9%7.
4%1.
4%13
.8%
>$40
,000
–$60
,000
37.2
%28
.2%
4.2%
8.5%
1.7%
13.1
%>$
60,0
00–$
80,0
0041
.7%
23.7
%4.
6%8.
9%2.
0%11
.6%
>$80
,000
–$10
0,00
043
.9%
22.6
%4.
6%9.
2%2.
0%11
.0%
>$10
0,00
049
.9%
17.6
%3.
6%8.
7%1.
9%11
.8%
All
45.3
%19
.0%
5.4%
8.1%
2.0%
12.8
%P
lan
s W
ith
Co
mp
any
Sto
ck$2
0,00
0–$4
0,00
033
.2%
14.8
%5.
0%7.
2%4.
1%30
.8%
>$40
,000
–$60
,000
30.0
%23
.9%
4.8%
7.0%
5.9%
22.1
%>$
60,0
00–$
80,0
0031
.6%
26.2
%4.
6%7.
3%5.
2%18
.2%
>$80
,000
–$10
0,00
035
.2%
23.1
%4.
4%8.
2%5.
0%16
.8%
>$10
0,00
041
.6%
17.5
%3.
4%9.
1%4.
8%14
.8%
All
36.8
%19
.9%
3.6%
6.8%
5.7%
20.1
%P
lan
s W
ith
Co
mp
any
Sto
ck a
nd
GIC
sd a
nd
/or
Oth
er S
tab
le-V
alu
e F
un
ds
$20,
000–
$40,
000
34.7
%20
.1%
3.8%
4.8%
1.8%
13.8
%13
.2%
>$40
,000
–$60
,000
35.2
%20
.8%
5.6%
5.7%
2.0%
12.8
%14
.1%
>$60
,000
–$80
,000
35.3
%20
.3%
5.8%
5.2%
2.4%
12.7
%13
.8%
>$80
,000
–$10
0,00
036
.1%
18.9
%7.
2%5.
1%2.
6%13
.1%
12.9
%>$
100,
000
39.9
%15
.8%
6.3%
5.5%
2.9%
11.4
%11
.6%
All
38.3
%15
.9%
5.8%
5.6%
2.8%
8.8%
13.4
%S
ourc
e: T
abul
atio
ns fr
om E
BR
I/IC
I Par
ticip
ant-D
irect
ed R
etire
men
t Pla
n D
ata
Col
lect
ion
Pro
ject
.a M
inor
inve
stm
ent o
ptio
ns a
re n
ot s
how
n; th
eref
ore,
row
per
cent
ages
will
not
add
to 1
00 p
erce
nt. P
erce
ntag
es a
re d
olla
r-w
eigh
ed a
vera
ges.
b Sal
ary
info
rmat
ion
is a
vaila
ble
for a
sub
set o
f par
ticip
ants
in th
e E
BR
I/IC
I dat
abas
e 40
1(k)
dat
abas
e.c A
targ
et-d
ate
fund
typi
cally
reba
lanc
es it
s po
rtfol
io to
bec
ome
less
focu
sed
on g
row
th a
nd m
ore
focu
sed
on in
com
e as
it a
ppro
ache
s an
d pa
sses
the
targ
et d
ate
of th
e fu
nd, w
hich
isus
ually
incl
uded
in th
e fu
nd’s
nam
e.d G
ICs
are
guar
ante
ed in
vest
men
t con
tract
s.N
ote:
“Fun
ds” i
nclu
de m
utua
l fun
ds, b
ank
colle
ctiv
e tru
sts,
life
insu
ranc
e se
para
te a
ccou
nts,
and
any
poo
led
inve
stm
ent p
rodu
ct p
rimar
ily in
vest
ed in
the
secu
rity
indi
cate
d.
Figu
re 2
4A
vera
ge
Ass
et A
lloca
tio
n o
f 40
1(k)
Pla
n A
cco
un
ts, b
y P
arti
cip
ant
Sal
ary
and
Inve
stm
ent
Op
tio
ns
Per
cent
age
of a
ccou
nt b
alan
ces,
a 201
5
ebri.org Issue Brief • August 3, 2017 • No. 436 26
Equity Funds
Target-Date
Fundsb
Non-Target-Date Balanced
FundsBond Funds
Money Funds
GICsc/Stable-Value
Company Stock
Plan Size by Number of ParticipantsAll Plans
1–100 45.4% 21.8% 6.3% 10.9% 4.4% 3.2% 0.1%101–500 45.8% 21.7% 6.7% 10.0% 4.1% 4.2% 0.4%501–1,000 45.9% 21.8% 6.4% 8.9% 3.9% 4.7% 1.3%1,001–5,000 45.5% 19.9% 6.0% 7.9% 3.7% 6.3% 3.2%>5,000 41.1% 19.0% 5.2% 7.4% 3.9% 6.8% 10.0%All 43.1% 19.8% 5.7% 8.1% 3.9% 6.1% 6.5%
Plans Without Company Stock, GICsc/Stable-Value Funds1–100 45.4% 23.2% 5.8% 12.4% 5.0%101–500 46.6% 23.7% 6.8% 11.3% 5.1%501–1,000 48.3% 22.6% 7.1% 10.2% 5.0%1001–5,000 49.6% 22.0% 7.5% 8.9% 5.2%>5,000 48.0% 23.2% 6.8% 10.0% 5.3%All 47.8% 22.9% 6.9% 10.3% 5.2%
Plans With GICsc/Stable-Value Funds1–100 46.2% 17.4% 8.0% 6.3% 2.2% 13.8%101–500 45.5% 17.5% 6.4% 7.6% 1.9% 13.3%501–1,000 44.1% 20.9% 5.0% 7.1% 1.6% 13.6%1,001–5,000 44.1% 19.2% 5.1% 7.4% 1.8% 14.0%>5,000 45.9% 19.1% 5.2% 9.0% 2.3% 11.6%All 45.3% 19.0% 5.4% 8.1% 2.0% 12.8%
Plans With Company Stock
1–100d 40.1% 13.9% 7.4% 8.6% 5.9% 10.4%101–500 41.7% 18.1% 5.7% 8.1% 4.9% 15.1%501–1,000 37.5% 20.9% 6.3% 8.9% 5.0% 17.9%1,001–5,000 44.4% 16.1% 5.0% 7.6% 4.8% 15.9%>5,000 35.3% 20.6% 3.3% 6.6% 5.8% 21.0%All 36.8% 19.9% 3.6% 6.8% 5.7% 20.1%
Plans With Company Stock and GICsc/Stable-Value Funds1–100 35.0% 16.4% 6.9% 6.5% 1.9% 14.5% 5.7%101–500 34.8% 18.9% 6.5% 6.3% 3.5% 12.4% 4.4%501–1,000 35.6% 17.4% 6.4% 5.2% 3.4% 9.3% 13.1%1,001–5,000 36.4% 18.6% 4.5% 5.9% 2.8% 11.4% 11.0%>5,000 38.6% 15.5% 5.9% 5.5% 2.8% 12.1% 13.8%All 38.3% 15.9% 5.8% 5.6% 2.8% 8.8% 13.4%
Source: Tabulations from EBRI/ICI Participant-Directed Retirement Plan Data Collection Project.a Minor investment options are not shown; therefore, row percentages will not add to 100 percent. Percentages are dollar-weighted averages.b A target-date fund typically rebalances its portfolio to become less focused on growth and more focused on income as it approaches and passes the target date of the fund, which is usually included in the fund’s name. c GICs are guaranteed investment contracts.d Because few plans fall into this category, these percentages may be heavily influenced by a few outliers.Note: “Funds” include mutual funds, bank collective trusts, life insurance separate accounts, and any pooled investment product primarily invested in the security indicated.
Figure 25Average Asset Allocation of 401(k) Plan Accounts,
by Plan Size and Investment OptionsPercentage of account balances,a 2015
Age Group Zero 1–10% 11–20% 21–30% 31–40% 41–50% 51–60% 61–70% 71–80% 81–90% 91–100%
20s 71.1% 1.1% 1.2% 1.6% 1.8% 2.3% 2.4% 2.6% 3.4% 3.5% 9.1%
30s 57.4% 2.1% 2.0% 2.5% 2.7% 3.4% 3.9% 4.2% 4.8% 5.1% 11.9%
40s 48.8% 2.6% 2.3% 3.0% 3.4% 4.2% 5.1% 5.4% 6.2% 5.5% 13.5%
50s 47.1% 3.3% 2.8% 3.6% 4.0% 5.1% 6.1% 6.0% 5.6% 4.1% 12.2%
60s 50.9% 3.8% 3.2% 4.1% 4.6% 5.3% 5.8% 4.9% 4.1% 2.9% 10.4%
All 53.9% 2.6% 2.3% 3.0% 3.3% 4.1% 4.7% 4.8% 5.1% 4.4% 11.8%
Figure 26
Asset Allocation Distribution of 401(k) Participant Account Balance to Equity Funds, by Participant Age
Percentage of participants,a,b 2015
Percentage of Account Balance Invested in Equity Funds
Source: Tabulations from EBRI/ICI Participant-Directed Retirement P lan Data Collection Pro ject.a The analysis includes the 26.1 million participants in the year-end 201 5 EBRI/ICI database 401 (k) database.b Row percentages may not add to 1 00 percent because o f rounding.
Note: "Equity funds” include mutual funds, bank collective trusts, life insurance separate accounts, and any poo led investment product primarily
invested in equities. In addition, 401 (k) participants may hold equities through balanced funds or company stock―see Figure 30 for the
distribution of 401 (k) plan account balances to equities.
ebri.org Issue Brief • August 3, 2017 • No. 436 27
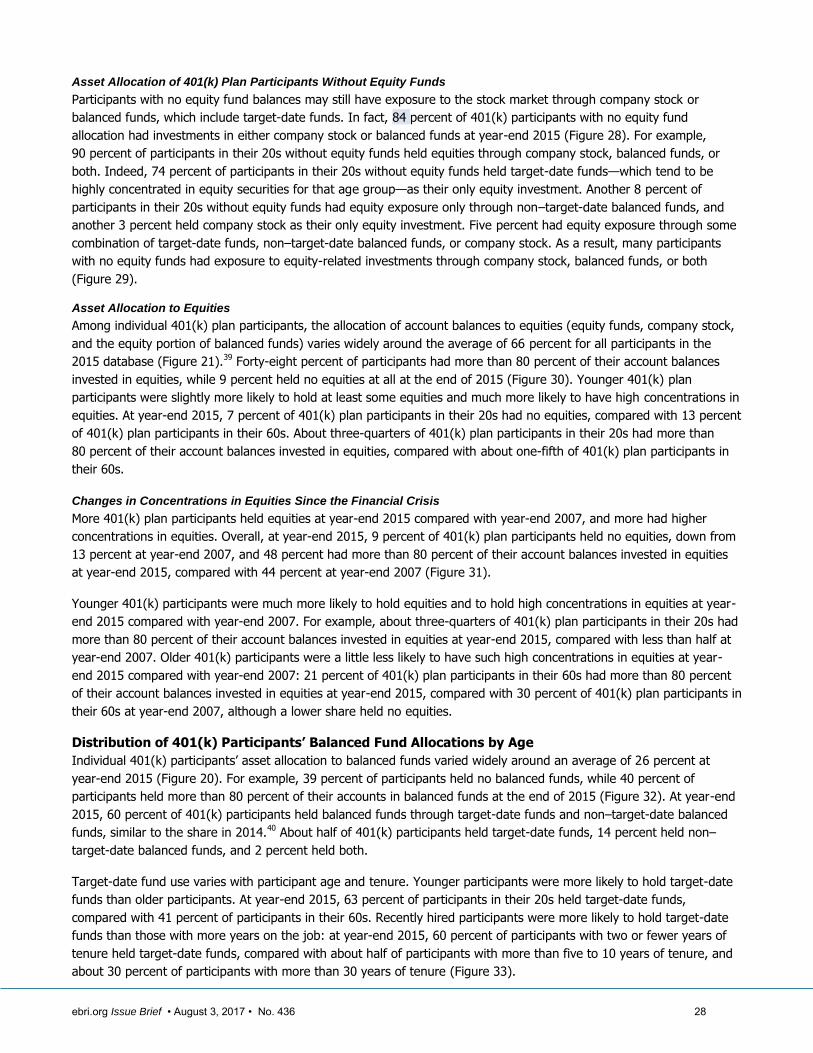
ebri.org Issue Brief • August 3, 2017 • No. 436 28
Asset Allocation of 401(k) Plan Participants Without Equity Funds
Participants with no equity fund balances may still have exposure to the stock market through company stock or
balanced funds, which include target-date funds. In fact, 84 percent of 401(k) participants with no equity fund
allocation had investments in either company stock or balanced funds at year-end 2015 (Figure 28). For example,
90 percent of participants in their 20s without equity funds held equities through company stock, balanced funds, or
both. Indeed, 74 percent of participants in their 20s without equity funds held target-date funds—which tend to be
highly concentrated in equity securities for that age group—as their only equity investment. Another 8 percent of
participants in their 20s without equity funds had equity exposure only through non–target-date balanced funds, and
another 3 percent held company stock as their only equity investment. Five percent had equity exposure through some
combination of target-date funds, non–target-date balanced funds, or company stock. As a result, many participants
with no equity funds had exposure to equity-related investments through company stock, balanced funds, or both
(Figure 29).
Asset Allocation to Equities
Among individual 401(k) plan participants, the allocation of account balances to equities (equity funds, company stock,
and the equity portion of balanced funds) varies widely around the average of 66 percent for all participants in the
2015 database (Figure 21).39 Forty-eight percent of participants had more than 80 percent of their account balances
invested in equities, while 9 percent held no equities at all at the end of 2015 (Figure 30). Younger 401(k) plan
participants were slightly more likely to hold at least some equities and much more likely to have high concentrations in
equities. At year-end 2015, 7 percent of 401(k) plan participants in their 20s had no equities, compared with 13 percent
of 401(k) plan participants in their 60s. About three-quarters of 401(k) plan participants in their 20s had more than
80 percent of their account balances invested in equities, compared with about one-fifth of 401(k) plan participants in
their 60s.
Changes in Concentrations in Equities Since the Financial Crisis
More 401(k) plan participants held equities at year-end 2015 compared with year-end 2007, and more had higher
concentrations in equities. Overall, at year-end 2015, 9 percent of 401(k) plan participants held no equities, down from
13 percent at year-end 2007, and 48 percent had more than 80 percent of their account balances invested in equities
at year-end 2015, compared with 44 percent at year-end 2007 (Figure 31).
Younger 401(k) participants were much more likely to hold equities and to hold high concentrations in equities at year-
end 2015 compared with year-end 2007. For example, about three-quarters of 401(k) plan participants in their 20s had
more than 80 percent of their account balances invested in equities at year-end 2015, compared with less than half at
year-end 2007. Older 401(k) participants were a little less likely to have such high concentrations in equities at year-
end 2015 compared with year-end 2007: 21 percent of 401(k) plan participants in their 60s had more than 80 percent
of their account balances invested in equities at year-end 2015, compared with 30 percent of 401(k) plan participants in
their 60s at year-end 2007, although a lower share held no equities.
Distribution of 401(k) Participants’ Balanced Fund Allocations by Age
Individual 401(k) participants’ asset allocation to balanced funds varied widely around an average of 26 percent at
year-end 2015 (Figure 20). For example, 39 percent of participants held no balanced funds, while 40 percent of
participants held more than 80 percent of their accounts in balanced funds at the end of 2015 (Figure 32). At year-end
2015, 60 percent of 401(k) participants held balanced funds through target-date funds and non–target-date balanced
funds, similar to the share in 2014.40 About half of 401(k) participants held target-date funds, 14 percent held non–
target-date balanced funds, and 2 percent held both.
Target-date fund use varies with participant age and tenure. Younger participants were more likely to hold target-date
funds than older participants. At year-end 2015, 63 percent of participants in their 20s held target-date funds,
compared with 41 percent of participants in their 60s. Recently hired participants were more likely to hold target-date
funds than those with more years on the job: at year-end 2015, 60 percent of participants with two or fewer years of
tenure held target-date funds, compared with about half of participants with more than five to 10 years of tenure, and
about 30 percent of participants with more than 30 years of tenure (Figure 33).
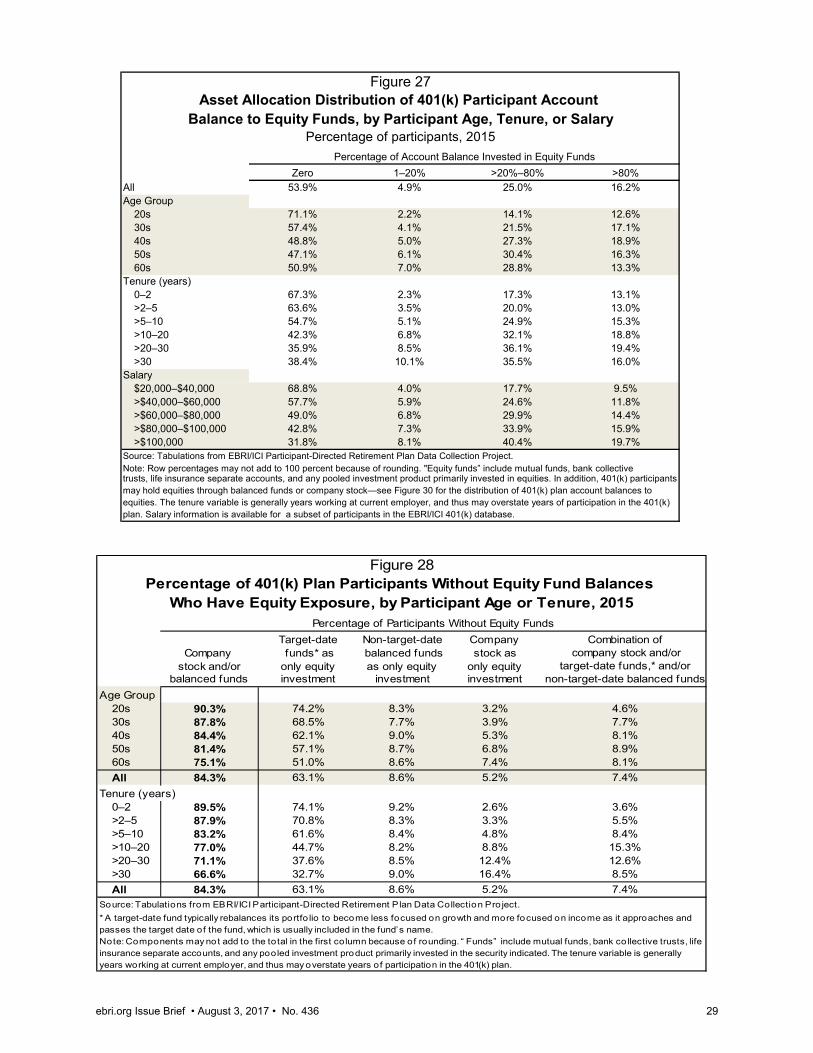
Zero 1–20% >20%–80% >80%All 53.9% 4.9% 25.0% 16.2%Age Group
20s 71.1% 2.2% 14.1% 12.6%30s 57.4% 4.1% 21.5% 17.1%40s 48.8% 5.0% 27.3% 18.9%50s 47.1% 6.1% 30.4% 16.3%60s 50.9% 7.0% 28.8% 13.3%
Tenure (years)0–2 67.3% 2.3% 17.3% 13.1%>2–5 63.6% 3.5% 20.0% 13.0%>5–10 54.7% 5.1% 24.9% 15.3%>10–20 42.3% 6.8% 32.1% 18.8%>20–30 35.9% 8.5% 36.1% 19.4%>30 38.4% 10.1% 35.5% 16.0%
Salary$20,000–$40,000 68.8% 4.0% 17.7% 9.5%>$40,000–$60,000 57.7% 5.9% 24.6% 11.8%>$60,000–$80,000 49.0% 6.8% 29.9% 14.4%>$80,000–$100,000 42.8% 7.3% 33.9% 15.9%>$100,000 31.8% 8.1% 40.4% 19.7%
Source: Tabulations from EBRI/ICI Participant-Directed Retirement Plan Data Collection Project.
trusts, life insurance separate accounts, and any pooled investment product primarily invested in equities. In addition, 401(k) participants may hold equities through balanced funds or company stock—see Figure 30 for the distribution of 401(k) plan account balances to equities. The tenure variable is generally years working at current employer, and thus may overstate years of participation in the 401(k) plan. Salary information is available for a subset of participants in the EBRI/ICI 401(k) database.
Figure 27Asset Allocation Distribution of 401(k) Participant Account
Balance to Equity Funds, by Participant Age, Tenure, or SalaryPercentage of participants, 2015
Percentage of Account Balance Invested in Equity Funds
Note: Row percentages may not add to 100 percent because of rounding. "Equity funds” include mutual funds, bank collective
Target-date Non-target-date Com pany Company funds* as balanced funds stock as
stock and/or only equity as only equity only equitybalanced funds investment investment investment
Combination of company stock and/or
target-date funds,* and/or non-target-date balanced funds
Age Group20s 90.3% 74.2% 8.3% 3.2% 4.6%30s 87.8% 68.5% 7.7% 3.9% 7.7%40s 84.4% 62.1% 9.0% 5.3% 8.1%50s 81.4% 57.1% 8.7% 6.8% 8.9%60s 75.1% 51.0% 8.6% 7.4% 8.1%
All 84.3% 63.1% 8.6% 5.2% 7.4%
Tenure (years)0–2 89.5% 74.1% 9.2% 2.6% 3.6%>2–5 87.9% 70.8% 8.3% 3.3% 5.5%>5–10 83.2% 61.6% 8.4% 4.8% 8.4%>10–20 77.0% 44.7% 8.2% 8.8% 15.3%>20–30 71.1% 37.6% 8.5% 12.4% 12.6%>30 66.6% 32.7% 9.0% 16.4% 8.5%
All 84.3% 63.1% 8.6% 5.2% 7.4%
Figure 28Percentage of 401(k) Plan Participants Without Equity Fund Balances
Who Have Equity Exposure, by Participant Age or Tenure, 2015Percentage of Participants Without Equity Funds
Source: Tabulations from EBRI/ICI Participant-Directed Retirement P lan Data Collection Pro ject.
* A target-date fund typically rebalances its portfo lio to become less focused on growth and more focused on income as it approaches and passes the target date of the fund, which is usually included in the fund’s name. Note: Components may no t add to the total in the first column because of rounding. “ Funds” include mutual funds, bank co llective trusts, life insurance separate accounts, and any pooled investment product primarily invested in the security indicated. The tenure variable is generally years working at current employer, and thus may overstate years of participation in the 401 (k) plan.
ebri.org Issue Brief • August 3, 2017 • No. 436 29

Targ
et-D
ate
Non
-Tar
get-D
ate
Bon
d M
oney
GIC
sc /Sta
ble-
Com
pany
Fund
sbB
alan
ced
Fund
sFu
nds
Fund
sV
alue
Fun
dsS
tock
Oth
erU
nkno
wn
Age
Gro
up20
s73
.3%
10.5
%3.
3%1.
3%1.
2%4.
7%3.
9%1.
7%30
s69
.1%
8.4%
3.0%
2.9%
3.1%
6.6%
5.4%
1.5%
40s
57.8
%9.
4%4.
3%4.
9%5.
5%9.
1%7.
4%1.
5%50
s47
.0%
9.1%
5.8%
6.5%
10.4
%10
.5%
9.2%
1.5%
60s
39.7
%8.
3%7.
4%8.
8%15
.7%
8.8%
9.5%
1.7%
Alld
50.8
%9.
0%5.
5%6.
2%9.
3%9.
0%8.
5%1.
6%Te
nure
(yea
rs)
0–2
69.0
%11
.0%
5.3%
4.2%
1.5%
1.9%
5.5%
1.6%
>2–5
71.0
%8.
9%4.
4%3.
1%2.
2%3.
3%5.
6%1.
5%>5
–10
62.8
%9.
1%4.
7%4.
7%4.
6%5.
9%6.
7%1.
5%>1
0–20
48.7
%9.
2%5.
2%7.
0%9.
5%10
.0%
8.6%
1.8%
>20–
3038
.5%
9.0%
5.9%
7.7%
12.3
%13
.2%
11.7
%1.
8%>3
029
.9%
8.3%
7.6%
8.2%
18.7
%14
.2%
11.3
%1.
7%A
lld50
.8%
9.0%
5.5%
6.2%
9.3%
9.0%
8.5%
1.6%
Sou
rce:
Tab
ulat
ions
from
EB
RI/I
CI P
artic
ipan
t-Dire
cted
Ret
irem
ent P
lan
Dat
a C
olle
ctio
n P
roje
ct.
a R
ow p
erce
ntag
es m
ay n
ot a
dd to
100
per
cent
bec
ause
of r
ound
ing.
Per
cent
ages
are
dol
lar-
wei
ghte
d av
erag
es.
c G
ICs
are
guar
ante
ed in
vest
men
t con
tract
s.d Th
e an
alys
is in
clud
es th
e 14
.1 m
illio
n pa
rtici
pant
s w
ith n
o eq
uity
fund
s at
yea
r-en
d 20
15.
N
ote:
“Fun
ds” i
nclu
de m
utua
l fun
ds, b
ank
colle
ctiv
e tru
sts,
life
insu
ranc
e se
para
te a
ccou
nts,
and
any
poo
led
inve
stm
ent p
rodu
ct p
rimar
ily in
vest
ed in
the
secu
rity
indi
cate
d. T
he te
nure
va
riabl
e is
gen
eral
ly y
ears
wor
king
at c
urre
nt e
mpl
oyer
, and
thus
may
ove
rsta
te y
ears
of p
artic
ipat
ion
in th
e 40
1(k)
pla
n.
Figu
re 2
9A
vera
ge
Ass
et A
lloca
tio
n f
or
401(
k) P
lan
Par
tici
pan
ts W
ith
ou
tE
qu
ity
Fu
nd
Bal
ance
s, b
y P
arti
cip
ant
Ag
e o
r T
enu
re
Per
cent
age
of a
ccou
nt b
alan
ces,
a 201
5
b A ta
rget
-dat
e fu
nd ty
pica
lly re
bala
nces
its
portf
olio
to b
ecom
e le
ss fo
cuse
d on
gro
wth
and
mor
e fo
cuse
d on
inco
me
as it
app
roac
hes
and
pass
es th
e ta
rget
dat
e of
the
fund
, whi
ch is
us
ually
incl
uded
in th
e fu
nd’s
nam
e.
ebri.org Issue Brief • August 3, 2017 • No. 436 30

ebri.org Issue Brief • August 3, 2017 • No. 436 31
Distribution of 401(k) Participants’ Company Stock Allocations
Participants’ allocations to company stock remained in line with recent previous years. Nearly one-third (or 8.5 million)
of the 401(k) participants in the 2015 EBRI/ICI 401(k) database were in plans that offered company stock as an
investment option (Figure 22). Among these participants, 77 percent held 20 percent or less of their account balances
in company stock, including 58 percent who held none (Figure 34). On the other hand, 8 percent had more than
80 percent of their account balances invested in company stock.
Asset Allocations of Recently Hired Participants
Comparing snapshots of newly hired 401(k) plan participants’ asset allocations provides further insight into recent
investment allocations. Balanced funds, which include lifestyle and target-date funds, have increased in popularity
among 401(k) participants. Recently hired participants in 2015 tended to be more likely to hold balanced funds
compared with recent hires in the past. About two-thirds of recently hired 401(k) plan participants from 2011 through
2015 held balanced funds, compared with less than half in 2006, and one-third in 2002 (Figure 35). At year-end 2015,
60 percent of recently hired 401(k) participants held target-date funds, while 11 percent held non–target-date balanced
funds, and 1 percent held both target-date and non–target-date balanced funds (Figure 36).
Among those who held balanced funds, recently hired participants in 2015 were more likely to hold a high
concentration of their accounts in balanced funds compared with past years. At year-end 2015, 80 percent of recently
hired participants holding balanced funds had more than 90 percent of their account balance invested in balanced
funds, compared with 79 percent in 2014, 61 percent in 2009, 43 percent in 2006, and 7 percent in 1998 (Figure 37).
Concentration is highest among recently hired participants with target-date funds; at year-end 2015, 82 percent of
recently hired participants holding target-date funds held more than 90 percent of their account balance in target-date
funds (Figure 38). Fifty-four percent of recently hired participants holding non–target-date balanced funds had more
than 90 percent of their account balance invested in those funds at year-end 2015.
Balanced fund, target-date fund, and non–target-date balanced fund use varied somewhat by age among recently hired
participants—recently hired participants in their 20s were more likely to be highly concentrated in such funds. For
example, 60 percent of recently hired participants in their 20s held more than 90 percent of their account balances in
balanced funds, compared with 53 percent of recent hires in their 40s, and 50 percent of recent hires in their 60s in
2015 (Figure 39). Concentrated target-date fund use ranged from 54 percent of recent hires in their 20s holding more
than 90 percent of their account balances in target-date funds to 43 percent of recently hired participants in their 60s.
In addition, at year-end 2015, 58 percent of the account balances of recently hired participants in their 20s were
invested in balanced funds, compared with 54 percent in 2012, 42 percent in 2009, 24 percent in 2006, and about
7 percent among that age group in 1998 (Figure 40).41 At year-end 2015, among recently hired participants in their
20s, target-date funds accounted for 83 percent of their balanced fund assets, or 48 percent of their account balances
overall. The pattern of target-date and non–target-date balanced fund use varied with participant age.
Comparing recently hired participants in 2015 with similar age groups in 1998 also illustrates that asset allocation to
balanced funds tended to be higher in 2015 than in 1998, rising from 9 percent of the account balances of recently
hired participants in 1998 to 41 percent in 2015 (Figure 40). The share of account balances invested in equity funds
decreased over the same period, from 65 percent for recently hired participants in 1998 to 38 percent for recently hired
participants in 2015. Company stock also declined for the two groups of recently hired participants, from 9 percent of
401(k) plan account balances in 1998 to 2 percent in 2015.
In addition to devoting a greater share of their assets to balanced funds, recently hired participants also have become
more likely to hold these diversified investment options. At year-end 2015, 70 percent of recently hired 401(k)
participants held balanced funds, compared with 29 percent at year-end 1998 (Figure 35). Over the same period,
recently hired 401(k) participants have become less likely to hold company stock (Figure 41) and less likely to hold
equity funds.42 Recently hired 401(k) participants also tend not to hold a high concentration of their account balances in
company stock (Figures 42 and 43).43

Source: Tabulations from EBRI/ICI Participant-Directed Retirement Plan Data Collection Project.
b Components may not add to 100 percent because of rounding.
a Participants include the 26.1 million 401(k) plan participants in the year-end 2015 EBRI/ICI 401(k) database and the 21.8 million 401(k) plan participants in the year-end 2007 EBRI/ICI database.
c Equities include equity funds, company stock, and the equity portion of balanced funds. Funds include mutual funds, bank collective trusts, life insurance separate accounts, and any pooled investment product primarily invested in the security indicated.
Figure 31Exposure to Equities Increased Among 401(k)
Participants Between 2007 and 2015Percentage of 401(k) participants by age of participant, a, b year-end 2007 and year-end 2015
19.2
6.910.9 7.0 10.8 7.6
12.2 8.717.7
12.7 13.28.5
2.4
0.6
2.5
1.4
3.4
2.3
5.03.8
7.1
5.7 3.8
2.7
3.8
1.23.9
2.24.7
3.2
6.3
5.2
9.714.2
5.3
4.7
7.0
3.3
7.9
5.0
9.1
6.7
17.622.7
17.230.4
11.2
12.5
19.1
12.6
19.9
14.5
28.4
33.4
23.833.9
18.1
16.4
23.024.1
48.5
75.3
54.9
69.9
43.7 46.7
35.125.7
30.120.6
43.547.5
Age Group
>80 percent >60 to 80 percent >40 to 60 percent >20 to 40 percent 1 to 20 percent Zero
Percentage of account balance invested in equitiesc
2007 2007 2007 2007 2007 20072015 2015 2015 2015 2015 2015
20s 30s 40s 50s 60s All
ebri.org Issue Brief • August 3, 2017 • No. 436 32

Percentage of Account Balance Invested in Balanced FundsAgeGroup Zero 1–10% >10–20% >20–30% >30–40% >40–50% >50–60% >60–70% >70–80% >80–90% >90–100%20s 28.1% 1.8% 1.6% 1.6% 1.3% 1.4% 2.0% 1.3% 1.3% 1.1% 58.4%30s 35.2% 3.7% 3.1% 2.9% 2.1% 1.9% 2.2% 1.5% 1.6% 1.7% 44.0%40s 40.9% 5.1% 4.2% 3.7% 2.5% 2.2% 2.1% 1.5% 1.6% 1.7% 34.6%50s 43.4% 5.7% 4.5% 4.0% 2.7% 2.3% 2.1% 1.5% 1.5% 1.6% 30.7%60s 46.1% 5.5% 4.1% 3.8% 2.6% 2.3% 2.0% 1.4% 1.4% 1.5% 29.4%All 39.2% 4.5% 3.6% 3.3% 2.3% 2.1% 2.1% 1.5% 1.5% 1.6% 38.5%
Percentage of Account Balance Invested in Target-date Fundsc
AgeGroup Zero 1–10% >10–20% >20–30% >30–40% >40–50% >50–60% >60–70% >70–80% >80–90% >90–100%20s 37.1% 1.2% 1.1% 1.2% 1.0% 1.2% 1.8% 1.2% 1.1% 1.0% 52.1%30s 44.9% 2.6% 2.1% 2.0% 1.6% 1.5% 1.8% 1.3% 1.4% 1.5% 39.2%40s 52.6% 3.6% 2.6% 2.3% 1.7% 1.6% 1.6% 1.2% 1.3% 1.5% 30.0%50s 55.9% 4.1% 2.7% 2.4% 1.8% 1.6% 1.5% 1.1% 1.2% 1.4% 26.4%60s 58.6% 3.9% 2.5% 2.2% 1.6% 1.5% 1.4% 1.0% 1.1% 1.2% 25.1%All 50.5% 3.2% 2.3% 2.1% 1.6% 1.5% 1.6% 1.2% 1.2% 1.4% 33.6%
Percentage of Account Balance Invested in Non–Target-date Balanced FundsAgeGroup Zero 1–10% >10–20% >20–30% >30–40% >40–50% >50–60% >60–70% >70–80% >80–90% >90–100%20s 89.7% 1.4% 0.9% 0.7% 0.4% 0.3% 0.2% 0.2% 0.2% 0.1% 5.9%30s 88.0% 2.6% 1.8% 1.3% 0.6% 0.5% 0.4% 0.2% 0.2% 0.2% 4.3%40s 85.5% 3.3% 2.5% 1.8% 0.9% 0.6% 0.5% 0.3% 0.2% 0.2% 4.2%50s 84.7% 3.5% 2.7% 2.1% 1.1% 0.8% 0.6% 0.3% 0.3% 0.2% 3.8%60s 84.8% 3.2% 2.6% 2.1% 1.1% 0.8% 0.6% 0.3% 0.3% 0.2% 3.8%All 86.3% 2.9% 2.2% 1.7% 0.8% 0.6% 0.5% 0.3% 0.2% 0.2% 4.4%
Figure 32Asset Allocation Distribution of 401(k) Participant
Percentage of participants,a,b 2015
Source: Tabulations from EBRI/ICI Participant-Directed Retirement Plan Data Collection Projecta The analysis includes the 26.1 million participants in the year-end 2015 EBRI/ICI 401(k) database.b Row percentages may not add to 100 percent because of rounding.c A target-date fund typically rebalances its portfolio to become less focused on growth and more focused on income as it approaches and passes the target date of the fund, which is usually included in the fund’s name.Note: "Funds" include mutual funds, bank collective trusts, life insurance separate accounts, and any pooled investment product primarily invested in the security indicated.
Account Balance to Balanced Funds, by Age
ebri.org Issue Brief • August 3, 2017 • No. 436 33

Tenu
re (y
ears
)Ze
ro1–
10%
11–2
0%21
–30%
31–4
0%41
–50%
51–6
0%61
–70%
71–8
0%81
–90%
91–1
00%
0–2
30.4
%1.
8%1.
8%1.
9%1.
4%1.
5%2.
1%1.
3%1.
3%1.
0%55
.4%
>2–5
32.4
%2.
7%2.
4%2.
4%1.
8%1.
8%2.
2%1.
4%1.
5%1.
5%49
.9%
>5–1
038
.6%
4.4%
3.7%
3.3%
2.4%
2.2%
2.1%
1.7%
1.7%
1.8%
38.2
%>1
0–20
46.6
%6.
9%5.
4%4.
6%3.
0%2.
5%2.
1%1.
6%1.
6%2.
3%23
.4%
>20–
3051
.5%
8.3%
6.0%
5.1%
3.3%
2.8%
2.3%
1.9%
1.9%
1.8%
15.3
%>3
055
.0%
8.5%
5.7%
4.8%
3.2%
2.6%
2.0%
1.4%
1.3%
1.3%
14.2
%A
ll39
.2%
4.5%
3.6%
3.3%
2.3%
2.1%
2.1%
1.5%
1.5%
1.6%
38.5
%
Tenu
re (y
ears
)Ze
ro1–
10%
11–2
0%21
–30%
31–4
0%41
–50%
51–6
0%61
–70%
71–8
0%81
–90%
91–1
00%
0–2
40.3
%1.
2%1.
1%1.
3%1.
0%1.
2%1.
9%1.
1%1.
1%0.
8%49
.0%
>2–5
41.9
%1.
9%1.
6%1.
7%1.
5%1.
5%1.
9%1.
2%1.
3%1.
3%44
.2%
>5–1
049
.3%
3.3%
2.5%
2.3%
1.8%
1.6%
1.7%
1.4%
1.4%
1.6%
33.0
%>1
0–20
59.2
%5.
1%3.
4%2.
7%2.
0%1.
7%1.
5%1.
2%1.
3%2.
0%19
.8%
>20–
3065
.7%
5.9%
3.5%
2.8%
2.0%
1.8%
1.6%
1.4%
1.5%
1.5%
12.5
%>3
069
.1%
6.1%
3.4%
2.6%
1.9%
1.6%
1.2%
1.0%
1.0%
1.0%
11.1
%A
ll50
.5%
3.2%
2.3%
2.1%
1.6%
1.5%
1.6%
1.2%
1.2%
1.4%
33.6
%
Tenu
re (y
ears
)Ze
ro1–
10%
11–2
0%21
–30%
31–4
0%41
–50%
51–6
0%61
–70%
71–8
0%81
–90%
91–1
00%
0–2
88.7
%1.
4%1.
2%0.
9%0.
5%0.
4%0.
3%0.
2%0.
2%0.
1%6.
1%>2
–588
.5%
1.9%
1.4%
1.1%
0.5%
0.4%
0.3%
0.2%
0.2%
0.2%
5.2%
>5–1
086
.6%
2.9%
2.1%
1.5%
0.7%
0.6%
0.5%
0.3%
0.3%
0.3%
4.4%
>10–
2084
.0%
4.1%
3.1%
2.3%
1.1%
0.8%
0.6%
0.3%
0.3%
0.3%
3.1%
>20–
3082
.4%
4.8%
3.5%
2.8%
1.4%
1.0%
0.7%
0.4%
0.3%
0.3%
2.5%
>30
82.4
%4.
7%3.
4%2.
7%1.
4%1.
0%0.
7%0.
4%0.
3%0.
3%2.
8%A
ll86
.3%
2.9%
2.2%
1.7%
0.8%
0.6%
0.5%
0.3%
0.2%
0.2%
4.4%
Sou
rce:
Tab
ulat
ions
from
EB
RI/I
CI P
artic
ipan
t-Dire
cted
Ret
irem
ent P
lan
Dat
a C
olle
ctio
n P
roje
ct.
a T
he a
naly
sis
incl
udes
the
26.1
mill
ion
401(
k) p
lan
parti
cipa
nts
in th
e ye
ar-e
nd 2
015
EB
RI/I
CI 4
01(k
) dat
abas
e 40
1k(k
) dat
abas
e. b
Row
per
cent
ages
may
not
add
to 1
00 p
erce
nt b
ecau
se o
f rou
ndin
g.
Not
e: “F
unds
” inc
lude
mut
ual f
unds
, ban
k co
llect
ive
trust
s, li
fe in
sura
nce
sepa
rate
acc
ount
s, a
nd a
ny p
oole
d in
vest
men
t pro
duct
prim
arily
inve
sted
in th
e se
curit
y in
dica
ted.
The
tenu
re v
aria
ble
is
gene
rally
yea
rs w
orki
ng a
t cur
rent
em
ploy
er, a
nd th
us m
ay o
vers
tate
yea
rs o
f par
ticip
atio
n in
the
401(
k) p
lan.
c A
targ
et-d
ate
fund
typi
cally
reba
lanc
es it
s po
rtfol
io to
bec
ome
less
focu
sed
on g
row
th a
nd m
ore
focu
sed
on in
com
e as
it a
ppro
ache
s an
d pa
sses
the
targ
et d
ate
of th
e fu
nd, w
hich
is u
sual
ly in
clud
ed in
the
fund
’s
nam
e.
Figu
re 3
3A
sset
Allo
cati
on
Dis
trib
uti
on
of
401(
k) P
arti
cip
ant
Acc
ou
nt
Bal
ance
to
Bal
ance
d F
un
ds,
by
Ten
ure
Per
cent
age
of P
artic
ipan
ts,a,
b 201
5
Per
cent
age
of A
ccou
nt B
alan
ce In
vest
ed in
Bal
ance
d Fu
nds
Per
cent
age
of A
ccou
nt B
alan
ce In
vest
ed in
Tar
get-D
ate
Fund
sc
Per
cent
age
of A
ccou
nt B
alan
ce In
vest
ed in
Non
-Tar
get-D
ate
Bal
ance
d Fu
nds
ebri.org Issue Brief • August 3, 2017 • No. 436 34

ebri.org Issue Brief • August 3, 2017 • No. 436 35
Year-End 2015 Snapshot of 401(k) Plan Loan Activity
Availability and Use of 401(k) Plan Loans by Plan Size
Fifty-three percent of the 401(k) plans for which loan data were available in the 2015 EBRI/ICI 401(k) database offered
a plan loan provision to participants (Figure 44).44 The loan feature was more commonly associated with large plans (as
measured by the number of participants in the plan). About 90 percent of plans with more than 1,000 participants
included a loan provision, compared with 30 percent of plans with 10 or fewer participants.
Participant loan activity varied modestly by plan size, ranging from 17 percent of participants with loans outstanding in
401(k) plans with 26 to 100 or 1,001 to 2,500 participants to 23 percent of participants in 401(k) plans with 10 or fewer
participants (Figure 45). Loan ratios—the amount of the loan outstanding divided by the remaining account balance—
vary only slightly when participants are grouped based on the size of their 401(k) plans (as measured by the number of
plan participants). Among those in plans with 100 or fewer participants, the loan ratio was 14 percent of the remaining
assets in 2015, while in plans with more than 5,000 participants the loan ratio was 11 percent (Figure 46).
In the 20 years that the database has been tracking loan activity among 401(k) plan participants, there has been little
variation. From 1996 through 2008, on average, less than one-fifth of 401(k) participants with access to loans had
loans outstanding. At year-end 2009, the percentage of participants who were offered loans with loans outstanding
ticked up to 21 percent and remained at that level from year-end 2010 through year-end 2013 before falling to
20 percent at year-end 2014 and 18 percent at year-end 2015 (Figure 47).45 However, not all participants have access
to 401(k) plan loans—factoring in all 401(k) participants with and without loan access in the database, only 16 percent
had loans outstanding at year-end 2015.46 On average, over the past 20 years, among participants with loans
outstanding, about 14 percent of the remaining account balance remained unpaid. U.S. Department of Labor data
indicate that loan amounts tend to be a negligible portion of plan assets.47
401(k) Plan Loan Activity Varies with Participant Age, Tenure, Account Balance, and Salary
In the 2015 EBRI/ICI 401(k) database, 87 percent of participants were in plans offering loans. However, as has been
the case for the 20 years that the database has tracked 401(k) plan participants, relatively few participants made use of
this borrowing privilege. At year-end 2015, 18 percent of those eligible for loans had 401(k) plan loans outstanding
(Figure 47). As in previous years, loan activity varies with age, tenure, account balance, and salary. Of those
participants in plans offering loans, the highest percentages of participants with outstanding loan balances were among
participants in their 30s, 40s, or 50s (Figure 48). In addition, participants with five or fewer years of tenure or with
more than 30 years of tenure were less likely to use the loan provision than other participants. Eleven percent of
participants with account balances of less than $10,000 had loans outstanding.
Average Loan Balances
Among participants with outstanding 401(k) loans at the end of 2015, the average unpaid balance was $7,982,
compared with $7,780 in the year-end 2014 database (Figure 49). The median loan balance outstanding was $4,359 at
year-end 2015, compared with $4,239 in the year-end 2014 database. The ratio of the loan outstanding to the
remaining account balance increased slightly, from 11 percent at year-end 2014 to 12 percent at year-end 2015
(Figures 47 and 50). In addition, as in previous years, variation around this average tends to correspond with age (the
older the participant, the lower the average), tenure (the higher the tenure of the participant, the lower the average),
account balance (the higher the account balance, the lower the average),48 and salary (the higher the participant’s
salary, the lower the average) (Figure 50).
Overall, loans from 401(k) plans tended to be small, with a sizable majority of eligible 401(k) participants in all age
groups having no loan outstanding at all. For example, 92 percent of participants in their 20s, 76 percent of participants
in their 40s, and 87 percent of participants in their 60s had no loans outstanding at year-end 2015 (Figure 51).
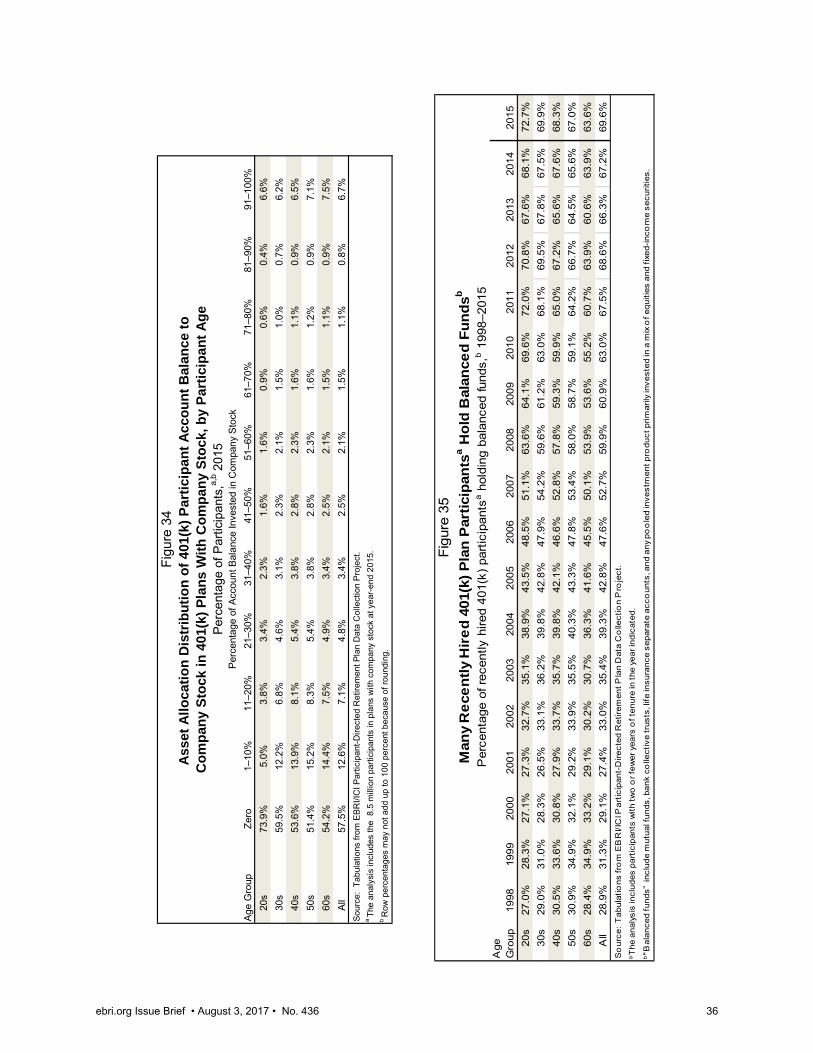
Age
Gro
upZe
ro1–
10%
11–2
0%21
–30%
31–4
0%41
–50%
51–6
0%61
–70%
71–8
0%81
–90%
91–1
00%
20s
73.9
%5.
0%3.
8%3.
4%2.
3%1.
6%1.
6%0.
9%0.
6%0.
4%6.
6%30
s59
.5%
12.2
%6.
8%4.
6%3.
1%2.
3%2.
1%1.
5%1.
0%0.
7%6.
2%40
s53
.6%
13.9
%8.
1%5.
4%3.
8%2.
8%2.
3%1.
6%1.
1%0.
9%6.
5%50
s51
.4%
15.2
%8.
3%5.
4%3.
8%2.
8%2.
3%1.
6%1.
2%0.
9%7.
1%60
s54
.2%
14.4
%7.
5%4.
9%3.
4%2.
5%2.
1%1.
5%1.
1%0.
9%7.
5%Al
l57
.5%
12.6
%7.
1%4.
8%3.
4%2.
5%2.
1%1.
5%1.
1%0.
8%6.
7%S
ourc
e: T
abul
atio
ns fr
om E
BR
I/IC
I Par
ticip
ant-D
irect
ed R
etire
men
t Pla
n D
ata
Col
lect
ion
Pro
ject
.a Th
e an
alys
is in
clud
es th
e 8
.5 m
illio
n pa
rtici
pant
s in
pla
ns w
ith c
ompa
ny s
tock
at y
ear-
end
2015
.b R
ow p
erce
ntag
es m
ay n
ot a
dd u
p to
100
per
cent
bec
ause
of r
ound
ing.
Figu
re 3
4A
sset
All
oca
tio
n D
istr
ibu
tio
n o
f 40
1(k)
Par
tici
pan
t A
cco
un
t B
alan
ce t
o
Co
mp
any
Sto
ck i
n 4
01(k
) P
lan
s W
ith
Co
mp
any
Sto
ck,
by
Par
tici
pan
t A
ge
Perc
enta
ge o
f Par
ticip
ants
,a,b 2
015
Perc
enta
ge o
f Acc
ount
Bal
ance
Inve
sted
in C
ompa
ny S
tock
Age
G
roup
1998
1999
2000
2001
2002
2003
2004
2005
2006
2007
2008
2009
2010
2011
2012
2013
2014
2015
20s
27.0
%28
.3%
27.1
%27
.3%
32.7
%35
.1%
38.9
%43
.5%
48.5
%51
.1%
63.6
%64
.1%
69.6
%72
.0%
70.8
%67
.6%
68.1
%72
.7%
30s
29.0
%31
.0%
28.3
%26
.5%
33.1
%36
.2%
39.8
%42
.8%
47.9
%54
.2%
59.6
%61
.2%
63.0
%68
.1%
69.5
%67
.8%
67.5
%69
.9%
40s
30.5
%33
.6%
30.8
%27
.9%
33.7
%35
.7%
39.8
%42
.1%
46.6
%52
.8%
57.8
%59
.3%
59.9
%65
.0%
67.2
%65
.6%
67.6
%68
.3%
50s
30.9
%34
.9%
32.1
%29
.2%
33.9
%35
.5%
40.3
%43
.3%
47.8
%53
.4%
58.0
%58
.7%
59.1
%64
.2%
66.7
%64
.5%
65.6
%67
.0%
60s
28.4
%34
.9%
33.2
%29
.1%
30.2
%30
.7%
36.3
%41
.6%
45.5
%50
.1%
53.9
%53
.6%
55.2
%60
.7%
63.9
%60
.6%
63.9
%63
.6%
All
28.9
%31
.3%
29.1
%27
.4%
33.0
%35
.4%
39.3
%42
.8%
47.6
%52
.7%
59.9
%60
.9%
63.0
%67
.5%
68.6
%66
.3%
67.2
%69
.6%
So
urce
: T
abul
atio
ns fr
om
EB
RI/I
CI P
artic
ipan
t-D
irect
ed R
etire
men
t Pla
n D
ata
Co
llect
ion
Pro
ject
.a T
he a
naly
sis
incl
udes
par
ticip
ants
with
two
or f
ewer
yea
rs o
f ten
ure
in th
e ye
ar in
dica
ted.
b "B
alan
ced
fund
s” in
clud
e m
utua
l fun
ds, b
ank
colle
ctiv
e tr
usts
, life
insu
ranc
e se
para
te a
cco
unts
, and
any
po
ole
d in
vest
men
t pro
duct
prim
arily
inve
sted
in a
mix
of e
quiti
es a
nd fi
xed-
inco
me
secu
ritie
s.
Figu
re 3
5M
an
y R
ece
ntl
y H
ire
d 4
01(k
) P
lan
Part
icip
an
tsa H
old
Bala
nce
d F
un
ds
b
Per
cent
age
of re
cent
ly h
ired
401(
k) p
artic
ipan
tsa
hold
ing
bala
nced
fund
s,b
1998
–201
5
ebri.org Issue Brief • August 3, 2017 • No. 436 36

Age
Gro
up20
0620
0720
0820
0920
1020
1120
1220
1320
1420
15
20s
48.5
%51
.1%
63.6
%64
.1%
69.6
%72
.0%
70.8
%67
.6%
68.1
%72
.7%
30s
47.9
%54
.2%
59.6
%61
.2%
63.0
%68
.1%
69.5
%67
.8%
67.5
%69
.9%
40s
46.6
%52
.8%
57.8
%59
.3%
59.9
%65
.0%
67.2
%65
.6%
67.6
%68
.3%
50s
47.8
%53
.4%
58.0
%58
.7%
59.1
%64
.2%
66.7
%64
.5%
65.6
%67
.0%
60s
45.5
%50
.1%
53.9
%53
.6%
55.2
%60
.7%
63.9
%60
.6%
63.9
%63
.6%
All
47.6
%52
.7%
59.9
%60
.9%
63.0
%67
.5%
68.6
%66
.3%
67.2
%69
.6%
Age
Gro
up20
0620
0720
0820
0920
1020
1120
1220
1320
1420
15
20s
29.4
%32
.4%
47.5
%50
.5%
55.3
%59
.3%
59.4
%58
.6%
60.6
%64
.0%
30s
28.5
%35
.5%
44.3
%48
.3%
49.8
%55
.9%
58.7
%58
.2%
59.7
%61
.0%
40s
27.4
%34
.6%
42.6
%46
.6%
47.2
%52
.8%
55.8
%54
.8%
57.7
%57
.8%
50s
28.1
%35
.3%
42.7
%46
.2%
46.8
%52
.4%
55.5
%53
.6%
57.0
%55
.9%
60s
26.1
%32
.3%
39.1
%41
.8%
43.1
%49
.0%
51.5
%48
.9%
55.4
%51
.0%
All
28.3
%34
.3%
44.4
%47
.9%
49.8
%55
.2%
57.3
%56
.3%
58.9
%59
.7%
Age
Gro
up20
0620
0720
0820
0920
1020
1120
1220
1320
1420
15
20s
22.5
%21
.2%
18.5
%16
.7%
15.8
%14
.0%
12.8
%10
.1%
8.6%
9.7%
30s
22.5
%21
.9%
18.2
%16
.2%
15.1
%14
.0%
12.6
%11
.2%
11.9
%10
.4%
40s
21.3
%21
.1%
17.7
%15
.8%
14.4
%13
.9%
13.3
%12
.4%
14.8
%12
.0%
50s
21.4
%20
.9%
17.6
%15
.4%
13.8
%13
.5%
13.0
%12
.4%
13.3
%12
.4%
60s
19.8
%20
.1%
16.7
%14
.0%
13.2
%13
.1%
13.9
%13
.0%
13.1
%13
.5%
All
21.9
%21
.3%
18.0
%16
.1%
14.8
%13
.9%
13.0
%11
.4%
11.8
%11
.3%
Sou
rce:
Tab
ulat
ions
from
EB
RI/I
CI P
artic
ipan
t-D
irect
ed R
etire
men
t Pla
n D
ata
Col
lect
ion
Pro
ject
.a
A ta
rget
-dat
e fu
nd ty
pica
lly r
ebal
ance
s its
por
tfolio
to b
ecom
e le
ss fo
cuse
d on
gro
wth
and
mor
e fo
cuse
d on
inco
me
as it
app
roac
hes
and
pass
es th
e ta
rget
dat
e of
the
fund
, whi
ch is
usu
ally
incl
uded
in th
e fu
nd’s
nam
e.
Not
e: T
he a
naly
sis
incl
udes
the
4.8
mill
ion
rece
ntly
hire
d pa
rtic
ipan
ts (
thos
e w
ith tw
o or
few
er y
ears
of t
enur
e) in
201
5, th
e 4.
1 m
illio
n re
cent
ly h
ired
part
icip
ants
in 2
014,
th
e 4.
4 m
illio
n re
cent
ly h
ired
part
icip
ants
in 2
013,
the
3.6
mill
ion
rece
ntly
hire
d pa
rtic
ipan
ts i
n 20
12, t
he 3
.4 m
illio
n re
cent
ly h
ired
part
icip
ants
in 2
011,
the
3.2
mill
ion
rece
ntly
hi
red
part
icip
ants
in 2
010,
the
3.1
mill
ion
rece
ntly
hire
d pa
rtic
ipan
ts in
200
9, th
e 4.
0 m
illio
n re
cent
ly h
ired
part
icip
ants
in 2
008,
the
3.8
mill
ion
rece
ntly
hire
d pa
rtic
ipan
ts in
20
07, a
nd th
e 2.
8 m
illio
n re
cent
ly h
ired
part
icip
ants
in 2
006.
"Fun
ds"
incl
ude
mut
ual f
unds
, ban
k co
llect
ive
trus
ts, l
ife in
sura
nce
sepa
rate
acc
ount
s, a
nd a
ny p
oole
d in
vest
men
t pro
duct
prim
arily
inve
sted
in th
e se
curit
y in
dica
ted.
Fig
ure
36
Man
y R
ecen
tly
Hir
ed 4
01(k
) P
lan
Par
tici
pan
ts H
old
Tar
get
-Dat
ea B
alan
ced
Fu
nd
s
Per
cent
age
of r
ecen
tly h
ired
part
icip
ants
, 200
6,
20
07, 2
008,
200
9, 2
010,
201
1, 2
012,
201
3, 2
014,
and
201
5
Ho
ldin
g B
alan
ced
Fu
nd
s
Ho
ldin
g T
arg
et-D
ate
Fu
nd
sa
Ho
ldin
g N
on
-Tar
get
-Dat
e F
un
ds
ebri.org Issue Brief • August 3, 2017 • No. 436 37

Age Group >0–50 percent >50–90 percent >90 percent20s 84.9% 7.3% 7.8%30s 86.0% 7.6% 6.4%40s 84.1% 8.9% 7.0%50s 81.1% 10.7% 8.2%60s 77.0% 12.4% 10.6%All 84.5% 8.2% 7.3%
Age Group >0–50 percent >50–90 percent >90 percent20s 40.1% 13.7% 46.2%30s 47.7% 12.8% 39.5%40s 46.0% 13.1% 40.9%50s 43.3% 13.3% 43.4%60s 39.5% 12.6% 47.9%All 43.9% 13.3% 42.8%
Age Group >0–50 percent >50–90 percent >90 percent20s 36.3% 14.7% 49.0%30s 40.9% 12.6% 46.5%40s 40.1% 12.9% 47.0%50s 38.1% 13.0% 48.8%60s 36.4% 12.8% 50.8%All 38.8% 13.3% 47.9%
Age Group >0–50 percent >50–90 percent >90 percent20s 26.1% 11.8% 62.2%30s 33.5% 13.3% 53.2%40s 33.9% 13.5% 52.6%50s 32.8% 13.5% 53.6%60s 32.1% 12.8% 55.1%All 31.0% 12.9% 56.1%
Age Group >0–50 percent >50–90 percent >90 percent20s 20.4% 13.3% 66.3%30s 27.8% 13.9% 58.3%40s 28.8% 13.9% 57.4%50s 28.7% 13.7% 57.6%60s 29.4% 13.3% 57.3%All 25.9% 13.6% 60.5%
Figure 37
Many Recently Hired 401(k) Participants Hold High Concentrations in Balanced FundsPercentage of recently hired participants holding
balanced fund assets,a,b selected years
2009
Percentage of Account Balance Invested in Balanced Funds
2006
2008
1998
2007
((more))
ebri.org Issue Brief • August 3, 2017 • No. 436 38

Age Group >0–50 percent >50–90 percent >90 percent20s 14.8% 10.0% 75.2%30s 21.2% 11.3% 67.5%40s 22.7% 10.7% 66.6%50s 22.4% 10.1% 67.5%60s 22.3% 9.2% 68.5%All 19.7% 10.5% 69.8%
Age Group >0–50 percent >50–90 percent >90 percent20s 11.6% 10.2% 78.2%30s 16.8% 10.4% 72.7%40s 18.4% 10.3% 71.2%50s 18.2% 9.9% 71.8%60s 17.6% 8.9% 73.5%All 15.8% 10.2% 74.0%
Age Group >0–50 percent >50–90 percent >90 percent20s 11.3% 8.8% 79.9%30s 15.5% 10.1% 74.4%40s 17.3% 9.8% 73.0%50s 16.9% 9.3% 73.8%60s 16.4% 8.3% 75.3%All 14.9% 9.4% 75.7%
Age Group >0–50 percent >50–90 percent >90 percent20s 11.2% 8.1% 80.7%30s 15.0% 8.9% 76.2%40s 17.1% 8.3% 74.6%50s 17.3% 7.9% 74.9%60s 16.7% 7.5% 75.8%All 14.7% 8.2% 77.0%
Age Group >0–50 percent >50–90 percent >90 percent20s 10.4% 7.5% 82.1%30s 13.4% 8.7% 77.9%40s 14.4% 8.2% 77.4%50s 14.7% 7.4% 77.8%60s 13.9% 6.7% 79.4%All 12.9% 7.9% 79.2%
Age Group >0–50 percent >50–90 percent >90 percent20s 9.0% 8.2% 82.8%30s 12.5% 9.0% 78.4%40s 14.2% 8.1% 77.7%50s 14.7% 7.4% 77.9%60s 14.9% 6.7% 78.4%All 12.2% 8.2% 79.6%
Source: Tabulations from EBRI/ICI Participant-Directed Retirement Plan Data Collection Project.
b Row percentages may not add to 100 percent because of rounding.
a The analysis includes the 0.4 million recently hired participants (those with two or fewer years of tenure) holding balanced funds in 1998; the 1.4 million recently hired participants holding balanced funds in 2006; the 2.0 million recently hired participants holding balanced funds in 2007; the 2.4 million recently hired participants holding balanced funds in 2008; the 1.9 million recently hired participants holding balanced funds in 2009; the 2.0 million recently hired participants holding balanced funds in 2010; the 2.3 million recently hired participants holding balanced funds in 2011; the 2.5 million recently hired participants holding balanced funds in 2012; the 2.9 million recently hired participants holding balanced funds in 2013, and the 2.8 million recently hired participants holding balanced funds in 2014, and the 3.3 million recently hired participants holding balanced funds in 2015.
Note: “Balanced funds” include mutual funds, bank collective trusts, life insurance separate accounts, and any pooled investment product primarily invested in a mix of equities and fixed-income securities.
2010
2013
2011
2012
2014
2015
Figure 37 (Cont'd.)
Percentage of Account Balance Invested in Balanced Funds
ebri.org Issue Brief • August 3, 2017 • No. 436 39

Percentage of Account Balance Invested in Balanced Funds
Age Group >0–50 percent >50–90 percent >90 percent20s 9.0% 8.2% 82.8%30s 12.5% 9.0% 78.4%40s 14.2% 8.1% 77.7%50s 14.7% 7.4% 77.9%60s 14.9% 6.7% 78.4%All 12.2% 8.2% 79.6%
Age Group >0–50 percent >50–90 percent >90 percent20s 7.5% 8.3% 84.2%30s 10.2% 9.2% 80.6%40s 11.3% 8.2% 80.5%50s 11.1% 7.2% 81.6%60s 10.6% 6.1% 83.3%All 9.7% 8.3% 82.1%
Age Group >0–50 percent >50–90 percent >90 percent20s 31.9% 6.7% 61.5%30s 41.4% 6.6% 52.0%40s 41.3% 6.6% 52.1%50s 43.2% 7.1% 49.7%60s 42.2% 8.7% 49.1%All 38.9% 6.8% 54.3%
Source: Tabulations from EBRI/ICI Participant-Directed Retirement Plan Data Collection Project.
c Row percentages may not add to 100 percent because of rounding.
Percentage of Account Balance Invested in Non-Target-Date Balanced Funds
a A target-date fund typically rebalances its portfolio to become less focused on growth and more focused on income as it approaches and passes the target date of the fund, which is usually included in the fund’s name. b The analysis includes the 3.3 million recently hired participants (those with two or fewer years of tenure) holding balanced funds in 2015, the 2.9 million recently hired participants holding target-date funds in 2015; and the 0.5 million recently hired participants holding non-target-date balanced funds in 2015.
Note: “Funds” include mutual funds, bank collective trusts, life insurance separate accounts, and any pooled investment product primarily invested in the security indicated.
Figure 38Many Recently Hired 401(k) Participants Hold
High Concentrations in Target-Date Fundsa
Percentage of recently hired 401(k) participants holding the type of fund indicated,b, c 2015
Percentage of Account Balance Invested in Target-Date Fundsa
ebri.org Issue Brief • August 3, 2017 • No. 436 40

Age
Gro
upZe
ro1–
10%
11–2
0%21
–30%
31–4
0%41
–50%
51–6
0%61
–70%
71–8
0%81
–90%
91–1
00%
20s
27.4
%1.
4%1.
4%1.
4%1.
1%1.
3%2.
2%1.
4%1.
4%1.
0%60
.2%
30s
30.1
%1.
9%1.
9%1.
9%1.
5%1.
5%2.
3%1.
4%1.
5%1.
1%54
.9%
40s
31.7
%2.
1%2.
2%2.
2%1.
6%1.
6%2.
0%1.
2%1.
3%1.
0%53
.1%
50s
33.0
%2.
1%2.
2%2.
4%1.
5%1.
7%1.
8%1.
1%1.
2%0.
9%52
.2%
60s
36.4
%2.
2%2.
1%2.
2%1.
4%1.
6%1.
7%0.
8%0.
9%0.
8%49
.8%
All
30.4
%1.
8%1.
8%1.
9%1.
4%1.
5%2.
1%1.
3%1.
3%1.
0%55
.4%
Age
Gro
upZe
ro1–
10%
11–2
0%21
–30%
31–4
0%41
–50%
51–6
0%61
–70%
71–8
0%81
–90%
91–1
00%
20s
36.0
%0.
9%0.
9%1.
0%0.
9%1.
1%2.
1%1.
2%1.
2%0.
8%53
.9%
30s
39.0
%1.
2%1.
3%1.
4%1.
1%1.
2%2.
1%1.
3%1.
4%0.
9%49
.1%
40s
42.2
%1.
3%1.
3%1.
5%1.
2%1.
2%1.
8%1.
0%1.
1%0.
8%46
.5%
50s
44.1
%1.
3%1.
2%1.
4%1.
1%1.
2%1.
5%0.
9%1.
0%0.
7%45
.6%
60s
48.6
%1.
3%1.
0%1.
2%0.
9%1.
0%1.
2%0.
6%0.
7%0.
6%42
.8%
All
40.3
%1.
2%1.
1%1.
3%1.
0%1.
2%1.
9%1.
1%1.
1%0.
8%49
.0%
Age
Gro
upZe
ro1–
10%
11–2
0%21
–30%
31–4
0%41
–50%
51–6
0%61
–70%
71–8
0%81
–90%
91–1
00%
20s
90.3
%1.
1%0.
8%0.
6%0.
3%0.
3%0.
2%0.
2%0.
2%0.
1%6.
0%30
s89
.6%
1.4%
1.1%
0.9%
0.5%
0.4%
0.2%
0.2%
0.2%
0.1%
5.4%
40s
88.0
%1.
5%1.
4%1.
1%0.
6%0.
4%0.
3%0.
2%0.
2%0.
1%6.
3%50
s87
.6%
1.5%
1.5%
1.3%
0.6%
0.5%
0.4%
0.2%
0.2%
0.1%
6.2%
60s
86.5
%1.
5%1.
5%1.
4%0.
7%0.
7%0.
5%0.
2%0.
2%0.
2%6.
6%A
ll88
.7%
1.4%
1.2%
0.9%
0.5%
0.4%
0.3%
0.2%
0.2%
0.1%
6.1%
Sou
rce:
Tab
ulat
ions
from
EB
RI/I
CI P
artic
ipan
t-Dire
cted
Ret
irem
ent P
lan
Dat
a C
olle
ctio
n P
roje
ct.
a T
he a
naly
sis
incl
udes
the
4.8
mill
ion
rece
ntly
hire
d pa
rtici
pant
s (th
ose
with
two
or fe
wer
yea
rs o
f ten
ure)
in 2
015.
b R
ow p
erce
ntag
es m
ay n
ot a
dd to
100
per
cent
bec
ause
of r
ound
ing.
Not
e: “F
unds
” inc
lude
mut
ual f
unds
, ban
k co
llect
ive
trust
s, li
fe in
sura
nce
sepa
rate
acc
ount
s, a
nd a
ny p
oole
d in
vest
men
t pro
duct
prim
arily
inve
sted
in th
e se
curit
y in
dica
ted.
Per
cent
age
of A
ccou
nt B
alan
ce In
vest
ed in
Non
-Tar
get-D
ate
Bal
ance
d Fu
nds
c A
targ
et-d
ate
fund
typi
cally
reba
lanc
es it
s po
rtfol
io to
bec
ome
less
focu
sed
on g
row
th a
nd m
ore
focu
sed
on in
com
e as
it a
ppro
ache
s an
d pa
sses
the
targ
et d
ate
of th
e fu
nd, w
hich
is u
sual
ly in
clud
ed in
the
fund
’s
nam
e.
Figu
re 3
9A
sset
Allo
cati
on
Dis
trib
uti
on
of
401(
k) P
lan
Acc
ou
nt
Bal
ance
to
B
alan
ced
Fu
nd
s A
mo
ng
Rec
entl
y H
ired
Par
tici
pan
ts, b
y P
arti
cip
ant
Ag
e
Per
cent
age
of R
ecen
tly H
ired
Par
ticip
ants
,a,b 2
015
Per
cent
age
of A
ccou
nt B
alan
ce In
vest
ed in
Bal
ance
d Fu
nds
Per
cent
age
of A
ccou
nt B
alan
ce In
vest
ed in
Tar
get-D
ate
Fund
sc
ebri.org Issue Brief • August 3, 2017 • No. 436 41

Non
-Tar
get-
Tar
get-
date
date
bal
an-
Age
fu
ndsc
ced
fund
s
Gro
up19
9820
1519
9820
1520
1520
1519
9820
1519
9820
1519
9820
1519
9820
15
20s
66.9
%28
.5%
7.4%
58.0
%48
.1%
9.9%
5.1%
4.6%
4.0%
1.1%
3.7%
0.9%
10.5
%3.
0%
30s
67.8
%37
.0%
8.0%
47.8
%41
.1%
6.7%
5.1%
5.1%
4.1%
1.6%
3.2%
1.4%
9.4%
2.1%
40s
64.5
%40
.7%
9.7%
41.2
%34
.8%
6.4%
5.9%
6.8%
5.1%
2.4%
4.4%
1.3%
8.0%
1.8%
50s
60.5
%38
.8%
11.3
%37
.6%
31.1
%6.
4%6.
6%10
.2%
5.9%
3.7%
6.7%
1.7%
6.5%
1.4%
60s
50.0
%34
.5%
12.1
%31
.6%
24.8
%6.
8%8.
7%16
.0%
7.8%
6.4%
13.3
%1.
8%5.
7%0
.9%
All
64.8
%37
.5%
9.1%
41.2
%34
.1%
7.1%
5.7%
8.6%
4.9%
3.3%
4.6%
1.4%
8.6%
1.7%
Sou
rce:
Tab
ulat
ions
from
EB
RI/I
CI P
artic
ipan
t-D
irec
ted
Ret
irem
ent P
lan
Dat
a C
olle
ctio
n P
roje
ct.
a T
he a
naly
sis
is b
ased
on
sam
ples
of 1
.2 m
illio
n pa
rtic
ipan
ts w
ith tw
o or
few
er y
ears
of t
enur
e in
199
8 an
d 4.
8 m
illio
n pa
rtic
ipan
ts w
ith tw
o or
few
er y
ears
of t
enur
e in
201
5.b M
inor
inve
stm
ent o
ptio
ns a
re n
ot s
how
n; th
eref
ore,
row
per
cent
age
s w
ill n
ot a
dd to
100
per
cent
. Per
cent
ages
are
dol
lar-
wei
ghte
d av
erag
es.
c A
targ
et-d
ate
fund
typi
cally
reb
alan
ces
its p
ortfo
lio to
bec
ome
less
focu
sed
on g
row
th a
nd m
ore
focu
sed
on in
com
e as
it a
ppro
ache
s an
d pa
sses
the
targ
et d
ate
of th
e fu
nd, w
hich
is u
sual
ly in
clud
ed in
the
fund
’s n
ame.
d G
ICs
are
guar
ante
ed in
vest
men
t con
trac
ts.
Not
e: “
Fun
ds”
incl
ude
mut
ual f
unds
, ban
k co
llect
ive
trus
ts, l
ife in
sura
nce
sepa
rate
acc
ount
s, a
nd a
ny p
oole
d in
vest
men
t pro
duct
pri
mar
ily in
vest
ed in
the
secu
rity
indi
cate
d.
Fig
ure
40
Ave
rag
e A
sset
Allo
cati
on
of
401(
k) P
lan
Acc
ou
nts
, by
Par
tici
pan
t A
ge
Am
on
g
R
ecen
tly
Hir
ed 4
01(k
) P
lan
Par
tici
pan
ts W
ith
Tw
o o
r F
ewer
Yea
rs o
f T
enu
reP
erce
ntag
e of
acc
ount
bal
ance
s,b 1
998
and
2015
Bal
ance
d F
unds
Com
pany
Fun
dsT
otal
Fun
dsF
unds
Sta
ble-
Val
ue F
unds
Sto
ck
Equ
ity
Bon
dM
oney
GIC
sd and
Oth
er
Age G
roup
1998
1999
2000
2001
2002
2003
2004
2005
2006
2007
2008
2009
2010
20
11
2012
2013
2014
2015
20s
60.8
%61.1
%60.5
%58.1
%53.9
%49.6
%49.8
%45.4
%40.0
%35.4
%32.9
%32.3
%30.3
%26.2
%23.0
%27.9
%26.9
%24.4
%
30s
61.9
%62.3
%61.6
%60.0
%57.2
%53.3
%52.3
%47.6
%43.6
%40.4
%37.4
%36.2
%33.6
%30.0
%26.4
%30.7
%29.2
%27.4
%
40s
59.8
%60.6
%59.5
%58.8
%55.9
%52.6
%52.0
%47.3
%43.6
%40.7
%37.9
%37.0
%34.4
%31.4
%27.5
%31.3
%29.1
%26.7
%
50s
57.6
%58.8
%57.4
%57.9
%53.9
%51.2
%49.5
%45.2
%42.3
%39.6
%37.8
%37.6
%34.4
%31.3
%26.9
%30.8
%29.1
%25.7
%
60s
54.1
%55.5
%53.6
%55.7
%51.0
%49.5
%47.8
%43.9
%40.4
%38.4
%38.7
%40.5
%36.8
%30.8
%26.7
%30.0
%27.6
%23.3
%
All
60.5
%61.0
%60.0
%58.7
%55.3
%51.6
%51.0
%46.3
%42.0
%38.7
%36.2
%35.5
%33.0
%29.3
%25.7
%29.9
%28.3
%25.7
%S
ourc
e:
Tab
ula
tio
ns
fro
m E
BR
I/IC
I Pa
rtic
ipa
nt-
Dir
ec
ted
Re
tire
me
nt
Pla
n D
ata
Co
llecti
on P
roje
ct.
Re
ce
ntl
y H
ire
d 4
01(k
) P
art
icip
an
ts T
en
d t
o B
e L
ess L
ike
ly t
o H
old
Co
mp
an
y S
tock
Fig
ure
41
Perc
enta
ge o
f re
cently h
ired p
art
icip
ants
offe
red a
nd h
old
ing c
om
pany s
tock,
by p
art
icip
ant
age,1
998–2015
No
te: T
he
an
aly
sis
inc
lud
es
40
1(k)
pla
n p
art
icip
an
ts w
ith t
wo
or fe
we
r ye
ars
of
tenu
re in
th
e y
ear
ind
ica
ted
an
d in
a p
lan
off
erin
g c
om
pa
ny
sto
ck
as a
n in
ve
stm
en
t o
pti
on
.
ebri.org Issue Brief • August 3, 2017 • No. 436 42

12.4
%
13.5
%
12.9
%
11.6
%
8.4%
7.5%
6.4%
5.5%
4.5%
4.0%
4.3%
3.9% 5.
1%
4.0% 5.
6% 6.4%
6.1%
6.3%
8.9%
10.3
%
10.3
%
11.1
%
8.3%
8.4%
8.2%
5.7%
4.8%
3.9% 3.8%
4.1%
4.1%
3.4% 2.
8%
3.7%
3.3%
2.6%
0%
5%
10%
15%
20%
25%
1998 1999 2000 2001 2002 2003 2004 2005 2006 2007 2008 2009 2010 2011 2012 2013 2014 2015
>50-90%
>90%
21.3%
23.8%23.2%
16.7%
14.6%
11.2%
Share of Participant's Account Balance Held in Company Stock
7.4%7.9%
22.7%
15.9%
9.3%
Figure 42New 401(k) Participants Tend Not to Hold High Concentrations in Company Stock
Percentage of recently hired participants offered company stock holding the percentage of their account balance indicated in company stock, 1998–2015
8.1% 8.0%
9.2%
4
9.4% 8.9%8.4%
10.1%
Source: Tabulations from EBRI/ICI Participant-Directed Retirement Plan Data Collection Project.Note: The analysis includes 401(k) plan participants with two or fewer years of tenure in the year indicated and in a plan offering company stock as an investment option.
AgeGroup Zero 1–10% 11–20% 21–30% 31–40% 41–50% 51–60% 61–70% 71–80% 81–90% 91–100%
20s 75.6% 4.2% 3.5% 3.6% 2.1% 1.4% 1.4% 0.6% 0.4% 0.2% 7.0%30s 72.6% 6.1% 4.6% 4.5% 2.3% 1.6% 1.4% 0.6% 0.4% 0.3% 5.7%40s 73.3% 5.9% 4.8% 3.9% 2.2% 1.5% 1.4% 0.6% 0.4% 0.3% 5.6%50s 74.3% 5.6% 4.4% 3.6% 2.0% 1.3% 1.4% 0.5% 0.3% 0.2% 6.3%60s 76.7% 4.4% 3.6% 2.9% 1.7% 1.1% 1.2% 0.4% 0.3% 0.2% 7.3%All 74.3% 5.2% 4.1% 3.8% 2.2% 1.4% 1.4% 0.6% 0.4% 0.3% 6.3%
Source: Tabulations from EBRI/ICI Participant-Directed Retirement Plan Data Collection Project.a The analysis includes the 1.3 million participants with two or fewer years of tenure in 2015 and in plans offering company stock as an investment option.b Row percentages may not add to 100 percent because of rounding.
Figure 43Asset Allocation Distribution of Recently Hired 401(k) Participant Account Balance
to Company Stock in 401(k) Plans With Company Stock, by Participant AgePercentage of recently hired participants in plans
offering company stock as an investment option,a,b 2015Percentage of Account Balance Invested in Company Stock
ebri.org Issue Brief • August 3, 2017 • No. 436 43

23%
18% 17% 17% 18% 18% 18% 17% 18% 19% 19% 18%
Number of Participants in Plan
Figure 45Percentage of Eligible 401(k) Plan Participants
With 401(k) Plan Loans, by Plan Size, 2015
Source: Tabulations from EBRI/ICI Participant-Directed Retirement Plan Data Collection Project.
ebri.org Issue Brief • August 3, 2017 • No. 436 44

14%
13% 13% 13%
12% 12%
11% 11%
12%
1–100 101–250 251–500 501–1,000 1,001–2,500 2,501–5,000 5,001–10,000 >10,000 All Plans
Number of Participants in Plan
Figure 46401(k) Loan Balances as a Percentage of 401(k) Plan Account
Balances for Participants With 401(k) Loans, by Plan Size, 2015
Source: Tabulations from EBRI/ICI Participant-Directed Retirement Plan Data Collection Project.
18% 18%17%
19%18% 18%
21% 21% 21% 21% 21%20%
18%
16%
14%
16%
13%12%
16%15%
14% 14%13%
12%11%
12%
1996 2000 2002 2005 2007 2008 2009 2010 2011 2012 2013 2014 2015
Figure 47Few 401(k) Participants Had Outstanding 401(k) Loans;
Loans Tended to Be Small, Selected Years
Percentage of eligible 401(k) participants with outstanding 401(k) loans
Loan as a percentage of the remaining 401(k) account balance
Source: Tabulations from the EBRI/ICI 401(k) Participant-Directed Retirement Plan Data Collection Project.
ebri.org Issue Brief • August 3, 2017 • No. 436 45

1996
2000
2002
2005
2007
2008
2009
2010
2011
2012
2013
2014
2015
All
18%
18%
17%
19%
18%
18%
21%
21%
21%
21%
21%
20%
18%
Age
Gro
up20
s12
%11
%10
%11
%10
%10
%13
%13
%13
%13
%12
%11
%8%
30s
20%
19%
18%
20%
20%
20%
23%
23%
22%
23%
23%
22%
19%
40s
22%
21%
20%
22%
22%
22%
26%
26%
25%
26%
27%
26%
24%
50s
17%
17%
17%
19%
19%
19%
22%
22%
22%
23%
23%
23%
21%
60s
9%9%
9%10
%10
%11
%12
%13
%13
%14
%14
%13
%13
%Te
nure
(yea
rs)
0–2
6%5%
4%5%
7%6%
9%7%
5%6%
9%9%
8%>2
–515
%14
%12
%14
%15
%15
%17
%18
%18
%18
%19
%19
%17
%>5
–10
24%
23%
21%
22%
23%
23%
25%
27%
26%
27%
28%
26%
24%
>10–
2027
%26
%26
%26
%26
%26
%29
%29
%29
%30
%30
%28
%27
%>2
0–30
25%
26%
25%
24%
24%
25%
27%
26%
26%
28%
28%
26%
25%
>30
13%
16%
15%
17%
17%
18%
19%
19%
19%
20%
20%
18%
17%
Acc
ount
Siz
e<$
10,0
0012
%11
%11
%12
%11
%12
%16
%16
%15
%15
%14
%13
%11
%$1
0,00
0–$2
0,00
026
%23
%22
%26
%25
%26
%28
%29
%30
%30
%30
%28
%26
%>$
20,0
00–$
30,0
0026
%25
%22
%27
%26
%26
%28
%29
%30
%31
%31
%30
%28
%>$
30,0
00–$
40,0
0025
%25
%23
%26
%26
%26
%28
%28
%29
%30
%31
%30
%28
%>$
40,0
00–$
50,0
0024
%25
%23
%25
%26
%25
%27
%27
%27
%29
%30
%29
%28
%>$
50,0
00–$
60,0
0024
%24
%22
%24
%25
%24
%25
%26
%26
%28
%29
%28
%27
%>$
60,0
00–$
70,0
0023
%24
%22
%23
%24
%23
%25
%25
%25
%27
%28
%27
%27
%>$
70,0
00–$
80,0
0026
%23
%22
%22
%23
%22
%24
%24
%24
%26
%27
%27
%26
%>$
80,0
00–$
90,0
0023
%23
%21
%21
%23
%21
%23
%23
%23
%25
%26
%26
%25
%>$
90,0
00–$
100,
000
22%
22%
21%
20%
22%
20%
23%
22%
22%
24%
26%
25%
25%
>$10
0,00
0–$2
00,0
0022
%20
%19
%18
%19
%18
%19
%19
%19
%21
%23
%23
%22
%>$
200,
000
18%
15%
13%
13%
13%
12%
13%
12%
12%
13%
15%
14%
14%
Sal
ary
Ran
ge$2
0,00
0–$4
0,00
018
%17
%13
%19
%20
%19
%24
%22
%25
%25
%21
%23
%22
%>$
40,0
00–$
60,0
0020
%23
%21
%26
%28
%27
%30
%26
%26
%28
%27
%28
%27
%>$
60,0
00–$
80,0
0018
%23
%20
%24
%24
%24
%26
%23
%22
%25
%22
%24
%23
%>$
80,0
00–$
100,
000
17%
21%
17%
22%
21%
20%
23%
20%
19%
21%
19%
21%
20%
>$10
0,00
014
%16
%13
%16
%14
%14
%16
%14
%14
%16
%15
%16
%15
%So
urce
: Tab
ulat
ions
from
EBR
I/IC
I Par
ticip
ant-D
irect
ed R
etire
men
t Pla
n D
ata
Col
lect
ion
Proj
ect.
Not
e: T
he te
nure
var
iabl
e is
gen
eral
ly y
ears
wor
king
at c
urre
nt e
mpl
oyer
, and
thus
may
ove
rsta
te y
ears
of p
artic
ipat
ion
in th
e 40
1(k)
pla
n.
Figu
re 4
8
Per
cent
age
of E
ligib
le 4
01(k
) Par
ticip
ants
With
401
(k) L
oans
, by
Par
ticip
ant A
ge, T
enur
e, A
ccou
nt S
ize,
or S
alar
y, S
elec
ted
Year
s
401(
k) L
oan
Act
ivit
y V
arie
d A
cro
ss 4
01(k
) P
lan
Par
tici
pan
ts
ebri.org Issue Brief • August 3, 2017 • No. 436 46

$6,717 $6,815$6,856$6,644 $6,659
$6,839 $6,946 $6,821
$7,292 $7,495$7,191 $7,346
$6,846$7,027 $7,153
$7,421$7,780
$7,982
$3,9
02 $4,4
00
$3,8
24
$3,6
59
$3,7
00
$3,8
32
$3,8
93
$3,6
61 $4,0
89
$4,1
67
$3,8
89
$3,9
72
$3,6
19
$3,7
85
$3,8
58
$3,9
73
$4,2
39
$4,3
59
1998 1999 2000 2001 2002 2003 2004 2005 2006 2007 2008 2009 2010 2011 2012 2013 2014 2015
Average Median
Source: Tabulations from EBRI/ICI Participant-Directed Retirement Plan Data Collection Project.Note: Average and median 401(k) loan amounts are calculated among participants with 401(k) loans at year-end.
Figure 49401(k) Loan Balances
Average and median loan balances for 401(k) participants with 401(k) loans, 1998–2015
ebri.org Issue Brief • August 3, 2017 • No. 436 47

1996 2000 2002 2005 2007 2008 2009 2010 2011 2012 2013 2014 2015All 16% 14% 16% 13% 12% 16% 15% 14% 14% 13% 12% 11% 12%Age Group
20s 30% 30% 28% 24% 25% 29% 26% 24% 26% 25% 26% 26% 25%30s 22% 20% 22% 19% 19% 25% 22% 20% 21% 20% 19% 18% 19%40s 16% 15% 16% 13% 13% 18% 16% 15% 16% 15% 13% 13% 13%50s 12% 11% 12% 10% 10% 13% 12% 11% 11% 11% 10% 9% 9%60s 10% 9% 10% 8% 8% 11% 10% 9% 9% 9% 8% 8% 8%
Tenure (years)0–2 27% 24% 27% 23% 21% 25% 22% 19% 21% 22% 17% 16% 19%>2–5 24% 25% 25% 21% 22% 26% 23% 20% 21% 21% 19% 18% 19%>5–10 23% 21% 23% 19% 18% 24% 20% 19% 20% 18% 17% 16% 16%>10–20 15% 14% 16% 13% 13% 17% 16% 14% 15% 14% 12% 12% 12%>20–30 11% 10% 11% 9% 8% 12% 11% 9% 10% 9% 8% 8% 7%>30 7% 8% 10% 8% 7% 9% 9% 7% 7% 7% 6% 6% 6%
Account Size<$10,000 39% 39% 37% 35% 36% 39% 39% 35% 37% 38% 41% 42% 38%$10,000–$20,000 32% 32% 31% 29% 30% 33% 31% 28% 30% 30% 31% 32% 31%>$20,000–$30,000 28% 28% 28% 25% 26% 29% 27% 25% 27% 26% 27% 28% 27%>$30,000–$40,000 23% 24% 25% 22% 23% 26% 25% 23% 24% 24% 24% 24% 24%>$40,000–$50,000 22% 21% 22% 20% 21% 24% 22% 20% 21% 21% 21% 21% 22%>$50,000–$60,000 19% 19% 20% 18% 19% 21% 21% 19% 19% 19% 19% 19% 20%>$60,000–$70,000 16% 17% 18% 16% 17% 19% 19% 17% 18% 17% 17% 17% 18%>$70,000–$80,000 16% 15% 16% 15% 16% 18% 17% 16% 16% 16% 16% 16% 16%>$80,000–$90,000 14% 14% 15% 14% 14% 16% 16% 15% 15% 15% 14% 14% 15%>$90,000–$100,000 13% 13% 13% 13% 13% 15% 15% 14% 14% 14% 13% 13% 13%>$100,000–$200,000 10% 9% 10% 9% 10% 11% 11% 10% 11% 10% 10% 10% 10%>$200,000 5% 5% 5% 4% 5% 5% 5% 5% 5% 5% 4% 4% 4%
Salary Range$20,000–40,000 17% 19% 18% 18% 17% 21% 19% 17% 17% 17% 16% 14% 15%>$40,000–$60,000 17% 16% 16% 16% 15% 19% 17% 15% 16% 15% 13% 12% 13%>$60,000–$80,000 15% 13% 14% 13% 12% 17% 14% 13% 13% 13% 11% 11% 12%>$80,000–$100,000 14% 12% 12% 11% 11% 14% 12% 11% 12% 11% 10% 10% 10%>$100,000 14% 10% 10% 9% 9% 11% 10% 9% 9% 9% 7% 7% 8%
Source: Tabulations from EBRI/ICI Participant-Directed Retirement Plan Data Collection Project.Note: The tenure variable is generally years working at current employer, and thus may overstate years of participation in the 401(k) plan.
Figure 50401(k) Loan Amounts Varied Across 401(k) Participants
401(k) Loan Balances as a Percentage of 401(k) Plan Account Balances for Participants With Loans, by Participant Age, Tenure,
Account Size, or Salary, Selected Years
401(k) Loan as a Percentage of Remaining 401(k) PlanAccount Balance 20s 30s 40s 50s 60s AllZero 92% 81% 76% 79% 87% 82%1–10% 2% 5% 8% 9% 6% 7%>10%–20% 2% 4% 5% 5% 2% 4%>20–30% 1% 3% 3% 3% 1% 2%>30–80% 3% 6% 7% 4% 2% 5%>80% 0% 1% 1% 1% 0% 1%Source: Tabulations from EBRI/ICI Participant-Directed Retirement Plan Data Collection Project.Components may not add to 100 percent because of rounding.
Figure 51Loans From 401(k) Plans Tended to Be Small
Percentage of eligible participants, by participant age, 2015
Age Group
ebri.org Issue Brief • August 3, 2017 • No. 436 48

ebri.org Issue Brief • August 3, 2017 • No. 436 49
References
Aon. 2016. 2016 Universe Benchmarks. Lincolnshire, IL: Aon plc.
Barclays Capital US Aggregate Bond Index. San Francisco: Barclays Global Investors.
Bloomberg Data. New York: Bloomberg L.P.
Brady, Peter. 2010. “Measuring Retirement Resource Adequacy.” Journal of Pension Economics and Finance 9, no. 2
(April): 235–262.
. 2016. How America Supports Retirement: Challenging the Conventional Wisdom on Who Benefits. Washington,
DC: Investment Company Institute. Available at www.ici.org/pdf/rpt_16_america_ supports_retirement.pdf
Brady, Peter, Steven Bass, Jessica Holland, and Kevin Pierce. “Using Panel Tax Data to Examine the Transition to
Retirement.” SOI Working Paper (April). Washington, DC: Internal Revenue Service. Available at
www.irs.gov/pub/irs-soi/17rptransitionretirement.pdf
Brady, Peter, and Michael Bogdan. 2010. “A Look at Private-Sector Retirement Plan Income After ERISA.” Investment
Company Institute Research Perspective 16, no. 2 (November). Available at www.ici.org/pdf/per16-02.pdf
. 2016. “A Look at Private-Sector Retirement Plan Income After ERISA.” ICI Research Perspective 22, no. 8
(December). Available at www.ici.org/pdf/per22-08.pdf
Brady, Peter, Kimberly Burham, and Sarah Holden. 2012. The Success of the U.S. Retirement System (December).
Washington, DC: Investment Company Institute. Available at www.ici.org/pdf/ppr_12_success_retirement.pdf
BrightScope and Investment Company Institute. 2016. The BrightScope/ICI Defined Contribution Plan Profile: A
Close Look at 401(k) Plans, 2014. San Diego, CA: BrightScope and Washington, DC: Investment Company Institute.
Available at www.ici.org/pdf/ppr_16_dcplan_profile_401k.pdf
Holden, Sarah, Daniel Schrass, and Michael Bogdan. 2016. “Ownership of Mutual Funds, Shareholder Sentiment, and
Use of the Internet, 2016.” ICI Research Perspective 22, no. 6 (October). Available at www.ici.org/pdf/per22-
06.pdf
Choi, James J., David Laibson, Brigitte C. Madrian, and Andrew Metrick. 2001. “Defined Contribution Pensions: Plan
Rules, Participant Decisions, and the Path of Least Resistance.” NBER Working Paper, no. 8655 (December).
Cambridge, MA: National Bureau of Economic Research. Available at www.nber.org/papers/w8655
Congressional Budget Office. 2016a. CBO’s 2016 Long-Term Projections for Social Security: Additional Information
(December). Washington, DC: Congressional Budget Office. Available at www.cbo.gov/sites/default/files/114th-
congress-2015-2016/reports/52298-socialsecuritychartbook.pdf
. 2016b. CBO’s 2016 Long-Term Projections for Social Security: Supplemental Data (December). Washington,
DC: Congressional Budget Office. Available at www.cbo.gov/sites/default/files/114th-congress-2015-
2016/reports/52298-supplementaldata.xlsx
Copeland, Craig. 2011. “Target-Date Fund Use in 401(k) Plans and the Persistence of Their Use, 2007–2009.” EBRI
Issue Brief, no. 361 (August). Available at www.ebri.org/pdf/briefspdf/EBRI_IB_08-2011_No361_TDFs.pdf
Deloitte Consulting LLP, International Foundation of Employee Benefit Plans, and the International Society of Certified
Employee Benefit Specialists. 2015. Annual Defined Benefit Benchmarking Survey: 2015 Edition. New York: Deloitte
Consulting LLP. Available at www2.deloitte.com/content/dam/Deloitte/us/Documents/human-capital/us-hc-annual-
defined-benchmarking-survey-2015.pdf

ebri.org Issue Brief • August 3, 2017 • No. 436 50
Employee Benefit Research Institute. 2005. “History of 401(k) Plans: An Update.” Facts from EBRI (February).
Washington, DC: Employee Benefit Research Institute. Available at
www.ebri.org/pdf/publications/facts/0205fact.a.pdf
Gustman, Alan L., and Thomas L. Steinmeier. 2008. “How Changes in Social Security Affect Recent Retirement Trends.”
NBER Working Paper, no. 14105 (June). Cambridge, MA: National Bureau of Economic Research. Available at
www.nber.org/papers/w14105
. 2013. “Effects of Social Security Policies on Benefit Claiming, Retirement, and Saving.” NBER Working Paper,
no. 19071 (May). Cambridge, MA: National Bureau of Economic Research. Available at
www.nber.org/papers/w19071
Holden, Sarah, Peter Brady, and Michael Hadley. 2006. “401(k) Plans: A 25-Year Retrospective.” Investment Company
Institute Research Perspective 12, no. 2 (November). Available at www.ici.org/pdf/per12-02.pdf
Holden, Sarah, Daniel Schrass, and Michael Bogdan. 2017. “American Views on Defined Contribution Plan Saving,
2016.” ICI Research Report. Washington, DC: Investment Company Institute (February). Available at
www.ici.org/pdf/ppr_17_dc_plan_saving.pdf
Holden, Sarah, and Daniel Schrass. 2017. “Defined Contribution Plan Participants’ Activities, 2016.” ICI Research Report
(June). Available at www.ici.org/pdf/ppr_16_rec_survey_q4.pdf
Holden, Sarah, and Jack VanDerhei. 2001a. “401(k) Plan Asset Allocation, Account Balances, and Loan Activity in 1999.”
Investment Company Institute Perspective 7, no. 1 (January), and EBRI Issue Brief, no. 230 (February). Available
at www.ici.org/pdf/per07-01.pdf and www.ebri.org/pdf/briefspdf/0201ib.pdf
. 2001b. “The Impact of Employer-Selected Investment Options on 401(k) Plan Participants’ Asset Allocations:
Preliminary Findings.” Working paper prepared for the Center for Pension and Retirement Research (CPRR) Current
Pension Policy Issues Conference, at Miami University, Oxford, OH, June 8–9, 2001.
. 2001c. “Contribution Behavior of 401(k) Plan Participants.” Investment Company Institute Perspective 7, no. 4,
and EBRI Issue Brief, no. 238 (October). Available at www.ici.org/pdf/per07-04.pdf and
www.ebri.org/pdf/briefspdf/1001ib.pdf
. 2002. “Can 401(k) Accumulations Generate Significant Income for Future Retirees?” Investment Company
Institute Perspective 8, no. 3, and EBRI Issue Brief, no. 251 (November). Available at www.ici.org/pdf/per08-03.pdf
and www.ebri.org/pdf/briefspdf/1102ib.pdf
. 2003. “401(k) Plan Asset Allocation, Account Balances, and Loan Activity in 2002.” Investment Company
Institute Perspective 9, no. 5, and EBRI Issue Brief, no. 261 (September). Available at www.ici.org/pdf/per09-
05.pdf and www.ebri.org/pdf/briefspdf/0903ib.pdf
. 2004a. “401(k) Plan Asset Allocation, Account Balances, and Loan Activity in 2003.” Investment Company
Institute Perspective 10, no. 2, and EBRI Issue Brief, no. 272 (August). Available at www.ici.org/pdf/per10-02.pdf
and www.ebri.org/pdf/briefspdf/0804ib1.pdf
.. 2004b. “Appendix: Additional Figures for the EBRI/ICI Participant-Directed Retirement Plan Data Collection
Project for Year-End 2003.” Investment Company Institute Perspective 10, no. 2A (August). Available at
www.ici.org/pdf/per10-02_appendix.pdf
. 2004c. “Contribution Behavior of 401(k) Plan Participants During Bull and Bear Markets.” National Tax
Association Proceedings, Ninety-Sixth Annual Conference on Taxation, November 13–15, 2003, Chicago: 44–53.
Washington, DC: National Tax Association.

ebri.org Issue Brief • August 3, 2017 • No. 436 51
. 2005. “The Influence of Automatic Enrollment, Catch-Up, and IRA Contributions on 401(k) Accumulations at
Retirement.” Investment Company Institute Perspective 11, no. 2, and EBRI Issue Brief, no. 283 (July). Available at
www.ici.org/pdf/per11-02.pdf and www.ebri.org/pdf/briefspdf/ebri_ib_07-20054.pdf
Holden, Sarah, Jack VanDerhei, and Luis Alonso. 2009. “401(k) Plan Asset Allocation, Account Balances, and Loan
Activity in 2008.” Investment Company Institute Research Perspective 15, no. 2, and EBRI Issue Brief, no. 335
(October). Available at www.ici.org/pdf/per15-02.pdf and www.ebri.org/pdf/briefspdf/EBRI_IB_10-2009_No335_K-
Update.pdf
. 2010. “401(k) Plan Asset Allocation, Account Balances, and Loan Activity in 2009.” Investment Company
Institute Research Perspective 16, no. 3, and EBRI Issue Brief, no. 350 (November). Available at
www.ici.org/pdf/per16-03.pdf and www.ebri.org/pdf/briefspdf/EBRI_IB_011-2010_No350_401k_Update-09.pdf
Holden, Sarah, Jack VanDerhei, Luis Alonso, and Steven Bass. 2011. “401(k) Plan Asset Allocation, Account Balances,
and Loan Activity in 2010.” ICI Research Perspective 17, no. 10, and EBRI Issue Brief, no. 366 (December).
Available at www.ici.org/pdf/per17-10.pdf and www.ebri.org/pdf/briefspdf/EBRI_IB_12-2011_No366_401(k)-
Update.pdf
. 2012. “401(k) Plan Asset Allocation, Account Balances, and Loan Activity in 2011.” ICI Research Perspective
18, no. 9, and EBRI Issue Brief, no. 380 (December). Available at www.ici.org/pdf/per18-09.pdf and
www.ebri.org/pdf/briefspdf/EBRI_IB_12-2012_No380.401k-eoy2011.pdf
. 2013. “401(k) Plan Asset Allocation, Account Balances, and Loan Activity in 2012.” ICI Research Perspective
19, no. 12, and EBRI Issue Brief, no. 394 (December). Available at www.ici.org/pdf/per19-12.pdf and
www.ebri.org/pdf/briefspdf/EBRI_IB_012-13.No394.401k-Update-2012.pdf
. 2016a. “401(k) Plan Asset Allocation, Account Balances, and Loan Activity in 2014.” ICI Research Perspective
22, no. 3, and EBRI Issue Brief, no. 423 (April). Available at www.ici.org/pdf/per22-03.pdf and
www.ebri.org/pdf/briefspdf/EBRI_IB_423.Apr16.401k-Update.pdf
. 2016b. “What Does Consistent Participation in 401(k) Plans Generate? Changes in 401(k) Plan Account
Balances, 2010–2014.” ICI Research Perspective 22, no. 5 and EBRI Issue Brief, no. 426 (September). Available at
www.ici.org/pdf/per22-05.pdf and www.ebri.org/pdf/briefspdf/EBRI_IB_426.Sept16.Consist-Ks.pdf.
Holden, Sarah, Jack VanDerhei, Luis Alonso, Steven Bass, and AnnMarie Pino. 2014. “401(k) Plan Asset Allocation,
Account Balances, and Loan Activity in 2013.” ICI Research Perspective 20, no. 10, and EBRI Issue Brief, no. 408
(December). Available at www.ici.org/pdf/per20-10.pdf and
www.ebri.org/pdf/briefspdf/EBRI_IB_408_Dec14.401(k)-update.pdf.
Holden, Sarah, Jack VanDerhei, Luis Alonso, and Craig Copeland. 2008. “401(k) Plan Asset Allocation, Account
Balances, and Loan Activity in 2007.” Investment Company Institute Research Perspective 14, no. 3, and EBRI
Issue Brief, no. 324 (December). Available at www.ici.org/pdf/per14-03.pdf and
www.ebri.org/pdf/briefspdf/EBRI_IB_12a-2008.pdf
Holden, Sarah, Jack VanDerhei, and Carol Quick. 2000. “401(k) Plan Asset Allocation, Account Balances, and Loan
Activity in 1998.” Investment Company Institute Perspective 6, no. 1 (January), and EBRI Issue Brief, no. 218
(February). Available at www.ici.org/pdf/per09-05.pdf and www.ebri.org/pdf/briefspdf/0200ib.pdf
Ibbotson, Roger G., Roger J. Grabowski, James P. Harrington, and Carla Nunes. 2016. 2016 SBBI Yearbook: Stocks,
Bonds, Bills, and Inflation—U.S. Capital Markets Performance by Asset Class 1926–2015. Hoboken: John Wiley &
Sons, Inc.
Investment Company Institute. Quarterly Supplementary Data. Washington, DC: Investment Company Institute.
ebri.org Issue Brief • August 3, 2017 • No. 436 52
. 2017. “The U.S. Retirement Market, First Quarter 2017” (June). Available at
www.ici.org/info/ret_17_q1_data.xls
MacDonald, Bonnie-Jeanne, and Kevin D. Moore. 2011. “Moving Beyond the Limitations of Traditional Replacement
Rates.” Society of Actuaries (September). Available at www.soa.org/research/research-projects/pension/research-
moving-beyond.aspx
Mitchell, Olivia S., and Stephen Utkus. 2012. “Target Date Funds in 401(k) Retirement Plans.” NBER Working Paper, no.
17911 (March). Cambridge, MA: National Bureau of Economic Research. Available at www.nber.org/papers/w17911
Morningstar. 2015. Morningstar Lifetime Allocation Indexes—U.S. Investors (June). Chicago: Morningstar, Inc. Available
at corporate.morningstar.com/us/documents/Indexes/AssetAllocationsSummary.pdf
Plan Sponsor Council of America. 2016. 59th Annual Survey of Profit Sharing and 401(k) Plans: Reflecting 2015 Plan
Experience. Chicago: Plan Sponsor Council of America.
Poterba, James, Steven F. Venti, and David A. Wise. 2007. “Rise of 401(k) Plans, Lifetime Earnings, and Wealth at
Retirement.” NBER Working Paper, no. 13091 (May). Cambridge, MA: National Bureau of Economic Research.
Available at www.nber.org/papers/w13091.
Russell 2000 Index. Tacoma, WA: Frank Russell Company. S&P 500. New York: Standard & Poor’s.
U.S. Department of Labor, Bureau of Labor Statistics. 2012. National Compensation Survey: Employee Benefits in the
United States, March 2012. Washington, DC: U.S. Department of Labor, Bureau of Labor Statistics. Available at
www.bls.gov/ncs/ebs/benefits/2012/ebbl0050.pdf
. 2013. National Compensation Survey: Employee Benefits in the United States, March 2013. Washington, DC:
U.S. Department of Labor, Bureau of Labor Statistics. Available at
www.bls.gov/ncs/ebs/benefits/2013/ebbl0052.pdf
. 2014. National Compensation Survey: Employee Benefits in the United States, March 2014. Washington, DC:
U.S. Department of Labor, Bureau of Labor Statistics. Available at
www.bls.gov/ncs/ebs/benefits/2014/ebbl0055.pdf.
. 2015. National Compensation Survey: Employee Benefits in the United States, March 2015. Washington, DC:
U.S. Department of Labor, Bureau of Labor Statistics. Available at
www.bls.gov/ncs/ebs/benefits/2015/ebbl0057.pdf.
. 2016. National Compensation Survey: Employee Benefits in the United States, March 2016. Washington, DC:
U.S. Department of Labor, Bureau of Labor Statistics. Available at
www.bls.gov/ncs/ebs/benefits/2016/ebbl0059.pdf
U.S. Department of Labor, Employee Benefits Security Administration. 2012a. Private Pension Plan Bulletin, Abstract of
2005 Form 5500 Annual Reports (Version 1.1). Washington, DC: U.S. Department of Labor, Employee Benefits
Security Administration (March). Available at www.dol.gov/sites/default/files/ebsa/researchers/statistics/retirement-
bulletins/2005pensionplanbulletin.pdf
.. 2012b. Private Pension Plan Bulletin, Abstract of 2006 Form 5500 Annual Reports (Version 1.1). Washington,
DC: U.S. Department of Labor, Employee Benefits Security Administration (March). Available at
www.dol.gov/sites/default/files/ebsa/researchers/statistics/retirement-bulletins/2006pensionplanbulletin.pdf
. 2012c. Private Pension Plan Bulletin, Abstract of 2007 Form 5500 Annual Reports (Version 1.5). Washington,
DC: U.S. Department of Labor, Employee Benefits Security Administration (March). Available at
www.dol.gov/sites/default/files/ebsa/researchers/statistics/retirement-bulletins/2007pensionplanbulletin.pdf

ebri.org Issue Brief • August 3, 2017 • No. 436 53
. 2012d. Private Pension Plan Bulletin, Abstract of 2008 Form 5500 Annual Reports (Version 1.2). Washington,
DC: U.S. Department of Labor, Employee Benefits Security Administration (March). Available at
www.dol.gov/sites/default/files/ebsa/researchers/statistics/retirement-bulletins/2008pensionplanbulletin.pdf
. 2012e. Private Pension Plan Bulletin, Abstract of 2010 Form 5500 Annual Reports (Version 1.0). Washington,
DC: U.S. Department of Labor, Employee Benefits Security Administration (November). Available at
www.dol.gov/sites/default/files/ebsa/researchers/statistics/retirement-bulletins/2010pensionplanbulletin.pdf
.. 2014. Private Pension Plan Bulletin, Abstract of 2011 Form 5500 Annual Reports (Version 1.1). Washington,
DC: U.S. Department of Labor, Employee Benefits Security Administration (September). Available at
www.dol.gov/sites/default/files/ebsa/researchers/statistics/retirement-bulletins/2011pensionplanbulletin.pdf
. 2015a. Private Pension Plan Bulletin, Abstract of 2009 Form 5500 Annual Reports (Version 1.1). Washington,
DC: U.S. Department of Labor, Employee Benefits Security Administration (January). Available at
www.dol.gov/sites/default/files/ebsa/researchers/statistics/retirement-bulletins/2009pensionplanbulletin.pdf
. 2015b. Private Pension Plan Bulletin, Abstract of 2012 Form 5500 Annual Reports (Version 1.2). Washington,
DC: U.S. Department of Labor, Employee Benefits Security Administration (January). Available at
www.dol.gov/sites/default/files/ebsa/researchers/statistics/retirement-bulletins/2012pensionplanbulletin.pdf
. 2015c. Private Pension Plan Bulletin, Abstract of 2013 Form 5500 Annual Reports (Version 1.0). Washington,
DC: U.S. Department of Labor, Employee Benefits Security Administration (September). Available at
www.dol.gov/sites/default/files/ebsa/researchers/statistics/retirement-bulletins/2013pensionplanbulletin.pdf
. 2016a. Private Pension Plan Bulletin, Abstract of 2014 Form 5500 Annual Reports (Version 1.0). Washington,
DC: U.S. Department of Labor, Employee Benefits Security Administration (September). Available at
www.dol.gov/sites/default/files/ebsa/researchers/statistics/retirement-bulletins/private-pension-plan-bulletins-
abstract-2014.pdf
. 2016b. Private Pension Plan Bulletin Historical Tables and Graphs 1975–2014 (Version 1.0). Washington, DC:
U.S. Department of Labor, Employee Benefits Security Administration (September). Available at
www.dol.gov/ebsa/pdf/historicaltables.pdf
U.S. Government Accountability Office. 1997. “401(k) Pension Plans: Loan Provisions Enhance Participation but May
Affect Income Security for Some.” Letter Report, GAO/HEHS-98-5 (October). Washington, DC: U.S. Government
Accountability Office. Available at www.gao.gov/archive/1998/he98005.pdf
U.S. Internal Revenue Service. 1981. “Notice of Proposed Rule Making, Certain Cash or Deferred Arrangements Under
Employee Plans.” Federal Register 46, no. 217 (November 10): 55544–55549.
U.S. Joint Committee on Taxation. 2006. Technical Explanation of H.R. 4, the “Pension Protection Act of 2006” as
Passed by the House on July 28, 2006, and as Considered by the Senate on August 3, 2006. JCX-38-06 (August 3).
Washington, DC: U.S. Joint Committee on Taxation. Available at www.jct.gov/x-38-06.pdf
Utkus, Stephen P., and Jean A. Young. 2012. How America Saves 2012: A Report on Vanguard 2011 Defined
Contribution Plan Data. Valley Forge, PA: The Vanguard Group, Vanguard Center for Retirement Research.
Available at https://institutional.vanguard.com/iam/pdf/HAS12.pdf
. 2016. How America Saves 2016: Vanguard 2015 Defined Contribution Plan Data. Valley Forge, PA: The
Vanguard Group, Vanguard Center for Retirement Research. Available at
https://pressroom.vanguard.com/nonindexed/HAS2016_Final.pdf

ebri.org Issue Brief • August 3, 2017 • No. 436 54
. 2017. How America Saves 2017: Vanguard 2016 Defined Contribution Plan Data. Valley Forge, PA: The
Vanguard Group, Vanguard Center for Retirement Research. Available at
https://institutional.vanguard.com/iam/pdf/HAS17.pdf
VanDerhei, Jack L. 2002. “The Role of Company Stock in 401(k) Plans.” Written statement for the House Education and
Workforce Committee Subcommittee on Employer-Employee Relations Hearing on “Enron and Beyond: Enhancing
Worker Retirement Security” (February 13). Available at www.ebri.org/pdf/publications/testimony/t133.pdf
. 2010. “The Impact of Automatic Enrollment in 401(k) Plans on Future Retirement Accumulations: A Simulation
Study Based on Plan Design Modifications of Large Plan Sponsors.” EBRI Issue Brief, no. 341 (April). Available at
www.ebri.org/pdf/briefspdf/EBRI_IB_04-2010_No341_Auto-Enrl.pdf
. 2014. “Why Does Retirement Readiness Vary: Results from EBRI’s 2014 Retirement Security Projection
Model®.” Journal of Retirement 1, no. 4 (April): 95–117.
VanDerhei, Jack, and Craig Copeland. 2008. “The Impact of PPA on Retirement Savings for 401(k) Participants.” EBRI
Issue Brief, no. 318 (June). Available at www.ebri.org/pdf/briefspdf/ebri_ib_06-20087.pdf
VanDerhei, Jack, and Lori Lucas. 2010. “The Impact of Auto-Enrollment and Automatic Contribution Escalation on
Retirement Income Adequacy.” EBRI Issue Brief, no. 349 (November). Available at
www.ebri.org/pdf/briefspdf/EBRI_IB_011-2010_No349_EBRI_DCIIA.pdf

ebri.org Issue Brief • August 3, 2017 • No. 436 55
Endnotes
1 For data on 401(k) plan assets, participants, and plans through 2014, see U.S. Department of Labor, Employee Benefits
Security Administration 2016a and 2016b. For total retirement assets (including those in 401(k) plans) through the end of
2016, see Investment Company Institute 2017. For a discussion of trends between defined benefit (DB) and defined
contribution (DC) plans, see Poterba, Venti, and Wise 2007; Holden, Brady, and Hadley 2006; Brady and Bogdan 2010 and
2016; and Brady, Burham, and Holden 2012.
2 Before 2005, the U.S. Department of Labor private pension plan bulletins reported a count of active 401(k) plan participants
that had been adjusted from the number of active participants actually reported in the Form 5500 filings to exclude: (1)
individuals eligible to participate in a 401(k) plan who had not elected to have their employers make contributions; and (2)
nonvested former employees who had not (at the time the Form 5500 filings were submitted) incurred the break-in-service
period established by their plan (see U.S. Department of Labor, Employee Benefits Security Administration 2012a for further
detail). This change in methodology results in a dramatic increase in the number of individuals reported as active participants
in 401(k) plans; in 2004, the number of active participants increased to 53.1 million (new method) from 44.4 million (old
method; see U.S. Department of Labor, Employee Benefits Security Administration 2015d). As the U.S. Department of Labor
notes: “In a purely economic sense and for research purposes, individuals in these groups should not be included in the count
of active participants.” However, the form schedule needed to make the adjustment is no longer required. Using National
Compensation Survey data and historical relationships and trends evident in the Form 5500 data, EBRI and ICI estimate the
number of active 401(k) participants to be about 54 million in 2015 and the number of 401(k) plans to be about 550,000. The
estimate of the number of active 401(k) plan participants is based on a combination of data from U.S. Department of Labor,
Bureau of Labor Statistics 2012, 2013, 2014, 2015, and 2016; and U.S. Department of Labor, Employee Benefits Security
Administration 2012a, 2012b, 2012c, 2012d, 2012e, 2014, 2015a, 2015b, 2015c, and 2016a.
3 See Investment Company Institute 2017. At year-end 2016, 401(k) plans had $4.8 trillion in assets.
4 The Employee Benefit Research Institute (EBRI) is a nonprofit, nonpartisan, public policy research organization that does not
lobby or take positions on legislative proposals.
5 The Investment Company Institute (ICI) is the leading association representing regulated funds globally, including mutual
funds, exchange-traded funds (ETFs), closed-end funds, and unit investment trusts (UITs) in the United States, and similar
funds offered to investors in jurisdictions worldwide. ICI seeks to encourage adherence to high ethical standards, promote
public understanding, and otherwise advance the interests of funds, their shareholders, directors, and advisers. ICI’s members
manage total assets of U.S. $19.6 trillion in the United States, serving more than 95 million U.S. shareholders, and U.S. $5.6
trillion in assets in other jurisdictions. ICI carries out its international work through ICI Global, with offices in London, Hong
Kong, and Washington, DC.
6 This update extends previous findings from the project for 1996 through 2015. For year-end 2014 results, see Holden et al.
2016. Results for earlier years are available in earlier issues of ICI Research Perspective (www.ici.org/research/perspective)
and EBRI Issue Brief (www.ebri.org/publications/ib).
7 The EBRI/ICI 401(k) database environment is certified to be fully compliant with the ISO-27002 Information Security Audit
standard. Moreover, EBRI has obtained a legal opinion that the methodology used meets the privacy standards of the Gramm-
Leach-Bliley Act. At no time has any nonpublic personal information that is personally identifiable, such as a Social Security
number, been transferred to or shared with EBRI.
8 Account balances are net of unpaid loan balances. Thus, unpaid loan balances are not included in any of the eight asset
categories described.
9 The cross-sectional analysis for this publication found that consolidating the multiple accounts across a majority of the
providers to the single individual owning them resulted in an overall increase of 2.6 percent in the average 401(k) plan
account balance. This statistic should be interpreted with caution, as it may not represent the total 401(k) assets owned by

ebri.org Issue Brief • August 3, 2017 • No. 436 56
the individual. The impact of account consolidation varied with the participant’s age and tenure with the current employer.
The largest increases in average account balance occurred among older participants with fewer years of tenure. For example,
among participants in their 60s with two or fewer years of tenure, the average account balance increased 7.3 percent with the
consolidation of their multiple accounts. Among participants in their 50s or 60s with more than 30 years of tenure, the
average account balance increased 2.0 percent with the consolidation of their multiple accounts. Future joint research with
this feature will explore the longitudinal aspects of this consolidation in more detail.
10 This system of classification does not consider the number of distinct investment options presented to a given participant,
but rather the types of options presented. Preliminary research analyzing 1.4 million participants drawn from the 2000
EBRI/ICI 401(k) database suggests that the sheer number of investment options presented does not influence participants.
On average, participants have 10.4 distinct options but, on average, choose only 2.5 (Holden and VanDerhei 2001b). In
addition, the preliminary analysis found that 401(k) participants are not naive—that is, when given n options, they do not
divide their assets among all n. Indeed, less than 1 percent of participants followed a 1/n asset allocation strategy. Plan
Sponsor Council of America 2016 indicates that in 2015, the average number of investment fund options available for
participant contributions was 19 among more than 600 plans surveyed. Deloitte Consulting LLP, International Foundation of
Employee Benefit Plans, and the International Society of Certified Employee Benefit Specialists 2015 reports that the average
number of funds offered by the nearly 400 401(k) plan sponsors surveyed was 22 in 2015. BrightScope and Investment
Company Institute 2016 reports an average of 28 investment options in 2014, and an average of 22 investment options when
a target-date fund suite is counted as a single investment option.
11 The asset allocation path that the target-date fund follows to shift its focus from growth to income over time is typically
referred to as the glide path. Because discussions of asset allocation usually focus on the percentage of the portfolio invested
in equities, the glide path generally reflects the declining percentage of equities in the portfolio as it approaches and passes
the target date, which is usually indicated in the fund’s name. The target date generally is the date at which the typical
investor for whom that fund is designed would reach retirement age and stop making new investments in the fund.
12 Lifestyle funds maintain a predetermined risk level and generally use words such as “conservative,” “moderate,” or
“aggressive” in their name to indicate the fund’s risk level. Lifestyle funds generally are included in the non–target-date
balanced fund category.
13 GICs are insurance company products that guarantee a specific rate of return on the invested capital over the life of the
contract.
14 Other stable-value funds include synthetic GICs, which consist of a portfolio of fixed-income securities “wrapped” with a
guarantee (typically by an insurance company or a bank) to provide benefit payments according to the plan at book value.
15 Some recordkeepers supplying data were unable to provide complete asset allocation detail on certain pooled asset classes
for one or more of their clients. The final EBRI/ICI 401(k) database includes only plans for which at least 90 percent of all plan
assets could be identified.
16 The average account balance is calculated for the 19.4 million 401(k) plan participants who had account balances at both
year-end 2014 and year-end 2015.
17 For 401(k) asset figures, see Investment Company Institute 2017.
18 Estimates of the number of 401(k) plans and active participants are based on a combination of data from U.S. Department
of Labor, Bureau of Labor Statistics, and U.S. Department of Labor, Employee Benefits Security Administration reports. See
discussion in note 2.
19 The latest available data from the U.S. Department of Labor are for plan year 2014 (see U.S. Department of Labor,
Employee Benefits Security Administration 2016a).

ebri.org Issue Brief • August 3, 2017 • No. 436 57
20 For an analysis of the changes in account balances of consistent participants in the EBRI/ICI 401(k) database in the wake of
the financial crisis (over the six-year period from year-end 2007 to year-end 2014), see Holden et al. 2016b.
21 Because of these changes in the cross sections, comparing average account balances across different year-end cross-
sectional snapshots can lead to false conclusions. For example, newly formed plans would tend to pull down the average
account balance, but would tell us nothing about consistently participating workers. Similarly, the aggregate average account
balance would tend to be pulled down if a large number of participants retired.
22 Tabulations of the Survey of Consumer Finances reveal that about half of traditional IRA assets in 2013 resulted from
rollovers from employer-sponsored retirement plans.
23 At year-end 2015, 2.0 percent of the participants in the database were missing a birth date entry, were younger than 20, or
were older than 69. They were not included in this analysis.
24 At year-end 2015, 10.3 percent of the participants in the database were missing a date of hire entry and were not included
in this analysis.
25 The positive correlation between tenure and account balance is expected because long-term employees have had more time
to accumulate an account balance. However, a rollover from a previous employer’s plan could interfere with this positive
correlation because a rollover could give a short-tenured employee a high account balance. There is some discernible evidence
of rollover assets among the participants with account balances greater than $100,000, as 3 percent of them had two or fewer
years of tenure, and 6 percent of them had between two and five years of tenure (see Figure 12).
26 Because 401(k) plans were introduced nearly 35 years ago, older and longer-tenured employees would not have
participated in 401(k) plans for their entire careers. The Revenue Act of 1978 contained a provision that became Internal
Revenue Code Section 401(k). The law went into effect on January 1, 1980, but it was not until November 1981 that proposed
regulations were issued (see Holden, Brady, and Hadley 2006; Employee Benefit Research Institute 2005; and U.S. Internal
Revenue Service 1981).
27 Low account balances among this group can be explained in two possible ways: (1) their employer’s 401(k) plan has only
recently been established (74 percent of all 401(k)-type plans in existence in 2014 were established after 1995 [tabulations of
U.S. Department of Labor Form 5500 data for 2014]), or (2) the employee only recently joined the plan (whether on his or her
own or through automatic enrollment). In either event, job tenure would not accurately reflect actual 401(k) plan
participation.
28 It is possible that these older, longer-tenured workers accumulated defined contribution (DC) plan assets (e.g., in a profit-
sharing plan) before the introduction of 401(k) plan features. However, such DC plan arrangements generally did not permit
employee contributions and often were designed to be supplemental to other employer plans. Participants’ account balances
that predate the 401(k) plan are not included in this analysis, which focuses on 401(k) balance amounts.
29 Social Security replaces a much higher fraction of preretirement earnings for lower-income workers. For example, the first-
year replacement rate (mean scheduled Social Security first-year benefits as a percentage of average inflation-indexed career
earnings for retired workers in the 1960–1969 birth cohort [individuals aged 47 to 56 in 2016]) decreased as income
increased. The mean replacement rate for the lowest lifetime household earnings quintile was 83 percent; for the middle
quintile, the mean Social Security replacement rate was 54 percent; and for the highest quintile, it was 34 percent. See
“Replacement Rate—Prices” in Congressional Budget Office 2016b. For additional discussion, see Brady and Bogdan 2016 and
Brady, Burham, and Holden 2012.
30 The ratio of 401(k) plan account balance (at the current employer) to salary alone is not an indicator of preparedness for
retirement, nor is it the only measure that can be used to judge retirement readiness or savings adequacy (see Brady,

ebri.org Issue Brief • August 3, 2017 • No. 436 58
Burham, and Holden 2012). A complete analysis of preparedness for retirement would require estimating projected balances
at retirement by also considering retirement income from Social Security, defined benefit plans, IRAs, and other DC plans,
possibly from previous employment (for example, see VanDerhei 2014). For references to other such research, see MacDonald
and Moore 2011 and Holden and VanDerhei 2005. For an analysis of the possible impact of automatic increases in participants’
contribution rates in automatic enrollment plans, see VanDerhei and Copeland 2008, VanDerhei 2010, and VanDerhei and
Lucas 2010. For a discussion of the variety of factors (e.g., taxes, savings, mortgages, children) that affect replacement rates,
see Brady 2010. For analysis of the impact of changes in Social Security on retirement patterns, see Gustman and Steinmeier
2008 and 2013. For a discussion of the variety of measures that can be used to evaluate Americans’ retirement readiness, see
Brady, Burham, and Holden 2012. For simulation results showing the contributions of employer-sponsored retirement plans
and Social Security to income in retirement, see Brady 2016. For an analysis of income near Social Security claiming, see
Brady et al. 2017.
31 The tendency of the account balance-to-salary ratio to peak at higher salary levels and then fall off likely reflects the
influence of two competing forces. First, empirical research suggests that higher earners tend to contribute
higher percentages of salary; therefore, one would expect the ratio of account balance to salary to rise with salary. However,
tax code contribution limits and nondiscrimination rules, which aim to ensure that employees of all income ranges attain the
benefits of the 401(k) plan, constrain the ability of high-income individuals to save in the plan. See Holden and VanDerhei
2001c for a complete discussion of EBRI/ICI findings and other research on the relationship between contribution rates and
salary. For an analysis of 401(k) participants’ contribution activity during the bear market of 2000 to 2002, see Holden and
VanDerhei 2004c. For summary statistics on contribution activity in 2015, see Utkus and Young 2016 and Aon 2016.
32 At year-end 2015, 59 percent of non–target-date balanced mutual fund assets were assumed to be invested in equities (see
Investment Company Institute, Quarterly Supplementary Data). Allocation to equities in target-date funds is assumed to vary
with investor age. Asset allocation to equities for target-date funds was based on Morningstar analysis of target-date fund
asset allocation (see Morningstar 2015 and note 39 for additional discussion).
33 Other research suggests that most 401(k) participants do not make active changes to their asset allocations during any
given year. For example, an ICI survey of recordkeepers covering more than 29 million DC plan participant accounts found
that 9.4 percent of DC plan participants changed the asset allocation of their account balances in 2016 and 5.6 percent
changed the asset allocation of their contributions during 2016 (see Holden and Schrass 2017). Analyzing 2015 data, Utkus
and Young 2016 reported that “only 9 [percent] of DC plan participants traded within their accounts,” and Utkus and Young
2017 reported that “only 8 [percent] of DC plan participants traded within their accounts.” Similarly, Utkus and Young 2012
reported that “only 11 [percent] of DC plan participants traded in their accounts” in 2011, down from 16 percent in 2008,
making it at that time “the lowest level observed” since they began tracking the data in 1999. Aon 2016 found that 14 percent
of participants traded in their accounts in 2015. Furthermore, Choi et al. 2001 found that 401(k) participants rarely made
changes after the initial point of enrollment. (For household survey results from fall 2016 reflecting households’ sentiment
toward and confidence in 401(k) plans, see Holden, Schrass, and Bogdan 2017.)
34 For the age distribution of 401(k) plan participants and assets at year-end 2015, see Figure 5.
35 See note 11 for additional detail on target-date funds.
36 See Figure 21 in Holden et al. 2016a (the year-end 2014 EBRI/ICI 401(k) database update).
37 For an analysis tracking target-date fund use and the persistence of their use from 2007 through 2009, see Copeland 2011.
For an analysis of target-date fund use among defaulted and non-defaulted 401(k) plan participants, see Mitchell and Utkus
2012.
38 Target-date funds often are used as the default investment in automatic enrollment plans and in plans’ investment lineups
(see Plan Sponsor Council of America 2016). At year-end 2015, 67 percent of target-date mutual fund assets were held in DC
plans (see Investment Company Institute 2017). Plan Sponsor Council of America 2016 reported an increase in the incidence

ebri.org Issue Brief • August 3, 2017 • No. 436 59
of automatic enrollment in 2015. Of the more than 600 plans surveyed, 57.5 percent had automatic enrollment in 2015,
compared with 52.4 percent in 2014, 39.6 percent in 2008, and 10.5 percent in 2004. Utkus and Young 2017 reports that
45 percent of DC plans in their recordkeeping system in 2016 offer automatic enrollment, up from 41 percent in 2015, and
36 percent in 2014.
39 At year-end 2015, 59 percent of non–target-date balanced fund assets were assumed to be invested in equities (see
Investment Company Institute, Quarterly Supplementary Data). The allocation to equities in target-date funds varies with the
funds’ target dates. For target-date funds, investors were assumed to be in a fund whose target date was nearest to their
65th birthday. The equity portion was estimated using the industry average equity percentage for the assigned target-date
fund calculated using the Morningstar Lifecycle Allocation Indexes (see Morningstar 2015). For the average 401(k) plan asset
allocation to equities (through equity funds, company stock, and the equity portion of balanced funds) by participant age, see
Figure 21.
40 For year-end 2014 data, see Holden et al. 2016a.
41 See Holden et al. 2008; Holden, VanDerhei, and Alonso 2009; Holden, VanDerhei, and Alonso 2010; and Holden et al. 2011,
2012, 2013, 2014, and 2016 for data for earlier years.
42 For year-end 1998 data, see Holden, VanDerhei, and Quick 2000.
43 In the database, 401(k) plan participants’ holdings of, and concentration in, company stock have tended to decline. In the
wake of the collapse of Enron in 2001, participants’ awareness of the need to diversify may have increased and some plan
sponsors may have changed plan design (see VanDerhei 2002). In addition, some of this movement may be the result of
regulations put in place by the Pension Protection Act of 2006 (PPA), which limited the length of time participants could be
required to hold company stock contributed to their accounts by their employer; specified rules regarding the notification of
blackout periods; and required quarterly statements that must include a notice highlighting the importance of diversification
(see U.S. Joint Committee on Taxation 2006).
44 Plan-specific information on loan provisions is available for the majority of the plans in the sample (including virtually all of
the small plans). Some plans without this information are classified as having a loan provision if any participant in the plan has
an outstanding loan balance. This may understate the number of plans offering loans (or participants eligible for loans)
because some plans may have offered a plan loan, but no participant had taken out a loan. It is likely that this omission is
small, as U.S. Government Accountability Office 1997 found that more than 95 percent of 401(k) plans that offer loans had at
least one plan participant with an outstanding loan.
45 For a complete time series of the percentage of eligible 401(k) participants with outstanding 401(k) loans and loan amounts
as a percentage of the remaining 401(k) plan account balance, see Holden et al. 2013.
46 The percentage of 401(k) participants with 401(k) loans outstanding across all participants both with and without 401(k)
plan loan access was similar in earlier years. For example, in 2014, this measure was 17 percent; from 2010 through 2013,
18 percent; in 2009, 19 percent; in 2008, 16 percent; in 2007, 16 percent; and in 2006, 15 percent.
47 In plan year 2014 (latest data available), only 1.5 percent of the $4.4 trillion in 401(k) plan assets were participant loans.
See Table D6 in U.S. Department of Labor, Employee Benefits Security Administration 2016a.
48 This pattern is driven in part by restrictions placed on loan amounts.
EBRI Employee Benefit Research Institute Issue Brief (ISSN 0887−137X) is published by the Employee Benefit Research Institute, 1100 13th St. NW, Suite 878, Washington, DC, 20005-4051, at $300 per year or is included as part of a membership subscription. Presorted standard postage rate paid in Dulles, VA. POSTMASTER: Send address changes to: EBRI Issue Brief, 1100 13th St. NW, Suite 878, Washington, DC, 20005-4051. Copyright 2017 by Employee Benefit Research Institute. All rights reserved. No. 436.
The Employee Benefit Research Institute (EBRI) was founded in 1978. Its mission is to contribute to, to encourage, and to enhance the development of sound employee benefit programs and sound public policy through objective research and education. EBRI is the only private, nonprofit, nonpartisan, Washington, DC-based organization committed exclusively to public policy research and education on economic security and employee benefit issues. EBRI’s membership includes a cross-section of pension funds; businesses; trade associations; labor unions; health care providers and insurers; government organizations; and service firms.
EBRI’s work advances knowledge and understanding of employee benefits and their importance to the nation’s economy among policymakers, the news media, and the public. It does this by conducting and publishing policy research, analysis, and special reports on employee benefit issues; holding educational briefings for EBRI members, congressional and federal agency staff, and the news media; and sponsoring public opinion surveys on employee benefit issues. EBRI’s Education and Research Fund (EBRI-ERF) performs the charitable, educational, and scientific functions of the Institute. EBRI-ERF is a tax-exempt organization supported by contributions and grants.
EBRI Issue Briefs is a serial with in-depth evaluation of employee benefit issues and trends, as well as critical analyses of employee benefit policies and proposals. EBRI Notes is serial providing current information on a variety of employee benefit topics. EBRIef is a weekly roundup of EBRI research and insights, as well as updates on surveys, studies, litigation, legislation and regulation affecting employee benefit plans. The EBRI Databook on Employee Benefits is a statistical reference work on employee benefit programs and work force-related issues.
Contact EBRI Publications, (202) 659-0670; fax publication orders to (202) 775-6312. Subscriptions to EBRI Issue Briefs are included as part of EBRI membership, or as part of a $199 annual subscription to EBRI Notes and EBRI Issue Briefs. Change of Address: EBRI, 1100 13th St. NW, Suite 878, Washington, DC, 20005-4051, (202) 659-0670; fax number, (202) 775-6312; e-mail: [email protected] Membership Information: Inquiries regarding EBRI membership and/or contributions to EBRI-ERF should be directed to EBRI President Harry Conaway at the above address, (202) 659-0670; e-mail: [email protected]
Editorial Board: Harry Conaway, publisher; Stephen Blakely, editor. Any views expressed in this publication and those of the authors should not be ascribed to the officers, trustees, members, or other sponsors of the Employee Benefit Research Institute, the EBRI Education and Research Fund, or their staffs. Nothing herein is to be construed as an attempt to aid or hinder the adoption of any pending legislation, regulation, or interpretative rule, or as legal, accounting, actuarial, or other such professional advice. www.ebri.org
EBRI Issue Brief is registered in the U.S. Patent and Trademark Office. ISSN: 0887−137X/90 0887−137X/90 $ .50+.50
© 2017, Employee Benefit Research Institute−Education and Research Fund. All rights reserved.
Who we are
What we do
Our publications
Orders/ Subscriptions