4.1 air quality - physical & environmental planning
TRANSCRIPT

University of California, Merced 4.1‐1 UC Merced 2020 LRDP Recirculated Draft SEIR
December 2019
4.1 AIR QUALITY
4.1.1 Introduction
This section of the Recirculated Draft SEIR (SEIR) discusses the existing regional air quality conditions in
the northern San Joaquin Valley and evaluates the potential air quality impacts associated with campus
development under the 2020 LRDP. The impacts due to air pollutant emissions associated with campus
development and operations under the 2020 LRDP are evaluated relative to the thresholds of significance
recommended by the San Joaquin Valley Air Pollution Control District (SJVAPCD). A discussion of the
applicable federal, state, regional, and local agencies that regulate, monitor, and control air emissions, as
well as the applicable SJVAPCD rules and regulations that pertain to the proposed project is also
provided. The impact analysis has been prepared in accordance with the CEQA Statute and Guidelines
and the SJVAPCD’s Guide for Assessing and Mitigating Air Quality Impacts (GAMAQI). Copies of the
modeling runs and supporting technical data are presented in Appendix 4.1 of this SEIR.
The following sources were used to prepare this section of the SEIR:
UC Merced Draft 2020 Long Range Development Plan (UC Merced 2019)
SJVAPCD 2016 Moderate Area Plan for the 2012 PM2.5 Standard (SJVAPCD 2016a)
SJVAPCD 2016 Plan for the 2008 8‐Hour Ozone Standard (SJVAPCD 2016b)
SJVAPCD Guide for Assessing and Mitigating Air Quality Impacts (SJVAPCD 2015)
SJVAPCD 2013 Plan for the Revoked 1‐Hour Ozone Standard (SJVAPCD 2013)
SJVAPCD 2007 PM10 Maintenance Plan and Request for Redesignation (SJVAPCD 2007)
4.1.2 Environmental Setting
Regional Setting
CARB has divided California into regional air basins according to topographic features. The proposed
project is located in Merced County, which is within the jurisdiction of the San Joaquin Valley Air Basin
(SJVAB). The primary factors that determine air quality are the locations of air pollutant sources, the
amount of pollutants emitted, and meteorological and topographical conditions affecting their dispersion.
Atmospheric conditions, including wind speed, wind direction, and air temperature gradients, interact
with the physical features of the landscape to determine the movement and dispersal of air pollutants.
The following sections provide a description of key air pollutants that affect air quality, and the existing

4.1 Air Quality
University of California, Merced 4.1‐2 UC Merced 2020 LRDP Recirculated Draft SEIR
December 2019
environment as it relates to climate, meteorological conditions, and ambient air quality conditions of the
SJVAB.
Criteria Air Pollutants
Air pollutants of concern in the SJVAB are primarily generated by three categories of sources: mobile,
stationary, and area sources. Mobile sources refer to operational and evaporative emissions from motor
vehicles. Stationary sources include “point sources” which have one or more emission sources at a single
facility. Point sources are usually associated with manufacturing and industrial uses and include sources
such as refinery boilers or combustion equipment that produces electricity or process heat. Area sources
include sources that produce widely distributed emissions. Examples of area sources include residential
water heaters, painting operations, lawn mowers, agricultural fields, landfills, and consumer products,
such as lighter fluid or hair spray.
The criteria pollutants relevant to the proposed project and of concern in the air basin are briefly
described below. Note that Reactive Organic Gases (ROGs), which are also known as reactive organic
compounds (ROCs) or volatile organic compounds (VOCs), are not classified as criteria pollutants.
Similarly, Nitrogen oxide (NOx) is not listed as a criteria pollutant. However, both ROGs and NOx are
widely emitted from land development projects and participate in photochemical reactions in the
atmosphere to form ozone (O3); therefore, NOx and ROGs are of concern in the SVJAB and relevant to the
proposed project and are therefore listed below.
Ozone (O3). O3 is a gas that is formed when nitrogen oxides (NOX) and ROGs, both byproducts of
internal combustion engine exhaust and other sources, undergo slow photochemical reactions in the
presence of sunlight. Ozone concentrations are generally highest during the summer months when
the combination of direct sunlight, light wind, and warm temperature conditions create conditions
favorable to the formation of this pollutant.
Reactive Organic Gases (ROGs). ROGs are compounds comprised primarily of atoms of hydrogen
and carbon. Internal combustion associated with motor vehicle usage is the major source of these
hydrocarbons. Adverse effects on human health are not caused directly by ROGs, but rather by
reactions of ROGs to form secondary air pollutants, including ozone.
Nitrogen Dioxide (NO2) and Nitrogen Oxides (NOx). Fuel combustion produces nitrogen which
combines with oxygen to produce nitric oxide (NO). Further oxidation of NO results in the formation
of NO2, which is a criteria pollutant. NO2 is a reddish‐brown, highly reactive gas which acts as an
acute irritant and, in equal concentrations, is more injurious than NO. NO and NO2 are referred to
together as oxides of nitrogen (NOx). As noted above, NOx is involved in photochemical reactions
that produce ozone.
Carbon Monoxide (CO). CO is a colorless, odorless gas produced by the incomplete combustion of
fuels. CO concentrations tend to be the highest during winter mornings, with little to no wind, when
surface‐based inversions trap the pollutant at ground levels. Because CO is emitted directly from

4.1 Air Quality
University of California, Merced 4.1‐3 UC Merced 2020 LRDP Recirculated Draft SEIR
December 2019
internal combustion engines and motor vehicles operating at slow speeds are the primary source of
CO in the air basin, the highest ambient CO concentrations are generally found near congested
transportation corridors and intersections.
Sulfur dioxide (SO2). SO2 is a colorless, extremely irritating gas or liquid. It enters the atmosphere as
a pollutant mainly as a result of burning high‐sulfur‐content fuel oils and coal and from chemical
processes occurring at chemical plants and refineries. When sulfur dioxide oxidizes in the
atmosphere, it forms sulfates (SO4).
Respirable Particulate Matter (PM10). PM10 consists of extremely small, suspended particles or
droplets 10 micrometers or smaller in diameter. Some sources of PM10, like pollen and windstorms,
are naturally occurring. However, in populated areas, most PM10 is caused by road dust, diesel soot,
and combustion products, abrasion of tires and brakes, and construction activities.
Fine Particulate Matter (PM2.5). PM2.5 refers to particulate matter that is 2.5 micrometers or smaller in
size. The sources of PM2.5 include fuel combustion from automobiles, power plants, wood burning,
industrial processes, and diesel‐powered vehicles such as buses and trucks. These fine particles are
also formed in the atmosphere when gases such as sulfur dioxide, NOX, and VOCs are transformed in
the air by chemical reactions.
Lead (Pb). Pb occurs in the atmosphere as particulate matter. The combustion of leaded gasoline is
the primary source of airborne lead in the Basin. The use of leaded gasoline is no longer permitted for
on‐road motor vehicles, so most such combustion emissions are associated with off‐road vehicles
such as racecars that use leaded gasoline. Other sources of Pb include the manufacturing and
recycling of batteries, paint, ink, ceramics, ammunition, and secondary lead smelters.
Regional Topography and Meteorology
The SJVAB, which is approximately 250 miles long and averages 80 miles wide, is the second largest air
basin in the state. Air pollution, especially the dispersion of air pollutants, is directly related to a region’s
topographic features. The SJVAB is defined by the Sierra Nevada to the east (8,000 to 14,000 feet in
elevation), the Coast Range to the west (averaging 3,000 feet in elevation), and the Tehachapi Mountains
to the south (6,000 to 8,000 feet in elevation). The valley opens to the sea at the Carquinez Strait where the
San Joaquin–Sacramento Delta (Delta) empties into San Francisco Bay.
Localized air quality can be greatly affected by elevation and topography. For the majority of the San
Joaquin Valley, air movement through and out of the region is restricted by surrounding hills and
mountains. Although marine air generally flows into the basin from the Delta, the Coast Range hinders
wind access into the SJVAB from the west, the Tehachapi Mountains prevent the southerly passage of
airflow, and the Sierra Nevada is a significant barrier to the east. These topographic features result in
weak airflow in the valley, which becomes vertically blocked by high barometric pressure over the
SJVAB. As a result, the majority of the SJVAB is highly susceptible to pollutant accumulation over time.

4.1 Air Quality
University of California, Merced 4.1‐4 UC Merced 2020 LRDP Recirculated Draft SEIR
December 2019
Most of the surrounding mountains are above the normal height of the summer inversion layer
(SJVAPCD 2015).
Wind speed and direction play an important role in the dispersion and transport of air pollutants. Ozone
and inhalable particulates (PM10 and PM2.5) are classified as regional pollutants because they can be
transported away from the emission source before concentrations peak. In contrast, local pollutants, such
as carbon monoxide (CO), tend to have their highest concentrations near the source of emissions. These
local pollutants dissipate easily and, therefore, have the highest concentrations during low wind speeds.
During the summer, winds usually originate at the north end of the SJVAB and flow in a south‐
southeasterly direction through the Tehachapi Pass into the Mojave Desert Air Basin. During the winter,
winds occasionally originate from the south end of the SJVAB and flow in a north‐northwesterly
direction. Also, during winter, the SJVAB experiences light, variable winds, typically less than 10 miles
per hour. Low wind speeds, combined with low inversion layers in the winter, create a climate conducive
to high CO and inhalable particulate (PM10) concentrations.
The vertical mixing of air pollutants is limited by the presence of persistent temperature inversions.
Inversions may be either at ground level or elevated. Ground‐level inversions frequently occur during
early fall and winter (i.e., October through January). High concentrations of primary pollutants, which
are those directly emitted into the atmosphere (e.g., CO), are typically found during ground‐level
inversions. Elevated inversions act as a lid over the basin and limit vertical mixing. Severe air stagnation
occurs as a result of these inversions. Elevated inversions contribute to the occurrence of high levels of
ozone during the summer months.
The SJVAB enjoys an inland Mediterranean climate, averaging more than 260 sunny days per year. The
valley floor is characterized by warm, dry summers and cooler winters. Average daily temperatures in
the basin range from 44.6 degrees Fahrenheit (°F) in January to 76.7°F in July. Summer highs often exceed
100°F, averaging in the low 90s in the northern valley and high 90s to the south. Maximum temperatures
of 90°F or greater occur about 88 days per year. Although the SJVAB enjoys a high frequency of sunshine,
a reduction in sunshine occurs during December and January because of fog and intermittent stormy
weather. Temperatures of 32°F and below occur about 22 days per year. Nearly 90 percent of the annual
precipitation falls in the six months between November and April.
Ambient Air Quality Standards
The U.S. Environmental Protection Agency (EPA) is the federal agency responsible for setting the
National Ambient Air Quality Standards (NAAQS). The air quality of a region is considered to be in
attainment of the NAAQS if the measured ambient criteria pollutant levels do not exceed the NAAQS

4.1 Air Quality
University of California, Merced 4.1‐5 UC Merced 2020 LRDP Recirculated Draft SEIR
December 2019
more than once per year, except for O3, PM10, and PM2.5. The NAAQS for O3, PM10, and PM2.5 are based on
statistical calculations over one‐ to three‐year periods, depending on the pollutant. The California Air
Resources Board (CARB) is the state agency responsible for setting the California Ambient Air Quality
Standards (CAAQS). The air quality of a region is considered to be in attainment of the CAAQS if the
measured ambient air pollutant levels for O3, CO, NO2, SO2, PM10, PM2.5, and lead do not exceed the
standards, and other standards are not equaled or exceeded at any time in any consecutive three‐year
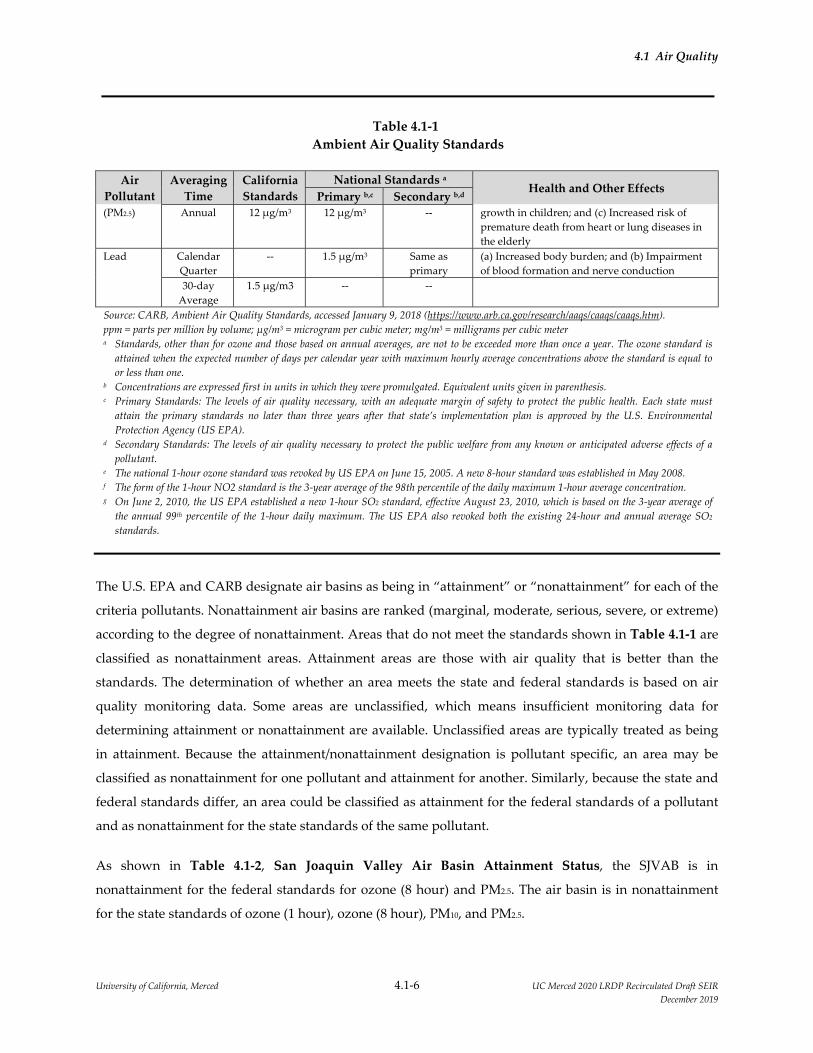
period. The NAAQS and CAAQS for each of the monitored pollutants and their effects on human health
and other effects are summarized in Table 4.1‐1, Ambient Air Quality Standards.
Table 4.1‐1
Ambient Air Quality Standards
Air
Pollutant
Averaging
Time
California
Standards
National Standards a Health and Other Effects
Primary b,c Secondary b,d
Ozone (O3) 8‐hour 0.070 ppm
(137 μg/m3)
0.070 ppm
(137 μg/m3)
Same as
primary
(a) Pulmonary function decrements and localized
lung edema in humans and animals; (b) Risk to
public health implied by alterations in pulmonary
morphology and host defense in animals;
(c) Increased mortality risk; (d) Risk to public
health implied by altered connective tissue
metabolism and altered pulmonary morphology
in animals after long‐term exposures and
pulmonary function decrements in chronically
exposed humans; (e) Vegetation damage; and (f)
Property damage
1‐hour 0.09 ppm
(180 μg/m3)
‐‐e ‐‐
Carbon
Monoxide
(CO)
8‐hour 9.0 ppm
(10 mg/m3)
9 ppm
(10 mg/m3)
‐‐ (a) Aggravation of angina pectoris and other
aspects of coronary heart disease; (b) Decreased
exercise tolerance in persons with peripheral
vascular disease and lung disease; (c) Impairment
of central nervous system functions; and
(d) Possible increased risk to fetuses
1‐hour 20 ppm
(23 mg/m3)
35 ppm
(40 mg/m3)
‐‐
Nitrogen
Dioxide
(NO2)
Annual 0.030 ppm
(57 μg/m3)
0.053 ppm
(100 μg/m3)
Same as
primary
(a) Potential to aggravate chronic respiratory
disease and respiratory symptoms in sensitive
groups; (b) Risk to public health implied by
pulmonary and extra‐pulmonary biochemical and
cellular changes and pulmonary structural
changes; and (c) Contribution to atmospheric
discoloration
1‐hour 0.18 ppm
(339 μg/m3)
0.100 ppmf
(188 μg/m3)
‐‐
Annual ‐‐ ‐‐g ‐‐
24‐hour 0.04 ppm
(105 μg/m3)
‐‐g ‐‐
3‐hour ‐‐ ‐‐ 0.5 ppm
(1300 μg/m3)
Sulfur
Dioxide
(SO2)
1‐hour 0.25 ppm
(655 μg/m3)
0.075 ppmg
(196 μg/m3)
‐‐ Bronchoconstriction accompanied by symptoms,
which may include wheezing, shortness of
breath and chest tightness, during exercise or
physical activity in persons with asthma
Respirable
Particulate
Matter
(PM10)
Annual 20 μg/m3 ‐‐ ‐‐ a) Exacerbation of symptoms in sensitive patients
with respiratory or cardiovascular disease;
(b) Declines in pulmonary function growth in
children; and (c) Increased risk of premature
death from heart or lung diseases in the elderly
24‐hour 50 μg/m3 150 μg/m3 Same as
primary
Fine
Particulate
Matter
24‐hour No separate
State
standard
35 μg/m3 ‐‐ (a) Exacerbation of symptoms in sensitive
patients with respiratory or cardiovascular
disease; (b) Declines in pulmonary function
4.1 Air Quality
University of California, Merced 4.1‐6 UC Merced 2020 LRDP Recirculated Draft SEIR
December 2019
Table 4.1‐1
Ambient Air Quality Standards
Air
Pollutant
Averaging
Time
California
Standards
National Standards a Health and Other Effects
Primary b,c Secondary b,d
(PM2.5) Annual 12 μg/m3 12 μg/m3 ‐‐ growth in children; and (c) Increased risk of
premature death from heart or lung diseases in
the elderly
Lead Calendar
Quarter
‐‐ 1.5 μg/m3 Same as
primary
(a) Increased body burden; and (b) Impairment
of blood formation and nerve conduction
30‐day
Average
1.5 μg/m3 ‐‐ ‐‐
Source: CARB, Ambient Air Quality Standards, accessed January 9, 2018 (https://www.arb.ca.gov/research/aaqs/caaqs/caaqs.htm).
ppm = parts per million by volume; μg/m3 = microgram per cubic meter; mg/m3 = milligrams per cubic meter a Standards, other than for ozone and those based on annual averages, are not to be exceeded more than once a year. The ozone standard is
attained when the expected number of days per calendar year with maximum hourly average concentrations above the standard is equal to
or less than one. b Concentrations are expressed first in units in which they were promulgated. Equivalent units given in parenthesis. c Primary Standards: The levels of air quality necessary, with an adequate margin of safety to protect the public health. Each state must
attain the primary standards no later than three years after that state’s implementation plan is approved by the U.S. Environmental
Protection Agency (US EPA). d Secondary Standards: The levels of air quality necessary to protect the public welfare from any known or anticipated adverse effects of a
pollutant. e The national 1‐hour ozone standard was revoked by US EPA on June 15, 2005. A new 8‐hour standard was established in May 2008. f The form of the 1‐hour NO2 standard is the 3‐year average of the 98th percentile of the daily maximum 1‐hour average concentration. g On June 2, 2010, the US EPA established a new 1‐hour SO2 standard, effective August 23, 2010, which is based on the 3‐year average of
the annual 99th percentile of the 1‐hour daily maximum. The US EPA also revoked both the existing 24‐hour and annual average SO2
standards.
The U.S. EPA and CARB designate air basins as being in “attainment” or “nonattainment” for each of the
criteria pollutants. Nonattainment air basins are ranked (marginal, moderate, serious, severe, or extreme)
according to the degree of nonattainment. Areas that do not meet the standards shown in Table 4.1‐1 are
classified as nonattainment areas. Attainment areas are those with air quality that is better than the
standards. The determination of whether an area meets the state and federal standards is based on air
quality monitoring data. Some areas are unclassified, which means insufficient monitoring data for
determining attainment or nonattainment are available. Unclassified areas are typically treated as being
in attainment. Because the attainment/nonattainment designation is pollutant specific, an area may be
classified as nonattainment for one pollutant and attainment for another. Similarly, because the state and
federal standards differ, an area could be classified as attainment for the federal standards of a pollutant
and as nonattainment for the state standards of the same pollutant.
As shown in Table 4.1‐2, San Joaquin Valley Air Basin Attainment Status, the SJVAB is in
nonattainment for the federal standards for ozone (8 hour) and PM2.5. The air basin is in nonattainment
for the state standards of ozone (1 hour), ozone (8 hour), PM10, and PM2.5.

4.1 Air Quality
University of California, Merced 4.1‐7 UC Merced 2020 LRDP Recirculated Draft SEIR
December 2019
Table 4.1‐2
San Joaquin Valley Air Basin Attainment Status
Pollutant Federal Standards State Standards
Ozone‐1 hour No federal standard1 Nonattainment
Ozone‐8 hour Nonattainment/Extreme2 Nonattainment
PM10 Attainment3 Nonattainment
PM2.5 Nonattainment4 Nonattainment
CO Attainment/Unclassified Attainment/Unclassified
Nitrogen dioxide Attainment/Unclassified Attainment
Sulfur dioxide Attainment/Unclassified Attainment
Lead No Designation/Classification Attainment
Hydrogen sulfide No federal standards Unclassified
Sulfates No federal standards Attainment
Vinyl Chloride No federal standards Attainment
Visibility‐Reducing particulates No federal standards Unclassified
Source: SJVAPCD, Ambient Air Quality Standards & Valley Attainment Status.
http://www.valleyair.org/aqinfo/attainment.htm. 1 Effective June 15, 2005, the U.S. Environmental Protection Agency (EPA) revoked the federal 1‐hour ozone standard,
including associated designations and classifications. U.S, EPA had previously classified the SJVAB as extreme nonattainment
for this standard. U.S. EPA approved the 2004 Extreme Ozone Attainment Demonstration Plan on March 8, 2010 (effective
April 7, 2010). Many applicable requirements for extreme 1‐hour ozone nonattainment areas continue to apply to the SJVAB. 2 Though the San Joaquin Valley was initially classified as serious nonattainment for the 1997 8‐hour ozone standard, U.S. EPA
approved Valley reclassification to extreme nonattainment in the Federal Register on May 5, 2010 (effective June 4, 2010). 3 On September 25, 2008, U.S. EPA re‐designated the San Joaquin Valley as attainment for the PM10 National Ambient Air
Quality Standard (NAAQS) and approved the PM10 Maintenance Plan. 4 The Valley is designated as nonattainment for the 1997 PM2.5 NAAQS. U.S. EPA designated the Valley as nonattainment for
the 2006 PM2.5 NAAQS on November 13, 2009 (effective December 14, 2009).
Sensitive Receptors
Sensitive populations (sensitive receptors) are more susceptible to the effects of air pollution than is the
population at large. The SJVAPCD defines sensitive receptors as “facilities that house or attract children,
the elderly, people with illnesses, or others who are especially sensitive to the effects of air pollutants,”
which include hospitals, schools, convalescent facilities, and residential areas as examples of sensitive
receptors (SJVAPCD 2015). Sensitive receptors that are near localized sources of toxic air contaminants
and CO are of particular concern. For the purposes of impact assessment, the definition of sensitive
receptors is typically expanded to include residences (where elderly and young children may reside),
playgrounds, rehabilitation centers, and athletic facilities.
Based on site reconnaissance and available information, sensitive receptors (as defined by SJVAPCD) are
located within 0.10 mile of the project site. These include rural residential land uses on the west side of
Lake Road. Additional rural residences are located along Bellevue Road. Lake Yosemite Regional Park is
located about ½ mile to the northwest of the campus but is not considered a sensitive receptor under the
SJVAPCD definition. Student housing on the campus is not treated as a sensitive receptor due to the age

4.1 Air Quality
University of California, Merced 4.1‐8 UC Merced 2020 LRDP Recirculated Draft SEIR
December 2019
of the occupants and the short duration (typically 4 to 5 years) that the occupants typically are in student
housing on a campus.
Ambient Air Monitoring
CARB has established and maintains a network of sampling stations in conjunction with local air
pollution control districts (APCDs) and air quality management districts (AQMDs), private contractors,
and the National Park Service. The air quality sampling stations are referred to as the State and Local Air
Monitoring Stations (SLAMS) network. The SLAMS network provides air quality monitoring data,
including real‐time meteorological data and ambient pollutant levels, as well as historical data. The
SLAMS network in the SJVAB consists of 30 monitoring stations, two of which are located in the City of
Merced. The closest monitoring station to the project is located at 2334 M Street in Merced, approximately
4.5 miles to the southwest. This station monitors ambient pollutant concentrations of PM10 and PM2.5. The
next nearest monitoring station to the site is located at 385 South Coffee Avenue in Merced,
approximately 4.5 miles south of the project site. This station monitors ambient pollutant concentrations
of O3 and NO2. Neither CO nor SO2 monitoring data is available for the range of years (2015‐2017) listed
below.
Table 4.1‐3, Ambient Pollutant Concentrations Registered Nearest to the Project Site, lists the
measured ambient pollutant concentrations and the violations of state and federal standards that have
occurred at the above‐mentioned monitoring stations from 2015 through 2017, the most recent years for
which data are available. As shown, the monitoring stations in the City of Merced have registered values
above state and federal standards for O3, the state standard for PM10, and the federal standard for PM2.5.
Concentrations of CO, SO2, NO2, lead, and sulfate have not been exceeded anywhere within the basin for
several years. Values for lead and sulfate are not presented in the table below since ambient
concentrations are well below the state standards. Hydrogen sulfide, vinyl chloride, and visibility
reducing particles were not monitored by CARB or the SJVAPCD in the SJVAB during the period from
2015 to 2017.

4.1 Air Quality
University of California, Merced 4.1‐9 UC Merced 2020 LRDP Recirculated Draft SEIR
December 2019
Table 4.1‐3
Ambient Pollutant Concentrations Registered Nearest to the Project Site
Pollutant Standards1, 2 Year
2015 2016 2017
OZONE (O3)
Maximum 1‐hour concentration monitored (ppm) 0.102 0.097 0.093
Maximum 8‐hour concentration monitored (ppm) 0.090 0.087 0.085
Number of days exceeding state 1‐hour standard 0.09 ppm 2 2 0
Number of days exceeding state 8‐hour standard 0.070 ppm 34 29 17
Number of days exceeding federal 8‐hour standard 3 0.070 ppm 29 28 16
CARBON MONOXIDE (CO)
Maximum 1‐hour concentration monitored (ppm) N/A N/A N/A
Maximum 8‐hour concentration monitored (ppm) N/A N/A N/A
Number of days exceeding state 8‐hour standard 9.0 ppm N/A N/A N/A
Number of days exceeding federal 8‐hour standard 9 ppm N/A N/A N/A
NITROGEN DIOXIDE (NO2)
Maximum 1‐hour concentration monitored (ppm) 0.035 0.035 0.039
Annual average concentration monitored (ppm) N/A 0.006 0.007
Number of days exceeding state 1‐hour standard 4 0.18 ppm 0 0 0
PARTICULATE MATTER (PM10)
Maximum 24‐hour concentration monitored (μg/m3) 97.2 64.5 146.6
Annual average concentration monitored (μg/m3) 30.7 29.5 35.8
Number of estimated days exceeding state standard 50 μg/m3 32 39 77
Number of estimated days exceeding federal standard 150 μg/m3 0 0 0
PARTICULATE MATTER (PM2.5)
Maximum 24‐hour concentration monitored (μg/m3) 61 43 67
Annual average concentration monitored (μg/m3) 12.6 11.1 12.6
Number of estimated days exceeding federal standard 5 35 μg/m3 15.2 6.3 20.4
SULFUR DIOXIDE (SO2)
Maximum 24‐hour concentration monitored (ppm) N/A N/A N/A
Number of samples exceeding 24‐hour state standard 0.04 ppm N/A N/A N/A
Number of samples exceeding federal 24‐hour standard 0.14 ppm N/A N/A N/A
Sources: California Air Resource Board, “Air Quality Data Statistics,” http://www.arb.ca.gov/adam/welcome.html; US Environmental
Protection Agency, “Air Data: Access to Air Pollution Data,” http://www.epa.gov/air/data/.
N/A = No air quality data received for this year. 1 Parts by volume per million of air (ppm), micrograms per cubic meter of air (μg/m3), or annual arithmetic mean (aam). 2 Federal and state standards are for the same time period as the maximum concentration measurement unless otherwise indicated. 3 US EPA revised the 8‐hour standard effective October 1, 2015. The statistics are based on the previous standard of 0.07 ppm. 5 CARB revised the 1‐hour standard effective March 20, 2008. The statistics are based on the previous standard of 0.25 ppm. In addition,
CARB adopted an annual standard of 0.030 ppm, which is more stringent than the federal standard of 0.053 ppm. 6 The federal standard for PM2.5 was changed to 35 μg/m3 in 2006.
Human Health Effects of Air Pollution
Air pollution is a major public health concern. Studies conducted in various parts of the world, including
the United States, have documented a wide range of adverse effects of ambient air pollution on human
health. Adverse health effects from short‐term and long‐term exposure to air pollution evaluated in this
SEIR include the following:

4.1 Air Quality
University of California, Merced 4.1‐10 UC Merced 2020 LRDP Recirculated Draft SEIR
December 2019
Increased respiratory illnesses (asthma incidence, asthma severity, hospital care for asthma,
infections, and other symptoms);
Exacerbation of symptoms in sensitive patients with respiratory or cardiovascular disease;
Decreased lung function and lung inflammation;
Increased mortality, including increased risk of premature death from heart or lung diseases in the
elderly and people with potentially predisposing conditions (such as chronic obstructive pulmonary
disease, diabetes, congestive heart failure, and myocardial infarction);
Declines in pulmonary function growth in children;
Potential immunological changes;
Increase in physician and emergency room visits, and hospitalization; and
Increase in absence from school.
Although numerous air pollutants are emitted by both natural and anthropogenic sources and contribute
to adverse human health effects (see Table 4.1‐1 above for health effects of criteria pollutants), ozone and
particulate matter have been identified as the pollutants of greatest concern. The two pollutants are also
considered co‐pollutants in terms of their incidence, and one pollutant has the effect of confounding the
effect of the other. According to the World Health Organization, “The correlations between ozone and
other harmful air pollutants differ by season and place, making confounding control complicated. During
summer, there is often a positive correlation with secondary particles, since similar conditions increase
the formation of both. On the other hand, especially when ozone formation is limited (winter), there are
often strong inverse correlations between ozone and primary pollutants from traffic and heating, because
nitric oxide emissions scavenge ozone.” “A further complexity in the study of the health effects of ground
level ozone, particularly the health effects associated with short‐term exposures, arises from the close
correlation between ozone production and depletion with meteorological conditions (Royal Society,
2008). Since high temperatures (Baccini et al., 2008) and heat waves in particular (Kovats & Hajat, 2008)
are associated with increased mortality, the separation of the health effects of ozone from those of
temperature is problematic” (WHO 2013).
Further, several factors influence health impacts, which include the concentrations of ground‐level ozone;
the duration of exposure, the volume of air that is inhaled per minute, the intervals between exposures,
and the sensitivity of the persons to the exposure. As noted earlier in this section, ozone is not emitted
directly but is formed under certain meteorological conditions from ozone precursors ROG and NOx.
Consequently, ground‐level concentrations of ozone are highly variable and are influenced by the volume
of air available for dilution, the temperature, and the intensity of ultraviolet light. Similarly,
concentrations of other pollutants, such as particulate matter, vary depending on meteorological

4.1 Air Quality
University of California, Merced 4.1‐11 UC Merced 2020 LRDP Recirculated Draft SEIR
December 2019
conditions, distance between source and receptors, and other factors. For the same level of exposure,
health effects can vary from individual to individual. Certain subgroups of the population, such as
children, persons with preexisting respiratory conditions, and individuals exercising outdoors are at
greater risk from exposure to outdoor ozone and particulate matter than the general population.
4.1.3 Regulatory Considerations
Air quality within the SJVAB is addressed through the efforts of various federal, state, regional, and local
government agencies. These agencies work individually, as well as jointly, to improve air quality through
legislation, regulations, planning, policy making, education, and a variety of other programs. The
agencies primarily responsible for improving the air quality within the SJVAB include the U.S. EPA,
CARB, SJVAPCD, and the Regional Council of Governments. These agencies, their laws, regulations,
rules, plans, and policies as they pertain to air quality and the proposed project are discussed below.
Federal Regulations
U.S. Environmental Protection Agency
The U.S. EPA is responsible for implementing and enforcing the federal Clean Air Act (CAA) and the
NAAQS. The U.S. EPA regulates emission sources that are under the exclusive authority of the federal
government, such as aircraft, ships, and certain locomotives. The U.S. EPA also maintains jurisdiction
over emissions sources beyond State waters (outer continental shelf) and establishes various emissions
standards for vehicles sold in states other than California. These standards identify levels of air quality
for seven criteria pollutants: O3, CO, NO2, SO2, PM10, PM2.5, and lead. The thresholds are considered to be
the maximum concentrations of ambient (background) air pollutants determined safe to protect the
public health and welfare with an adequate margin of safety.
As part of its enforcement responsibilities, the U.S. EPA requires each state with areas that do not meet
the federal standards to prepare and submit a State Implementation Plan (SIP) that demonstrates the
means to attain federal standards. The SIP must integrate federal, state, and local plan components and
regulations to identify specific measures to reduce pollution, using a combination of performance
standards and market‐based programs within the time frame identified in the SIP.
The 1990 Clean Air Act Amendments were enacted to better protect the public’s health and create more
efficient methods for lowering pollutant emissions. The major areas of improvement addressed in the
amendments include NAAQS, air basin designations, automobile/heavy‐duty engine emissions, and
hazardous air pollutants. The U.S. EPA has designated air basins as being in attainment or nonattainment
for each of the seven criteria pollutants. Nonattainment air basins for ozone are further ranked (marginal,
moderate, serious, severe, or extreme) according to the degree of nonattainment. CARB is required to

4.1 Air Quality
University of California, Merced 4.1‐12 UC Merced 2020 LRDP Recirculated Draft SEIR
December 2019
describe in its SIP how the State will achieve federal standards by specified dates for each air basin that
has failed to attain a NAAQS for any criteria pollutant.
State Regulations
California Air Resources Board
CARB oversees air quality planning and control throughout California. It is primarily responsible for
ensuring implementation of the California Clean Air Act (CCAA), responding to the federal CAA
planning requirements applicable to the State, and regulating emissions from motor vehicles and
consumer products within the State. In addition, CARB sets health‐based air quality standards and
control measures for TACs. Much of CARB’s research goes toward automobile emissions, as they are
primary contributors to air pollution in California. Under the CCAA, CARB has the authority to establish
more stringent standards for vehicles sold in California and for various types of equipment available
commercially. It also sets fuel specifications to further reduce vehicular emissions.
The CCAA established a legal mandate for air basins to achieve the CAAQS by the earliest practical date.
These standards apply to the same seven criteria pollutants as the federal CAA and also include sulfates,
visibility‐reducing particles, hydrogen sulfide, and vinyl chloride. The State standards are generally more
stringent than the federal standards.
CARB supervises and supports the regulatory activities of local air quality districts as well as monitors air
quality itself. Health and Safety Code Section 39607(e) requires CARB to establish and periodically review
area designation criteria. These designation criteria provide the basis for CARB to designate areas of the
State as attainment, nonattainment, or unclassified according to State standards. CARB makes area
designations for 10 criteria pollutants: O3, CO, NO2, SO2, PM10, PM2.5, sulfates, lead, hydrogen sulfide, and
visibility‐reducing particles.1 The air quality of a region is considered to be in attainment of the State
standards if the measured ambient air pollutant levels for O3, CO, NO2, PM10, PM2.5, SO2 (1‐ and 24‐hour),
and lead do not exceed standards, and all other standards are not equaled or exceeded at any time in any
consecutive three‐year period. As aforementioned, the SJVAB is classified by the state as a nonattainment
area for the O3, PM10, and PM2.5 standards.
1 California Air Resources Board, “Area Designations (Activities and Maps),” http://www.arb.ca.gov/desig/
desig.htm. 2010. According to California Health and Safety Code, Section 39608, “State board, in consultation
with the districts, shall identify, pursuant to subdivision (e) of Section 39607, and classify each air basin which is
in attainment and each air basin which is in nonattainment for any State ambient air quality standard.” Section
39607(e) States that the State shall “establish and periodically review criteria for designating an air basin
attainment or nonattainment for any State ambient air quality standard set forth in Section 70200 of Title 17 of
the California Code of Regulations. California Code of Regulations, Title 17, Section 70200 does not include vinyl
chloride; therefore, CARB does not make area designations for vinyl chloride.

4.1 Air Quality
University of California, Merced 4.1‐13 UC Merced 2020 LRDP Recirculated Draft SEIR
December 2019
Regional Plans and Policies
The SJVAPCD has jurisdiction over most air quality matters2 within the SJVAB, which includes San
Joaquin, Stanislaus, Merced, Madera, Fresno, Kings, and Tulare Counties and the valley portion of Kern
County. The district regulates most air pollutant sources in the air basin, maintains ambient air quality
monitoring stations at numerous locations throughout the air basin, and prepares the air quality
management/attainment plans for the SJVAB that are required under the CAA and CCAA.
SJVAPCD Air Quality Plans
As shown in Table 4.1‐2, the SJVAB is in nonattainment for the federal standards for ozone (8‐hour) and
PM2.5. The air basin is also in nonattainment for the state standards of ozone (1‐hour), ozone (8‐hour),
PM10, and PM2.5. Therefore, the district has prepared attainment plans for the SJVAB in order to
demonstrate achievement of the state and federal ambient air quality standards for ozone, PM10, and
PM2.5. The most recent plans include:
2016 Plan for the 2008 8‐Hour Ozone Standard (SJVAPCD 2016b)
2014 Reasonably Available Control Technology Demonstration for the 8‐Hour Ozone State
Implementation Plan (RACT SIP) (SJVAPCD 2014)
2013 Plan for the Revoked 1‐Hour Ozone Standard (SJVAPCD 2013)
The SJVAPCD must continuously monitor its progress in implementing these attainment plans and must
periodically report to CARB and the U.S. EPA. It must also periodically revise its attainment plans to
reflect new conditions and requirements in accordance with schedules mandated by the CAA and the
CCAA. The following sections provide an overview of these three plans.
2016 Plan for the 2008 8‐Hour Ozone Standard
The SJVAPCD approved the 2016 Plan for the 2008 8‐Hour Ozone Standard in June 2016 to severely
reduce NOx emissions and meet the federal 8‐Hour ozone standard. In compliance with the federal CAA,
the 2016 Plan provides a comprehensive strategy that builds upon current efforts to minimize 1‐hour O3,
8‐hour O3, and PM emissions. The Plan details health implications associated with O3 and PM and the
importance of preventing emissions and explains current standards and regulations regarding such
pollutants. Most importantly, the Plan provides an attainment strategy that focuses on regulatory actions,
incentive programs, technological advancements, and public outreach. As O3 and PM emissions
2 SJVAPCD does not regulate air pollutants from motor vehicles, locomotives, aircraft, agriculture equipment, and
marine vessels.

4.1 Air Quality
University of California, Merced 4.1‐14 UC Merced 2020 LRDP Recirculated Draft SEIR
December 2019
standards become more stringent, the 2016 Plan not only provides guidance to reducing such emissions,
but also lays a malleable base plan to be improved and expanded upon in the future.
2014 RACT SIP
The 2014 RACT SIP was created as an update to the 2009 RACT SIP, focusing on new technologies and
regulations that have been developed within the five‐year period. The U.S. EPA defines RACT as “lowest
emission limitation that a particular source is capable of meeting by the application of control technology
that is reasonable available considering technological and economic feasibility.” All California air districts
must develop an RACT SIP proving regulations and efforts fulfill RACT before it can be certified. While
the goal of the 2014 RACT SIP is to reduce emissions to the maximum extent possible, it recognizes that
economic and technological barriers make an RACT less stringent (and more feasible in most cases) than
other emission controls, such as Best Available Control Technology (BACT) and Lowest Achievable
Emission Rate (LAER).
2013 Plan for the Revoked 1‐Hour Ozone Standard
In 2013, the SJVAPCD developed the 2013 Plan to satisfy federal requirements under U.S. EPA’s revoked
1‐hour O3 standard. The Plan adds to previous O3 and PM strategies to lessen 1‐hour O3 concentrations in
the San Joaquin Valley. As O3 attainment can be difficult, with high levels for a couple of hours ruining
years of attainment in some cases, the attainment year for this plan was 2017. The O3 attainment standard
under the 2013 Plan was met ahead of the planned attainment year, despite fires outside the SJVAB
causing exceedance in pollution levels.
SJVAPCD Rules and Regulations
The SJVAPCD’s primary means of implementing its attainment plans is through its adopted rules and
regulations. Campus development under the 2020 LRDP would be subject to the following rules adopted
by the SJVAPCD that are designed to reduce and control pollutant emissions throughout the basin.
Rule 2010 (Permits Required) – This rule requires that any project constructing, altering, replacing,
or operating any source operation, the use of which emits, may emit, or may reduce emissions, to
obtain an Authority to Construct (ATC) and a Permit to Operate (PTO). This rule applies to the
construction and operation of new or modified processes and equipment, except those specifically
exempted from permitting requirements.
Rule 2201 (New and Modified Stationary Source Review) – This rule applies to all new and
modified stationary sources that would emit, after construction, a criteria pollutant for which there is
an established NAAQS or CAAQS. The rule provides mechanisms by which an ATC can be granted
without interfering with the basin’s attainment with ambient air quality standards. These

4.1 Air Quality
University of California, Merced 4.1‐15 UC Merced 2020 LRDP Recirculated Draft SEIR
December 2019
mechanisms offer methods to generate no net increases in emissions of nonattainment pollutants over
specific thresholds as detailed in the rule.
Rule 2520 (Federally Mandated Operating Permits) – This rule requires that major sources of criteria
pollutants or HAPs obtain a Title V federal operating permit within one year after becoming a major
source. This rule would apply to the campus if the total facility emissions of criteria pollutants from
permitted stationary sources exceed the major source thresholds in Rule 2201 or the major source
thresholds for HAPs as defined in the CAA.
Rule 3135 (Dust Control Plan Fee) – This rule recovers District costs for reviewing Dust Control Plan
and conducting site inspections. Should a Dust Control Plan be deemed necessary to minimize air
quality impacts, the campus could be subject to this rule.
Rule 3180 (Administrative Fees for Indirect Source Review) – This rule applies to development
projects subject to Rule 9510 regarding Indirect Source review. When the developer submits an Air
Impact Assessment, in accordance with Rule 9510, an application fee, and potentially an evaluation
fee, must be paid to recover District’s costs for administering Rule 9510.
Rule 4102 (Nuisance) – This rule applies to any source operation that emits or may emit air
contaminants or other materials. In the event that the project or construction of the project creates a
public nuisance, it could be in violation and subject to district enforcement action.
Rule 4306 (Boilers, Steam Generators, and Process Heaters – Phase 3) – This rule limits the NOX and
CO emissions from boilers, steam generators, and process heaters with heat input ratings greater than
5 million British thermal units per hour (MMBtu/hr). The source must also comply with the
monitoring and reporting requirements specified in the rule.
Rule 4601 (Architectural Coatings) – This rule limits VOCs from architectural coatings by specifying
architectural coatings storage, cleanup, and labeling requirements and applies to any person who
supplies, sells, offers for sale, applies, or solicits the application of any architectural coating.
Rule 4641 (Cutback, Slow Cure, and Emulsified Asphalt, Paving, and Maintenance Operations) –
Asphalt paving operations are subject to Rule 4641. This rule applies to the manufacture and use of
rapid and medium cure cutback asphalt, slow cure asphalt, and emulsified asphalt for paving and
maintenance operations. The user or manufacturer of cutback, slow cure, and emulsified asphalt
must comply with the recordkeeping requirements specified in Rule 4641.
Rule 4702 (Internal Combustion Engines – Phase 2) – This rule limits the emissions of NOX, CO, and
VOCs emitted from internal combustion engines. The rule is applicable to any internal combustion
engine with a rated brake horsepower greater than 50 horsepower. Emission standards for the three
pollutants are specified for each category of engine along with compliance dates for each standard.
The source must also comply with the monitoring methods and other requirements specified in the
rule.
Rule 4901 (Wood‐burning Fireplaces and Wood‐burning Heaters) – This rule limits CO and
particulate emissions from wood‐burning fireplaces and heaters. The rule specifies that only U.S.
EPA Phase II Certified or pellet‐fueled wood‐burning heaters are to be sold, installed, transferred, or
offered for sale within the district. The rule sets wood‐burning heater and fireplace limitations for
new residential developments as follows:

4.1 Air Quality
University of California, Merced 4.1‐16 UC Merced 2020 LRDP Recirculated Draft SEIR
December 2019
5.3.1 No person shall install a wood‐burning fireplace in a new residential development with a
density greater than two dwelling units per acre.
5.3.2 No person shall install more than two U.S. EPA Phase II Certified wood‐burning heaters
per acre in any new residential development with a density equal to or greater than three
dwelling units per acre.
5.3.3 No person shall install more than one wood‐burning fireplace or wood‐burning heater
per dwelling unit in any new residential development with a density equal to or less than two
dwelling units per acre.
Rule 4902 (Residential Water Heaters) – This rule applies to and limits emissions of NOX from
residential natural gas‐fired heaters. Natural gas‐fired heaters with a rated heat input equal to or less
than 75,000 British thermal units per hour (Btu/hr) and manufactured after December 17, 1993, are not
to be sold, installed, or offered for sale that emit more than 40 nanograms of NOX per joule of heat
output.
Rule 8021 (Construction, Demolition, Excavation, Extraction, and Other Earthmoving Activities) –
This rule limits fugitive dust emissions from construction, demolition, excavation, extraction, and
other earthmoving activities. Development of the 2020 LRDP will involve such activities.
Rule 8031 (Bulk Materials) – This rule details steps to be followed when handling bulk materials,
such as utilizing wind barriers, applying water or stabilizers to limit Visible Dust Emissions (VDE),
and covering materials when storing. This rule is intended to limit fugitive dust emissions from the
outdoor handling, storage, and transport of bulk materials.
Rule 8041 (Carryout and Trackout) – This rule applies to sites where carryout and trackout will
occur. Earthmoving activities, moving bulk materials, and unpaved roads/and traffic areas subjects
the project to this rule, which limits vehicle trips and mandates cleanup of carryout and a Dust
Control Plan.
Rule 8051 (Open Areas) – This rule applies to any open area having 0.5 acres or more in urban areas
or 3.0 or more acres in rural areas, and therefore applies to campus development under the 2020
LRDP. To limit fugitive dust emissions, the rule mandates at least one of the following: the
application of water or dust suppressants, the establishment of vegetation on disturbed areas, and/or
the paving, graveling, or application of stabilizers to unvegetated areas.
Rule 8061 (Paved and Unpaved Roads) – This rule limits fugitive dust in relation to roads, requiring
compliance with the American Association of State Highway and Transportation Officials (AASHTO)
guidelines.
Rule 8071 (Unpaved Vehicle/Equipment Traffic Areas) – In order to limit fugitive dust emissions
from unpaved areas, this rule requires compliance with Regulation VIII to limit VDE. The rule also
mandates restricted access on disturbed surfaces and reducing such surfaces through vegetative
materials, watering, graveling, paving, etc.

4.1 Air Quality
University of California, Merced 4.1‐17 UC Merced 2020 LRDP Recirculated Draft SEIR
December 2019
Rule 9510 (Indirect Source Review) – This rule fulfills the district’s emission reduction commitments
in the PM10 and O3 attainment plans. Applicants developing property over the limits specified in the
rule (e.g., 50 or more residential units) or nonresidential projects emitting more than 2 tpy of
operational NOX or PM10 are subject to this rule and must file an Air Impact Assessment (AIA)
application prior to applying for a final discretionary approval from a lead agency (e.g., tentative
tract map). This rule is discussed in more detail below.
Indirect sources are land uses that attract or generate motor vehicles trips. Indirect source emissions
contain many pollutants, principally PM10, reactive organic gases (ROG), and NOX. The SJVAPCD
included a requirement in the adopted 2003 PM10 Plan and the Extreme Ozone Attainment Demonstration
Plan to develop and implement an indirect source rule (ISR) by July 2004, with implementation to begin
in 2005. The SJVAPCD adopted Rule 9510 (Indirect Source Review) on December 15, 2005, and it became
effective in March 2006.
The purpose of Rule 9510 is to reduce emissions of NOX and PM10 from new development projects. The
rule applies to projects that, upon full buildout, will include any one of the following:
50 residential units
2,000 square feet of commercial space
25,000 square feet of light industrial space
20,000 square feet of medical or recreational space
39,000 square feet of general office space
100,000 square feet of heavy industrial space
9,000 square feet of educational space
10,000 square feet of government space
9,000 square feet of any land use not identified above
Several sources are exempt from the rule, including transportation projects, transit projects,
reconstruction projects that result from a natural disaster, and development projects that have primary
sources of emissions that are subject to SJVAPCD Rule 2201 (New and Modified Stationary Source
Review) and Rule 2010 (Permits Required). Any development project that has a mitigated baseline below
2 tpy for NOX and 2 tpy for PM10 is also exempted from the mitigation requirements of the rule.

4.1 Air Quality
University of California, Merced 4.1‐18 UC Merced 2020 LRDP Recirculated Draft SEIR
December 2019
Local Plans and Policies
Local governments have the authority and responsibility to reduce air pollution through their police
power and land use decision‐making authority. In general, a first step toward implementation of a local
government’s responsibility is accomplished by identifying air quality goals, policies, and
implementation measures in its general plan. Local jurisdictions are also encouraged by the SJVAPCD to
incorporate air quality elements in local plans. In 1994, SJVAPCD published Air Quality Guidelines for
General Plans, which was subsequently revised in June 2005. The guidelines provide assistance to local
governments for developing policies and implementing strategies at the local level that are consistent
with regional efforts to manage air quality. In 2009, the Guidelines were supplemented with the AB 170
Requirements for General Plans and an Emissions Inventory Data Guide.
Through capital improvement programs, local governments can fund infrastructure that contributes to
improved air quality. Examples of infrastructure improvements include bus turnouts, energy‐efficient
streetlights, and synchronized traffic signals.
Finally, CEQA requires local governments to assess air quality impacts, and recommend and enforce
feasible mitigation of potential air quality impacts by conditioning discretionary permits, and by
monitoring and ensuring implementation of the mitigation. To facilitate compliance with CEQA
requirements, the SJVAPCD published in 2015 the Guide for Assessing and Mitigating Air Quality Impacts
(GAMAQI). The GAMAQI is an advisory document that provides local jurisdictions with procedures for
addressing air quality impacts in environmental documents. The guide provides methods for assessing
air quality impacts, thresholds of significance recommended in the State CEQA Guidelines and those
adopted by the SJVAPCD, and recommended mitigation measures.
The SJVAPCD requires all local governments within its eight‐county jurisdiction to adopt resolutions as
part of the Extreme Ozone Attainment Demonstration Plan. The resolutions, which must be approved by the
U.S. EPA, must describe reasonably available control measures that each jurisdiction will implement in
order to reduce ozone‐causing emissions from transportation sources. The SJVAPCD has also developed
plans regarding PM to maintain healthy levels of PM10 (PM10 Plan, 2007) and to attain 1997 federal
standards for PM2.5 (2016 Moderate Area Plan).
To ensure a coordinated approach between the SJVAPCD, local governments, and regional transportation
plans, the air district entered into a memorandum of understanding with the Merced County Association
of Governments (MCAG), which includes the City and County of Merced. As a regional transportation
planning agency, one of the purposes of MCAG is to inform and advise member agencies on air quality
issues and policies; to ensure that MCAG’s transportation plans, programs, and projects conform to the

4.1 Air Quality
University of California, Merced 4.1‐19 UC Merced 2020 LRDP Recirculated Draft SEIR
December 2019
most recent air quality requirements, and to coordinate effectively with other government agencies on
these matters.
4.1.4 Impacts and Mitigation Measures
Significance Criteria
This SEIR uses significance criteria derived from Appendix G of the State CEQA Guidelines. For the
purposes of this SEIR, impacts related to air quality would be significant if implementation of the 2020
LRDP would:
Conflict with or obstruct implementation of the applicable air quality plan;
Result in a cumulatively considerable net increase of any criteria pollutant for which the project
region is nonattainment under an applicable federal or state ambient air quality standard;
Expose sensitive receptors to substantial pollutant concentrations; or
Result in other emissions (such as those leading to odors adversely affecting a substantial number of
people.
To assess a project’s impact relative to the significance criteria listed above, the SJVAPCD has established
air quality significance thresholds to determine whether air quality impacts from implementing proposed
projects would be significant. These thresholds are contained in the SJVAPCD’s GAMAQI. If
project‐specific emissions exceed any of the emission thresholds listed in Table 4.1‐4, SJVAPCD Air
Quality Significance Thresholds, the impact from the emissions of the specific pollutant will be
considered a significant impact.
In addition to the thresholds presented in Table 4.1‐4, the GAMAQI recommends procedures for
identifying cumulative impacts by pollutant. Lead agencies are recommended to use the project
thresholds for ROG and NOX (O3 precursors) in Table 4.1‐4 to determine cumulative O3 impacts. For
cumulative PM10 impacts, lead agencies are recommended to examine the potential exposure of nearby
sensitive receptors to PM10 emissions from earthmoving activities associated with the project and any
nearby projects that may occur at the same time. If warranted, enhanced dust control measures listed in
the GAMAQI should be used to reduce the cumulative PM10 impact to less than significant levels.
Cumulative CO impacts are considered less than significant if future cumulative traffic levels, including
the project’s contribution to traffic, does not cause an exceedance of the ambient air quality standards.
Cumulative impacts from TACs would be considered significant if the estimated health risk exceeds the
thresholds listed in Table 4.1‐4.

4.1 Air Quality
University of California, Merced 4.1‐20 UC Merced 2020 LRDP Recirculated Draft SEIR
December 2019
Table 4.1‐4
SJVAPCD Air Quality Significance Thresholds
Mass Emissions Thresholds
Pollutant Construction/Operation (tpy)
NOX 10
ROG 10
PM10 15
PM2.5 15
SOX 27
CO 100
Lead —
Toxic Air Contaminants and Odor Thresholds
TACs Probability of contracting cancer for the Maximally Exposed Individual (MEI)
exceeds 20 in 1 million; or
Ground‐level concentrations of non‐carcinogenic toxic air contaminants would
result in a Hazard Index equal or greater than 1 for the MEI.
Odor More than one confirmed complaint per year averaged over a three‐year period or
three unconfirmed complaints per year averaged over a three‐year period.
Ambient Air Quality for Attainment Criteria Pollutants of Concern
NO2
1‐hour average
annual average
In attainment; significant if project causes or contributes to an exceedance of either
of the following standards:
0.18 parts per million (state)
0.03 parts per million (state)
CO
1‐hour average
8‐hour average
In attainment; significant if project causes or contributes to an exceedance of either
of the following standards:
20 parts per million (state)
9.0 parts per million (state)
Source: SJVAPCD, Air Quality Significance Thresholds – Criteria Pollutants, 2015. http://www.valleyair.org/
transportation/0714‐GAMAQI‐Criteria‐Pollutant‐Thresholds‐of‐Significance.pdf; SJVAPCD, Air Quality
Thresholds of Significance – Toxic Air Contaminants, 2015. http://www.valleyair.org/transportation/0714‐
GAMAQI‐TACs‐Thresholds‐of‐Significance.pdf
Note: The SJVAPCDʹs approach to analyses of construction impacts is to require implementation of effective and
comprehensive control measures rather than to require detailed quantification of emission concentrations for
modeling of direct impacts. The SJVAPCD has determined that compliance with Regulation VIII for all sites and
implementation of all other control measures indicated in Tables 6‐2 and 6‐3 of the GAMAQI (as appropriate,
depending on the size and location of the project site) would constitute sufficient mitigation to reduce PM10
impacts to a level considered less than significant.
Issues Not Discussed Further
Although campus development under the 2020 LRDP would include sources that would result in TAC
emissions, at this time adequate information with respect to these sources (including but not limited to
the exact location of each future source; the types and quantities of chemicals that would be used in the
case of laboratories; the types and volumes of fuels that would be used in the case of combustion sources;
building and stack heights; types of controls; etc.) is not available to allow for the quantification and
evaluation of the potential human health risk. However, based on data from other UC campuses such as
UC Davis, it is anticipated that the human health risk from the development of the campus under the
2020 LRDP would not result in a significant human health risk on or off site. For instance, according to
the 2018 LRDP EIR prepared for UC Davis which evaluated impacts from the development of that

4.1 Air Quality
University of California, Merced 4.1‐21 UC Merced 2020 LRDP Recirculated Draft SEIR
December 2019
campus through 2031 to an enrollment level of 39,000 full‐time equivalent students, the cumulative
human health risk from all on‐campus TAC sources (existing and future research laboratories, boilers and
generators, a cogeneration plant, etc., for a total of more than 100 individual TAC sources) was
determined to be less than 10 in 1 million (This impact is considered significant if the probability of
contracting cancer for the Maximally Exposed Individual (MEI) exceeds 10 in 1 million) (UC Davis 2018).
Given that UC Davis campus with a much larger existing research program (including a medical school
and an extensive veterinary medicine program) and certain unique TAC sources (such as a wastewater
treatment plant and a cogeneration plant) is not expected to result in a significant human health risk in
the region, UC Merced upon completion of development under the 2020 LRDP would be considered
unlikely to result in TAC emissions that would result in a significant human health risk in the region.
Furthermore, to the extent that UC Merced proposes to add new sources such as diesel‐operated
emergency generators that could result in TAC emissions, UC Merced would conduct an evaluation of
the testing emissions from the proposed generator to make sure its operation does not result in a human
health impact on the campus population. Human health risk from TAC emissions therefore are not a
concern and are not discussed further in this section.
UC Merced notes that Merced County Regional Waste Management Authority (MCRWMA) and UC
Merced are working together on a landfill‐gas‐to‐energy project, which involves the collection and
treatment of landfill gas (methane) at the Highway 59 Landfill, conveyance of the treated gas to UC
Merced campus via pipeline, and the combustion of the gas in three microturbines to produce electricity
and hot water for campus use. The microturbines would allow UC Merced to discontinue the use of three
natural gas fired boilers that are located in the Central Plant and are used to produce hot water. The
microturbines would be located in an enclosed structure adjacent to the Central Plant. Project
construction is anticipated to take place over a period of about 1.5 to 2 years, with completion in 2020.
The MCRWMA has conducted environmental review of the proposed project which shows that the
proposed microturbines would produce TAC emissions that would be less than the TAC emissions that
result from the operation of the three boilers. As a result, the project would not adversely affect receptors
on the campus (MCRWMA 2019).
Methodology
The 2020 LRDP is not a specific development project but a plan for development of the Merced campus,
which if fully implemented, would ultimately support a student population of 15,000 students, and about
2,411 on‐campus faculty and staff by 2030, and would allow the construction of an additional 1.83 million
gross square feet (gsf) of new building space on the campus such that by 2030, there would be a total of
about 5 million gsf of building space. According to the land use diagram included in the 2020 LRDP, the
additional facilities would be located almost entirely with the areas designated Campus Mixed Use
(CMU). As noted in Section 3.0, Project Description, of the 274 acres of CMU land on the campus, 171
acres are either already developed or will be developed with the 2020 Project facilities, and therefore, new

4.1 Air Quality
University of California, Merced 4.1‐22 UC Merced 2020 LRDP Recirculated Draft SEIR
December 2019
facilities under the 2020 LRDP would either be built as infill development within the developed area or
on the remaining 103 acres.
Because the proposed project is a plan and not a specific project with a defined construction schedule,
construction emissions from the construction of the planned building space were calculated by assuming
that about 1.83 million gsf of building space would be constructed over a 10‐year period and that no more
than 103 acres of land would be graded to construct the facilities. CalEEMod 2016.3.2 (CalEEMod) was
used to estimate construction emissions. More information on the assumptions and methodology used is
presented under LRDP Impact AQ‐1, below
CalEEMod was also used to estimate operational emissions from the campus under 2030 conditions.
Area source emissions were calculated based on the amount and types of building spaces that would be
added to the campus. Mobile source emissions were calculated based on project trip generation data from
the Traffic Impact Assessment prepared for this SEIR. Other than emergency generators that would not
operate routinely, new stationary sources such as boilers would not be added to the campus under the
2020 LRDP. This is because in order to comply with the UC Sustainable Practices Policy, all new
buildings added to the campus will be fully electric (for lighting, space heating, and hot water
production), with electricity obtained either from on‐campus renewable sources or as 100 percent
renewable energy from the grid.
4.1.5 LRDP Impacts and Mitigation Measures
LRDP Impact AQ‐1: Campus development under the 2020 LRDP would not result in construction
emissions that would result in a cumulatively considerable net increase of
criteria pollutants for which the air basin is in non‐attainment. (Less than
Significant)
The 2009 LRDP EIS/EIR analyzed the potential for campus development under the 2009 LRDP to result in
an impact on air quality from construction of campus facilities. That analysis, which was presented under
Impact AQ‐1, analyzed construction air emissions from the construction of approximately 8.9 million gsf
of building space over a 21‐year period extending from 2009 through 2030. That analysis assumed that
the entire 815‐acre campus would be graded at the maximum rate of 10 acres per day. URBEMIS was
used to estimate emissions and the results of the modeling indicated that campus construction would
result in a less than significant impact on air quality.
As noted in Section 3.0, Project Description, UC Merced is now expected to grow at a slower pace than
originally anticipated, such that by 2030, the enrollment level is expected to be 15,000 students, and the
faculty and staff projection for 2030 is also substantially lower than previously projected and analyzed in
the 2009 LRDP EIS/EIR. Also, by 2020 UC Merced would have constructed about 2.5 million gsf of
building space, and between 2020 and 2030, UC Merced would construct an additional 1.83 million gsf of

4.1 Air Quality
University of California, Merced 4.1‐23 UC Merced 2020 LRDP Recirculated Draft SEIR
December 2019
building space within a 103‐acre portion of the campus. Given these changes in the proposed project and
the conditions in which it would be implemented, a revised analysis of the project’s construction
emissions impact is presented below. The analysis below presents the potential for construction activities
on the campus under the 2020 LRDP to result in a cumulatively considerable net increase in pollutants for
which the air basin is in non‐attainment.
Construction of campus facilities under the 2020 LRDP would require site preparation (i.e., clearing and
grading); pavement and asphalt installation; and construction of the buildings. For purposes of this
assessment, it was assumed that there would be ongoing construction on the campus between 2021 and
2030, and site buildout under the 2020 LRDP was assumed to be completed by 2030; although, in reality,
development could take longer and buildout may not be completed until several years later. During this
period, construction emissions would be generated by heavy‐duty construction equipment, on‐road
trucks for material deliveries, and construction worker vehicles. ROG emissions would occur as a result
of asphalt paving and architectural coatings. Fugitive dust would be generated by grading and related
activities.
Because of the construction time frame and the normal day‐to‐day variability in construction activities, it
is difficult, if not impossible, to precisely quantify the emissions associated with each construction
subphase. In order to estimate the construction emissions using CalEEMod, a conservative approach was
taken in which construction of the campus was assumed to occur over the following four construction
subphases within an overall time schedule from January 1, 2021 to November 30, 2030:
Site Preparation: Site preparation would take place from January 2021, to March 2021.
Grading: It is assumed that the entire 103‐acre CMU area would be graded. Grading would take
place from March 2021 to October 2021.
Building Construction: Building construction would take place from October 2021 to October 2027.
A total of 1.83 million gsf of buildings would be built.
Paving: Paving would occur from October 2023 to November 2030, and approximately 15 acres
would be paved.
Architectural Coatings: Architectural coatings would be applied from October 2023 to December
2030.
Based on the schedule and assumptions described above and CalEEMod default assumptions, the
CalEEMod model was used to estimate annual construction emissions of criteria pollutants from 2021 to
2030, which are shown in Table 4.1‐5, Estimated Unmitigated Construction Emissions.

4.1 Air Quality
University of California, Merced 4.1‐24 UC Merced 2020 LRDP Recirculated Draft SEIR
December 2019
Table 4.1‐5
Estimated Unmitigated Construction Emissions
Construction Year
Emissions in Tons per Year
ROG NOX CO SOX PM101 PM2.51
2021 0.69 6.14 4.85 0.01 1.69 0.89
2022 1.22 6.94 9.20 0.03 2.20 0.68
2023 1.42 6.00 9.04 0.03 2.25 0.69
2024 2.83 7.07 11.25 0.04 2.63 0.82
2025 2.73 6.69 10.62 0.04 2.60 0.80
2026 2.67 6.62 10.20 0.04 2.60 0.80
2027 2.42 5.33 8.19 0.03 2.09 0.65
2028 1.73 1.33 2.93 0.01 0.44 0.16
2029 1.73 1.33 2.88 0.01 0.44 0.16
2030 1.62 0.93 2.59 0.01 0.38 0.13
Maximum Emissions in Any Year 2.83 7.07 11.25 0.04 2.63 0.89
SJVAPCD Threshold: 10 10 100 27 15 15
Exceeds Threshold? No No No No No No
Source: Impact Sciences, Inc.
Emissions calculations are provided in Appendix 4.1.
Totals in the table may not appear to add exactly due to rounding in the computer model calculations. 1 PM10 and PM2.5 emissions reflect compliance with SJVAPCD Regulation VIII.
As discussed in the Regional Topography and Meteorology section above, the SJVAB is in
nonattainment for the federal standards for ozone (8 hour) and PM2.5. The air basin is in nonattainment
for the state standards of ozone (1 hour), ozone (8 hour), PM10, and PM2.5. O3 precursors include NOx and
ROG. According to the SJVAPCD’s GAMAQI, “If a project is significant based on the thresholds of
significance for criteria pollutants, then it is also cumulatively significant. This does not imply that if the
project is below all such significance thresholds, it cannot be cumulatively significant” (SJVAPCD 2015).
As shown in Table 4.1‐5, the emissions associated with the construction of facilities under the 2020 LRDP
would not exceed SJVAPCD significance thresholds for any of the pollutants, including those for which
the air basin is in non‐attainment. Therefore, construction emissions associated with campus
development under the 2020 LRDP would result in a less than significant impact on air quality.
With respect to small‐scale projects that may be located within lands designated CMU, CBRSL or ROS,
due to the small size and nature of these projects and for the same reasons set forth above, they would be
unlikely to result in construction emissions that would exceed applicable thresholds. The impact would
be less than significant.
Although SJVAPCD significance thresholds are not anticipated to be exceeded given the construction
schedule detailed above, the exact construction schedule for future projects as part of the 2020 LRDP has
yet to be determined. Should a number of projects be constructed concurrently on the campus, it is

4.1 Air Quality
University of California, Merced 4.1‐25 UC Merced 2020 LRDP Recirculated Draft SEIR
December 2019
possible that the SJVAPCD threshold for NOx could be exceeded. Therefore, LRDP Mitigation Measure
AQ‐1a, which is a construction best practice, is set forth below and would be implemented during
construction of future projects to minimize NOx emissions and avoid a significant air quality impact.
Similarly, LRDP Mitigation Measure AQ‐1b is proposed to reduce emissions of dust during the
construction of projects on the campus. Table 4.1‐6, Estimated Mitigated Construction Emissions,
reports the emissions that would result following the implementation of fugitive dust control measures
that would be applied during grading to comply with SJVAPCD Regulation VIII along with a
requirement that Tier 4 construction equipment be used to minimize NOx emissions during construction.
Table 4.1‐6
Estimated Mitigated Construction Emissions
Construction Year
Emissions in Tons per Year
ROG NOX CO SOX PM101 PM2.51
2021 0.28 1.30 5.02 0.01 0.88 0.37
2022 1.05 5.20 9.35 0.03 2.10 0.58
2023 1.24 4.19 9.26 0.03 2.16 0.59
2024 2.57 4.37 11.77 0.04 2.49 0.69
2025 2.49 4.26 11.15 0.04 2.48 0.69
2026 2.44 4.19 10.74 0.04 2.48 0.68
2027 2.21 3.22 8.69 0.03 1.99 0.55
2028 1.63 0.24 3.28 0.01 0.38 0.11
2029 1.63 0.23 3.24 0.01 0.38 0.11
2030 1.49 0.20 2.75 0.01 0.35 0.10
Maximum Emissions in Any Year 2.57 5.20 11.77 0.04 2.49 0.69
Source: Impact Sciences, Inc.
Emissions calculations are provided in Appendix 4.1.
Totals in the table may not appear to add exactly due to rounding in the computer model calculations. 1 PM10 and PM2.5 emissions reflect compliance with SJVAPCD Regulation VIII.
Mitigation Measures:
LRDP MM AQ‐1a: The construction contractors shall be required via contract specifications to use
construction equipment rated by the U.S. EPA as meeting Tier 4 (model year
2008 or newer) emission limits for engines between 50 and 750 horsepower.
LRDP MM AQ‐1b: UC Merced shall include in all construction contracts the measures specified in
SJVAPCD Regulation VIII (as it may be amended for application to all
construction projects generally) to reduce fugitive dust impacts, including but
not limited to the following:

4.1 Air Quality
University of California, Merced 4.1‐26 UC Merced 2020 LRDP Recirculated Draft SEIR
December 2019
All disturbed areas, including storage piles, which are not being actively
utilized for construction purpose, shall be effectively stabilized of dust
emissions using water, chemical stabilizer/suppressant, or vegetative ground
cover.
All on‐site unpaved roads and off‐site unpaved access roads shall be
effectively stabilized of dust emissions using water or chemical
stabilizer/suppressant.
All land clearing, grubbing, scraping, excavation, land leveling, grading, cut
and fill, and demolition activities shall be effectively controlled of fugitive
dust emissions using application of water or by presoaking.
When materials are transported off‐site, all material shall be covered,
effectively wetted to limit visible dust emissions, or at least 6 inches of
freeboard space from the top of the container shall be maintained.
All operations shall limit or expeditiously remove the accumulation of mud
or dirt from adjacent public streets at least once every 24 hours when
operations are occurring. (The use of dry rotary brushes is expressly
prohibited except where preceded or accompanied by sufficient wetting to
limit visible dust emissions. Use of blower devices is expressly forbidden.)
Following the addition of materials to, or the removal of materials from, the
surface of outdoor storage piles, storage piles shall be effectively stabilized of
fugitive dust emissions by using sufficient water or chemical stabilizer/
suppressant.
LRDP Impact AQ‐2: Campus development under the 2020 LRDP would result in operational
emissions that would involve a cumulatively considerable net increase of
criteria pollutants for which the air basin is in non‐attainment. (Significant;
Significant and Unavoidable)
The 2009 LRDP EIS/EIR analyzed the potential for campus development under the 2009 LRDP to result in
an impact on air quality from campus operations. That analysis, which was presented under Impact AQ‐
2, analyzed impacts of a 25,000‐student campus in 2030. URBEMIS was used to estimate emissions and
the results of the modeling indicated that campus operations would result in a significant impact on air
quality due to emissions of ROG, NOX, and PM10 that would exceed SJVAPCD thresholds.
As noted in Section 3.0, Project Description, UC Merced is now expected to grow at a slower pace than
originally anticipated, such that by 2030, the enrollment level is expected to be 15,000 students, and the
faculty and staff projection for 2030 is also substantially lower than previously projected and analyzed in
the 2009 LRDP EIS/EIR. In light of this change in the proposed project and the conditions in which it

4.1 Air Quality
University of California, Merced 4.1‐27 UC Merced 2020 LRDP Recirculated Draft SEIR
December 2019
would be implemented, a revised analysis of the project’s operational emissions impact is presented
below.
Under the 2020 LRDP, UC Merced would develop facilities, which would accommodate approximately
15,000 students and 2,411 employees. Campus facilities involving approximately 1.83 million gsf of
building space would be added, including 0.67 million gsf of academic space, such as classrooms,
laboratory and research areas, and alumni and conference centers; 0.33 million gsf of student life and
athletic uses; 0.48 million gsf of campus operations; 0.35 million gsf of housing; and approximately 1,680
parking spaces.
Emissions resulting from area sources, such as landscape maintenance equipment, and periodic
architectural coating activities, were estimated using CalEEMod. The area sources emissions are shown in
Table 4.1‐7, Estimated Unmitigated Operational Emissions. Trip generation rates for use in CalEEMod
were obtained from the Traffic Impact Assessment for the proposed project. The estimated mobile source
emissions are based on buildout of all land uses planned under the 2020 LRDP and are also presented in
Table 4.1‐7.
Table 4.1‐7
Estimated Unmitigated Operational Emissions
Emissions in Tons per Year
Emissions Source ROG NOX CO SOX PM10 PM2.5
Area Sources 8.51 0.10 8.96 0.00 0.05 0.05
Energy/Stationary Sources 0.23 2.08 1.47 0.01 0.16 0.16
Mobile Sources 1.59 22.05 14.93 0.11 6.74 1.85
Annual Emissions Total 10.34 24.24 25.36 0.12 6.95 2.06
SJVAPCD Threshold 10 10 100 27 15 15
Exceeds Threshold? Yes Yes No No No No
Source: Impact Sciences, Inc. Emissions calculations are provided in Appendix 4.1.
Emissions totals do not include wood‐burning stoves or fireplaces which would not be built on the campus
Totals in table may not appear to add exactly due to rounding in the computer model calculations.
Table 4.1‐7 reports the maximum level of emissions that would result when all of the development on the
campus under the 2020 LRDP has been completed. In the years before that, when the level of
development and campus size is smaller, the emissions would be lower, and would likely not exceed the
significance thresholds. Furthermore, area source and energy emissions would likely be much lower than
reported because pursuant to UC Sustainable Practices Policy, future buildings on the campus would be
fully electric and would not involve natural gas combustion for heating purposes. Nonetheless, based on
the estimated emissions reported in Table 4.1‐7, the campus at full development under the 2020 LRDP
would generate annual emissions that would exceed the SJVAPCD significance thresholds for ROG and

4.1 Air Quality
University of California, Merced 4.1‐28 UC Merced 2020 LRDP Recirculated Draft SEIR
December 2019
NOx, and result in a cumulatively considerable net increase in ozone for which the air basin is in non‐
attainment. Therefore, operational emissions of ROG and NOx generated by campus operations would be
considered to have a significant air quality impact.
As noted earlier in this section, NOx and ROG are ozone precursors. The main health concern regarding
exposure to ground‐level ozone is its effects on the respiratory system, particularly on lung function. As
noted earlier, several factors influence these health impacts, including the concentration of ground‐level
ozone in the atmosphere, the duration of exposure, the average volume of air breathed per minute, the
length of intervals between short‐term exposures, and the sensitivity of the person to the exposure.3,4
As stated by SJVAPCD in an amicus brief that the Air District submitted to the California Supreme Court
in Sierra Club v. County of Fresno (Friant Ranch L.P.), it is not feasible to conduct an analysis of the effects
of a project’s criteria pollutant emissions (i.e., NOx and ROG) on human health. Ozone is not directly
emitted and is formed when precursors NOx and ROG undergo complex chemical reactions in the
presence of sunlight. Once formed, ozone can be transported long distances by wind. Because of this
complexity, a specific amount of NOx or ROG emitted in a given area cannot be equated to a particular
concentration of ozone in that area. In addition to duration of exposure, it is the concentration of ozone
that results in health effects, and no computer models are available to estimate the concentrations of
ozone that would result near a project site or even at a distance that could result in specific health effects
(SJVAPCD 2018). Similarly, South Coast Air Quality Management District (SCAQMD) in its amicus brief
to the California Supreme Court in Sierra Club v. County of Fresno (Friant Ranch L.P.) stated that from a
scientific standpoint, it takes a large amount of additional precursor emissions to cause a modeled
increase in ambient ozone levels over an entire air basin, and provided evidence from its 2012 AQMP that
showed that if the daily emissions of NOx and ROG were reduced in amounts of 432 and 187 tons per
day respectively, the ozone concentrations in the air basin would go down by only 9 parts per billion
(SCAQMD 2018). For all these reasons, it is difficult to estimate the change in ozone concentrations that
would result from a project’s emissions of NOx and ROG and then to predict the magnitude of health
effects from the project’s exceedance of the significance criteria for regional ROG and NOx emissions.
To provide some context, the daily emissions due to project operations were compared to the total daily
emissions of NOx and ROG in the air basin. The estimated increase in ROG emissions of up to 10 tons per
year or approximately 0.03 tons per day due to the proposed project would be a relatively small fraction
3 The World Bank Group, Pollution Prevention and Abatement Handbook 1998: Toward Cleaner Production, pp.
227–230, 1999, www.ifc.org/wps/wcm/connect/dd7c9800488553e0b0b4f26a6515bb18/.pdf?MOD=AJPERES,
accessed February 11, 2019.
4 U.S. EPA, Air Quality Guide for Ozone, March 2015b, https://airnow.gov/index.cfm?action=pubs.aqiguideozone,
accessed February 11, 2019.

4.1 Air Quality
University of California, Merced 4.1‐29 UC Merced 2020 LRDP Recirculated Draft SEIR
December 2019
of the estimated 1,046 tons per day in the air basin in 2018.5 Similarly, the increase in NOx emissions of
up to 24 tons per year or approximately 0.07 tons per day of NOx due to the project would be a relatively
small fraction compared to an estimated 226 tons per day in the SJVAB in 2018. Nonetheless, the project’s
operational ROG and NOx emissions would exceed the applicable threshold and before mitigation would
have the potential to result in new or exacerbated air quality violations in the air basin. Table 4.1‐3,
above, indicates that the applicable ozone standards were exceeded in the SJVAB multiple times during
the years 2015 to 2017. By emitting ROG and NOx emissions in excess of the thresholds, the project would
contribute to more days of ozone exceedance or result in Air Quality Index values that are unhealthy for
sensitive groups and other populations. Potential outcomes from exposures during periods of ozone
exceedance would include an increase or exacerbation of respiratory illnesses, cardiovascular disease,
other associated health effects, and increased mortality. Other likely outcomes would be increases in
physician and emergency room visits as well as hospitalization and more school days missed by school‐
aged children living in the air basin.
LRDP Mitigation Measures AQ‐2a and AQ‐2b are proposed to reduce the increase in the campus’s
operational air emissions of ROG and NOx. LRDP Mitigation Measure AQ‐2a requires UC Merced to
promote the use of alternative transportation, alternative‐fuel vehicles, and to improve traffic flow.
Although implementation of LRDP Mitigation Measure AQ‐2a would reduce NOx emissions, the
reduction is not quantifiable and it is unlikely that it would reduce emissions to below the SJVAPCD
significance threshold. LRDP Mitigation Measure AQ‐2b includes measures to reduce ROG emissions,
by planting low maintenance landscaping, and utilizing electric landscaping equipment, low‐VOC
cleaning supplies and consumer products, and low‐VOC paints in campus maintenance. LRDP
Mitigation Measure AQ‐2b also recommends the use of solar water heating systems to reduce the
combustion of natural gas for water heating (the reduction due to this measure is not quantifiable at this
time). Table 4.1‐8, Estimated Mitigated Operational Emissions, shows the anticipated operational
emissions from the campus upon full development under the 2020 LRDP after mitigation.
With respect to small‐scale projects that may be located within lands designated CMU, CBRSL or ROS,
due to the small size (less than 10,000 square feet of building space and less than 2 acres of ground
disturbance) and nature of these projects, they would be unlikely to result in operational emissions that
would exceed applicable thresholds. The impact would be less than significant.
5 California Air Resources Board, CEPAM 2016‐ Standard Emission Tool February 15, 2017,
https://www.arb.ca.gov/app/emsinv/fcemssumcat/fcemssumcat2016.php, accessed February 12, 2019.

4.1 Air Quality
University of California, Merced 4.1‐30 UC Merced 2020 LRDP Recirculated Draft SEIR
December 2019
Table 4.1‐8
Estimated Mitigated Operational Emissions
Emissions in Tons per Year
Emissions Source ROG NOX CO SOX PM10 PM2.5
Area Sources 7.50 0.08 6.79 0.00 0.04 0.04
Energy/Stationary Sources 0.23 2.08 1.47 0.01 0.16 0.16
Mobile Sources 1.59 22.05 14.93 0.11 6.74 1.85
Annual Emissions Total 9.33 24.21 23.19 0.12 6.94 2.05
SJVAPCD Threshold 10 10 100 27 15 15
Exceeds Threshold? No Yes No No No No
Source: Impact Sciences, Inc. Emissions calculations are provided in Appendix 4.1.
Totals in table may not appear to add exactly due to rounding in the computer model calculations.
Mitigation Measures:
LRDP MM AQ‐2a: UC Merced shall implement the following measures to reduce emissions from
vehicles:
Provide pedestrian‐enhancing infrastructure to encourage pedestrian activity
and discourage vehicle use.
Provide bicycle facilities to encourage bicycle use instead of driving, such as
bicycle parking, bicycle lanes, bicycle lockers, and showers and changing
facilities for employees.
Provide preferential carpool and vanpool parking for non‐residential uses.
Provide transit‐enhancing infrastructure to promote the use of public
transportation, such as covered bus stops and information kiosks.
Provide facilities such as electric car charging stations and a CNG refueling
station to encourage the use of alternative‐fuel vehicles.
Improve traffic flows and congestion by timing of traffic signals at
intersections adjacent to the campus to facilitate uninterrupted travel.
Work with campus transit provider to replace CatTracks buses with either
electric buses or buses operated on alternative fuels.
Work with the City of Merced to establish park and ride lots and provide
enhanced transit service between the park and ride lots and the campus.
Replace campus fleet vehicles with electric vehicles or vehicles that operate
on alternative fuels.
Reduce the number of daily vehicle trips by providing more housing on
campus.

4.1 Air Quality
University of California, Merced 4.1‐31 UC Merced 2020 LRDP Recirculated Draft SEIR
December 2019
LRDP MM AQ‐2b: UC Merced shall implement the following measures to reduce emissions from
area and energy sources, as feasible:
Utilize low‐VOC6 cleaning supplies and low‐VOC paints (100 grams/liter or
less) in building maintenance.
Utilize electric equipment for landscape maintenance.
Plant low maintenance landscaping.
Implement a public information program for resident students to minimize
the use of personal consumer products that result in ROG emissions,
including information on alternate products.
Instead of natural gas water heaters, install solar water heating systems.
Significance after Mitigation: With implementation of LRDP Mitigation Measures AQ‐2a and AQ‐2b,
although the emissions would be reduced, campus operations would still result in annual emissions that
exceed the SJVAPCD significance threshold for NOx, and thereby still result in a cumulatively
considerable net increase in ozone for which the air basin is in non‐attainment. The operational emissions
of NOx generated by the campus would result in a significant and unavoidable impact on air quality.
LRDP Impact AQ‐3: Implementation of the 2020 LRDP would not expose sensitive receptors to
substantial pollutant concentrations of carbon monoxide. (Less than
Significant)
The 2009 LRDP EIS/EIR analyzed the potential for campus development under the 2009 LRDP to cause
high levels of CO due to traffic associated with the campus. That analysis, which was presented under
Impact AQ‐3, analyzed impacts of a 25,000‐student campus in 2030. A simplified CALINE2 screening
model was used to estimate CO concentrations at intersections most affected by project traffic. The
results of the modeling indicated that campus‐related traffic would not result in CO concentrations that
would exceed the state CO standards, and that a less than significant impact would occur.
As noted in Section 3.0, Project Description, UC Merced is now expected to grow at a slower pace than
originally anticipated, such that by 2030, the enrollment level is expected to be 15,000 students, and the
faculty and staff projection for 2030 is also substantially lower than previously projected and analyzed in
6 As explained in the Criteria Air Pollutants section, volatile organic compounds (VOCs) are the same as ROGs.

4.1 Air Quality
University of California, Merced 4.1‐32 UC Merced 2020 LRDP Recirculated Draft SEIR
December 2019
the 2009 LRDP EIS/EIR. In light of this change in the proposed project and the conditions in which it
would be implemented, a revised analysis of the project’s CO impact is presented below.
Campus operations under the 2020 LRDP would not generate TAC or PM2.5 emissions that could affect
the health of the community near the project site, as the majority of the vehicles associated with the
campus would operate on gasoline and not diesel which is the primary source of TACs and PM2.5. CO
emitted by traffic generated under the 2020 LRDP is the criteria pollutant that would have the potential to
result in substantial concentrations.
Traffic‐congested roadways and intersections have the potential to generate localized high levels of CO.
Localized areas where ambient concentrations exceed state and/or federal standards are termed CO
“hotspots.” CO is produced in greatest quantities from vehicle combustion and is usually concentrated at
or near ground level because it does not readily disperse into the atmosphere. As a result, potential air
quality impacts to sensitive receptors are assessed through an analysis of localized CO concentrations.
Air pollutant monitoring data indicate that CO levels have been at healthy levels (i.e., below State and
federal standards) in San Joaquin Valley for several years. As a result, the region has been designated as
attainment for the CO standard. Nonetheless, congested intersections with a large volume of traffic have
the greatest potential to cause high, localized concentrations of CO. To analyze the potential for the
proposed project to cause or contribute to high CO concentrations, a CO screening guidance provided by
the Bay Area Air Quality Management District (BAAQMD) was used. This guidance provides that a
project would have a less than significant impact with respect to CO levels if the addition of project traffic
would not increase the total traffic at any affected intersection to more than 44,000 vehicles per hour.
Buildout under 2020 LRDP would generate a relatively small amount of new traffic: 8,406 total daily trips
or 739 AM peak hour trips and 808 PM peak hour trips. The Traffic Impact Assessment prepared for the
2020 LRDP (Appendix 4.8) shows that the cumulative traffic volumes, including the traffic due to the
proposed project, at all intersections affected by the project would be less than 44,000 vehicles per hour.
Therefore, the project will not result in the violation of the CO standards and would not expose sensitive
receptors to substantial CO concentrations. The impact would be less than significant.
With respect to small‐scale projects that may be located within lands designated CMU, CBRSL or ROS,
due to the small size and nature of these projects and for the same reasons set forth above, they would be
unlikely to result in CO emissions that would exceed applicable thresholds. The impact would be less
than significant.
Mitigation Measures: No mitigation is required.

4.1 Air Quality
University of California, Merced 4.1‐33 UC Merced 2020 LRDP Recirculated Draft SEIR
December 2019
LRDP Impact AQ‐4: Implementation of the 2020 LRDP would not conflict with or obstruct
implementation of the applicable air quality plan. (Less than Significant)
In compliance with the State CEQA Guidelines, the analysis below evaluates whether implementation of
the 2020 LRDP would conflict with or otherwise obstruct implementation of regional air quality plans.
For air quality planning purposes, the SJVAPCD creates emissions inventories based on existing and
foreseeable future land uses within its jurisdiction. If a new project is consistent with the planned land
use designation that was considered in the development of an air quality management plan, the proposed
project would not conflict and would not obstruct implementation of the applicable air quality
management plan. Generally, a project’s conformance with a local general plan that was taken into
account in the preparation of an air quality management plan would demonstrate that the project would
not conflict with or obstruct implementation of the air quality management plan. As noted in the 2009
LRDP EIS/EIR, Merced County has recognized the Merced campus since it amended the Merced County
General Plan in 1996 to designate a UC Merced Specific Urban Development Plan. Development of the
campus is also included in the City of Merced 2030 Vision General Plan, the growth projections of which
are reflected in the SJVAPCD’s air quality plans. All of the previous UC Merced LRDPs projected an
enrollment level of 25,000 students by 2030. However, based on more recent enrollment growth rates, the
campus is expected to grow to 15,000 students by 2030. Because a higher level of growth at the campus
has been accounted for and included in the air quality planning efforts of the region, implementation of
the 2020 LRDP would not conflict with or obstruct implementation of the applicable air quality plan.
Although the emissions associated with campus operation at full development under the 2020 LRDP
would result in a significant impact for the reasons set forth in the discussion of LRDP Impact AQ‐2, the
effect of campus buildout under the 2020 LRDP with respect to the regional air quality management plan
would, of itself, be less than significant.
With respect to small‐scale projects that may be located within lands designated CMU, CBRSL or ROS,
due to the small size and nature of these projects and for the same reasons set forth above, they would be
unlikely to conflict with an applicable air quality plan. The impact would be less than significant.
Mitigation Measures: No mitigation is required.
LRDP Impact AQ‐5: Implementation of the 2020 LRDP would not result in odors adversely
affecting a substantial number of people. (Less than Significant)
Construction activities under the 2020 LRDP would require the use of diesel‐fueled equipment,
architectural coatings, and asphalt, all of which have an associated odor. However, these odors are not
4.1 Air Quality
University of California, Merced 4.1‐34 UC Merced 2020 LRDP Recirculated Draft SEIR
December 2019
pervasive enough to cause objectionable odors affecting a substantial number of people. Consequently,
construction under the 202‐ LRDP would not cause odors.
Buildout under the 2020 LRDP consists of the development of a university campus, including academic
facilities, athletic facilities, and student housing. The operation of such facilities is not considered to be a
significant source of odors, and all research using odorous materials would take place inside buildings, so
there would be no odorous emissions associated with research activities. In addition, the project would
not be located near any significant odor sources. Consequently, implementation of the 2020 LRDP would
not cause or be affected by odors. This impact is less than significant.
Mitigation Measures: No mitigation is required.
4.1.6 Cumulative Impacts and Mitigation Measures
Cumulative Impact C‐AQ‐1: The construction and operation of the campus under the 2020 LRDP, in
conjunction with other past, present, and reasonably foreseeable
future development in the project area, could hinder air quality
attainment and maintenance efforts for criteria pollutants. (Significant;
Significant and Unavoidable)
For air pollutants such as CO that result in impacts that are highly localized, the study area is focused on
the roadways and intersections that would be used by the project‐related traffic. For pollutants that are
regional in nature, the study area for potential cumulative air quality impacts is the SJVAB. The SJVAB,
which is approximately 250 miles long and averages 80 miles wide, is the second largest air basin in the
state. The SJVAB is defined by the Sierra Nevada to the east (8,000 to 14,000 feet in elevation), the Coast
Range to the west (averaging 3,000 feet in elevation), and the Tehachapi Mountains to the south (6,000 to
8,000 feet in elevation). The valley opens to the sea at the Carquinez Strait where the San Joaquin–
Sacramento Delta (Delta) empties into San Francisco Bay. Due to its topography and location relative to
other air basins, the airflow in the valley becomes vertically blocked by high barometric pressure over the
SJVAB and as a result, the majority of the SJVAB is highly susceptible to pollutant accumulation over
time.
As shown in Table 4.1‐2, the SJVAB is in nonattainment for the federal standards for O3 (8 hour) and
PM2.5. The air basin is in nonattainment for the state standards of O3 (1 hour), O3 (8 hour), PM10, and PM2.5.

4.1 Air Quality
University of California, Merced 4.1‐35 UC Merced 2020 LRDP Recirculated Draft SEIR
December 2019
Cumulative Construction Impacts
Campus construction under the 2020 LRDP would occur between 2021 and 2030, and construction
activities would be located in the central portions of the campus site in the area designated CMU on the
land use diagram. At this time, there are no foreseeable construction projects that would be under
construction near the campus between 2021 and 2030. Therefore, there is no potential for campus
construction emissions, especially of pollutants such as PM10 and PM2.5, and construction TACs to
combine with emissions of these pollutants from other nearby construction projects. There would be no
cumulative impact related to construction emissions.
Cumulative Traffic and Other Operational Emissions Impacts
As noted above, campus development under the 2020 LRDP would generate annual operational
emissions from project‐related mobile and other sources that would exceed the SJVAPCD significance
thresholds for NOX even after mitigation. Other development under the City’s current General Plan
would also result in new vehicle trips that would increase vehicle emissions in the air basin. Therefore,
cumulative operational impacts to air quality would be significant and the proposed project’s
contribution to the impact would be cumulatively considerable.
No significant CO hotspot impacts would affect sensitive receptors in the vicinity of the study
intersections upon implementation of the 2020 LRDP. The CO hot spot analysis in LRDP Impact AQ‐3
above takes into account not only the traffic associated with the proposed project but also all the existing
and future traffic in the City of Merced as a result of the projected growth. Based on that analysis,
cumulative CO hotspot impacts would be less than significant.
Mitigation Measures:
Cumulative MM C‐AQ‐1: Implement LRDP Mitigation Measures AQ‐2a and AQ‐2b. No
additional mitigation is available.
Significance after Mitigation: Significant and unavoidable
4.1.7 References
San Joaquin Valley Air Pollution Control District (SJVAPCD). 2007. 2007 PM10 Maintenance Plan and
Request for Redesignation. Fresno: SJVAPCD.
SJVAPCD. 2013. 2013 Plan for the Revoked 1‐Hour Ozone Standard. September.

4.1 Air Quality
University of California, Merced 4.1‐36 UC Merced 2020 LRDP Recirculated Draft SEIR
December 2019
SJVAPCD. 2014. 2014 Reasonably Available Control Technology (RACT) Demonstration for the 8‐Hour Ozone
State Implementation Plan (SIP). June.
SJVAPCD. 2015. Guide for Assessing and Mitigating Air Quality Impacts. March.
SJVAPCD. 2018. SJVAPCD Application for Leave to File Amicus Curiae Brief for Sierra Club, Revive the San
Joaquin, and League of Women Voters of Fresno V. County of Fresno and Friant Ranch.
SJVAPCD. 2016a. 2016 Moderate Area Plan for the 2012 PM2.5 Standard.
SJVAPCD. 2016b. 2016 Plan for the 2008 8‐Hour Standard. June.
SJVAPCD. 2018. Current District Rules and Regulations. Available online at: http://www.valleyair.org/rules/
1ruleslist.htm, accessed October 16, 2018.
South Coast Air Quality Management District (SCAQMD). 2018. SCAQMD Application for Leave to File
Amicus Curiae Brief for Sierra Club, Revive the San Joaquin, and League of Women Voters of Fresno V.
County of Fresno and Friant Ranch.
World Health Organization (WHO). 2013. Review of evidence on health aspects of air pollution –
REVIHAAP Project.