4.1 introducing hypothesis tests 4.2 measuring significance with p-values [email protected]...
TRANSCRIPT

Statistical Design & Analysis: Week 74.1 Introducing Hypothesis Tests4.2 Measuring significance with P-values
[email protected] the Maths Study Centre 11am-5pmThis presentation is viewable on http://mahritaharahap.wordpress.com/teaching-areas/Check out the www.khanacademy.org website

Statistical inference is the process of drawing conclusions about the entire population based on information in a sample by: • constructing confidence
intervals on population parameters
• or by setting up a hypothesis test on a population parameter
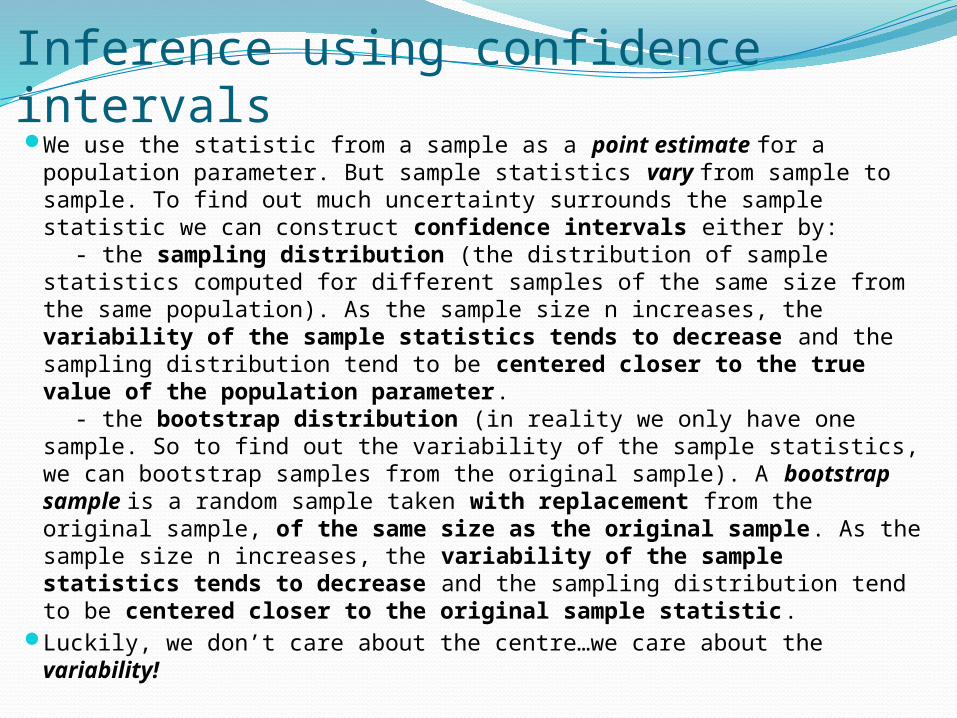
Inference using confidence intervalsWe use the statistic from a sample as a point estimate for a
population parameter. But sample statistics vary from sample to sample. To find out much uncertainty surrounds the sample statistic we can construct confidence intervals either by:
- the sampling distribution (the distribution of sample statistics computed for different samples of the same size from the same population). As the sample size n increases, the variability of the sample statistics tends to decrease and the sampling distribution tend to be centered closer to the true value of the population parameter.
- the bootstrap distribution (in reality we only have one sample. So to find out the variability of the sample statistics, we can bootstrap samples from the original sample). A bootstrap sample is a random sample taken with replacement from the original sample, of the same size as the original sample. As the sample size n increases, the variability of the sample statistics tends to decrease and the sampling distribution tend to be centered closer to the original sample statistic.
Luckily, we don’t care about the centre…we care about the variability!

We are 95 % confident that the true population parameter of context of study is between statistic-2*SE and statistic+2*SE.

We construct bootstrap samples when we only have one sample and use the standard deviation of the bootstrap distribution as the standard error. We are 95 % confident that the true population parameter of………is between statistic-2*SE and statistic+2*SE.


Inference using Hypothesis TestingHypothesis Tests use statistics from a sample to assess a claim about the population parameters
If the sample statistic is statistically significant, we have convincing evidence against the null hypothesis, and in favour of the alternative.


Statistical Significance
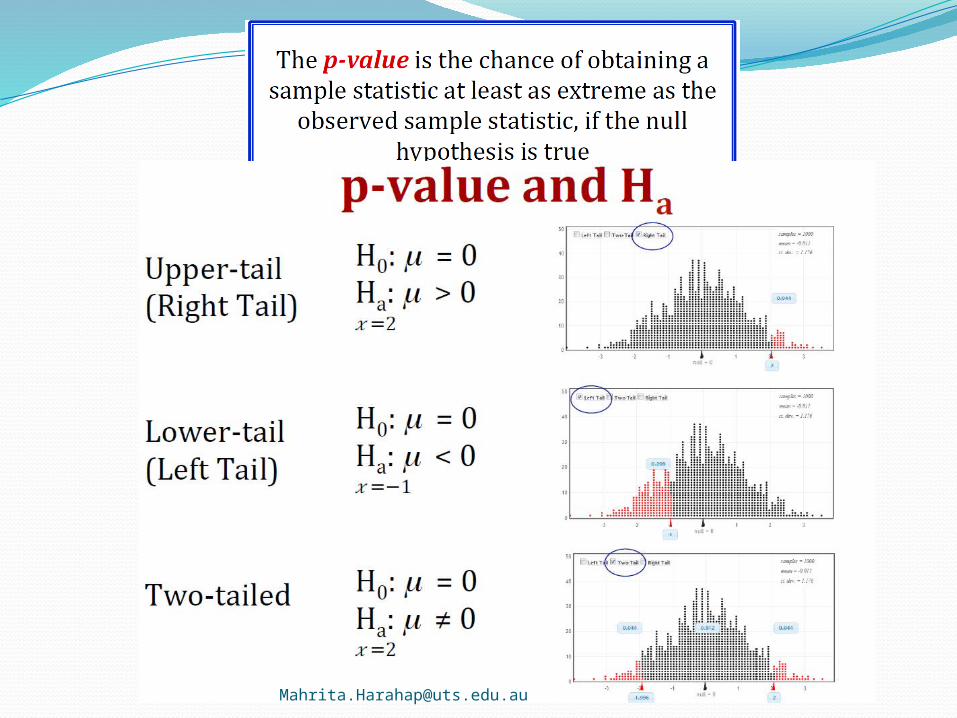
We can determine whether a sample statistic is statistically significant or not by measuring the p-value.


Making Decisions
https://www.youtube.com/watch?v=eyknGvncKLw
