4.1 material - shodhgangashodhganga.inflibnet.ac.in/bitstream/10603/28902/11/11_chapter 4.pdf ·...
TRANSCRIPT
63
4.1 MATERIAL
Chemicals: Lecithin soya 30% was purchased from Vinayak Ingredients (India) Private
Limited, Mumbai, Cholesterol was purchased from S.D. Fine Chem., Mumbai and all
other chemicals are of analytical grade.
4.2 METHOD
4.2.1 Preparation of aqueous extract of Tecomella undulata
For preparation of aqueous extract, powder of bark (500 g) was decocted with distilled
water for 1 hour and Extract was filtered using Whatman filter paper (size no.1). Solvent
was evaporated in water bath and aqueous extract was concentrated.
4.2.2 Method of preparation of Phytosomal syrup of Tecomella undulata
Step-1: Preparation of thin layer of Phospholipid mixture
Phytosomes of Tecomella undulata was prepared by solvent evaporation method.
Acurately weighed quantity of lecithin and cholesterol were dissolved in chloroform (10
ml) in round bottom flask (RBF) and sonicated in rotary evaporator (45-50°C) for 10
minutes for removal of organic solvent. After complete removal of solvent thin layer of
phospholipids mixture was formed.
Step-2: Preparation of Phytosomes
Thin film of phospholipids was hydrated with 10 ml aqueous extract of Tecomella
undulata at 37-40°C. After complete hydration, mixture of lipid and plant extract was
sonicated for 20 minutes by using Ultrasonic Probe Sonicator.144
Step-3: Preparation of syrup base (simple syrup IP)
667 mg. Sucrose was added to 10 ml. purified water in tared beaker and heated the
mixture on water bath until sucrose was completely dissolved. Filtered hot syrup through
cotton wool and cool the solution. Sodium benzoate (1 gm), Methyl parabene (1.5 gm),
Propyl parabene (400 mg) and mixed Phosphate buffer pH 6.8 (dihydrogen phosphate
and Potassium dihydrogen phosphateph) were added in prepared Simple syrup IP.
Step-4: preparation of phytosomal syrup:
Prepared solution of phytosomes (prepared in step 2) was mixed with simple syrup
(prepared in step 3), Sorbitan monolaurate 20 (0.5 ml) was added in solution and stirred
for one hour on magnetic stirrer at 50 rpm on room (24-25 C).
This watermark does not appear in the registered version - http://www.clicktoconvert.com

64
Table 4.1: Optimization and Preparation of Phytosomes
S.
N.
Formulation Cholesterol
(mg)
Lecithin
(mg)
Chloroform
(ml)
Aq. extract
(T.undulata)
(ml)
Cholesterol:
lipid ratio
1 TU1 15 30 5 10 1.5:3
2 TU2 15 35 5 10 1.5:3.5
3 TU3 15 40 5 10 1.5:4
4 TU4 15 45 5 10 1.5:4.5
5 TU5 15 50 5 10 1.5:5
6 TU6 15 55 5 10 1.5:5.5
7 TU7 15 60 5 10 1.5:6
8 TU8 15 65 5 10 1.5:6.5
9 TU9 15 70 5 10 1.5:7
10 TU10 15 75 5 10 1.5:7.5
4.3 CHARACTERIZATION
4.3.1 Morphology of formulation
The morphology of prepared formulation was evaluated by the inverted microscope and
Transmission Electron Microscopy (TEM).
A drop of phytosomal syrup was applied to a grid covered with a thick film. After leaving
for five minutes to allow adsorption of phytosomal syrup to the grid, the excess was
removed by a filter. 1% phosphotugstic acid was dropped onto the grid. Then the grid
was air-dried for approximately 10 minutes and examined under a transmission electron
microscope. The sample shape of formulation was photographed.144-145
4.3.2 Size Analysis of formulation
Particle size and size distribution of formulations were measured by the photon
correlation spectroscopy (PCS) (Mastersizer 2000, Malvern England). A drop of
phytosomal syrup was diluted in 10 mM of sodium chloride solution. Then solution was
This watermark does not appear in the registered version - http://www.clicktoconvert.com

65
put into the cuvette and placed in the MastersizerTM machine. A magnetically stirred cell
dispersion unit was employed with medium speed stirring in order to keep the
formulation dispersed during size measurement. These set up conditions permitted
accurate measurement of particles having a size range between 0.20 and 20000 d nm. The
data was obtained from the program of PCS.145
4.3.3 Entrapment efficiency (Percent drug remaining entrapped)
The sample of each batch were withdrawn, rehydrated with 10 ml NaCl (0.9%) and
analyzed for PDR. Formulation was subjected to centrifugation on ultracentrifuge at
45,000 rpm for 45 min. The supernatant was collected and the pellets of Phytosomal
syrup were redispersed with appropriate dilution with NaCl (0.9%) solution to remove
drug adsorbed onto phytosomal syrup. Centrifugation was repeated for further 45 min
and the supernatant was again collected and added to the first supernatant to comprise the
unentrapped fraction of the drug. The pellets of Phytosomal syrup were solubilized using
Triton-X 100 (1% w/v) and the released phytoconstituents (phytosoal syrup-entrapped
fraction) was found. The drug released was analyzed by HPTLC as Phytosomal syrup
entrapped fraction.145 Entrapment efficiency was expressed at the “Percent drug
Remaining Entrapped”. PDR was calculated as follows –
4.3.4 Zeta potential study
The measurements were made with a zetasizer 2000 DTS52013 (Malvern England) at
250C. The formulation was diluted with distilled water, loaded into capillary cell mounted
on the apparatus and all experiment was performed at least in triplicate.146-147
4.3.5 In-vitro Release Study
The in vitro release of prepared formulation was studied by using simple diffusion cell
apparatus. The diffusion cell apparatus consist of glass tube with an inner diameter of 2.5
cm open at both ends, on end of the tube is tied with sigma dialysis membrane, which
serves as a donor compartment. Phytosomal syrup equivalent to 100 mg of Tecomella
This watermark does not appear in the registered version - http://www.clicktoconvert.com

66
undulata was taken in test tube and placed in 100 ml of phosphate buffer. The medium
was stirrer and the temperature at 35-37°C. 10 ml of samples were withdrawn
periodically and maintained the sink conditions. Then the samples were assayed
spectrophotometrically, at 251 nm using phosphate buffer as blank. The releases of all
prepared formulations were compared with pure Tecomella undulata extract.148-149
The in-vitro release results of tecomella phytosoal syrup were expressed as the mean ± SD.
Multiple comparisons of means (Tukey Test) was applied to substantiate statistical
differences between groups. Significa nce was tested at the 0.001 level of probability (p).150-
151
4.3.6 Drug Release Kinetics study
In the present study, the prepared formulations were evaluated for phytoconstituents
release kinetics. The drug release data were plotted using various kinetic equations (Zero
order, first order, Higuchi’s kinetics, Korsmeyer’s equation, and Hixson-Crowell Cube
root law) to evaluate the drug release mechanism and kinetics.
The data obtained from in vitro drug release studies were plotted as cumulative amount of
drug released vs time, Zero order equation (eq.1), log cumulative percentage of drug
remaining vs time, first order (eq.2), cumulative percentage of drug released vs square
root of time, Higuchi’s model (eq.3)
C = K0t (1)
K0 is the zero order rate constant expressed in units of concentration/time and t is the time
in hours. A graph of concentration vs. time would yield a straight line with a slope equal
to K0 and intercept the origin of the axes.
Log C = LogC0-kt/2.303 (2)
Where C0 is the initial concentration of drug, k is the first order constant, and t is the time.
Q = Kt1/2 (3)
Where K is the constant reflecting the design variables of the system and t is the time
in hours. Hence, drug release rate is proportional to the rec iprocal of the square root time.
To evaluate the drug release with change in the surface area and the diameter of
the particles, the data were also plotted using the Hixson-Crowe ll cube root law:
This watermark does not appear in the registered version - http://www.clicktoconvert.com

67
3 Q0 - 3 Qt = kHC X t (4)
Where Qt is the amount of drug released in time t, Q 0 is the initial amount of the drug
in the microsphere, and KHC is the rate constant for the Hixson-Crowell rate equation, as
the cube root of the percentage of drug remaining in the matrix vs. time.
Mechanism of Drug Release: Log cumulative percentage of drug released vs log time
(Koresmeyer et al. equation, Eq. 5) was plotted to evaluate the mechanism of drug release
from microspheres and the exponent n was calculated through the slop of the straight line
Mt / M = Ktn (5)
Where Mt/M is the fractional solute release, t is the release time, K is a kinetic constant
characteristic of the drug/polymer system, and n is an exponent that characterizes the
mechanism of release of tracers.
If the exponent n= 0.45, then the drug release mechanism is Fickian diffusion, and if 0.45 <
n <0.89, then then it is non-Fickian or anomalous diffus io n.152-153
This watermark does not appear in the registered version - http://www.clicktoconvert.com

68
4.4 RESULTS
4.4.1 Selection of method of Preparation
Solvent evaporation method was selected for the preparation of phytosomes containing
plant extracts.
4.4.2. Optimization of lipid and Lecithin Ratio and preparation of phytosomal syrup
Ten formulation batches of aqueous extracts of Tecomella undulata bark with the
different ratio of lipid & lecithin were prepared (step 2) (table 4.1), and phytosomal syrup
was prepared by mixing the phytosomes and simple syrup according to procedure.
Prepared formulations of phytosomal syrup were tested for in-vitro release profile and
best formulation batch was selected on the basis of various in-vitro evaluations
Various in vitro studies performed for optimization of batches were, digital microscopy,
TEM, Size analysis, zeta potential study, in vitro drug release, particle size and
entrapment efficiency.
4.4.3. Visualization study
4.4.3.1. Digital Microscopy of prepared batches
Photomicrography of syrup of TU4 was shown in figure 4.1. It was shown that
formulation prepared from the ratio of 1.5:4.5 (cholesterol:lecithin) seemed to be
unilamellar.
Figure 4.1: Digital photograph of prepared TU4 phytosomal syrup
This watermark does not appear in the registered version - http://www.clicktoconvert.com

69
4.4.3.2 Transmission electron microscopy (TEM) analysis
TEM provided the evidence of vesicle formation and their morphology evaluation
showed small, spherical, and unilamellar vesicles (Figure 4.2).
Figure 4.2: TEM of syrup of TU4
4.4.4 Quantification of TU4
HPTLC analysis was used for quantification of tecomella phytoconstituents (glycoside).
Tecomin was taken as marker compound and standard curve of tecomin was prepared by
using HPTLC & UV spectrophotometer method. Following values for Y and R were
obtained from HPTLC method:
Y= 86.111x + 4836.3 and R2=0.9987
Following values for Y and R were obtained from UV spectroscopy method:
Y=0.0899x + 0.0773 and R2 = 0.9834
4.4.5 Size analysis of phytosomal syrup
The average particle size of the syrup of TU4 was 183.9 nm (Figure 4.3)
This watermark does not appear in the registered version - http://www.clicktoconvert.com

70
Figure 4.3 (i): Report of Particle Size of syrup of TU4
This watermark does not appear in the registered version - http://www.clicktoconvert.com

71
Figure 4.3 (ii): Report of Size Distribution by intensity of syrup of TU4
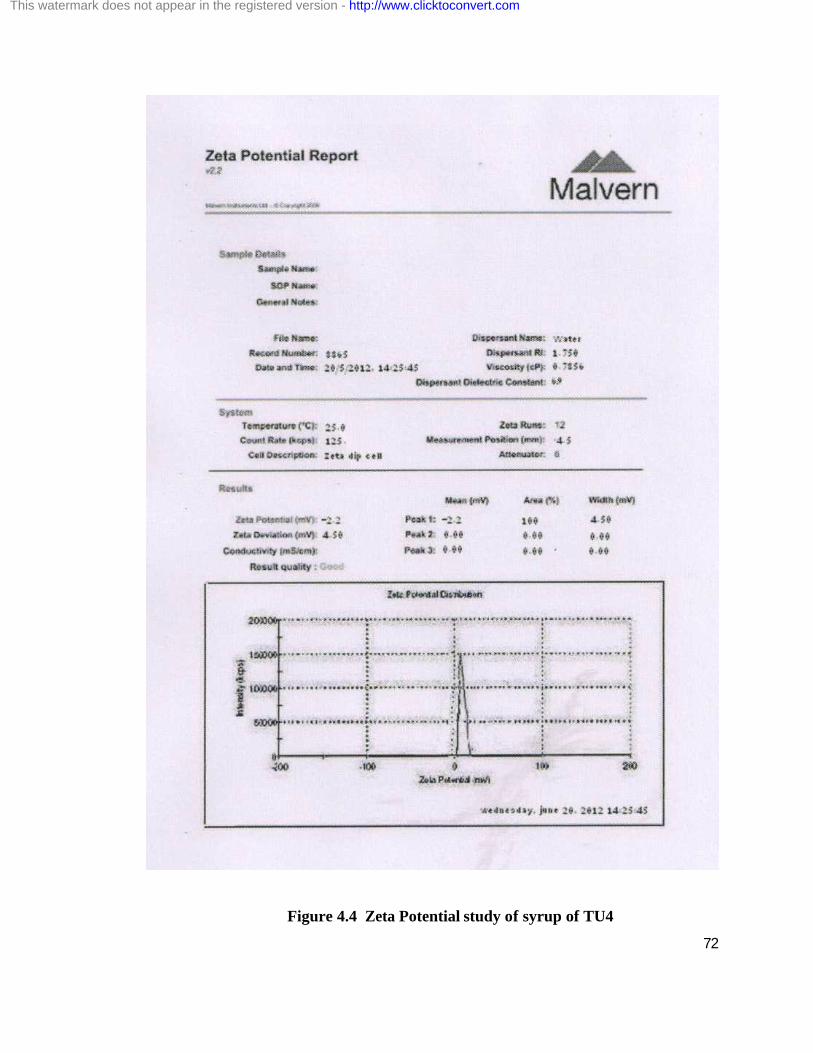
4.4.6 Zeta potential
The presence and magnitude, or absence, of a charge on colloidal particle is an important
factor in the stability if colloidal system. Zeta potential of TU4 was near to zero which
suggests that particles require only a minute charge for stabilization.
This watermark does not appear in the registered version - http://www.clicktoconvert.com
72
Figure 4.4 Zeta Potential study of syrup of TU4
This watermark does not appear in the registered version - http://www.clicktoconvert.com
73
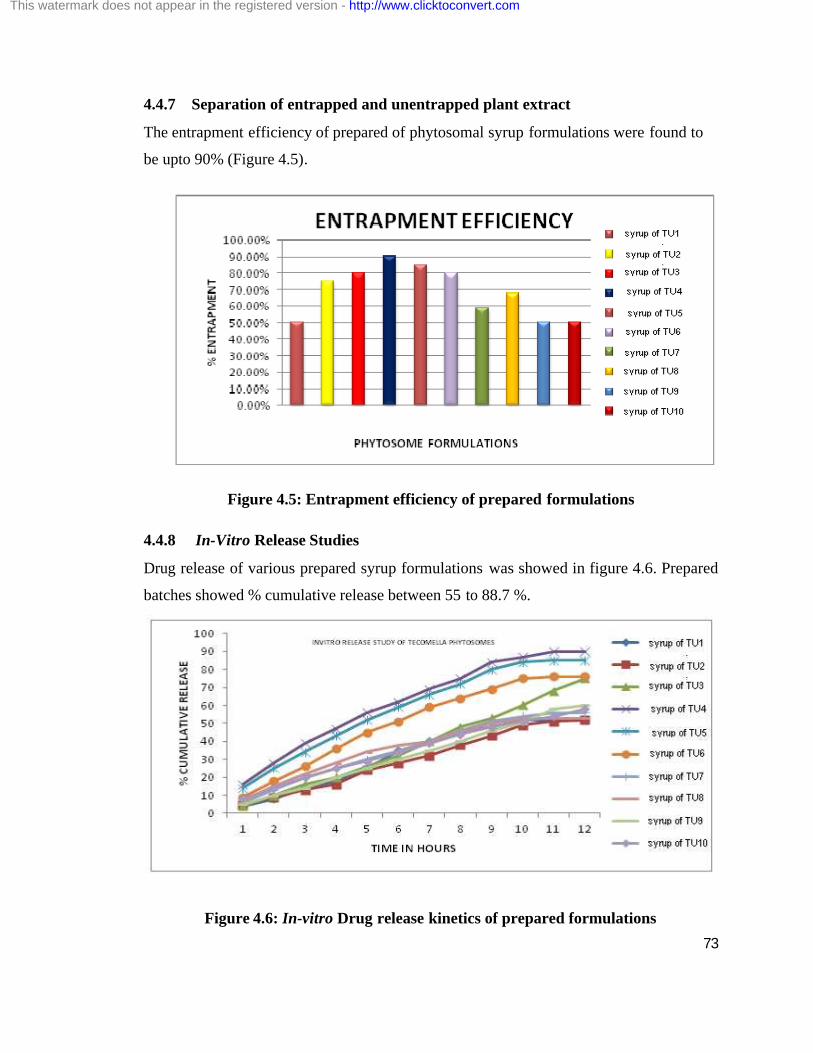
4.4.7 Separation of entrapped and unentrapped plant extract
The entrapment efficiency of prepared of phytosomal syrup formulations were found to
be upto 90% (Figure 4.5).
Figure 4.5: Entrapment efficiency of prepared formulations
4.4.8 In-Vitro Release Studies
Drug release of various prepared syrup formulations was showed in figure 4.6. Prepared
batches showed % cumulative release between 55 to 88.7 %.
Figure 4.6: In-vitro Drug release kinetics of prepared formulations
This watermark does not appear in the registered version - http://www.clicktoconvert.com
74
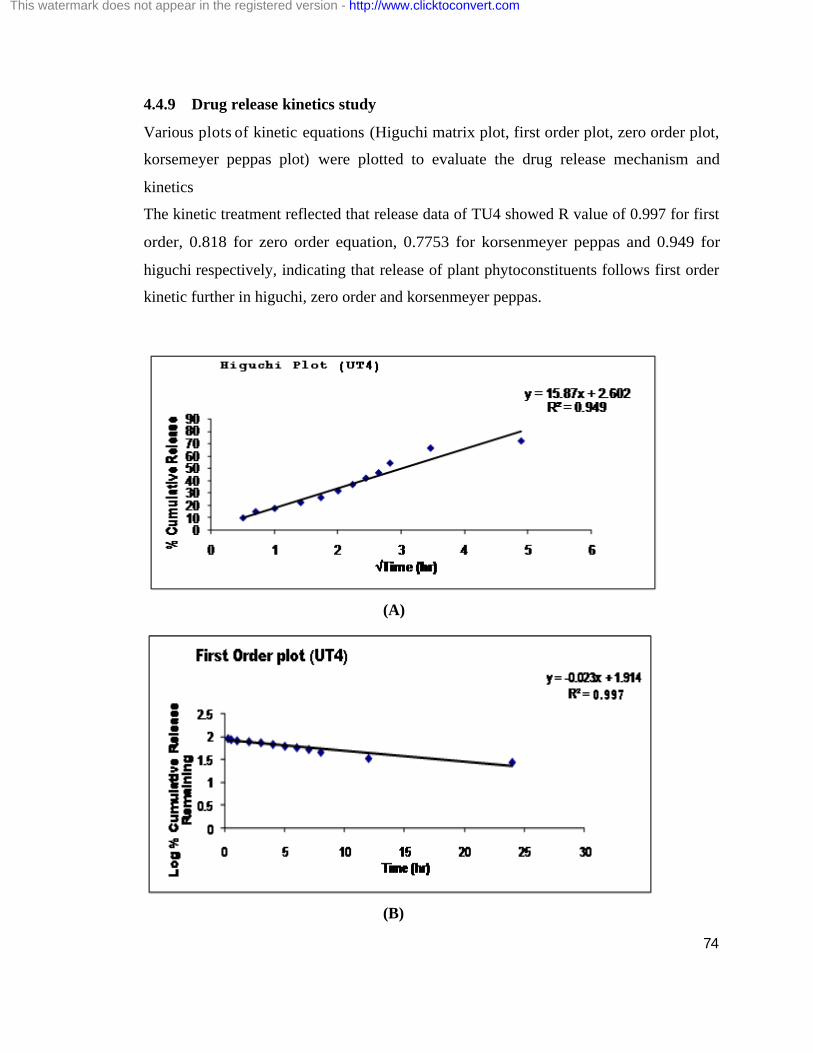
4.4.9 Drug release kinetics study
Various plots of kinetic equations (Higuchi matrix plot, first order plot, zero order plot,
korsemeyer peppas plot) were plotted to evaluate the drug release mechanism and
kinetics
The kinetic treatment reflected that release data of TU4 showed R value of 0.997 for first
order, 0.818 for zero order equation, 0.7753 for korsenmeyer peppas and 0.949 for
higuchi respectively, indicating that release of plant phytoconstituents follows first order
kinetic further in higuchi, zero order and korsenmeyer peppas.
(A)
(B)
This watermark does not appear in the registered version - http://www.clicktoconvert.com

75
(C)
(D)
Figure 4.7: Release kinetics of syrup of TU4: (A) Higuchi matrix plot, (B) first order plot, (C) zero order plot, (D) korsemeyer peppas plot.
This watermark does not appear in the registered version - http://www.clicktoconvert.com

76
4.5 DISCUSSION Prepared Phytosomal syrup was evaluated for their morphology, release character, drug
entrapment efficiency, size of particles and charge on surface. It was concluded that
prepared Phytosomal syrup of TU4 was showed good entrapment and release property,
having size less than 200 nm and having unilamillar vesicle. Kinetic stability in majority
of the preparations is related to the presence of charge on membrane, and consequently to
the existence of electrostatic forces of repulsion that balance the London dispersion
forces. Vesicles repel each other when their double layer overlaps. The origin of
repulsive force is entropic. Thus surface charge produces an energy barrier and when this
barrier far exceeds the thermal energy (expressed as kT), the primary minimum becomes
inaccessible and the system is kinetically stable.
This watermark does not appear in the registered version - http://www.clicktoconvert.com