42 wind energy barometer - energies renouvelables€¦ · (global wind energy council), 14 639 mw...
TRANSCRIPT

42
win
d e
ne
rg
y b
ar
om
ete
r
SYSTÈMES SOLAIRES le journal de l’éolien N° 6 – 2010
B A R O M È T R E É O L I E N – E U R O B S E R V ’ E R – M A R S 2 0 1 0
Le marché chinois est devenu en 2009 le premier marché mondial
avec 13 000 MW installés.
The Chinese pulled away to lead the global field by installing
13 000 MW in 2009.
Goldwind
43
ba
ro
mè
tre
éo
lie
n
SYSTÈMES SOLAIRES le journal de l’éolien N° 6 – 2010
B A R O M È T R E É O L I E N – E U R O B S E R V ’ E R – M A R S 2 0 1 0
Le marché mondial de l’éolien a fait mieuxque résister aux effets de la crise financière
avec, selon les premières estimations, l’instal-lation de 37 GW, soit près de 10 GW de puis-sance supplémentaire par rapport à l’année2008. La croissance a été particulièrement sou-tenue en Chine et aux États-Unis. L’Union euro-péenne a également tiré son épingle du jeu enétablissant un nouveau record d’installations.
BAROMÈTRE ÉOLIEN WIND POWER BAROMETER
The global wind power market not onlyrepelled the strictures of the financial cri-
sis, but according to initial estimates, saw theinstallation of 37 GW, which is almost 10 GWup on 2008. China and the United States regis-tered particularly steady growth and the Euro-pean Union also picked up momentum tobreak its installation record.
158 GW éoliensinstallés dans le monde fin 2009
of wind power installed across the world
74,8 GW éoliensinstallés dans l’UE fin 2009
of wind power installed in EU at the end of 2009
+ 13,3 %la croissance du marché éolien
de l’UE entre 2008 et 2009EU wind turbine market growth
between 2008 and 2009
Une étude réalisée par EurObserv’ER. A study carried out by EurObserv’ER.

44
win
d e
ne
rg
y b
ar
om
ete
r
SYSTÈMES SOLAIRES le journal de l’éolien N° 6 – 2010
B A R O M È T R E É O L I E N – E U R O B S E R V ’ E R – M A R S 2 0 1 0
L’énergie éolienne a connu une crois-
sance remarquable durant l’année
2009. Les premières estimations dis-
ponibles établissent la puissance éolienne
mondiale à près de 158 GW, ce qui signifie
une puissance supplémentaire de l’ordre de
37 GW en 2009 (tableau 1 et graphique 1).
Le marché asiatique est devenu en 2009 le
premier marché au monde avec, selon l’as-
sociation GWEC (Global Wind Energy Coun-
cil), 14 639 MW installés, portant la puis-
sance éolienne de la région à 38 909 MW. La
croissance du marché nord-américain a
également été spectaculaire avec 10 872
nouveaux mégawatts, soit une puissance
cumulée de 38 478 MW fin 2009. Il devance
de peu le marché européen où 10 102,1 MW
ont été installés, pour un parc cumulé de
76 185,2 MW.
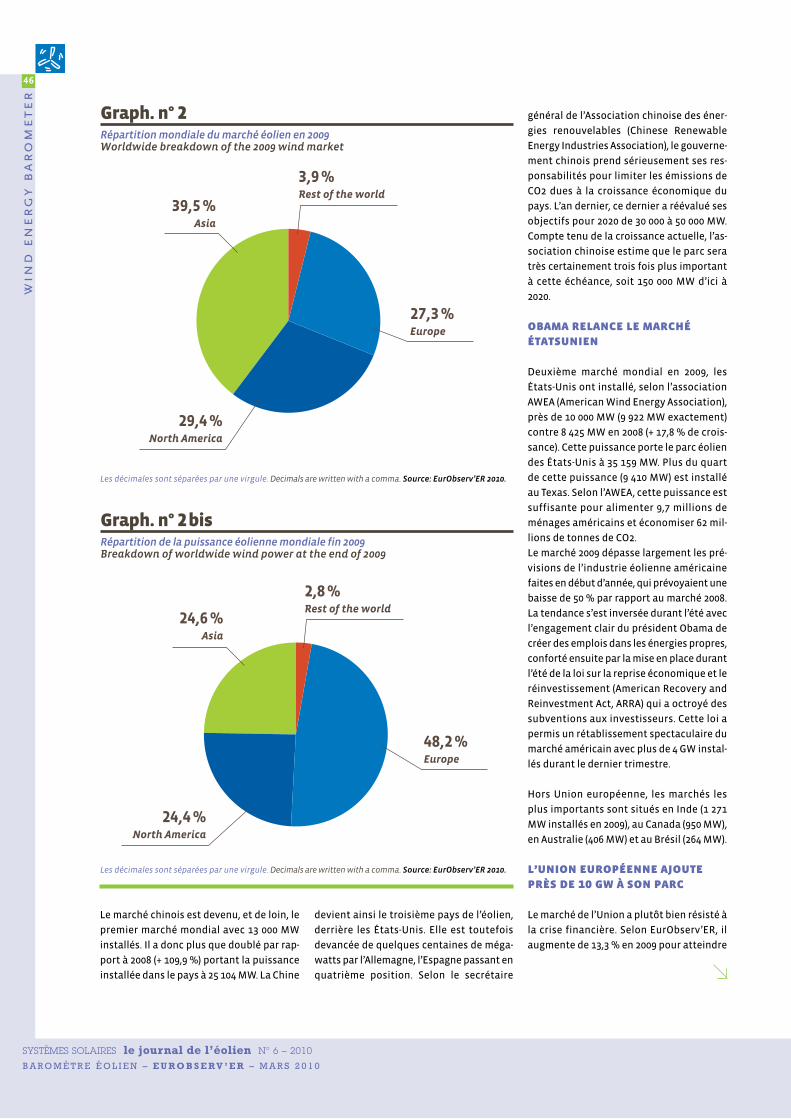
Signe de l’internationalisation de la filière,
l’Europe ne représente plus en 2009 que
27,3 % du marché mondial de l’éolien, de -
vancée cette année à la fois par le marché
asiatique (39,5 %) et le marché américain
(29,4 %) (graphique 2). L’Europe possède
néanmoins encore près de la moitié (48,2 %
en 2009) de la puissance éolienne mondiale
installée, devant l’Asie (24,6 %) et l’Amérique
du Nord (24,4 %) (graphique 2bis). Les autres
régions du monde restent sous-représen-
tées avec une part de 2,8 %.
158 gw éoliens installésdans le monde
installation record en chine
Les premières estimations du marché chinois,
rapportées par le GWEC, ont fait sensation.
Tabl. n° 1Puissance éolienne installée dans le monde fin 2009* (en MW)Wind power capacity installed worldwide at the end of 2009* (in MW)
Deuxième marché mondial en 2009, les États-Unis
ont installé près de 10 000 MW.
The United States was the number two global wind
power market in 2009, installing almost
10 000 MW of capacity.
REI
2008 2009Puissance installée en 2009
Capacity installed in 2009Mises hors service en 2009
Decommissioned in 2009
European Union 65 172,3 74 800,2 9 739,1 111,2
Rest of Europe 1 022,0 1 385,0 363,0 0,0
Total Europe 66 194,3 76 185,2 10 102,1 111,2United States 25 237,0 35 159,0 9 922,0 0,0
Canada 2 369,0 3 319,0 950,0 0,0
Total North America 27 606,0 38 478,0 10 872,0 0,0China 12 104,0 25 104,0 13 000,0 0,0
India 9 655,0 10 926,0 1 271,0 0,0
Japan 1 880,0 2 056,0 178,0 2,0
Other Asian countries 633,0 823,0 190,0 0,0
Total Asia 24 272,0 38 909,0 14 639,0 2,0Rest of the world 2 931,0 4360,0 1 429,0 0,0Total world 121 003,3 157 932,2 37 042,1 113,2*Estimation. Estimate. Les décimales sont séparées par une virgule. Decimals are written with a comma. Sources: EurObserv’ER 2010 (European Union figures), AWEA 2010 for United States, GWEC 2010 (others)

45
ba
ro
mè
tre
éo
lie
n
Wind power’s expansion was outstanding in 2009. First
available estimates put global wind power capacity at
almost 158 GW, which means that around 37 GW of addi-
tional capacity was installed in 2009 (table 1 and graph 1).
The Asian market led the world in 2009 with, according to the GWEC
(Global Wind Energy Council), 14 639 MW installed, which raised
the region’s wind power capacity to 38 909 MW. Growth in the
North American market was also spectacular with the addition
of 10 872 MW, bringing cumulated capacity by the end of 2009 to
38 478 MW… just ahead of the European market where 10 102.1 MW
were installed, bringing the installed base to 76 185.2 MW.
Wind power has now gone global, as in 2009 Europe only
accounted for 27.3% of the global wind power market, having been
outstripped by both the Asian (39.5%) and American (29.4%) mar-
kets over the course of the year (graph 2). Nonetheless Europe has
almost half (48.2% in 2009) of the global installed wind power
capacity, ahead of Asia (24.6%) and North America (24.4%) (graph
2A). The world’s other regions are under-represented with just a
2.8% share.
158 gw of wind turbines installed across the world
record installation in china
First estimates of the Chinese market, reported by the GWEC,
created a sensation. The Chinese market pulled away from the
other markets with 13 000 MW installed in 2009, more than dou-
bling its 2008 installed capacity (by 109.9%) and bringing the
nation’s capacity to 25 104 MW. China is thus the number three
wind power force, behind the United States and only a few hun-
dred megawatts behind Germany, relegating Spain into fourth
place. According to the Secretary-General of the Chinese Renew-
able Energy Industries Association, the Chinese government is
taking a firm, responsible stand on curbing the CO2 emissions
arising from the country’s economic expansion, for last year, it
raised its 2020 goals from 30 000 to 50 000 MW. Given current
growth, the Chinese association is convinced that the turbine
base will triple by that dateline, in other words 150 000 MW
installed by 2020.
obama relaunches the us market
The United States was the number two global wind power mar-
ket in 2009, installing almost 10 000 MW of capacity (9 922 MW to
be precise), according to the AWEA (American Wind Energy Asso-
ciation) as against 8 425 MW in 2008 (>17.8% growth), which brings
the US wind turbine base to 35 159 MW. Over a quarter of this
capacity (9 410 MW) is installed in Texas and the AWEA claims
that it is sufficient to supply 9.7 million American households
and save 62 million tonnes in CO2 emissions.
The 2009 market easily outstripped the American wind power
industry’s early 2009 forecasts as it had forecast a 50% contrac-
SYSTÈMES SOLAIRES le journal de l’éolien N° 6 – 2010
B A R O M È T R E É O L I E N – E U R O B S E R V ’ E R – M A R S 2 0 1 0
2 900 3 450 4 800 6 115 7 584 9 84213 450
17 684
24 544
31 412
39 363
47 489
59 467
74 390
93 908
121 003
157 932
1993 1994 1995 1996 1997 1998 1999 2000 2001 2002 2003 2004 2005 2006 2007 2008 2009
* Estimation. Estimate. Source: EurObserv’ER 2010.
Graph. n° 1Puissance éolienne cumulée dans le monde depuis 1993 (en MW)Total wind power installed in the world since 1993 (in MW)
46
win
d e
ne
rg
y b
ar
om
ete
r
SYSTÈMES SOLAIRES le journal de l’éolien N° 6 – 2010
B A R O M È T R E É O L I E N – E U R O B S E R V ’ E R – M A R S 2 0 1 0
devient ainsi le troisième pays de l’éolien,
derrière les États-Unis. Elle est toutefois
devancée de quelques centaines de méga-
watts par l’Allemagne, l’Espagne passant en
quatrième position. Selon le secrétaire
général de l’Association chinoise des éner-
gies renouvelables (Chinese Renewable
Energy Industries Association), le gouverne-
ment chinois prend sérieusement ses res-
ponsabilités pour limiter les émissions de
CO2 dues à la croissance économique du
pays. L’an dernier, ce dernier a réévalué ses
objectifs pour 2020 de 30 000 à 50 000 MW.
Compte tenu de la croissance actuelle, l’as-
sociation chinoise estime que le parc sera
très certainement trois fois plus important
à cette échéance, soit 150 000 MW d’ici à
2020.
obama relance le marché étatsunien
Deuxième marché mondial en 2009, les
États-Unis ont installé, selon l’association
AWEA (American Wind Energy Association),
près de 10 000 MW (9 922 MW exactement)
contre 8 425 MW en 2008 (+ 17,8 % de crois-
sance). Cette puissance porte le parc éolien
des États-Unis à 35 159 MW. Plus du quart
de cette puissance (9 410 MW) est installé
au Texas. Selon l’AWEA, cette puissance est
suffisante pour alimenter 9,7 millions de
ménages américains et économiser 62 mil-
lions de tonnes de CO2.
Le marché 2009 dépasse largement les pré-
visions de l’industrie éolienne américaine
faites en début d’année, qui prévoyaient une
baisse de 50 % par rapport au marché 2008.
La tendance s’est inversée durant l’été avec
l’engagement clair du président Obama de
créer des emplois dans les énergies propres,
conforté ensuite par la mise en place durant
l’été de la loi sur la reprise économique et le
réinvestissement (American Recovery and
Reinvestment Act, ARRA) qui a octroyé des
subventions aux investisseurs. Cette loi a
permis un rétablissement spectaculaire du
marché américain avec plus de 4 GW instal-
lés durant le dernier trimestre.
Hors Union européenne, les marchés les
plus importants sont situés en Inde (1 271
MW installés en 2009), au Canada (950 MW),
en Australie (406 MW) et au Brésil (264 MW).
l’union européenne ajouteprès de 10 gw à son parc
Le marché de l’Union a plutôt bien résisté à
la crise financière. Selon EurObserv’ER, il
augmente de 13,3 % en 2009 pour atteindre
Le marché chinois est devenu, et de loin, le
premier marché mondial avec 13 000 MW
installés. Il a donc plus que doublé par rap-
port à 2008 (+ 109,9 %) portant la puissance
installée dans le pays à 25 104 MW. La Chine
3,9 %Rest of the world
39,5 %Asia
27,3 %Europe
29,4 %North America
Les décimales sont séparées par une virgule. Decimals are written with a comma. Source: EurObserv’ER 2010.
Graph. n° 2Répartition mondiale du marché éolien en 2009Worldwide breakdown of the 2009 wind market
2,8 %Rest of the world
24,6 %Asia
48,2 %Europe
24,4 %North America
Les décimales sont séparées par une virgule. Decimals are written with a comma. Source: EurObserv’ER 2010.
Graph. n° 2bisRépartition de la puissance éolienne mondiale fin 2009Breakdown of worldwide wind power at the end of 2009
47
ba
ro
mè
tre
éo
lie
n
SYSTÈMES SOLAIRES le journal de l’éolien N° 6 – 2010
B A R O M È T R E É O L I E N – E U R O B S E R V ’ E R – M A R S 2 0 1 0
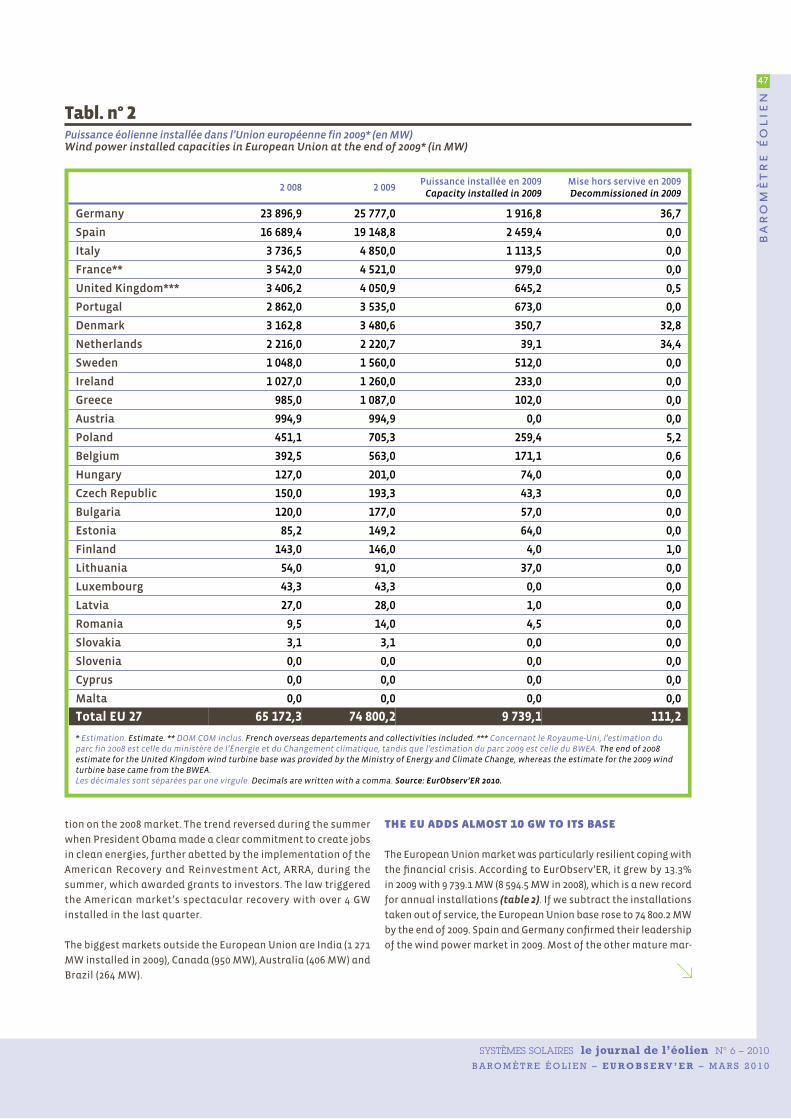
the eu adds almost 10 gw to its base
The European Union market was particularly resilient coping with
the financial crisis. According to EurObserv’ER, it grew by 13.3%
in 2009 with 9 739.1 MW (8 594.5 MW in 2008), which is a new record
for annual installations (table 2). If we subtract the installations
taken out of service, the European Union base rose to 74 800.2 MW
by the end of 2009. Spain and Germany confirmed their leadership
of the wind power market in 2009. Most of the other mature mar-
Tabl. n° 2Puissance éolienne installée dans l’Union européenne fin 2009* (en MW)Wind power installed capacities in European Union at the end of 2009* (in MW)
2 008 2 009Puissance installée en 2009
Capacity installed in 2009Mise hors servive en 2009Decommissioned in 2009
Germany 23 896,9 25 777,0 1 916,8 36,7
Spain 16 689,4 19 148,8 2 459,4 0,0
Italy 3 736,5 4 850,0 1 113,5 0,0
France** 3 542,0 4 521,0 979,0 0,0
United Kingdom*** 3 406,2 4 050,9 645,2 0,5
Portugal 2 862,0 3 535,0 673,0 0,0
Denmark 3 162,8 3 480,6 350,7 32,8
Netherlands 2 216,0 2 220,7 39,1 34,4
Sweden 1 048,0 1 560,0 512,0 0,0
Ireland 1 027,0 1 260,0 233,0 0,0
Greece 985,0 1 087,0 102,0 0,0
Austria 994,9 994,9 0,0 0,0
Poland 451,1 705,3 259,4 5,2
Belgium 392,5 563,0 171,1 0,6
Hungary 127,0 201,0 74,0 0,0
Czech Republic 150,0 193,3 43,3 0,0
Bulgaria 120,0 177,0 57,0 0,0
Estonia 85,2 149,2 64,0 0,0
Finland 143,0 146,0 4,0 1,0
Lithuania 54,0 91,0 37,0 0,0
Luxembourg 43,3 43,3 0,0 0,0
Latvia 27,0 28,0 1,0 0,0
Romania 9,5 14,0 4,5 0,0
Slovakia 3,1 3,1 0,0 0,0
Slovenia 0,0 0,0 0,0 0,0
Cyprus 0,0 0,0 0,0 0,0
Malta 0,0 0,0 0,0 0,0
Total EU 27 65 172,3 74 800,2 9 739,1 111,2
* Estimation. Estimate. ** DOM COM inclus. French overseas departements and collectivities included. *** Concernant le Royaume-Uni, l’estimation duparc fin 2008 est celle du ministère de l’Énergie et du Changement climatique, tandis que l’estimation du parc 2009 est celle du BWEA. The end of 2008 estimate for the United Kingdom wind turbine base was provided by the Ministry of Energy and Climate Change, whereas the estimate for the 2009 windturbine base came from the BWEA. Les décimales sont séparées par une virgule. Decimals are written with a comma. Source: EurObserv’ER 2010.
tion on the 2008 market. The trend reversed during the summer
when President Obama made a clear commitment to create jobs
in clean energies, further abetted by the implementation of the
American Recovery and Reinvestment Act, ARRA, during the
summer, which awarded grants to investors. The law triggered
the American market’s spectacular recovery with over 4 GW
installed in the last quarter.
The biggest markets outside the European Union are India (1 271
MW installed in 2009), Canada (950 MW), Australia (406 MW) and
Brazil (264 MW).

48
win
d e
ne
rg
y b
ar
om
ete
r
SYSTÈMES SOLAIRES le journal de l’éolien N° 6 – 2010
B A R O M È T R E É O L I E N – E U R O B S E R V ’ E R – M A R S 2 0 1 0
9 739,1 MW (8 594,5 MW en 2008), soit un nou-
veau record d’installations (tableau 2).
Déduit des installations mises hors service,
le parc de l’Union européenne atteint donc
74 800,2 MW fin 2009. L’Espagne et l’Alle-
magne ont con firmé en 2009 leur statut de
place forte du marché éolien. La plupart des
autres marchés ma tures comme l’Italie, le
Portugal, la Suède, l’Irlande et la Belgique
sont restés très performants, avec un bémol
concernant la France et le Royaume-Uni. 2009
est également l’année de la renaissance du
marché danois grâce à l’offshore. Une autre
bonne nouvelle est la montée en puissance
de certains marchés d’Europe centrale
comme la Pologne, la Hongrie, l’Estonie et la
Bulgarie. D’autres marchés sont au point
mort ou presque. C’est notamment le cas de
l’Autriche, des Pays-Bas, de la Finlande et de
six autres pays de l’Union européenne.
Si l’on tient compte de la puissance installée
par habitant, les cinq premiers pays impli-
qués dans la filière éolienne sont le Dane-
mark, l’Espagne, le Portugal, l’Allemagne et
l’Irlande (graphique 3).
627,5
415,5
332,3
315,3
283,1
166,9
134,0
118,8
111,3
96,1
86,2
80,3
69,9
65,3
52,0
27,3
27,3
23,4
20,1
18,5
18,4
12,5
0,7
0,6
149,2
Denmark
Spain
Germany
Portugal
Ireland
Netherlands
Austria
Sweden
Luxembourg
Greece
Italy
Estonia
United Kingdom
France
Belgium
Finland
Bulgaria
Lithuania
Czech Rep.
Hungary
Latvia
Poland
Slovakia
Romania
Total EU 27
* Estimation. Estimate. Les décimales sont séparées par une virgule. Decimals are written with a comma. Source: EurObserv’ER 2010.
Graph. n° 3Puissance éolienne pour 1 000 habitants dans les pays de l’Union européenne en 2009 (kW/1 000 hab.)*Wind capacity for 1,000 inhabitants in the European Countries in 2009 (kW/1 000 unhab.)*

51
ba
ro
mè
tre
éo
lie
n
SYSTÈMES SOLAIRES le journal de l’éolien N° 6 – 2010
B A R O M È T R E É O L I E N – E U R O B S E R V ’ E R – M A R S 2 0 1 0
2008 2009
United Kingdom 586,0 688,2
Denmark 423,4 663,9
Netherlands 246,8 246,8
Sweden 133,7 163,7
Belgium 30,0 30,0
Ireland 25,2 25,2
Finland 24,0 24,0
Germany 12,0 72,0
Italy 0,1 0,1
Total EU 27 1 481,1 1 913,8
* Inclues éoliennes situées à proximité des côtes et éoliennes tests. In cludednear-shore projects and offshore test of wind turbines. ** Estimation.Estimate. Les décimales sont séparées par une virgule. Decimals are writtenwith a comma. Source: EurObserv’ER 2010.
Tabl. n° 3Puissance éolienne offshore* installée dans l’Union européenne fin 2009 (en MW)**Installed offshore* wind power capacities in the EuropeanUnion at the end of 2009 (in MW)**
kets such as Italy, Portugal, Sweden, Ireland and Belgium were
very buoyant; however France and the United Kingdom were
somewhat flat. Offshore wind power led to a Danish market
revival in 2009, while another good piece of news is the rising
capacity in a number of Central European markets such as Poland,
Hungary, Estonia and Bulgaria. Other markets, in particular Aus-
tria, the Netherlands, Finland and six other EU member states are
more or less idling.
If the per capita installed capacity is the benchmark, Denmark,
Spain, Portugal, Germany and Ireland are the top five countries
involved in wind power (graph 3).
the 2-gw offshore threshold will soon be crossed
European Union offshore and nearshore wind power capacity is
nearing the 2-GW threshold with 1 913.8 MW installed in 2009,
amounting to 432.7 MW more than in 2008 (table 3). Six new offshore
wind farms turbines were connected in
2009 – Alpha Ventus off Germany (60 MW),
Gasslingegrund off Sweden (30 MW),
Horns Rev 2 (see picture p.53) (209.3 MW),
Sprogo (21 MW), Hvidrove (7.2 MW) off Den-
mark and Rhyl Flats (90 MW) off the United-
Kingdom. All the wind turbines of the Lynn
and Inner Dowsing farms have been on
stream since March 2009, bringing the final
capacity of these two farms to 194.4 MW (97.2 MW each).
EurObserv’ER has not taken into account the capacity of two
other farms currently being installed off the United-Kingdom –
Gunfleet Sands and Robin Rigg (see further on) on the basis of
the questionnaire sent by the BWEA (British Wind Energy Asso-
ciation).
low wind conditions limited production over the year
The increase in electricity production was not proportional to the
increase in production capacities. First estimates put wind power
electricity generation at 128.5 TWh, equivalent to 8.6% growth over
2008 (table 4). The low prevailing wind conditions in Germany (see
further on), which in 2009 still accounted for over a third of Euro-
pean Union installed capacity, are partly responsible for this lack-
lustre increase. Another, albeit lesser factor, was the unhooking
of wind power energy due to temporary grid overload. The increase
in the wind power share of the electricity mix of individual coun-
tries depends on the strengthening of a number of lines and invest-
ments in new grid infrastructures. These investments – onshore
or at sea – will shape the wind power sector’s growth potential for
years to come.
news from the main european markets
Spain seeks to limit its market’s growth In 2009 Spain recaptured its top European wind power market slot
by installing 2 459.4 MW to bring total capacity up to 19 148.8 MW,
according to the AEE (Spanish Wind Energy Association), which is
850.3 MW more than in 2008 (up 52.8%) when 1 609.1 MW was
installed. However the Spanish association is steeling itself for a
sharp slowdown in wind power activity in 2010 as Royal Decree
6/2009 creates a Registry of preliminary assignment. Under the
terms of this new procedure, the central government must give
prior approval to wind power projects if they are to benefit from
the production aid system and thus removes the regional gover n -
ments’ prerogative to award operating licences. The government’s
aim is to cope with the influx of new projects arising from the
forthcoming revision of the incentive system (which will run until
2012) as stipulated in table 5 as there are already about 14 GW of
projects in the pipeline. Its intention is to cap development of the
Spanish wind turbine base to a further 6 GW by 2012.
German growth is backThe financial crisis has only been able to slow down the German
market’s return to growth. The DEWI (German Wind Energy Insti-
tute) claims that Germany installed 1 916.8 MW of capacity in 2009
as against 1 667.1 MW in 2008 and 1 666.8 MW in 2007, equivalent
to 15%. The repowering market, namely the replacement of first-
generation wind turbines rose to 136.2 MW.
Growth would have been even higher if it
had not been for military radar issues.
Almost 1 500 MW of projects (2 billion euros
of investments) are currently held up wait-
ing for military authorisations.
The German offshore market kicked off
properly last year with the connection of
the 60-MW Alpha Ventus farm (see picture
p.56). The farm, with its six Repower 5 M and six Multibrid M5000
(5 MW) turbines was commissioned 45 km off the coast by a con-
sortium comprising RWE, E.ON and Vattenfall, and should be fol-
lowed by many other projects, as the government gave the green
2 459 MWthe capacity installed in Spain
during the year 2009la puissance installée en Espagne
durant l’année 2009

52
win
d e
ne
rg
y b
ar
om
ete
r
SYSTÈMES SOLAIRES le journal de l’éolien N° 6 – 2010
B A R O M È T R E É O L I E N – E U R O B S E R V ’ E R – M A R S 2 0 1 0
le seuil des 2 gw offshorebientôt franchi
La puissance éolienne offshore et “near-
shore” (proche des côtes) de l’Union euro-
péenne s’approche du seuil des 2 GW avec
1 913,8 MW installés en 2009, soit 432,7 MW
de plus qu’en 2008 (tableau 3). L’année 2009
aura vu la connexion de six nouvelles fermes
éoliennes offshore : Alpha Ventus en Alle-
magne (60 MW), Gasslingegrund en Suède
(30 MW), Horns Rev 2 (voir photo p. 53) (209,3
MW), Sprogo (21 MW), Hvidrove (7,2 MW)
au Danemark et Rhyl Flats (90 MW) au
Royaume-Uni. La totalité des éoliennes des
parcs de Lynn et Inner Dowsing sont égale-
ment opérationnelles depuis mars 2009 por-
tant la puissance finale de ces deux parcs à
194,4 MW (97,2 MW chacun).
Se basant sur le questionnaire envoyé par
le BWEA (British Wind Energy Association),
EurObserv’ER n’a pas pris en compte la puis-
sance de deux autres parcs en cours d’ins-
tallation au Royaume-Uni, celui de Gunfleet
Sands et celui de Robin Rigg (voir plus loin).
une année faiblement ventéelimite la production
L’augmentation de la production d’électri-
cité n’a pas été proportionnelle à l’augmen-
tation des capacités de production. Selon
les premières estimations, la production
d’électricité éolienne devrait atteindre 128,5
TWh, soit une croissance de 8,6 % par rap-
port à 2008 (tableau 4). Cette faible aug-
mentation s’explique en partie par une
année faiblement ventée en Allemagne (voir
plus loin), qui représentait encore en 2009
plus du tiers de la puissance installée de
l’Union. Autre facteur, plus limité cette fois,
le décrochage de l’énergie éolienne, dû à des
situations de surcharge temporaire du
réseau. Le renforcement de certaines lignes
et les investissements dans de nouvelles
infrastructures réseaux sont des éléments
in dispensables à l’augmentation de la part
de l’éolien dans le mix électrique de chaque
pays. Ces investissements conditionneront
les capacités de croissance de la filière dans
les prochaines années, que ce soit sur le mar-
ché éolien terrestre ou maritime.
actualités des principaux marchés européens
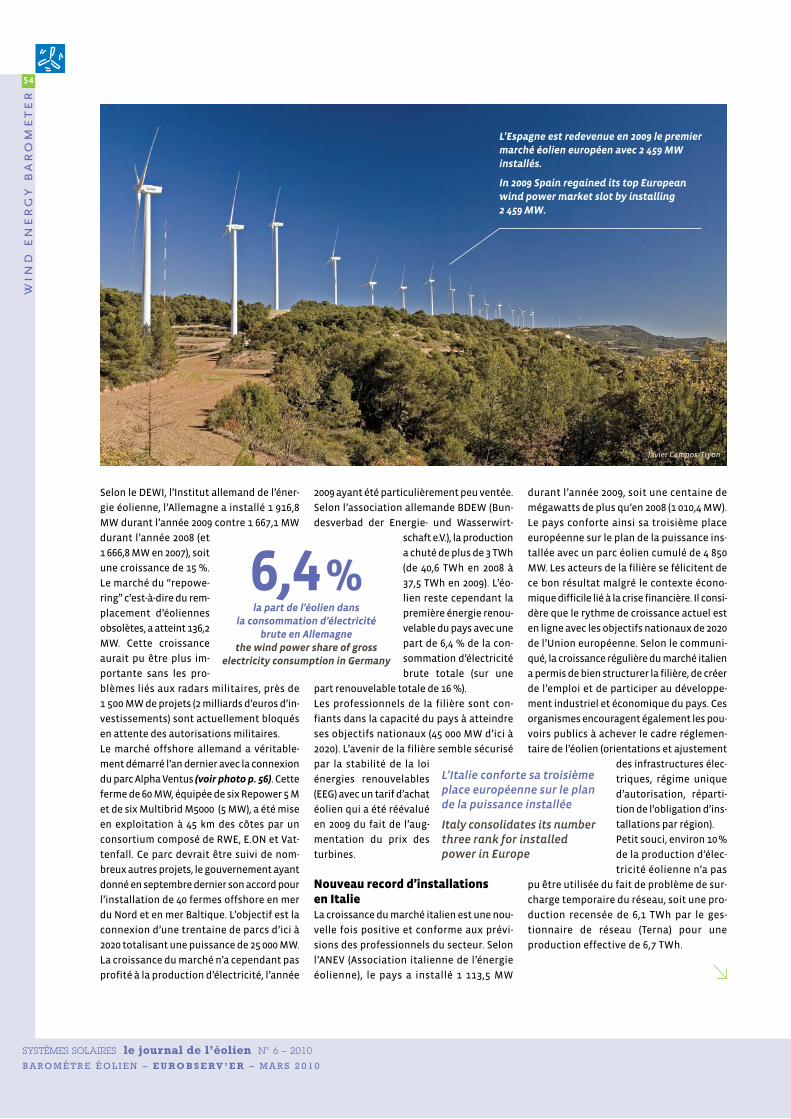
L’Espagne veut limiter la croissancede son marchéL’Espagne est redevenue en 2009 le premier
marché éolien européen avec, selon l’AEE
(Association espagnole de l’énergie éo -
lienne), 2 459,4 MW installés pour un parc
cumulé de 19 148,8 MW. C’est 850,3 MW de
plus qu’en 2008 (+ 52,8 %) où 1 609,1 MW
avaient été installés. Toutefois, l’association
espagnole s’attend à un fort ralentissement
de l’activité éolienne en 2010. Cette situa-
tion est due, selon elle, à la création d’un
Registre des pré-affectations mis en place
par le décret royal 6/2009. Dans cette nou-
velle procédure, le gouvernement central
doit préalablement donner son aval au pro-
jet éolien pour qu’il puisse bénéficier du sys-
tème d’aide à la production. Il retire ainsi
aux gouvernements régionaux la préroga-
tive d’accorder des licences d’exploitation.
L’objectif du gouvernement est de faire face
à l’afflux de nouveaux projets liés à la révi-
sion prochaine du système d’incitation
(valable jusqu’en 2012) décrit dans le ta -
bleau 5, le nombre de projets en attente
étant déjà de l’ordre de 14 GW. Son intention
est de limiter la progression du parc espa-
gnol à 6 GW supplémentaires d’ici à 2012.
Le retour de la croissance allemande La crise financière n’a pu que ralentir le
retour à la croissance du marché allemand.
2008 2009
Germany 40,600 37,500
Spain 32,200 36,188
United Kingdom 7,097 9,259
Denmark 6,976 6,716
Portugal 5,695 6,639
France 5,689 7,800
Italy 5,055 6,087
Netherlands 4,256 4,800
Ireland 2,473 2,955
Austria 2,000 2,100
Sweden 1,996 2,519
Greece 1,700 2,107
Poland 0,790 1,250
Belgium 0,622 0,834
Finland 0,262 0,275
Czech Republic 0,244 0,300
Hungary 0,204 0,352
Bulgaria 0,122 0,361
Estonia 0,133 0,172
Lithuania 0,123 0,145
Luxembourg 0,061 0,065
Latvia 0,055 0,056
Romania 0,011 0,017
Slovakia 0,008 0,008
Total EU 27 118,373 128,504
* Estimation. Estimate. Les décimales sont séparées par une virgule. Decimals are written with acomma. Source: EurObserv’ER 2010.
Tabl. n° 4Production d’électricité d’origine éolienne dans les pays de l’Union européenne en 2008 et 2009 (en TWh)*Electricity production from wind power in European Union in 2008 and 2009 (in TWh)*

53
ba
ro
mè
tre
éo
lie
n
SYSTÈMES SOLAIRES le journal de l’éolien N° 6 – 2010
B A R O M È T R E É O L I E N – E U R O B S E R V ’ E R – M A R S 2 0 1 0
light for the installation of 40 offshore farms in the North and
Baltic Seas last September. The aim is to connect about thirty wind
farms by 2020 for total capacity of 25 000 MW.
However as the wind conditions were particularly poor in 2009,
the additional capacity did nothing to spur electricity production.
According to the BDEW (Bundesverbad der Energie- und Wasser-
wirtschaft e.V.), production dropped over 3 TWh (from 40.6 TWh in
2008 to 37.5 TWh in 2009). Nonetheless wind power provides the
most renewable energy in Germany with a 6.4% share of total
gross electricity consumption (of a total renewable share of 16%).
The industry is quite confident that Germany has the capacity to
achieve its national targets (45 000 MW by 2020). The sector’s
future appears assured by the stability of the renewable energy
act (EEG), which revised the wind power feed-in tariff upwards in
2009 to reflect the increase in the price of turbines.
Italy chalks up a new record for installationsItalian market growth is back in the black and in line with the
industry’s forecast. ANEV (the Italian national Wind Energy Asso-
ciation) reports that in 2008 Italy installed
1 113.5 MW nudging about one hundred MW
up on 2008 (1 010.4 MW). The country has thus
consolidated its number three rank in Europe
for installed capacity with a cumulated wind
power base of 4 850 MW. The sector’s actors
are satisfied with this positive result despite
the tight economic context and reckon that
the current pace of growth puts them on
course to meet the European Union’s national goals for 2020. Their
communiqué states that the steady expansion of the Italian mar-
ket has resulted in a well-structured sector, the creation of jobs
and given them a role in the country’s industrial and economic
development. They are also lobbying the public authorities to
finalise the legislative framework governing wind power (elec-
tricity infrastructure orientations and adjustment, a single licens-
ing system, compulsory distribution of installations per region).
There was one minor hiccough in that about 10% of wind power
electricity production could not be utilised because of temporary
grid overload issues. The grid operator (Terna) therefore identi-
fied production of 6.1 TWh for 6.7 TWh of effective production.
The French market is becoming increasingly regulatedThe French wind power market had a mediocre year in 2009, con-
tracting by 8.6% in relation to 2008. According to Ademe, French
capacity (including overseas departments and communities) rose
to 4 521 MW in 2009. This installation performance of 979 MW is
slightly down on 2008 when 1 060 MW of additional capacity was
installed. These figures, which dashed expectations, can be partly
put down to the Council of State’s cancellation, in August 2008, of
the decree setting the feed-in tariff conditions for wind turbine
power due to formal reasons. The ministry redressed the situation
when it published a new order in December 2008 reworking the
substance of the terms of the initial order dated
10 July 2006.
The prospects for French market growth in 2010
are uncertain, as the government announced its
intention to amend the wind turbine licensing
system as of 1st January 2010, and include it
within the scope of classified installations for
the protection of the environment (ICPE) on the
grounds that the perceived and foreseeable
expansion of wind farms calls for it to set up a tougher adminis-
trative regime together with a special administrative policy.
The inclusion of wind turbines in the ICPE regime throws into the
The industry is quite confidentthat Germany has the capacityto achieve its national targets
Les professionnels de la filièresont très confiants dans lacapacité du pays à atteindreses objectifs nationaux
Medwind/Bent Sørensen
Horns Rev 2, au large des côtes danoises, le plus grand parc éolien offshore en service dans le monde.
Horns Rev 2, off the Danish coast – the biggestoffshore wind farm in service in the worldwide.
54
win
d e
ne
rg
y b
ar
om
ete
r
SYSTÈMES SOLAIRES le journal de l’éolien N° 6 – 2010
B A R O M È T R E É O L I E N – E U R O B S E R V ’ E R – M A R S 2 0 1 0
Selon le DEWI, l’Institut allemand de l’éner-
gie éolienne, l’Allemagne a installé 1 916,8
MW durant l’année 2009 contre 1 667,1 MW
durant l’année 2008 (et
1 666,8 MW en 2007), soit
une croissance de 15 %.
Le marché du “repowe-
ring” c’est-à-dire du rem -
placement d’éoliennes
obsolètes, a atteint 136,2
MW. Cette croissance
au rait pu être plus im -
portante sans les pro-
blèmes liés aux radars militaires, près de
1 500 MW de projets (2 milliards d’euros d’in-
vestissements) sont actuellement bloqués
en attente des au torisations militaires.
Le marché offshore allemand a véritable-
ment démarré l’an dernier avec la connexion
du parc Alpha Ventus (voir photo p. 56). Cette
ferme de 60 MW, équipée de six Repower 5 M
et de six Multibrid M5000 (5 MW), a été mise
en exploitation à 45 km des côtes par un
consortium composé de RWE, E.ON et Vat-
tenfall. Ce parc devrait être suivi de nom-
breux autres projets, le gouvernement ayant
donné en septembre dernier son accord pour
l’installation de 40 fermes offshore en mer
du Nord et en mer Baltique. L’objectif est la
connexion d’une trentaine de parcs d’ici à
2020 totalisant une puissance de 25 000 MW.
La croissance du marché n’a cependant pas
profité à la production d’électricité, l’année
2009 ayant été particulièrement peu ventée.
Selon l’association allemande BDEW (Bun-
desverbad der Energie- und Wasserwirt-
schaft e.V.), la production
a chuté de plus de 3 TWh
(de 40,6 TWh en 2008 à
37,5 TWh en 2009). L’éo-
lien reste ce pen dant la
première énergie renou -
vela ble du pays avec une
part de 6,4 % de la con -
sommation d’électricité
brute to tale (sur une
part renouvelable totale de 16 %).
Les professionnels de la filière sont con -
fiants dans la capacité du pays à atteindre
ses objectifs nationaux (45 000 MW d’ici à
2020). L’avenir de la filière sem ble sécurisé
par la stabilité de la loi
énergies re nouvelables
(EEG) avec un tarif d’achat
éolien qui a été réévalué
en 2009 du fait de l’aug-
mentation du prix des
turbines.
Nouveau record d’installations en ItalieLa croissance du marché italien est une nou-
velle fois positive et conforme aux prévi-
sions des professionnels du secteur. Selon
l’ANEV (Association italienne de l’énergie
éolienne), le pays a installé 1 113,5 MW
durant l’année 2009, soit une centaine de
mégawatts de plus qu’en 2008 (1 010,4 MW).
Le pays conforte ainsi sa troisième place
européenne sur le plan de la puissance ins-
tallée avec un parc éolien cumulé de 4 850
MW. Les acteurs de la filière se félicitent de
ce bon résultat malgré le contexte écono-
mique difficile lié à la crise financière. Il consi-
dère que le rythme de croissance actuel est
en ligne avec les objectifs nationaux de 2020
de l’Union européenne. Selon le communi-
qué, la croissance régulière du marché italien
a permis de bien structurer la filière, de créer
de l’emploi et de participer au développe-
ment industriel et économique du pays. Ces
organismes encouragent également les pou-
voirs publics à achever le cadre réglemen-
taire de l’éolien (orientations et ajus tement
des infrastructures élec-
triques, ré gime uni que
d’au to risation, réparti-
tion de l’obli gation d’ins -
talla tions par région).
Petit souci, environ 10 %
de la production d’élec-
tricité éolienne n’a pas
pu être utilisée du fait de problème de sur-
charge temporaire du réseau, soit une pro-
duction recensée de 6,1 TWh par le ges-
tionnaire de réseau (Terna) pour une
production effective de 6,7 TWh.
6,4%la part de l’éolien dans
la consommation d’électricité brute en Allemagne
the wind power share of gross electricity consumption in Germany
L’Italie conforte sa troisièmeplace européenne sur le plande la puissance installée
Italy consolidates its numberthree rank for installedpower in Europe
L’Espagne est redevenue en 2009 le premiermarché éolien européen avec 2 459 MW installés.
In 2009 Spain regained its top Europeanwind power market slot by installing 2 459 MW.
Javier Campos/Tryon

55
ba
ro
mè
tre
éo
lie
n
SYSTÈMES SOLAIRES le journal de l’éolien N° 6 – 2010
B A R O M È T R E É O L I E N – E U R O B S E R V ’ E R – M A R S 2 0 1 0
Éolien terrestreOnshore wind power
Éolien maritimeOffshore wind power
Prix demarché
à ajouterMarket
prices to add
Types de systèmesSupport schemes
Durée du contrat
Contract duration
2009 2010
Durée du contract
Contract duration
2009 2010
Germany1
Tarif d’achatFeed-in Tariff
5 premières années
5 first years9,2 9,11
12 premièresannées
12 first years13 13 no
Tarif d’achatFeed-in Tariff
année 6 à 20year 6 to 20
5,02 4,97année 13 à 20
year 13 to 203,5 3,5 no
Spain2
Tarif d’achatFeed-in Tariff
Année 1 à 20year 1 to 20
7,32 7,32 no
Tarif d’achat/Feed-in Tariff
Après 20 ansafter 20 years
6,12 6,12 no
Prime d’entrée + prix du marché/Feed-in
premium + market price
20 ans20 years
7,13 (min.) to 8,49 (max.)
7,13 (min.) to 8,49 (max.)
20 ans20 years
8,43 (min.) to 16,4 (max.)
8,43 (min.) to 16,4 (max.)
InclusIncluded
ItalyCertificat vert (CV)
Green certificate (GC)
8,89 (Valeur d’unCV/GC value
88,91€/MWh)n.a. – – yes
France
Tarif d’achatFeed-in Tariff
année 1 à 10year 1 to 10
8,2 8,2année 1 à 10
year 1 to 1013 13 no
Tarif d’achatFeed-in Tariff
année 11 à 15(dépendant du
facteur charge)year 11 to 15
(depending the load factor)
2,8-8,2 2,8-8,2
année 11 à 20(dépendant du
facteur charge)year 11 to 20
(depending the load factor)
3,0-13 3,0-13 no
UnitedKingdom
Certificat d’obligationd’achat (prix de marché
moyen)/RenewableObligation Certificate
ROCs (average market price)
5,9-5,23
(1 ROCs/MWh)n.a.
11,8-10,433
(2ROCs/MWh)n.a. yes
PortugalTarif d’achat (valeurs
2008)/Feed-in Tariff (values 2008)
15 ans15 years
7,4 - 7,5 7,4 - 7,5 n.a. n.a. no
DenmarkPrime ajoutée au prix
d’achat/Purchase price subsidy
22 000 heures (environ 10 ans)
22 000 hours (around 10 years)
3,3 3,3Appel
d’offresTender
Appel d’offresTender
yes
AustriaTarif d’achatFeed-in Tariff
10+24 7,53 n.a. – – no
Netherlands
Prix de référence SDE5
SDE5 reference price15 9,41 9,41
Appel d’offresTender
Appel d’offresTender
no
Prix de référence SDE5
(turbines > 6 MW)SDE5 reference price
(> 6 MW turbines)
15 – 9,61Appel
d’offresTender
Appel d’offresTender
no
n.a. : Non disponible. Not available. = Ne s’applique pas (pas de politique ou pas de potentiel). Does not apply (i.e. in the case of no policy or no potential). 1En Allemagne, les tarifs d’achat peuvent être modulés durant les premières années d’exploitation (5 ans pour le terrestre et 12 ans pour l’offshore), pour les installa-tions à faible rendement (éolien terrestre) ou selon la distance à la côte et de la profondeur de l’eau (éolien offshore). La nouvelle loi EEG 2009 valorise également larémunération des turbines équipées de système fournissant un service pour le réseau. Les nouvelles turbines équipées de ce système peuvent prétendre à un tarifd’achat augmenté de 0,5 c€ /kWh. Les turbines déjà installées peuvent prétendre à une augmentation de 0,7c€/kWh, à condition que l’équipement soit opérationnelavant 2011. In Germany the first years of operation (5 years for onshore and 12 years for offshore) can have a different level of FIT, depending on lower yield (onshorewind) or distance to coast or water depth (offshore wind). The new feature of the 2009 EEG is that wind turbines should be able to provide system services to the electricity grid in case of congestion. The initial fee for new turbines has been increased by €0.05/kWh. Existing turbines equipped with the system servicesequipment, attract a bonus of €0.07/kWh (provided that the equipment is operational before 2011). 2En Espagne, les opérateurs peuvent choisir entre deux systèmes,un système de tarif d’achat ou un bonus ajouté au prix de marché, le total étant encadré. Spain: operators can choose between a set feed-in tariff and a bonus addedto the market price, within a fixed ceiling. 3La valeur d’un ROCs sur le marché a varié durant l’année 2009 entre 51,81 £ et 45,52£. The ROCs market value variedbetween £51.81 and £45.52 during 2009. 4En Autriche, l’année 11 et l’année 12 ont des tarifs d’achats réduit. Austria: Year 11 and year 12 have reduced FIT. 5À corriger rétroactivement en fonction du prix de vente de l’électricité sur le marché de gros. Adjusted retroactively to the wholesale price. Source: EurObserv’ER 2010.
Tabl. n° 5Tarifs d’achat éolien ou autres systèmes d’incitations dans une sélection de pays (en c€/kWh)Feed-in tariffs for wind electricity or other support schemes in selected countries (in c€/kWh)

56
win
d e
ne
rg
y b
ar
om
ete
r
SYSTÈMES SOLAIRES le journal de l’éolien N° 6 – 2010
B A R O M È T R E É O L I E N – E U R O B S E R V ’ E R – M A R S 2 0 1 0
Un marché français de plus en plusencadréL’année 2009 peut être qualifiée de
moyenne pour le marché français de l’éolien
qui a diminué de 8,6 % par rapport à 2008.
Selon l’Ademe, le parc français (départe-
ments et communautés d’outre-mer inclus)
a atteint 4 521 MW en 2009, soit une puis-
sance supplémentaire de 979 MW. C’est un
peu moins bien qu’en 2008 où 1 060 MW
avaient été installés. Ces chiffres, plus
faibles qu’attendus, s’expliquent en partie
par l’annulation par le Conseil d’État en août
2008 du décret fixant les
conditions d’achat de
l’électricité produite par
les éoliennes pour vice de
procédure. Le ministère a
remis les choses en ordre
en publiant un nouvel
arrêté en décembre 2008
reprenant sur le fond les
termes de l’arrêté initial du 10 juillet 2006.
Les perspectives de croissance du marché
2010 restent incertaines, le gouvernement
ayant annoncé son intention de modifier,
dès le 1er janvier 2010, le régime d’autorisa-
tion des éoliennes pour le faire entrer dans
le champ des installations classées pour
l’environnement (ICPE). Il considère en effet
que l’augmentation constatée et prévisible
de la taille des parcs éoliens rend nécessaire
la mise en place d’un régime administratif
plus robuste, assorti d’une police adminis-
trative spéciale.
Le passage des éoliennes dans le régime
ICPE pose question pour les installations
disposant déjà d’un permis de construire. La
loi portant engagement national pour l’en-
vironnement, dite “loi Grenelle 2”, qui sera
soumise au Parlement début février 2010,
devra définir si les développeurs de ces
parcs devront ou non recommencer une
nouvelle procédure sous
le ré gime des installa-
tions classées. En atten-
dant le vote couperet,
de nombreux projets
éoliens sont actuelle-
ment bloqués en préfec-
ture (voir p. 14).
Selon le gouvernement,
la mise en place de ce nouveau dispositif
devrait faciliter le montage des projets
éoliens et limiter les possibilités de recours.
Les procédures ICPE sont de plus parfaite-
ment maîtrisées par les services de l’État, ren-
dant l’instruction des dossiers plus rapides…
Cette nouvelle procédure devra rapidement
être opérationnelle pour respecter le ta -
bleau de marche fixé dans le cadre de la
Programmation pluriannuelle des investis-
sements de production d’électricité (arrêté
du 15 décembre 2009). Les objectifs de 11 500
MW (10 500 MW terrestres et 1 000 MW mari-
times) du 31 décembre 2012 semblent déjà
hors d’atteinte. Restent ceux du 31 dé cem -
bre 2020 qui sont de 25 000 MW (19 000 MW
terrestres et 6 000 MW maritimes), consi-
dérés comme le véritable objectif du pays.
Concernant le marché de l’offshore, le tarif
d’achat actuel est trop bas pour permettre
la construction de parcs. Le ministère de
l’Éco logie entend donc lancer un appel
d’offres en trois tranches de 2 000 MW cha-
cune. La première tranche devrait être lan-
cée début 2011, pour des parcs d’au moins
300 MW (voir Systèmes Solaires, Le Journal
des Énergies Renouvelables n°195. p. 78).
Le challenge britannique de l’offshoreSelon le BWEA (British Wind Energy Asso-
ciation), la puissance éolienne britannique
a franchi le cap des 4 GW en 2009 avec 4 050,9
MW installés dont 688,2 MW offshore. Com-
parée aux chiffres de parc de l’année 2008
publiés par le DECC (Department of Energy
Les perspectives de croissancedu marché français pour 2010restent incertaines
The prospects for French market growth in 2010 areuncertain
Alpha Ventus, installé en merdu Nord fin 2009, premier
grand parc offshore allemand.
Alpha Ventus, installed in theNorth Sea at the end of 2009
is Germany’s first major offshore wind farm.
©2009 Jan Oelker, all rights reserved

59
ba
ro
mè
tre
éo
lie
n
SYSTÈMES SOLAIRES le journal de l’éolien N° 6 – 2010
B A R O M È T R E É O L I E N – E U R O B S E R V ’ E R – M A R S 2 0 1 0
balance installations that already been granted a construction
permits. The law covering the national commitment to the envi-
ronment, known as the “Grenelle 2 law”, which will be submitted to
Parliament at the beginning of February 2010, should define whether
or not the developers of these farms will have to file their applica-
tions from scratch under the classified installations regime, leaving
many new wind turbine projects on hold at local prefecture level,
awaiting the make-or-break vote (see p.14).
The government views that the implemen-
tation of this new mechanism should stream -
line wind power project applications and
curb the possibilities of redress. Furthermore
the State departments are fully conversant
with ICPE procedures, making for faster pro-
cessing of applications…
This new procedure should soon be up and
running, if the sche dule that has been set
for multiyear electricity production invest-
ment planning (order dated 15 December 2009) is to be met. The
31 December 2012 goals of 11 500 MW (10 500 MW onshore and
1 000 MW for offshore wind farms) already seem to be compro-
mised, which leaves the target of 25 000 MW (19 000 MW onshore
and 6 000 MW for offshore wind farms), considered as the country’s
real target for 31 December 2020 as viable. As for the offshore mar-
ket, the feed-in tariff is too low to make wind farm construction a
going concern. Therefore the Ministry of Ecology intends to issue a
tender in three 2 000-MW phases. The first phase should be announ -
ced early in 2011, for farms of at least 300 MW (see Systèmes
Solaires, Le Journal des Énergies Renouvelables No.195. p.78).
The British offshore challenge According to the BWEA (British Wind Energy Association), British
wind power capacity passed the 4 GW mark in 2009 with 4 050.9
MW installed including 688.2 MW offshore. If these figures are
compared with those of the previous year
published by the DECC (De partment of
Energy and Climate Change), the additional
capacity is of the order of 645 MW. How-
ever the figure for the British wind farm
base could be revised upwards as the
BWEA did not include in its estimates the
partial connection of two offshore farms
nearing completion. This is because accor -
ding to a recent EWEA (European Wind
Energy Association) study, 30 of the 60 turbines (i.e. 90 MW) were
already operating on the Robin Rigg site and 29 of the 48 turbines
(i.e. 104.4 MW) on the Gunfleet Sands site at the end of 2009. If the
operating capacity of UK’s offshore capacity was around 882.8
MW at the end of 2009. The BWEA reckons that 4 598 MW of off-
shore projects are either under construction off the United King-
4 050.9 MWBritish wind power capacity passed
the 4 GW mark in 2009La puissance éolienne britannique a franchi le cap des 4 GW en 2009
avec 4 050,9 MW installés
Parc éolien de Champfleury dans l’Aude (France).
Champfleury wind farm in the Aude (France).
Repower

60
win
d e
ne
rg
y b
ar
om
ete
r
SYSTÈMES SOLAIRES le journal de l’éolien N° 6 – 2010
B A R O M È T R E É O L I E N – E U R O B S E R V ’ E R – M A R S 2 0 1 0
Poste de transformationdu parc offshore de Lillgrund (Suède).
The Lillgrund offshorewind farm’s transformerstation (Sweden).
© Hans Blomberg
61
ba
ro
mè
tre
éo
lie
n
SYSTÈMES SOLAIRES le journal de l’éolien N° 6 – 2010
B A R O M È T R E É O L I E N – E U R O B S E R V ’ E R – M A R S 2 0 1 0
dom or approved and that offshore capacity could reasonably
rise to 20 000 MW by 2020.
Last December’s publication of the 2010 draft Finance Bill relieved
offshore wind farm developers. The bill upholds the value of off-
shore electricity at 2 ROCs (Renewable Obligation Certificates) per
megawatt-hour for accredited wind farms until 2014. The cost of a
ROC in 2009 averaged at about fifty pounds and tended to drop
towards the end of the year (from £51.81 on 13 January 2009 to £46.25
on 19 January 2010). The value of an offshore megawatt-hour was
raised from 1.5 to 2 ROCs in the 2009 budget passed last April, for all
projects that ordered turbines during financial year 2009-2010. The
industry was highly enthusiastic about the Ministry’s decision to
award 50 million pounds’ worth of aid to finance offshore wind tur-
bines manufacturing and equipment testing plants. The BWEA con-
firms that with an active support policy, the wind power sector
could account for 60 000 jobs and 30% of the United Kingdom’s elec-
tricity.
The DECC announced another new development early in February
– the introduction of a specific feed-in tariff system for households
and local authorities wishing to produce their own renewable elec-
tricity starting in April 2010. The electricity produced entitles the
supplier to pecuniary compensation, including the own-account
consumption part. The feed-in tariff for wind power modulates
every year to keep pace with inflation and varies from 34.5
pence/kWh (€0.394 per kWh) for capacities below 1.5 kW to 4.5
pence/kWh (€0.051 per kWh) for capacities in the range 1.5-5 MWh.
A similar mechanism will be set up for investments in renewable
energy-fuelled heating appliances as of April 2011. The idea is to
enable householders and low wage earners (via council housing
authorities) to reduce their energy bills (or earn additional revenue)
and actively participate in achieving the country’s goals. The DECC
reckons that the development of these small installations will meet
2% of the country’s electricity demand by 2020.
the wind power industry takes on the crisis
adaptation to a new environment required
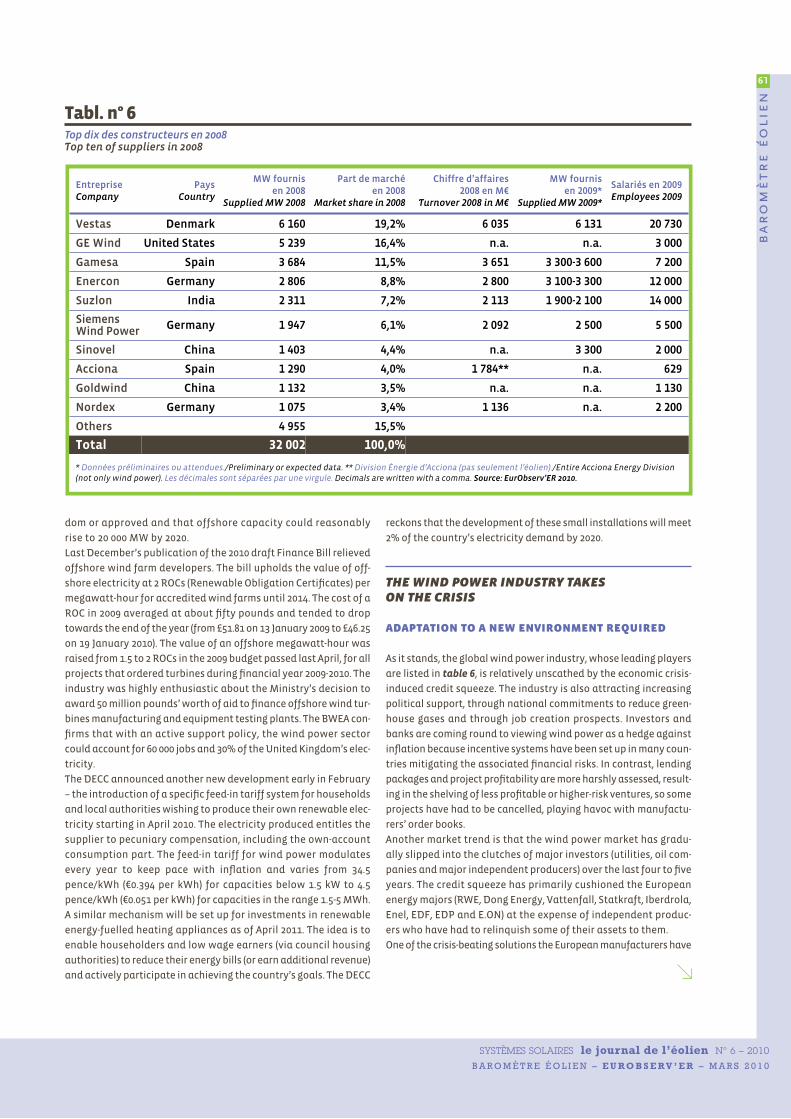
As it stands, the global wind power industry, whose leading players
are listed in table 6, is relatively unscathed by the economic crisis-
induced credit squeeze. The industry is also attracting increasing
political support, through national commitments to reduce green-
house gases and through job creation prospects. Investors and
banks are coming round to viewing wind power as a hedge against
inflation because incentive systems have been set up in many coun-
tries mitigating the associated financial risks. In contrast, lending
packages and project profitability are more harshly assessed, result-
ing in the shelving of less profitable or higher-risk ventures, so some
projects have had to be cancelled, playing havoc with manufactu -
rers’ order books.
Another market trend is that the wind power market has gradu-
ally slipped into the clutches of major investors (utilities, oil com-
panies and major independent producers) over the last four to five
years. The credit squeeze has primarily cushioned the European
energy majors (RWE, Dong Energy, Vattenfall, Statkraft, Iberdrola,
Enel, EDF, EDP and E.ON) at the expense of independent produc-
ers who have had to relinquish some of their assets to them.
One of the crisis-beating solutions the European manufacturers have
Entreprise Company
Pays Country
MW fournis en 2008
Supplied MW 2008
Part de marché en 2008
Market share in 2008
Chiffre d’affaires 2008 en M€
Turnover 2008 in M€
MW fournis en 2009*
Supplied MW 2009*
Salariés en 2009Employees 2009
Vestas Denmark 6 160 19,2% 6 035 6 131 20 730
GE Wind United States 5 239 16,4% n.a. n.a. 3 000
Gamesa Spain 3 684 11,5% 3 651 3 300-3 600 7 200
Enercon Germany 2 806 8,8% 2 800 3 100-3 300 12 000
Suzlon India 2 311 7,2% 2 113 1 900-2 100 14 000
SiemensWind Power Germany 1 947 6,1% 2 092 2 500 5 500
Sinovel China 1 403 4,4% n.a. 3 300 2 000
Acciona Spain 1 290 4,0% 1 784** n.a. 629
Goldwind China 1 132 3,5% n.a. n.a. 1 130
Nordex Germany 1 075 3,4% 1 136 n.a. 2 200
Others 4 955 15,5%
Total 32 002 100,0%
* Données préliminaires ou attendues./Preliminary or expected data. ** Division Énergie d’Acciona (pas seulement l’éolien)./Entire Acciona Energy Division(not only wind power). Les décimales sont séparées par une virgule. Decimals are written with a comma. Source: EurObserv’ER 2010.
Tabl. n° 6Top dix des constructeurs en 2008Top ten of suppliers in 2008

62
win
d e
ne
rg
y b
ar
om
ete
r
SYSTÈMES SOLAIRES le journal de l’éolien N° 6 – 2010
B A R O M È T R E É O L I E N – E U R O B S E R V ’ E R – M A R S 2 0 1 0
and Climate Change), la puissance supplé-
mentaire serait de l’ordre de 645 MW. Le
chiffre du parc britannique pourrait être
revu à la hausse, le BWEA n’ayant pas pris en
compte dans ses estimations la connexion
partielle de deux parcs offshore en cours
d’achèvement. En effet,
selon une étude récente
de l’association euro-
péenne EWEA (European
Wind Energy Associa-
tion), à la fin de l’année
2009, 30 turbines sur 60
(soit 90 MW) seraient
déjà opérationnelles sur
le site de Robin Rigg et
29 turbines sur 48 (soit
104,4 MW) sur le site de
Gunfleet Sands. En prenant en compte, la
puissance opérationnelle de ces deux
parcs, la puissance offshore du Royaume-
Uni serait de l’ordre de 882,8 MW fin 2009.
Le BWEA estime qu’il y a actuellement, en
construction ou en projets validés, 4 598
MW offshore au Royaume-Uni et que la
puissance offshore pourrait raisonnable-
ment atteindre 20 000 MW d’ici à 2020.
La publication, en décembre dernier, du
projet de loi de finances 2010 a rassuré les
développeurs de parcs offshore. Ce projet
de loi maintient la valeur de l’électricité off-
shore à 2 ROCs (Renewable Obligation Cer-
tificates) par mégawattheure pour les parcs
accrédités jusqu’en 2014. Le prix moyen
d’un ROCs était en 2009 de l’ordre d’une cin-
quantaine de livres avec une tendance à la
diminution en fin d’année (de 51,81 livres au
13 janvier 2009 à 46,25 livres au 19 janvier
2010). La valeur d’un mégawattheure off-
shore avait déjà été portée d’1,5 à 2 ROCs
dans le budget 2009 voté en avril dernier,
pour tous les projets ayant commandé des
turbines durant l’année financière 2009 à
2010. Les professionnels de la filière ont
également accueilli très favorablement la
décision du ministère d’accorder une aide
de 50 millions de livres en vue de financer
des unités de fabrication d’éoliennes off-
shore et de test de matériel. Le BWEA
confirme, qu’avec une politique de soutien
active, la filière éolienne pourrait repré-
senter 60 000 emplois et 30 % de l’électricité
du Royaume-Uni.
Autre nouveauté, le DECC a annoncé début
février l’introduction d’un système de tarifs
d’achat spécifiques pour les ménages ou les
collectivités désireux de produire eux-
mêmes leur électricité renouvelable et ce,
dès avril 2010. L’électricité produite donne
droit à une rétribution de la part du four-
nisseur, y compris la part de l’électricité
autoconsommée. Pour l’éolien, le tarif
d’achat, modulé chaque année en fonction
de l’inflation, varie de 34,5 pences/kWh (39,4
c€/kWh) pour les puis-
sances inférieures à 1,5
kW à 4,5 pences/kWh
(5,1c€/kWh) pour les
puissances comprises
entre 1,5 et 5 MWh. Un
dispositif similaire sera
mis en place pour les
investissements dans
les appareils de chauf-
fage à énergie renouve-
lable dès le mois d’avril
2011. L’idée est de permettre aux particu-
liers et aux revenus modestes (via les orga-
nismes de logement social) de réduire leur
facture énergétique (ou d’obtenir des reve-
nus supplémentaires) et de participer acti-
vement aux objectifs du pays. Le DECC pré-
voit que le développement de ces petites
installations réponde à 2 % de la demande
d’électricité du pays d’ici à 2020.
l’industrie éolienne face à la crise
une adaptation nécessaire à un nouvel environnement
L’industrie éolienne mondiale, dont les prin-
cipaux acteurs sont présentés dans le
tableau 6, a pour l’instant été relativement
épargnée par le resserrement du crédit dû à
la crise financière. L’industrie est également
de plus en plus soutenue politiquement, à
travers les engagements nationaux en
termes de réduction de gaz à effet de serre
et les perspecti -
ves de création
d’em plois. L’éo-
lien est de plus
en plus consi dé -
ré comme une
va leur refuge par
les in vestisseurs
et par les banques car les risques financiers
asso ciés sont minorés du fait des systèmes
d’incitation mis en place dans de nombreux
pays. D’un autre côté, les montages finan-
ciers et la profitabilité des projets sont éva-
lués plus durement, laissant de côté les pro-
jets moins rentables ou plus risqués.
Certains projets ont ainsi dû être annulés,
provoquant des chamboulements dans les
carnets de commandes des fabricants.
Autre tendance du marché, le marché de
l’éolien est depuis quatre ou cinq ans de
plus en plus contrôlé par les gros investis-
seurs (utilities, compagnie pétrolière et
grands producteurs indépendants). Le res-
serrement du crédit a notamment conforté
la présence des grandes compagnies éner-
gétiques européennes (RWE, Dong Energy,
Vattenfall, Statkraft, Iberdrola, Enel, EDF,
EDP ou E.ON) au détriment des producteurs
indépendants qui ont dû leur céder une par-
tie de leurs actifs.
Du côté des fabricants européens, une des
solutions anticrise a été d’investir dans de
nouvelles capacités de production dans les
pays où le marché éolien est en très forte
croissance comme aux États-Unis, en Chine
ou en Inde. Certains ont même été con -
traints de délocaliser une partie de leur
capacité de production européenne vers
ces nouveaux marchés.
L’industrie européenne est également par-
ticulièrement bien positionnée sur le très
prometteur marché européen de l’offshore.
Les industriels spécialisés sur ce marché
ont mis au point de nouvelles machines,
plus puissantes, plus productives et néces-
sitant moins de maintenance. Ils comptent
bénéficier de leur avance technologique
pour dynamiser leur croissance sur le mar-
ché européen.
actualités des principauxacteurs
Vestas vise un revenu de 7 milliards en 2010 En 2009, l’industriel danois a produit et
commercialisé 6 131 MW pour 3 320 tur-
bines, soit à peu de chose près la même puis-
sance qu’en 2008 (6 160
MW). Il devrait ainsi per -
dre des parts de marché
face à ses prin cipaux con -
cur rents. Bien qu’in fé -
rieurs à ceux es comp tés,
les re venus de l’entre-
prise sont en aug men -
tation de 10 %, à 6,6 milliards d’euros (6 mil-
liards d’euros en 2008) pour un résultat
d’exploitation de 856 millions d’euros, en
hausse de 28 %. Au final, les profits de l’en-
treprise ont atteint 579 millions d’euros, en
50 M£le montant de l’aide accordée
par le gouvernement britannique en vue de financer
l’industrie offshorethe amount of aid granted by the British government
to finance the offshore industry
L’industrie éolienne mondiale a pourl’instant été relativement épargnée par le resserrement du crédit.
The global wind power industry has so far come through the creditsqueeze relatively unscathed.

N 400 km
149,264,0
n°24
Malta**Cyprus**
Slovenia**
3,1
Lithuania
91,037,0
Romania n°23n 23
14,04,5
201,074,0
193,343,3
n°19n 19
146,04,01,0
n°9n 9
1 560,0512,0
177,057,0
Poland n°13d n 13
705,3259,4
5,2
Greecece
1 087,0102,0
Italy n°3taly n 3
4 850,01 113,5
Portugal n°6Portugal
3 535,0673,0
France1 n°4ce n 4
4 521,0979,0
Irelandnd
1 260,0233,0
United Kingdom2 n°5om n 5
4 050,9645,2
Spain n°2pain n 2
19 148,82 459,4
Germany n°1many n 1
25 777,01 916,8
36,7
n°7
3 480,6350,7
32,8
Netherlands n°8
2 220,739,134,4
994,9
Luxembourg n°21
43,3
Latvia
28,01,0
563,0171,1
Belgium n°14
TOTAL EU
74 800,29 739,1
111,2
Puissance éolienne installée dans l’Union européenne fin 2009* Installed wind power capacity in the European Union at the end of 2009*
* Estimation. Estimate. ** Pas de capacité installée. No capacity installed. 1 DOM-COM inclus. French overseas departements and collectivities included. 2 Concernantle Royaume-Uni, l’estimation du parc fin 2009 est celle du BWEA. The estimate for the UK 2009 wind turbine base came from the BWEA.Les décimales sont séparées par une virgule. Decimals are written with a comma. Source: EurObserv’ER 2010.
63
ba
ro
mè
tre
éo
lie
n
SYSTÈMES SOLAIRES le journal de l’éolien N° 6 – 2010
B A R O M È T R E É O L I E N – E U R O B S E R V ’ E R – M A R S 2 0 1 0
Puissance cumulée installée dans les pays de l’Unioneuropéenne à fin 2009 (en MW).Cumulated installed capacity in the European Union countriesat the end of 2009 (in MW).
Puissance installée durant l’année2009 dans les pays de l’Unioneuropéenne (en MW).Capacity installed in theEuropean Union countries during 2009 (in MW).
Puissance mise hors servicedurant l’année 2009 (en MW).Capacities decommissioned during 2009 (in MW).
Légende/Key
50 550

64
win
d e
ne
rg
y b
ar
om
ete
r
SYSTÈMES SOLAIRES le journal de l’éolien N° 6 – 2010
B A R O M È T R E É O L I E N – E U R O B S E R V ’ E R – M A R S 2 0 1 0
augmentation de 13 %. Fin 2009, l’entreprise
employait 20 730 personnes dans le monde,
14 161 en Europe, 4 316 en Asie (Pacifique
inclus) et 2 193 dans les Amériques.
Pour 2010, Vestas a revu ses perspectives de
croissance à la baisse avec un chiffre d’af-
faires attendu de 7 milliards d’euros (contre
une prévision initiale comprise entre 7 et 8
milliards d’euros) avec une marge d’exploi-
tation de 10 à 11%. L’entreprise justifie cette
baisse par le fait qu’une partie de ses com-
mandes fermes (com pri ses entre 8 et 9 GW)
se ront effectuées en fin d’année, grevant
une partie des recettes
affec tées en 2010.
Pour maintenir sa renta-
bilité, l’industriel a dû
opérer des choix stratégi -
ques comme dé localiser
une partie de sa produc-
tion du Danemark vers
les deux principaux mar-
chés porteurs à savoir les
États-Unis et la Chine. Cette année, l’indus-
triel a dû se séparer de 1 150 travailleurs
danois et fermer une usine de fabrication
de pales au Royaume-Uni employant 425
personnes. Aux États-Unis, il a investi 1 mil-
liard de dollars dans quatre unités de pro-
duction dans l’État du Colorado, deux pour
la construction de pales, une pour la pro-
duction de nacelles et une autre pour la
production de tours. Toutes devraient être
opérationnelles cette année et produire
4 000 pales, 1 400 nacelles et 900 tours
chaque année. La compagnie a prévu d’em-
ployer en 2010 quelque 4 000 personnes à
travers l’Amérique du Nord. Vestas a égale-
ment fortement investi en Chine dans son
centre de production dans la zone de
dévelop pement technologique et écono-
mique de Tian jin. Ce
centre, inau guré en
2006 avec la cons truc -
tion d’une première
usine de pales, est
devenu une base com-
plète de production
d’éoliennes (na celles,
générateurs, pales, sys-
tèmes de con trôle…).
Le montant des nouveaux investissements
est de 220 millions de dollars, soit un total
de 380 millions de dollars investi dans ce
centre. À la fin de l’année 2009, le montant
total investit par Vestas en Chine a dépassé
les 439 millions de dollars (3 milliards CNY).
En Europe, l’industriel est très présent sur
le marché de l’offshore où il disposait fin
2009 d’une part de marché cumulée de
l’ordre de 40 %. Il a décroché en août der-
nier une nouvelle commande de 55 unités
de sa V90-3MW pour le parc belge de Bligh
Bank qui sera situé à 46 km au large de
Zeebrugge.
Sur le plan technique, l’industriel a com-
mencé à commercialiser en février 2009
deux nouvelles machines, la V100-1,8 MW et
la V112-3 MW, qui seront prêtes à être ins-
tallées sur des sites faiblement et moyen-
nement ventés en 2010 et 2011. Une version
offshore de la V112-3M est également dis-
ponible, optimale avec des vitesses de vent
jusqu’à 9,5 m/s. Un nouveau prototype de
sa turbine V60-850 kW a également été pré-
senté en avril 2009. Cette éolienne, qui sera
fabriquée dans l’usine chinoise Vestas de
Hohhot, en Mongolie intérieure, a reçu une
première commande en décembre 2009.
Vestas travaille aussi sur le développement
d’une éolienne offshore de 6 MW mais n’a
pas encore précisé sa date de sortie.
20 730le nombre de salariés employés
par Vestas dans le monde fin 2009the number of employees on theVestas payroll across the world
at the end of 2009
Un ouvrier employé à la fabricationde pales dans une usine chinoise
du groupe Vestas.
A blade-manufacturing worker in a one of the Vestas Group’s
Chinese plants.
Vestas
65
ba
ro
mè
tre
éo
lie
n
SYSTÈMES SOLAIRES le journal de l’éolien N° 6 – 2010
B A R O M È T R E É O L I E N – E U R O B S E R V ’ E R – M A R S 2 0 1 0
come up with is to invest in new production capacity in countries
with booming wind power markets, such as the United States, China
or India. Some have even been forced to relocate part of their Euro-
pean production capacity to these new markets.
The European industry also has an excellent position on the very
promising European offshore market, whose specialist manufac-
turers have developed new, more powerful, higher-performance
machines that require less maintenance. They are counting on using
their head start in technology to drive their expansion in the Euro-
pean market.
news from the leading players
Vestas aiming to earn 7 billion in 2010 In 2009, the Danish manufacturer produced and sold 3 320 turbines
for a total capacity of 6 131 MW, which is about the same as the
previous year’s sales (6 160 MW). It should thus lose market shares
to its main competitors. Although the company’s earnings were
below target, they rose 10%, to 6.6 billion euros (6 billion in 2008)
giving a trading result of 856 million euros, up by 28%. At the end
of the day the company’s profits were up 13% to 579 million euros.
At the end of 2009, the company had 20 730 people employed
worldwide – 14 161 in Europe, 4 316 in Asia (including Asia Pacific)
and 2 193 in the Americas.
Vestas has downgraded its 2010 growth prospects with expected
sales of 7 billion euros (as against its initial forecast of 7-8 billion)
with a 10-11% operating margin, arguing that some of its firm
orders (for 8-9 GW) will be at the end of the year, which will squeeze
part of the earnings allocated to 2010.
The manufacturer has had to make strategic choices to stay prof-
itable, such as relocating part of its manufacturing from Denmark
to the two main buoyant markets, namely the US and China . This
year the manufacturer had to lay off 1 150 Danish workers and
close a blade manufacturing plant in the UK with a loss of 425 jobs.
It invested US$1 billion in the United States on 4 manufacturing
plants in Colorado State – two to make blades, 1 to make nacelles
and another for tower manufacturing. They should all be opera-
tional this year with annual output of 4 000 blades, 1 400 nacelles
and 900 towers respectively. The company plans to employ about
4 000 people across North America in 2010. Vestas has also invested
heavily in China in its Tianjin Economic Development Area manu-
facturing centre, which was inaugurated in 2006 when the first
blade factory was built and has become a full wind turbine pro-
duction base (nacelles, generators, blades, control systems, and
so on). The new investments run up to US$220 million, making a
total of US$380 million invested in this centre. By the end of 2009,
Vestas’ total investment in China had exceeded US$439 million
(3 billion CNY).
The manufacturer also has a very high profile in the European off-
shore market where it had a cumulated market share of about 40%
at the end of 2009. Last August it clinched a new order for 55 of its
V90-3MW turbine generators for the Belgian Bligh Bank farm
which will be located 46 km off Zeebrugge.
Looking to technical developments, the company started mar-
keting two new turbines in February 2009 – the V100-1.8 MW and
the V112-3 MW, which will be ready for installation on sites with
low and medium wind conditions in 2010 and 2011. An offshore ver-
sion of the V112-3 MW is also available, which is at its best when
wind speeds are up to 9.5 m/s. A new prototype of its V60-850 kW
turbine was presented in April 2009. The first order for this turbine,
which will be manufactured in the Vestas Hohhot facility, Inner
Mongolia, was placed in December 2009. Vestas is also working on
developing a 6-MW offshore turbine, but has yet to announce its
launch date.
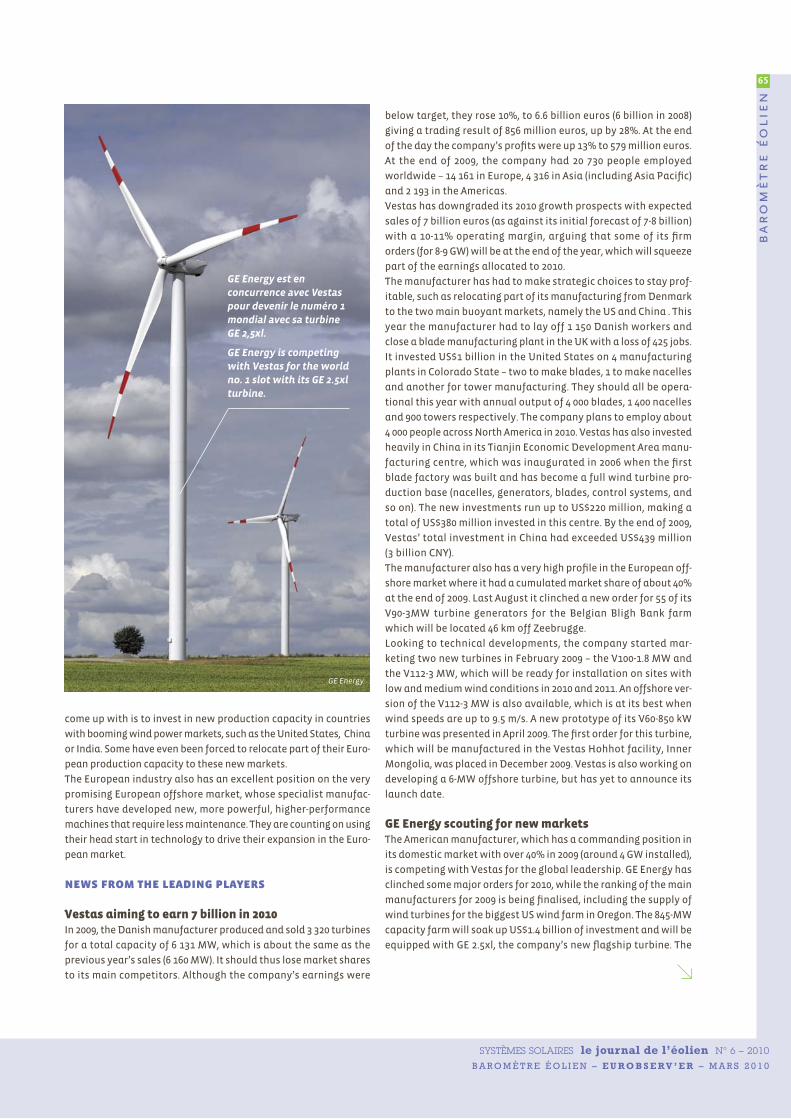
GE Energy scouting for new marketsThe American manufacturer, which has a commanding position in
its domestic market with over 40% in 2009 (around 4 GW installed),
is competing with Vestas for the global leadership. GE Energy has
clinched some major orders for 2010, while the ranking of the main
manufacturers for 2009 is being finalised, including the supply of
wind turbines for the biggest US wind farm in Oregon. The 845-MW
capacity farm will soak up US$1.4 billion of investment and will be
equipped with GE 2.5xl, the company’s new flagship turbine. The
GE Energy est en concurrence avec Vestaspour devenir le numéro 1mondial avec sa turbine GE 2,5xl.
GE Energy is competingwith Vestas for the worldno. 1 slot with its GE 2.5xlturbine.
GE Energy

66
win
d e
ne
rg
y b
ar
om
ete
r
SYSTÈMES SOLAIRES le journal de l’éolien N° 6 – 2010
B A R O M È T R E É O L I E N – E U R O B S E R V ’ E R – M A R S 2 0 1 0
GE Energy à la conquête de nouveaux marchésLe fabricant américain, très bien positionné
sur son marché national avec, en 2009, plus
de 40 % de part de marché (près de 4 GW ins-
tallés), est en concurrence avec Vestas pour
devenir le n°1 mondial. En attendant le clas-
sement définitif des principaux construc-
teurs pour l’année 2009, GE Energy a décro-
ché d’importantes commandes pour l’année
2010. Il livrera par exemple les éo liennes du
plus grand parc des États-Unis situé dans l’É-
tat de l’Oregon. Ce parc, d’une puissance de
845 MW, nécessitera un investissement d’1,4
milliard de dollars et sera équipé de GE 2.5xl,
la nouvelle turbine phare de l’entreprise.
Le fabricant américain livrera également
101 turbines au groupe
éner gétique tchèque
CEZ, qui prévoit de
cons truire le plus grand
parc éolien terrestre
européen en Roumanie.
Cette ferme de 600 MW,
nécessitera un investis-
sement d’1,1 milliard
d’euros. GE est également présent sur le mar-
ché chinois. L’entreprise a annoncé le 12 jan-
vier dernier avoir signé un contrat pour la
livraison de 88 turbines de classe 1,5 MW à
HECIC New Energy Co., Ltd, l’un des princi-
paux développeurs éoliens chinois. Cette
commande équipera trois parcs terrestres
d’une puissance cumulée de 132 MW. À ce
jour, GE s’est engagée à fournir 895 turbines
éoliennes d’1,5 MW à la Chine. GE a égale-
ment décidé de s’implanter dans le très pro-
metteur marché indien. Il construit actuel-
lement sa première usine dans le pays, près
de la ville de Chennai (sud-est du pays). Cette
usine, qui produira la GE d’1,5 MW dès le
deuxième trimestre 2010, sera dotée d’une
capacité de production annuelle de 450 MW.
L’entreprise, absente du marché de l’off-
shore depuis 2003 (année de construction du
parc Arklow Bank en mer d’Irlande), a précisé
son ré-intérêt pour le secteur en rachetant
en octobre dernier le fabricant norvégien
Scanwind pour 15 millions d’euros. L’intérêt
pour le fabricant est d’acquérir la technolo-
gie “direct drive” qui présente de nombreux
avantages pour ce marché, notamment sur
le plan de l’usure des pièces.
Gamesa consolide ses positions L’année 2009 a été un peu plus difficile pour
le fabricant espagnol qui prévoit, au troi-
sième trimestre, une possible diminution
de ses ventes de 3 684 MW à entre 3 300 et
3 600 MW en 2009. Pour 2010, Gamesa pré-
voit de consolider ses positions sur les prin-
cipaux marchés émergents. Pour cela, l’en-
treprise a commencé la construction de son
premier centre de production à Chennai en
Inde. Dotée d’une capacité de production
initiale de 200 MW, l’entreprise espère pou-
voir répondre au besoin du marché indien
et des pays voisins. Gamesa continue éga-
lement d’adapter son offre de produits à la
demande spécifique de chaque marché, en
augmentant sensiblement la capacité de
ses usines de production aux États-Unis et
en Chine. Dans ce cadre, Gamesa a com-
mencé la production de ses premières uni-
tés de la G90-2 MW aux États-Unis et porté
au troisième trimestre
sa capacité de pro -
duction dans ce pays
à 1 200 MW. Parallèle-
ment, Gamesa a conti-
nué le développement
industriel en Chine de
sa G8x-2 MW en adap-
tant son unité d’as-
semblage de nacelles et de turbines, et en
cherchant de nouveaux accords pour la
four niture de pales et de boîtes de vitesses
via des partenariats stratégiques dans la
région. Ce développement devrait être fina-
lisé durant le premier trimestre de 2010 et
permettre à l’entreprise de disposer d’une
capacité de production de 1 000 MW en
Chine répartie sur deux plates-formes de
production sur son site de Tianjin : la G5x-
0.85 MW et la G8x-2 MW. Le marché chinois
est particulièrement prometteur. Gamesa
et son partenaire chinois China Guangdong
Nuclear Wind Co ont signé en juin dernier
un accord pour le développement de pro-
jets éoliens dans la région de Shandong
portant sur 253 MW, livrables sur la période
2009-2011. Dans la foulée,
Gamesa a signé un autre
accord avec Huadian New
Energy Development Co,
pour la livraison de 300
MW (turbines G5x-850 kW
et G8x-2.0 MW), également
livrables sur la pé riode
2009-2013, pour des projets situés dans la
région autonome de Mongolie intérieure.
En Europe, Gamesa a en 2009 pleinement
profité de la croissance de son marché
national avec, selon l’association espagnole
AEE, 845,2 MW installés, soit 34,4 % de part
de marché. L’entreprise est également très
bien positionnée sur le marché italien,
qu’elle considère comme un de ses marchés
stratégiques. En 2009, l’entreprise a par
exemple signé deux nouveaux contrats
avec la compagnie italienne Enpower 3,
pour la livraison et l’installation de 49 tur-
bines G8x-2 MW pour les parcs de Cattolica
et de Lercara 1. Elle se positionne aussi sur
le marché roumain où elle a vendu 52 tur-
bines de 2 MW pour trois parcs situés dans
la région de Dobrogea.
Sur le plan technologique, l’entreprise a
présenté en juin 2009 son nouveau proto-
type d’éolienne de classe 4,5 MW (la G10x-
4.5 MW). Son rendement annuel sera équi-
valent à la consommation de plus de 3 000
foyers. Elle disposera d’un diamètre de
rotor de 128 mètres et d’une tour de 120
mètres de haut.
Enercon, une 7 MW sous surveillanceL’industriel allemand est le seul grand fabri-
cant éolien indépendant et n’est pas coté
en Bourse. Les informations relatives à l’ac-
tivité de l’entreprise sont de ce fait plus dif-
ficiles à obtenir. Celle-ci devrait cependant
avoir maintenu une croissance po sitive de
son activité, boostée en partie par une aug-
mentation de part de marché sur son mar-
ché national (60,4 % de part de marché en
2009 selon le DEWI).
L’entreprise a fait les gros titres en
novembre 2009 lors de l’inauguration des
cinq premières éoliennes “direct drive”
E126 de 6 MW du parc d’Estinnes en Bel-
gique (voir photo p. 67). Ce parc, qui com-
portera au final 11 machines, a la particu-
larité d’accueillir les éoliennes les plus
puissantes jamais commercialisées. Qui
plus est, ces machines seraient actuelle-
ment bridées et pourraient avoir une puis-
sance nominale de 7 MW. Selon WindVision,
client d’Enercon, le parc
devrait produire chaque
année autour de 187 GWh,
une production suffisante
pour alimenter quelque
50 000 foyers. L’entreprise
est également très pré-
sente sur les marchés in -
ternationaux (Canada, Inde, Australie) et
possède, en plus de ses usines de produc-
tion allemandes (Aurich, Emden et Magde-
bourg), des unités de production en Inde, au
Brésil, en Suède, au Portugal et en Turquie.
Gamesa continue d’adapter sonoffre de produits à la demandespécifique de chaque marché
Gamesa is also pursuing theadjustment of its product offerto the specific needs of eachmarket
60,4 %la part de marché d’Enercon
sur le marché allemand en 2009the market share of Enercon
on the German market in 2009

67
ba
ro
mè
tre
éo
lie
n
SYSTÈMES SOLAIRES le journal de l’éolien N° 6 – 2010
B A R O M È T R E É O L I E N – E U R O B S E R V ’ E R – M A R S 2 0 1 0
American manufacturer will also deliver 101 turbines to the CEZ
Group supply authority, which is planning to construct Europe’s
biggest onshore wind farm in Romania. This
600-MW farm will call for investment to the
tune of 1.1 billion euros. GE also operates in
the Chinese market. As recently as 12 January,
the company announced that it had signed a
contract to deliver 88 class 1.5 MW turbines to
HECIC New Energy Co., Ltd, one of the main
Chinese wind turbine developers. This order
will equip three onshore farms with accumu-
lated capacity of 132 MW. GE has committed to supplying 895 1.5-
MW wind turbines to China to date. GE has also decided to set up
in the very promising Indian market. It is currently constructing
its first factory there, close to the city of Chennai (formerly
Madras, in SE India). The factory’s annual production capacity will
be 450 MW, including the production of the GE 1.5-MW wind tur-
bine from the second quarter of 2010. The company, which
retreated from the offshore market in 2003 (the year the Arklow
Bank farm was constructed in the Irish Sea), confirmed its renewed
interest in the sector by buying out Norwegian manufacturer Scan-
wind for 15 million euros last October. GE is interested in acquir-
ing the “direct drive” technology that has many advantages for
this market, primarily with regards to parts wear.
Gamesa consolidates its positions The Spanish manufacturer fared slightly worse than expected in
2009 and is prepared to see a possible contraction in its third-quar-
ter sales from 3 684 MW to 3 300-3 600 MW in 2009. Gamesa is plan-
ning to consolidate its positions in the main emerging markets in
2010. Accordingly, the company has commenced construction of
its first manufacturing centre in Chennai, India, initially with 200
MW of production capacity. The company hopes to meet the ris-
ing needs of the Indian and neighbouring countries’ markets.
Gamesa is also pursuing the adjustment of its product offer to the
specific needs of each market, by significantly increasing the
capacity of its US and Chinese manufacturing plants. Hence
Gamesa started producing its first 2-MW G90 units in the US and
raised its US production capacity to 1 200 MW in the third quarter.
At the same time, Gamesa has pressed on with the industrial devel-
opment of its 2-MW G8x in China by adapting its nacelle and tur-
bine assembly plant and by seeking strategic partnerships in the
region for the supply of blades and gearboxes. This development
should be finalised in the course of the first quarter of 2010 and
increase the company’s Chinese production capacity to 1 000 MW
spread over two manufacturing platforms on its Tianjin site – the
0.85-MW G5x and the 2-MW G8x. The Chinese market is particularly
promising. Last June, Gamesa and its Chinese partner, China
Guangdong Nuclear Wind Co signed an agreement to develop
253-MW of wind turbine projects in the Shandong region to be deli -
vered over the 2009-2011 period. In the wake of that, Gamesa
entered into another agreement with Huadian New Energy Devel-
opment Co, for the delivery of 300 MW (850-kW G5x and 2.0-MW
G8x turbines), also to be delivered over the 2009-2013 period for
projects in the Autonomous Region of Inner Mongolia.
Turning to Europe, Gamesa took full advantage of the growth of
its domestic market in 2009 with, according to AEE, 845.2 MW
installed, namely a 34.4% market share. The company is also very
well-placed in the Italian market, which it considers as one of its
strategic markets. In 2009, the company signed two new contracts
with Italian company Enpower 3, for the
delivery and installation of 49, 2-MW
G8x turbines for the Cattolica and Ler-
cara 1 wind farms. The company also has
a foothold in the Romanian market
where it has sold 52 2-MW turbines for
three wind farms in the Dobrogea region.
Looking at technical developments, in
June 2009 Gamesa presented its new
4.5 MW class wind turbine prototype (the 4.5-MW G10x) which
should deliver the equivalent of the electricity consumption of over
3 000 households every year. It will have a rotor diameter of
128 meters and a tower 120 meters high.
GE Energy bought out the Norwegianmanufacturer Scanwind for 15 million euros last October
GE Energy a racheté en octobre dernier le fabricant norvégien Scanwind pour 15 millions d’euros
Une Enercon E126 (entraînement direct)
de 6 MW du parcd’Estinnes en Belgique.
An Enercon E126 (directdrive) 6-MW turbine in
the Estinnes wind farm,Belgium.
Enercon

68
win
d e
ne
rg
y b
ar
om
ete
r
SYSTÈMES SOLAIRES le journal de l’éolien N° 6 – 2010
B A R O M È T R E É O L I E N – E U R O B S E R V ’ E R – M A R S 2 0 1 0
Des éoliennes du fabricant indien Suzlon implantées dans l’État de Gujarat, à l’ouest de l’Inde.
Wind turbines made by Indian manufacturer Suzlon installed in Gujarat State, in Western India.
© Sisse Brimberg & Cotton Coulson

69
ba
ro
mè
tre
éo
lie
n
SYSTÈMES SOLAIRES le journal de l’éolien N° 6 – 2010
B A R O M È T R E É O L I E N – E U R O B S E R V ’ E R – M A R S 2 0 1 0
Enercon, a 7-MW turbine under surveillanceThe German manufacturer is the only major independent wind
turbine manufacturer and is not quoted on the Stock Exchange.
Therefore data relating to the company’s business is harder to
obtain. Nonetheless, it should have maintained positive growth
in 2009, partly boosted by an increase in its market share of the
domestic market (60.4% market share in 2009 according to DEWI).
The company made big headlines in November 2009 when it inau-
gurated the first five “direct drive” 6-MW E126 wind turbines at
the Estinnes (see picture p.67) wind farm in Belgium. The farm,
which will eventually have 11 machines, is outstanding because
it features the most powerful wind turbines sold
to date. What is more, these machines will actu-
ally be down-rated and could have a nominal
capacity of 7 MW. According to WindVision, its
client, the wind farm should produce about 187
GWh per annum which is sufficient to supply
50 000 households. The company also has a
strong foothold in the international markets
(Canada, India, Australia) and in addition to its German manu-
facturing facilities (Aurich, Emden and Magdeburg), has plants in
India, Brazil, Sweden, Portugal and Turkey.
Sinovel climbing upwardsThe Chinese manufacturer has enjoyed a meteoric rise, carried –
it has to be said – by the equally spectacular growth of its domes-
tic market. It claims to have delivered 3 300 MW in 2009 which is
twice as much as in 2008. Sinovel has made major research and
development efforts to make up for lost time on the technologi-
cal aspects of the multi-megawatt class of wind turbines, relying
on an R&D facility that employs some 200 people. Last year,
Sinovel installed its first 3-MW class wind turbines on the offshore
“Shanghai East Sea project” and a further thirty were being
shipped and certified. The company is banking on this technology
showcase to gain market share abroad as well as its well-proven
SL-1500 turbine.
Siemens on all frontsThe Siemens acquisition of Danish manufacturer Bonus just over
five years ago has paid off. Siemens Wind Power, which relocated
the company headquarters from Denmark to Hamburg in Ger-
many, forecasts sales of almost 3 billion euros in
2009 (2 935 million euros) which testifies to strong
growth over 2008 (2 092 million in sales). The com-
pany should have delivered 2 500 MW in 2009 as
against a little less than 2 000 in 2008. Its order
book is looking healthy as last year orders for at
least 1 225 wind turbines for a capacity of over
4 000 MW (onshore and offshore) were placed
with the German manufacturer. The company is in a perfect posi-
tion in the offshore market, which is due to skyrocket in the next
few years, and will rely on its 3.6-MW second generation offshore
wind turbine, the SWT-3.6-120 to succeed. The manufacturer’s
order book is well filled, with, for example, the supply of 140 units
of its SWT-3.6 MW-107 to the Greater Gabbard offshore farm, which
will be the biggest offshore wind farm ever built when it is com-
missioned in 2011. It will also equip the London Array offshore farm
with another 175 3.6-MW machines. Siemens is also very active in
3 billion €Siemens Wind Power
forecasts sales in 2009le chiffre d’affaires attendu
de Siemens Wind Power en 2009
Usine de production chinoise de la SL-1500 de Sinovel.
The Sinovel Chinese manufacturing unit for the SL-1500.
Sinovel

70
win
d e
ne
rg
y b
ar
om
ete
r
SYSTÈMES SOLAIRES le journal de l’éolien N° 6 – 2010
B A R O M È T R E É O L I E N – E U R O B S E R V ’ E R – M A R S 2 0 1 0
Sinovel en pleine ascensionL’ascension de l’industriel chinois est spec-
taculaire, portée il est vrai par la non moins
spectaculaire croissance de son marché
national. Selon le fabricant, Sinovel a livré
3300 MW en 2009, soit plus du double qu’en
2008. L’industriel fait de gros efforts en
termes de recherche et développement
pour combler son retard technologique sur
le segment des éoliennes de classe multi-
mégawatts. Il s’appuie pour cela sur un
centre de recherche et développement
employant quelque 200 personnes. L’an
dernier, Sinovel a installé ses premières
éoliennes de classe 3 MW sur le projet off-
shore “Shangaï East Sea project” et une
trentaine d’autres étaient en cours d’ex -
pédition et de certification. L’entreprise
compte sur cette vitrine technologique
pour gagner des parts de marché à l’étran-
ger. Sinovel peut également compter sur sa
turbine SL-1500 déjà largement éprouvée.
Siemens sur tous les frontsLe rachat par Siemens il y a un peu plus de
cinq ans du fabricant danois Bonus est une
réussite. Siemens Wind Power, qui a l’an
dernier déplacé le siège de l’entreprise du
Danemark à Hambourg en Allemagne, pré-
voit un chiffre d’affaires de près de 3 mil-
liards d’euros en 2009 (2 935 millions d’eu-
ros) en forte progression par rapport à 2008
(2 092 millions). L’entreprise devrait avoir
livré 2 500 MW en 2009 contre un peu moins
de 2 000 en 2008. Le carnet de commandes
de l’entreprise est bien garni puisque l’an
dernier le fabricant allemand a reçu des
commandes d’au moins 1 225 éoliennes
pour une puissance excédant les 4 000 MW
(terrestres et maritimes). L’entreprise est
parfaitement bien positionnée sur le mar-
ché de l’offshore qui va exploser ces pro-
chaines années. Il s’appuiera pour cela sur
sa deuxième génération d’éolienne off-
shore de 3,6 MW, la SWT-3.6-120. Il fournira
par exemple les 140
unités de sa SWT-3.6
MW-107 au parc off-
shore de Greater Gab-
bard, qui deviendra,
lors de sa mise en ser-
vice prévu en 2011, le
plus grand parc off-
shore jamais réalisé. Il
équipera également le parc offshore de
London Array avec 175 autres machines de
3,6 MW. L’entreprise est également très
active sur le marché terrestre. En sep-
tembre dernier, elle a décroché un contrat
avec la compagnie écossaise Airtricity pour
la livraison de 350 MW de turbines de classe
2,3 MW pour un parc situé à Clyde en
Écosse. Siemens a aussi renforcé sa pré-
sence aux États-Unis où il a ouvert une
deuxième usine, à Elgin dans l’Illinois (boîte
de vitesses et autres composants). Cette
usine nécessitera un investissement de 20
millions de dollars et emploiera 300 per-
sonnes. Siemens construit également sa
première usine d’assemblage sur le sol amé-
ricain. Elle sera située dans le centre-sud du
Kansas et délivrera chaque année 650
éoliennes de classe 2,3 MW. Siemens qui
bénéficiera d’une aide à l’implantation de
5 millions de dollars, investira 50 millions
de dollars et créera plus de 200 emplois.
L’entreprise dispose par ailleurs d’une usine
de production de pales dans l’Iowa. Sie-
mens, qui est présent sur tous les fronts,
investit également en Chine où il construit
une usine de 60 millions de dollars dans la
ville de Lingang, dans la partie est du port
de Shangaï. Cette usine assemblera les
nacelles et produira
des pales pour ses
éoliennes de 2,3 MW et
de 3,6 MW pour le mar-
ché national et inter-
national.
Sur le plan technolo-
gique, Siemens s’est
attaqué au monopole
d’Enercon en installant, dans la ville de
Brande au Danemark, un premier prototype
d’éolienne sans boîte de vitesses, la SWT-
3.0-101 DD (pour Direct Drive).
D’autres fabricants sont aussi très bien
représentés sur les marchés européen et
mondial. À l’instar de Sinovel, les fabricants
chinois, Goldwind et Donfgang, sont très
bien représentés sur leur marché national,
de même que l’industriel indien Suzlon,
également présent sur le marché améri-
cain. Suzlon profite également de la crois-
sance du fabricant allemand Repower, dont
il détient 91 % des parts. Ce dernier, présent
à la fois sur le marché terrestre et le mar-
ché offshore, a décroché en 2009 d’impor-
tants contrats, parmi lesquels une com-
mande de 954 MW (477 éoliennes MM82/92)
d’EDF Énergies Nouvelles et de RES Canada
pour des parcs destinés à être installés au
Québec entre 2011 et 2015. Repower est
également très actif sur le marché de l’off-
shore. Il développe actuellement une nou-
velle machine d’une puissance de 6,15 MW
basée sur la technologie de la Repower 5 M
déjà commercialisée. L’avenir de cette nou-
velle turbine est déjà assuré avec la signa-
ture, en février 2009, d’un accord avec
RWE Innogy portant sur la livraison de 250
éoliennes offshore. RWE Innogy a contrac-
tualisé en février 2010 la fourniture de 48
premières machines de 6,15 MW qui seront
installées sur le parc de Nordsee Ost (295
MW de puissance) entre 2011 et 2013.
Parmi les autres acteurs européens, on
peut citer Acciona Windpower qui dispose
de trois usines de production de turbines
d’une capacité de plus de 2 GW, deux en
Installation d’un prototypede la Repower 6 MW.
Installation of a Repower 6-M prototype
turbine.
© Repower
3 300 MWla puissance éolienne fournie
par Sinovel en 2009wind power capacity supplied
by Sinovel in 2009

the onshore wind farm market. Last September, it clinched a con-
tract with Scottish utility Airtricity for the delivery of 350 MW of
class 2.3-MW turbines for a wind farm in Clyde, Scotland. Siemens
has also underpinned its presence in the United States where it
has opened a second plant at Elgin, Illinois (gear boxes and other
components). The plant will be built at an investment of US$20 mil-
lions and employ 300 people. Siemens is
also constructing its first assembly plant
on American soil in the centre-south of
Kansas to deliver 650 class 2.3 MW wind tur-
bines per annum year. Siemens which will
take up US$5 million in inward investment
aid will invest US$50 million and create
over 200 jobs. Furthermore the company
has a blade manufacturing plant in Iowa.
Siemens, which is thus present on all fronts, is also investing in
China where it is constructing a factory at a cost of US$60 million
in the city of Lingang, in the East of Shanghai Port. The facility will
assemble nacelles and produce blades for its 2.3-MW and 3.6-MW
wind turbines for the national and international markets.
Turning to technology, Siemens has challenged Enercon’s
monopoly by installing a first gearbox-free wind turbine proto-
type, the SWT-3.0-101 DD (for Direct Drive) in the city of Brande in
Denmark.
71
ba
ro
mè
tre
éo
lie
n
SYSTÈMES SOLAIRES le journal de l’éolien N° 6 – 2010
B A R O M È T R E É O L I E N – E U R O B S E R V ’ E R – M A R S 2 0 1 0
Other manufacturers are also very well represented in the Euro-
pean and global markets. Like Sinovel, Chinese manufacturers
Goldwind and Donfgang, have a foothold in their domestic mar-
ket. The same applies to Indian manufacturer Suzlon, which is also
in the American market. Suzlon takes also advantage of the
growth of the German manufacturer Repower, in which it has a
91% share holding. The latter operates in
both the onshore and offshore markets
pulled off some major contracts in 2009
including an order for 954 MW (477 MM82/92
wind turbines) from EDF Énergies Nouvelles
and RES Canada for wind farms to be
installed in Québec between 2011 and 2015.
Repower is also highly active in the offshore
market and is currently developing a new
turbine with a capacity of 6.15 MW based on Repower 5M tech-
nology that is already in the market. This new turbine’s future is
already assured with the signing of an agreement with RWE
Innogy in February 2009, for the delivery of 250 offshore wind tur-
bines. In February 2010 RWE Innogy signed a contract for the sup-
ply of the first 48 6.15-MW turbines to be installed in the Nordsee
Ost farm (295 MW capacity) between 2011 and 2013.
Siemens has challenged Enercon’smonopoly by installing a first gearbox-free wind turbine prototype
Siemens s’est attaqué au monopoled’Enercon en installant un premier prototype d’éolienne sans boîte de vitesses
Deux techniciens assurent la maintenance d’une turbine
Siemens sur le parc de Lillgrund (Suède).
Two maintenance engineers working on a Siemens
turbine in the Lillgrund wind farm (off Sweden).
Siemens Pressebild/press photo

72
win
d e
ne
rg
y b
ar
om
ete
r
SYSTÈMES SOLAIRES le journal de l’éolien N° 6 – 2010
B A R O M È T R E É O L I E N – E U R O B S E R V ’ E R – M A R S 2 0 1 0
Ce baromètre a été réalisé parObserv’ER dans le cadre du projet“EurObserv’ER” regroupant Observ’ER(FR), ECN (NL), Eclareon (DE), Institutefor Renewable Energy (EC BREC I.E.O,PL), Jozef Stefan Institute (SL), avec le soutien financier de l’Ademe et de la DG Tren (programme “ÉnergieIntelligente-Europe”), et publié par Systèmes Solaires, Le Journal des Énergies Renouvelables. Le contenu de cette publication n’engage que la responsabilité de son auteur et ne représente pas l’opinion de la Communauté européenne. La Commission européenne n’est pas responsable de l’usage qui pourrait êtrefait des informations qui y figurent.
This barometer was prepared byObserv’ER in the scope of the “EurObserv’ER” Project which groupstogether Observ’ER (FR), ECN (NL),Eclareon (DE), Institute for Renewable Energy (EC BREC I.E.O, PL), Jozef Stefan Institute (SL), with the financial support of Ademe and DGTren (“Intelligent Energy-Europe” programme), and pu blished by Systèmes Solaires, Le Journal des Énergies Renouvelables. The soleresponsibility for the content of thispu blication lies with the authors. It does not represent the opinion of the European Communities. The European Commission is notresponsible for any use that may bemade of the information containedtherein.
Espagne et une aux États-Unis dans l’Iowa.
Acciona produit une turbine d’1,5 MW déjà
vendue à plus de 2 200 exemplaires et lan-
cera cette année sa première éolienne de
classe 3 MW, la 3-MW AW 1500. On peut éga-
lement citer le fabricant allemand Nordex,
particulièrement bien implanté sur le mar-
ché français où il a installé 715 MW durant
l’année 2009. Nordex est
aussi présent en Chine où
il produit des éoliennes
de classes 1,5 et 2,5 MW,
spécialement dédiées au
marché chinois. Il dispo-
sera prochainement de
capacité de production
aux États-Unis avec la construction d’une
première usine dans l’État de l’Arkansas.
Cette usine d’assemblage de nacelles, d’une
capacité de production de 750 MW, com-
mencera à produire dans la deuxième moi-
tié de l’année et sera complètement opéra-
tionnelle en 2012.
union européenne : plusde 11 000 mw attendus en2010
Malgré la crise, le marché éolien de l’Union
européenne a tenu toutes ses promesses
en établissant un nouveau record d’instal-
lations. Pour cette année, la croissance du
marché devrait rester positive malgré un
environnement financier toujours difficile.
Les principaux marchés européens bénéfi-
cient toujours de politiques de soutien très
actives renforcées par la prise de cons -
cience du grand public de la nécessité de
lutter contre les émissions de gaz à effet de
serre. Le marché pourra également s’ap-
puyer sur le décollage attendu de certains
marchés d’Europe centrale (Roumanie,
Pologne) et sur la connexion attendue de
plus de 1 GW offshore. Un autre élément
favorable est la diminution attendue du
coût des turbines, déjà amorcée en 2009 et
qui devrait s’accélérer en 2010. Cette dimi-
nution a été rendue possible par une baisse
importante du prix des matières premières
(le prix de l’acier a par exemple été divisé
par deux entre juillet 2008 et juillet 2009),
mais également du fait d’une présence plus
marquée sur le marché d’acheteurs dispo-
sant de grandes capacités financières,
comme les grandes compagnies d’électri-
cité. Ces acteurs sont en effet capables de
faire pression sur les prix en commandant
de grandes quantités de machines. Cette
diminution était attendue après plusieurs
années d’augmentation continue du prix
des machines (+ 40-50 % entre 2004 et 2008)
du fait de l’augmentation du prix des
matières premières et d’une demande con -
tinuellement supérieure à l’offre. Dans ces
conditions, EurObserv’ER maintient ses pré-
visions de croissance du
marché de l’Union euro-
péenne à 15 % pour 2010,
soit un parc cumulé de
l’ordre de 86 000 MW (gra-
phique 4).
À plus long terme, les pro-
fessionnels de la filière éolienne sont
encore plus optimistes. L’adoption de la
nouvelle directive européenne a conduit
l’EWEA à réévaluer ses objectifs pour
l’Union européenne en 2020. Dans sa publi-
cation “Pure Power” de décembre 2009,
l’EWEA estime réalisable à cette date une
puissance installée de 230 GW dont 40 GW
offshore, contre un objectif précédent de
180 GW. Cette puissance permettrait en
théorie de délivrer une production de 582
TWh (433 TWh terrestres et 148 TWh off-
shore), équivalent à la consommation
moyenne de 131 millions de foyers euro-
péens, et suffisante pour répondre à 14,2 %
de la demande d’électricité. 333 millions de
tonnes de CO2 pourraient ainsi être écono-
misées chaque année. Pour 2030, l’associa-
tion a réévalué ses objectifs de 300 GW à
400 GW dont 150 GW offshore. Cette puis-
sance correspondrait à la production de
1 155 TWh (592 TWh terrestres et 563 TWh
offshore), équivalent à la consommation
moyenne de 241 millions de foyers euro-
péens et répondant entre 26 et 34,7 % des
besoins en électricité des pays de l’Union
européenne. Elle éviterait le rejet dans l’at-
mosphère de 600 millions de tonnes de CO2
chaque année.
Cette croissance nécessitera à l’échelle
européenne des investissements colossaux
en matière d’infrastructures réseaux, non
seulement sur terre mais également en
mer. Le marché offshore, en relayant le mar-
ché terrestre, devrait permettre de dyna-
miser la croissance européenne. Une autre
publication de l’EWEA, “Oceans of oppor-
tunities”, estime à 100 GW la puissance des
parcs offshore existants ou en projets,
capable d’apporter 10 % de l’électricité
européenne et d’économiser 200 millions
de tonnes de CO2 chaque année. Selon l’as-
sociation, l’installation d’une telle puis-
sance nécessiterait la mise en place d’un
réseau paneuropéen interconnectant les
différents parcs en mer du Nord et en mer
Baltique. Un tel réseau permettrait aux
pays interconnectés d’augmenter leurs
capacités d’échange, améliorant la sécurité
de leur approvisionnement.
Ses objectifs peuvent paraître lointains
mais ils dépendront de décisions prises
dans les prochains mois. Ce sont en effet les
investissements réalisés dans les infra-
structures réseaux dans les prochaines
années qui détermineront le niveau de
croissance de l’éolien et sa contribution aux
objectifs de la nouvelle directive euro-
péenne.
230 GWle nouvel objectif de l’EWA
pour 2020EWA’s new target for 2020

Other European manufacturers worth mentioning include Acciona
Windpower which has three turbine manufacturing facilities with
over 2 GW of production capacity – two in Spain and the third in
Iowa in the US. Acciona produces and has already sold over 2 200
units of its 1.5-MW turbine and this year is to launch its first class
3 MW wind turbine, the 3-MW AW 1500. Then there is Nordex, the
German manufacturer, which has a strong foothold in the French
market where it installed 715 MW during 2009. Nordex is also pre-
sent in China where it manufactures the 1.5 and 2.5-MW class wind
turbines specifically for the Chinese market. It will shortly have
manufacturing capacity in the US with its first purpose-built facil-
ity in Arkansas. The nacelle assembly plant with 750 MW of pro-
duction capacity will come on stream in the second half of the year
and be fully operational in 2012.
eu – over 11 000 mw expected in 2010
Despite the economic crisis, the European Union wind power mar-
ket has kept all its promises by establishing a new record for
installations. Market growth should remain positive this year
despite the continuing difficult financial situation. The main Euro-
pean markets are still being very actively backed by the general
public’s awareness of the need to combat greenhouse gas emis-
sions. The market will also be able to rely on the expected take-
off a number of Central European markets (Romania and Poland)
and the expected grid connection of over 1 GW offshore. Another
promising factor is the expected decrease in the cost of turbines,
which started in 2009 and that should accelerate in 2010. This
reduction has been caused by a major decrease in raw materials
prices (for example the price of steel halved between July 2008 and
July 2009), and also because of the stronger presence of buyers
with major financial capacities on the market, such as the elec-
73
ba
ro
mè
tre
éo
lie
n
SYSTÈMES SOLAIRES le journal de l’éolien N° 6 – 2010
B A R O M È T R E É O L I E N – E U R O B S E R V ’ E R – M A R S 2 0 1 0
Le prochain baromètre traitera du photovoltaïque
The topic of the next barometer will be photovoltaic
tricity majors. These actors wield pressure on prices by ordering
turbines in large quantities. The reduction was expected after seve -
ral years of steadily increasing machine prices (up 40-50% between
2004 and 2008) because of the increase in raw materials prices and
demand constantly outstripping supply. Accordingly, EurObserv’ER
is sticking to its European Union market growth forecasts at 15%
for 2010, i.e. a cumulated base of around 86 000 MW (graph 4).
The industry is even more optimistic about its longer term
prospects. The adoption of the new European directive has made
EWEA reassess its goals for the European Union in 2020. In the
December 2009 issue of its “Pure Power” publication, EWEA esti-
mates that installed capacity of 230 GW including 40 GW of off-
shore is feasible by that date, as against its previous goal of 180
GW. This capacity would theoretically deliver 582 TWh (433 TWh
onshore and 148 TWh offshore), equivalent to the mean con-
sumption of 131 million European households, and sufficient to
meet 14.2% of the electricity demand, thus saving 333 million
tonnes of CO2 every year. The association has raised its goals for
2030 from 300 to 400 GW including 150 GW offshore which would
correspond to the production of 1 155 TWh (592 TWh onshore and
563 TWh offshore), to the mean consumption of 241 million Euro-
pean households and meet 26 to 34.7% of the European Union
member states’ electricity needs. It would annually avoid the
release of 600 million tonnes of CO2 into the atmosphere.
Growth of this magnitude will call for colossal investments at Euro-
pean scale in grid infrastructures, not only onshore but also off-
shore. By relaying the onshore market, the offshore market should
boost European growth. Another EWEA publication, “Oceans of
opportunities”, puts the capacity of existing or forthcoming offshore
wind farms at 100 GW, capable of providing 10% of Europe’s elec-
tricity and saving 200 million tonnes of CO2 every year. According
to the association, installation of this magnitude of capacity would
require the setting up of a pan-European grid interconnecting the
various wind farms in the North Sea and Baltic Sea. A grid of this
nature would enable the interconnected countries to increase their
exchange capacities, while enhancing the security of their supply.
These goals may appear a long way off but they will depend on
the decisions taken in the next few months. This is because the
investments made in grid infrastructure in the years to come will
determine the wind power growth rate and its contribution to the
new European directive’s goals.
Sources table2 : DEWI (Gemany), AEE (Spain), ANEV (Italy), ENEA (Italy), Ademe
(France), DECC (United kingdom), BWEA (United Kingdom), ENS (Denmark), WSH
(Netherlands), Svensk Vindenergi (Sweden), IWEA (Ireland), HWEA (Greece), IG Wind-
kraft (Austria), EC BREC I.E.O (Poland), APERE (Belgium), Hungarian Wind Energy
Association, Ministry of Industry and Trade (Czech Republic), Estonian Wind Power
Association, VTT ( Finland), WEC/Romanian National Committee, Jozef Stefan
Institut (Slovenia), EWEA, GWEC.
65 172
86 000
74 800
Livr
e b
lan
cW
hit
e P
ap
er
56 681
40 000
2007 2008 2009 2010
Graph. n° 4Comparaison de la tendance actuelle avec les objectifs du Livre blanc (en MW).Comparaison of the current trend with the White Paperobjectives (in MW)
Les décimales sont séparées par une virgule. Decimals are written with a comma.Source: EurObserv’ER 2010.