43101 santa ana
DESCRIPTION
TRANSCRIPT

Environment & Sustainability
J07.82.13.02 Revision Number 0
Bear Creek Mining Corporation
Feasibility Study Santa Ana Project Puno, Perú NI 43-101 Technical Report Prepared for: Bear Creek Mining Corporation 1050 – 625 Howe Street Vancouver, BC V6C 2T6 Canada
Prepared by: Ausenco Vector
Independent Mining Consultants, Inc. Resource Development Inc.
Report Date: 21 October 2010 Endorsed by QP: Scott Elfen, PE; John Marek, PE; Deepak Malhotra, PhD, Sean Currie, P.Eng., and Thomas Wohlford, CPG.

Rev: 0 Date: October 2010 J07.82.13.02: Feasibility Study – NI 43-101 Technical Report – Santa Ana Project
Contents
Environment & Sustainability 1
J07.82.13.02 Revision Number 0 1
Bear Creek Mining Corporation 1
Feasibility Study Santa Ana Project Puno, Perú NI 43-101 Technical Report 1
1 Summary 11.1 Introduction and Executive Summary 1
1.2 Property Description 2
1.3 Geology 2
1.4 Resources and Reserves 2
1.5 Mining Plan 3
1.6 Metallurgy 5
1.7 Processing 5
1.8 Infrastructure 6
1.9 Environmental, Permitting and Closure 7
1.10 Project Execution 7
1.11 Operating Cost Estimate 7
1.12 Capital Cost Estimate 8
1.13 Economic Analysis 8
1.14 Opportunities 9
1.14.1 Organic Growth 9
1.14.2 Exploration Upside 9
1.14.3 Enhanced Silver Recovery 9
1.14.4 Operating Cost Reductions 9
1.15 Conclusions & Recommendations 10
2 Introduction 112.1 Terms of Reference and Purpose of the Report 11
2.2 Project Team and Responsibilities 11
3 Reliance on Other Experts 14
4 Property Description and Location 15
5 Accessibility, Climate, Local Resources, Infrastructure and Physiography 175.1 Access 17
5.2 Climate 17
5.3 Local Resources 17

Rev: 0 Date: October 2010 J07.82.13.02: Feasibility Study – NI 43-101 Technical Report – Santa Ana Project
5.4 Infrastructure 17
5.5 Physiography 18
6 History 19
7 Geologic Setting 20
8 Deposit Types 21
9 Mineralization 229.1 General 22
9.2 SEM 22
10 Exploration 26
11 Drilling 27
12 Sampling Method and Approach 29
13 Sample Preparation, Analysis and Security 3013.1 Analytical Procedure 30
13.2 Quality Control Procedures (QA/QC) 30
13.3 Sample Security 31
14 Data Verification 3214.1 Review of the Incremental Data collected between March 2009 and June 2010 32
14.2 Certificate Check 32
14.3 Standards 33
14.4 Blanks 35
14.5 Pulp Check Assays 37
14.6 Half Core Duplicates Samples 44
15 Adjacent Properties 47
16 Mineral Processing and Metallurgical Testing 4816.1 Metallurgical Test Work 48
16.1.1 Metallurgical Testing – Phase I 48
16.1.1.1 Test Procedures 48
16.1.1.2 Test Results and Conclusions 48
16.1.2 Metallurgical Testing – Phase II 49
16.1.2.1 Bottle Roll Tests 49
16.1.2.2 Column Tests 49
16.1.2.3 Cyanide Amenability Tests (Shaker) 50
16.1.3 Metallurgical Testing – Phase III 51
16.1.3.1 Sample Selection 51
16.1.3.2 Bottle Roll Tests 53
16.1.3.3 Column Leach Tests 53

Rev: 0 Date: October 2010 J07.82.13.02: Feasibility Study – NI 43-101 Technical Report – Santa Ana Project
16.1.3.4 Comminution Testing 56
16.1.4 Process Selection 56
16.2 Silver and Gold Recovery 56
17 Mineral Resources and Mineral Reserve Estimates 5717.1 Block Model 57
17.1.1 Data Base 57
17.1.2 Rock Type and Estimation Boundaries 58
17.1.3 Density Assignment 60
17.1.4 Block Grade Estimation 60
17.1.5 Bottom Limit 63
17.1.6 Classification 63
17.2 Mineral Resources and Mineral Reserves 63
17.2.1 Mineral Reserves 64
17.3 Mineral Resources 68
18 Other Relevant Data and Information 70
19 Interpretations and Conclusions 71
20 Recommendations 72
21 References 73
22 Date and Certificates of Authors 75
23 Additional Requirements for Technical Reports on Development Properties 8223.1 Mining 82
23.1.1 Summary 82
23.1.2 Introduction 82
23.1.3 Project Production Rate Consideration 84
23.1.4 Economic Pit Limits 84
23.1.5 Phase Designs 88
23.1.6 Mine Plan and Production Schedules 91
23.1.6.1 Description of the Schedule 93
23.1.6.2 Alternative Mine Schedules 105
23.1.7 Waste and Stockpile Storage 107
23.1.8 Mine Operations and Equipment 108
23.2 Mineral Processing 112
23.2.1 Flowsheets 112
23.2.2 Mass Balance 112
23.2.3 Piping and Instrumentation 112

Rev: 0 Date: October 2010 J07.82.13.02: Feasibility Study – NI 43-101 Technical Report – Santa Ana Project
23.2.4 Production Plan 112
23.2.5 Process Description 112
23.2.5.1 Crushing 113
23.2.6 Ore Transport 115
23.2.7 Irrigation System 115
23.2.8 Leaching 115
23.2.8.1 Cyanide Solution Pumping 115
23.2.8.2 Pregnant Solution Collection 115
23.2.8.3 Pregnant Solution Pumping 115
23.2.9 Merrill-Crowe Plant 116
23.2.9.1 Clarification 116
23.2.9.2 Deaeration 116
23.2.9.3 Precipitation 118
23.2.10 Smelting Process 118
23.2.10.1 Retorting 118
23.2.10.2 Smelting 119
23.2.11 Chemical Reagents 119
23.2.11.1 Lime Addition 119
23.2.11.2 Sodium Hydroxide 119
23.2.11.3 Sodium Cyanide 120
23.2.11.4 Antiscalant 120
23.2.11.5 Lead Nitrate 120
23.2.11.6 Zinc Dust 120
23.2.11.7 Precoat 120
23.2.11.8 Body Feed 120
23.2.11.9 Hydrogen Peroxide 120
23.2.11.10 Copper Sulphate 121
23.2.11.11 Reagent Requirements 121
23.3 Infrastructure 121
23.3.1 Power 121
23.3.2 Access Road 122
23.3.2.1 Mine Access Road 122
23.3.2.2 Main Haul Road 122
23.3.2.3 Auxiliary Access Road 122
23.3.2.4 Diversion Access Road 122

Rev: 0 Date: October 2010 J07.82.13.02: Feasibility Study – NI 43-101 Technical Report – Santa Ana Project
23.4 Geotechnical 123
23.4.1 Geotechnical Units 123
23.4.2 Piezometric Level 124
23.4.3 Foundation Level 124
23.4.4 Open Pit / Pit Slopes 125
23.4.5 Heap Leach Facility Construction 126
23.4.5.1 Design Criteria and Approach 127
23.4.5.2 Leach Pad Materials Description 127
23.4.5.3 Underdrain System 129
23.4.5.4 Liner System 129
23.4.5.5 Solution Collection System 129
23.4.6 Process Ponds Construction 129
23.4.6.1 Design Criteria and Approach 130
23.4.6.2 Process Ponds Materials Description 131
23.4.6.3 Underdrain System 131
23.4.6.4 Liner System 131
23.4.7 Waste Rock Facility Construction 131
23.4.7.1 Design Criteria and Approach 132
23.4.7.2 Waste Rock Facility Material Descriptions 133
23.4.7.3 Underdrain System 133
23.4.8 Seismicity and Seismic Hazards 133
23.4.9 Instrumentation and Monitoring 134
23.5 Markets 134
23.6 Environmental Considerations and Permitting 136
23.7 Health, Safety, Environment and Community 136
23.7.1 Hydrogeological Evaluation 136
23.7.1.1 Field Investigations 136
23.7.1.2 Conceptual Hydrogeological Model 137
23.7.1.3 Simulation of Groundwater Inflow to Proposed Open-Pit Areas 137
23.7.2 Water Supply 137
23.7.2.1 Water Well Fields 137
23.7.2.2 Water Pipeline 138
23.7.3 Waste Geochemistry 138
23.7.3.1 Sampling 138
23.7.3.2 Results 139

Rev: 0 Date: October 2010 J07.82.13.02: Feasibility Study – NI 43-101 Technical Report – Santa Ana Project
23.7.3.3 Conclusions 139
23.7.4 Closure 139
23.7.4.1 Reclamation and Closure by Facility 140
23.7.4.2 Post Closure 141
23.7.4.2.1 Maintenance 141
23.7.4.2.2 Monitoring 141
23.8 Project Execution 141
23.9 Economic Analysis 142
23.9.1 Economic Model 142
23.9.1.1 General Criteria 142
23.9.1.2 Mine and Process Production 142
23.9.1.3 Average LoM Operating Costs 143
23.9.1.4 Capital Cost Summary 144
23.9.1.5 Sustaining Cost Summary 144
23.9.1.6 Working Capital 146
23.9.1.7 Base Case Analysis 146
23.9.1.8 Sensitivity Analysis to Base Case 147
23.9.1.9 Economic Model 148
23.9.2 Taxes and Royalties 150
23.10 Opportunities 150
23.10.1 Finer Crushing 150
23.10.2 Northern Extension 151
23.10.3 Longer Mine Life 153
23.10.4 Deep Potential 153
24 Illustrations 154
Tables
Table 1.1 Reserve and Resource Estimate 3
Table 1.2 Key Project Assumptions 4
Table 1.3 Annual Crusher Feed (tonnes and grade) 4
Table 1.4 Capital Cost Summary 8
Table 1.5 Cost Sensitivities 9

Rev: 0 Date: October 2010 J07.82.13.02: Feasibility Study – NI 43-101 Technical Report – Santa Ana Project
Table 2.1 Santa Ana Responsibility Matrix 12
Table 4.1 Santa Ana Project Mining Concessions 15
Table 14.1 Half Core Questionable Intervals 44
Table 16.1 Phase I Metallurgical Test Results 48
Table 16.2 Santa Ana Core Composites, Phase II Bottle Roll Test Results 49
Table 16.3 Santa Ana Core Composites, Phase II Column Test Results 50
Table 16.4 Santa Ana Core Composites, All Shaker Test Results 50
Table 16.5 Phase III Master Composite Description 51
Table 16.6 Phase III Bottle Roll Test Results 53
Table 16.7 Phase III Column Test Results 54
Table 16.8 Phase III Column Test Reagent Consumptions 54
Table 17.1 Santa Ana Block Model Parameters 57
Table 17.2 Kriging Parameters for Silver and Zinc Indicator Grade Breaks 61
Table 17.3 Kriging Parameters for Block Grade Estimation 62
Table 17.4 Inverse Distance Estimation for Bottom Limit of Grades 63
Table 17.5 Santa Ana Floating Cone Input Data 65
Table 17.6 Mine Production Schedule, Santa Ana Feasibility Study 67
Table 17.7 Process Schedule with Stockpile Reclaim 68
Table 17.8 Mineral Reserves and Mineral Resources 69
Table 23.1A Mine Production Schedule 83
Table 23.2A Production Schedule for Potential Low Tonnage Pit 105
Table 23.3A Production Schedule for Potential Large Tonnage Pit 106
Table 23.4 Mine Major Equipment Fleets for Development of Contractor Costs 110
Table 23.5 Contractor Manpower Requirements 111
Table 23.6 Retorting Process 119
Table 23.7 Primary Reagent Consumption 121
Table 23.8 Dore Transport and Refining Costs 136
Table 23.9 Project Development Plan 142
Table 23.10 General Model Criteria 142
Table 23.12 Operating Cost 143
Table 23.13 Capital Cost Summary 144
Table 23.14 Sustaining Cost 145
Table 23.15 Base Case Sensitivities 146
Table 23.16 Silver Price Sensitivities 147
Table 23.17 Capital Cost and Operating Cost Sensitivities 147

Rev: 0 Date: October 2010 J07.82.13.02: Feasibility Study – NI 43-101 Technical Report – Santa Ana Project
Table 23.18 Sensitivities on Recovery 147
Table 23.19 Base Case Financial Cash Flow 149
Table 23.20 Northern Extension Drilling 152
Figures
Figure 1.1 Mine Schedule Summary 5
Figure 4.1 Location Map of Santa Ana 16
Figure 9.1 Thickness of 20g/t Silver, Contours on 30, 50, 100 m 23
Figure 9.2 East-West Section at 8,157,700N, Silver Grades 15, 45, 100, 200 g/t 24
Figure 9.3 East-West Section at 8,158,300N, Silver Grades 15, 45, 100, 200 g/t 25
Figure 11.1 Drillhole Location Map 28
Figure 14.1 2006, 2007 and 2008 Assay Standards Greater than 1.0 g/t 34
Figure 14.2 2009 and 2010 Assay Standards Greater than 1.0 g/t 35
Figure 14.3 Results of Sep-2010 Blanks from RockLabs Standards 37
Figure 14.4A XY Plot 2009 Data, ALS- Chemex Silver vs. Inspectorate Silver Check 38
Figure 14.5A XY Plot 2010 Data, ALS-Chemex Silver vs. Inspectorate Silver Check 40
Figure 14.6 XY Plot, ALS-Chemex Zinc vs. Inspectorate Zinc Check 42
Figure 14.7 XY Plot, ALS-Chemex Lead vs. Inspectorate Lead Check 43
Figure 14.8A XY Plot of Half Core Duplicates 45
Figure 16.1 Master Composite Sample Location Map 52
Figure 16.2 Column Test Recovery vs. Time 55
Figure 17.1 Illustration of Zone Codes, 3990 Elevation 59
Figure 17.2 Final Pit Configuration 66
Figure 23.1 Floating Cone Guide to Final Pit Design (at $13.00 Ag) 86
Figure 23.2 Nested Cones on the 4200 Level 87
Figure 23.3 Ultimate Pit Configuration 89
Figure 23.4 Pit Phase at the 4200 m Bench 90
Figure 23.5 Graphic Summary Mine Production Schedule 92
Figure 23.6 Phase Open Pit at the End of Preproduction 94
Figure 23.7 Phase Open Pit End Year 1 95
Figure 23.8 Phase Open Pit End Year 2 96
Figure 23.9 Phase Open Pit End Year 3 97
Figure 23.10 Phase Open Pit End Year 4 98

Rev: 0 Date: October 2010 J07.82.13.02: Feasibility Study – NI 43-101 Technical Report – Santa Ana Project
Figure 23.11 Phased Open pit End Year 5 99
Figure 23.12 Phase Open Pit End Year 6 100
Figure 23.13 Phase Open Pit End Year 7 101
Figure 23.14 Phase Open Pit End Year 8 102
Figure 23.15 Phase Open Pit End Year 9 103
Figure 23.16 Phase Open Pit End Year 10 104
Figure 23.17 Santa Ana Heap Crushing Flowsheet 114
Figure 23.18 Process Flowsheet 117
Figure 23.19 Access Roads General Layout 123
Figure 23.20 Santa Ana's Heap Leach Pad First Stage Layout 126
Figure 23.21 Santa Ana's Leach Pad Ultimate Phase Layout 128
Figure 23.22 Santa Ana's Process Ponds Layout 130
Figure 23.23 Santa Ana's Waste Rock Facility Layout 132
Figure 23.24 NPV Sensitivity Analysis 148
Figure 23.25 IRR Sensitivity Analysis 148
Figure 23.26 Silver Recovery vs. Ore Grain Size 151
Figure 23.27 Northern Drilling Location Map 152
Figure 23.28 Current Mine Plan Production vs. Extended Life Alternate Plan 153

Rev: 0 Date: October 2010 J07.82.13.02: Feasibility Study – NI 43-101 Technical Report – Santa Ana Project 1
1 Summary This Technical Report summarizes the results of an updated resource determination and a Feasibility Study (FS) for the Santa Ana Silver Project in Peru. This work was completed by three engineering companies working as a team on behalf of Bear Creek Mining Corporation (Bear Creek). The three companies and their responsibilities are as follows:
• Ausenco Vector (Vector) provided design and cost estimation for the process plant, heap leach facilities and all infrastructure items required for project development. Vector also assembled the cash flow analysis of the FS, and acted as the primary author of this Technical Report. The preparation of this report and analysis of the data are the responsibility of Vector except for those areas listed below which were performed by IMC and RDI;
• Independent Mining Consultants, Inc. (IMC) developed the estimated reserves and resources, mine plan, and mining costs for the FS. IMC also supervised the parts of the reports dealing with geology and sampling; and
• Resource Development, Inc. (RDI) was responsible for review and interpretation of the process test results, development of the flow sheet, development of the process design criteria and the quantity of the consumable items in the process plant.
1.1 Introduction and Executive Summary The results of the Feasibility Study are as follows:
• The Santa Ana project can be in production within the second half of 2012;
• Proven and Probable Mineral Reserves containing 63.2 million ounces of silver are currently defined at Santa Ana;
• Santa Ana Project pre-tax NPV of $85.3 million at a 5% discount rate and IRR of 25.3% at $14.50 per ounce silver. After tax net present value of $66.5 million and IRR 21.8%;
• 11 year mine life producing 44.2 million ounces of silver;
• Average annual saleable silver production of 4.6 million ounces per year for the first 6 years;
• Cash cost of $9.02 per ounce silver for the 11 years LOM;
• Capital costs of $68.8 million with Capital Payback in 3.4 years at $14.50/oz Ag;
• At $22.92 per ounce silver (London Silver spot price fix from October 6, 2010), the project would have a pre-tax IRR of 70.2% and an NPV at 5% of $341 million. On an after tax basis the IRR would be 52.6% and NPV $232 million;
• At silver prices of $22.92 per ounce, free cash flow estimated at $46 million per year for the first 6 years with a 1.4 year pay back;
• Numerous upside opportunities are being explored including increase of silver recovery, reductions in cash costs, and an extended mine life plan to include an additional 35.7 million ounces of silver; and
• The Santa Ana deposit remains open, mainly at depth and to the north where the northernmost holes contain up to 22 meters @ 124 g/t Ag from surface.

Rev: 0 Date: October 2010 J07.82.13.02: Feasibility Study – NI 43-101 Technical Report – Santa Ana Project 2
1.2 Property Description The Santa Ana Project is located about 120 km south-southeast of the city of Puno, in southern Peru. The elevation in the deposit area varies from 4150 to 4300 meters. The deposit contains silver, zinc and lead mineralization. Zinc and lead mineralization is not currently considered to be economic because it is not recovered in the heap leach processing method utilized in this FS. This report focuses on the evaluation of the economic recovery of silver.
The deposit outcrops and is roughly 1.5 km long in the north-south orientation and approximately 0.75 wide in the east-west orientation. The deposit is best described as a high-level, low-temperature epithermal polymetallic silver deposit hosted within volcanic units. Bear Creek controls 5400 hectares of mineral concessions that encompass the Santa Project through claims held 100% by Bear Creek.
1.3 Geology The Santa Ana property occupies a broad volcanic upland that lies between extensive exposures of thin-bedded grey lithic sandstones and red beds that underlie the volcanics to the north and south. The central and western portion of the upland is occupied by a sequence of fine-grained andesite flows that strike generally north and dip to the west at angles ranging from 15° to 45°. To the west, these flows are capped by coarse-grained dacitic porphyry that is, in turn, overlain unconformably by a thick sequence of dacitic volcanoclastic rocks. The andesite flows are the mineral hosts.
Earlier descriptions of the mineralization described a northern Anomaly A and a southerly Anomaly B. Drilling has connected these zones so that they represent major structural orientations that contain continuous mineralization.
The sandstones exposed to the north and south likely underlie the host volcanic field. Total thickness of the volcanic package is not well known.
1.4 Resources and Reserves The mineral resource is based on a block model developed by IMC and a floating cone pit geometry that was used to assure that the resource has reasonable expectation of economic extraction. The FS and the reserve and resources are based on an updated resource estimation described in a press release dated 7 October 2010. The mine sequencing performed as part of this FS by IMC is based upon 60,458 meters of drilling and assays in 349 diamond drillholes and trenches completed through June 2010. Measured and Indicated Resources contained within the Feasibility Study design pit were used to determine final pit limits and thus converted respectively into Proven and Probable Reserves. In addition to reserves, 72.8 million ounces of silver remain in measured and indicated resources occurring outside of the Feasibility Study pit. Table 1.1 presents the reserves and resources of the Santa Ana project.

Rev: 0 Date: October 2010 J07.82.13.02: Feasibility Study – NI 43-101 Technical Report – Santa Ana Project 3
Table 1.1 Reserve and Resource Estimate
Mineral Reserves (Cut-off Grade variable 27 to 24 g/t silver by year)
Category kt Silver (g/t)
Lead (%)
Zinc (%)
Contained Silver
(million oz.) Proven 8,951 57.6 0.37 0.66 16.6 Probable 28,126 51.5 0.33 0.55 46.6 Proven+Probable 37,077 53.0 0.34 0.58 63.2 Mineral Resources in Addition to Reserves (Cut-off Grade = 15 g/t Silver) Measured 13,386 34.6 0.30 0.51 14.9 Indicated 51,337 35.1 0.30 0.50 57.9 Measured+Indictated 64,723 35.0 0.30 0.50 72.8 Inferred 21,632 40.6 0.32 0.49 28.2
Note: no lead and zinc will be recovered.
1.5 Mining Plan The Santa Ana deposit lends itself to development by conventional open pit hard rock mining techniques. Consequently, a floating cone computer algorithm was applied to the block model to establish the mineral resource component of the block model. Economic value was applied to silver only with a metal sales price of $13.00/troy oz. resulting in a variable cut-off grade of between 24 and 27 g/t silver. No economic consideration has been applied to lead or zinc; however, a slight benefit is realized through by-product gold recovery.
The mining plan was developed by IMC. The mine plan was developed using conventional open pit methods using 63t trucks and 8.6 m3 wheel loaders mining on 5 m high benches. The mine requires minimal pre-production waste stripping of 2.97 million tonnes. During the life of the project the overall stripping ratio will 1.96:1 (Waste:Ore). For the first nine and a half years of the operation, ore will be directly shipped from the pit to the crusher where the trucks will dump the ore directly into the crushing system. After crushing the ore will be loaded using an automated conveyor loading system and then be hauled to the heap leach where the ore will be placed in cells and leached using weak cyanide solution. In addition to the direct dump ore, the mining plan calls for a low-grade stockpile to be built up in the first 5 years of the mining. The low-grade stockpile will contain 2,964 kt of ore having an average grade of 29.9 g/t. The low-grade stockpile will be fed through the crusher once the main mining activity has ceased. Waste will be hauled to a single waste storage facility located approximately 1 km southwest of the pit.
The plan for the operation of the mine is to use a contract miner. IMC developed mining costs of $1.68 per tonne of material mined (ore and waste) and $0.71 per tonne for the rehandling of the crushed ore onto the heap leach. Separate budgetary quotes were received from local mining contractors and closely matched the detailed estimate prepared by IMC.
Table 1.2 indicates key assumptions used in the development of the FS.

Rev: 0 Date: October 2010 J07.82.13.02: Feasibility Study – NI 43-101 Technical Report – Santa Ana Project 4
Table 1.2 Key Project Assumptions
Item Description Value Annual Ore Production (Year 1 to end of mine life) 3,600,000 tonnes
Overall Process Recovery – Silver 70 percent Total Processed Material 37,077,000 t Average Silver Grade 53.0 g/t Recovered Silver 44.2 million oz. Overall stripping ratio 1.96:1 Life of mine (mining only) 9.5 years Life of mine (processing) 11.2 years
Table 1.3 presents annual tonnes and grade of the ore fed to the crusher and placed on the heap leach.
Table 1.3 Annual Crusher Feed (tonnes and grade)
Time kt Silver Grade (g/t)
Year 1 3,600 58.4 Year 2 3,600 60.5 Year 3 3,600 59.1 Year 4 3,600 57.6 Year 5 3,600 59.0 Year 6 3,600 55.6 Year 7 3,600 53.1 Year 8 3,600 49.7 Year 9 3,600 47.0
Year 10 3,600 37.0 Year 11 1,077 29.9
Total 37,077 53.0
Figure 1.1 illustrates the variation in the tonnes of the different material moved by year.

Rev: 0 Date: October 2010 J07.82.13.02: Feasibility Study – NI 43-101 Technical Report – Santa Ana Project 5
Figure 1.1 Mine Schedule Summary
1.6 Metallurgy Six column leach test have been completed at McClelland Labs and over one-hundred leach amenability tests. The results have consistently demonstrated that the Santa Ana ore responds well to conventional heap leaching techniques. The overall recovery is expected to be 70% silver for minus ¾-inch crushed material. More recent column tests indicate that further improvements in recovery to 75 percent silver can be achieved by crushing the ore to minus 3/8-inch. McClelland Laboratories is currently performing a column test on minus 3/8-inch crushed material and the Company will release the results when this long-term test is finished. Initial results strongly indicate an improvement in recovery and acceleration of the silver leaching.
1.7 Processing Santa Ana is an epithermal polymetallic deposit hosted within volcanic rocks with significant quantities of primary silver. Considering its proximity to the surface, the ore will be mined in an open pit operation.
The main operations are blasting, ore transportation to the crushing plant which will comprise two crushing stages and one classification stage, heap leaching and recovery by Merrill-Crowe extraction.

Rev: 0 Date: October 2010 J07.82.13.02: Feasibility Study – NI 43-101 Technical Report – Santa Ana Project 6
The crushed ore, 80 percent passing 19mm (¾-inch) will be conveyed to the coarse ore stockpile with a live capacity of approximately 6 hrs. The reclaim system will consist of one fixed conveyor stockpile to withdraw material from the stockpile and deliver onto trucks. Trucks will be used to transport the ore from the crushed ore stockpile to the heap leach pad. A sodium cyanide solution will be irrigated on the heap to dissolve silver minerals and the pregnant solution will be sent to the Merrill-Crowe plant to produce a silver-zinc precipitate, which will be smelted to produce a Dore bar containing mainly silver.
The operation will treat 10,000 tpd and the estimated life of mine is 11.3 years. The design considers a heap leaching process and the average silver content is 53 g/t. The metallurgical recovery of silver by the leaching process is 70% with a 360 day leach recovery cycle. The leach cycle is divided into a 120 day primary leach and a 240 day secondary leach occurring in the lower levels of the heap.
The estimated monthly production is 306,255 ounces of silver.
The Merrill-Crowe plant was designed to treat 571 m3/hr of pregnant solution in order to assure the production mentioned above. The design includes an effluent detoxification plant to treat 120 m3/hr of solution with low cyanide content. This detoxification plant will only operate under special circumstances such as excess of barren solution produced during the rainy season.
The estimated installed power is 3,547 kW, the maximum draw power is 1,683 kW and the estimated critical consumption is 1,445 kW. The estimated power consumption is 1,132,027 kW-hr per month. Emergency backup will be provided by diesel generators of 1,500 kW of continuous service at 4,000 meters above sea level. This equipment will assure the operation of equipment critical to the metallurgical process.
The requirement of water for the operation is approximately 3.86 litres per second during the first year of operation. If the leaching operation starts in the dry season (May to September), the requirement of water will be higher. The opposite will occur during the wet season (November to April). At the start of operations, the storm water pond should contain no less than 42,000 m3 of water. When the rainy season starts, it will be important to collect the rain water through the leach pad.
The estimated direct cost of the investment for processing is US$ 12,359,000 million and the indirect cost is US$ 2,740,000 million. The total cost of the investment (Capex) is US$ 15,009,000 million. The details of the capital cost estimate are presented in Section 23.9. The estimated operating cost of the process is 2.644 dollars per tonne of ore processed or 1.186 dollars per ounce of silver. The details of the operating cost estimate are presented in Section 23.9.
1.8 Infrastructure The project has favourable infrastructure. Access will be via a good 8 km gravel road that will be a combination of a new and improved roads requiring mostly upgrading. The new road will connect to the existing paved highway connecting the Bolivian border to the port of Ilo, Peru. The mine is 42 km from an electrical substation at Pomata and the project includes building a transmission line to the mine. The project has an excellent site for the heap leach pad resulting in a low capital and operating cost as the plant will be located immediately adjacent to the heap leach pad and ponds. The site is close to a very large alluvial aquifer that is replenished by a flowing river in the valley; wells have been drilled in the aquifer and sufficient water is available to provide water for the mine’s needs. Steps are being taken to acquire the necessary permits for water use. A 12 km pipeline from the wells to the mine will be built to transport the water.

Rev: 0 Date: October 2010 J07.82.13.02: Feasibility Study – NI 43-101 Technical Report – Santa Ana Project 7
1.9 Environmental, Permitting and Closure The project has been designed to meet industry standards of environmental compliance. The heap leach and solution ponds have been designed industry standards of containment and stability. The waste rock storage facilities are designed to capture and manage any flows that may originate from the waste rock. Finally an initial closure plan has been developed that will provide covers the both the heap leach and waste rock facilities that will result in safe and environmentally compliant closure of the mine. The lab tests on spent ore and waste rock have shown that the site has a very low potential to produce acid rock drainage (ARD).
The Company is currently advancing the permitting process and expects to submit the Environmental and Social Impact Assessment (ESIA) to the Peruvian authorities before the end of 2010. All additional necessary permitting will be processed once the ESIA has been approved by the national government.
The Company has maintained good working relationships with the local communities.
1.10 Project Execution The project is expected to be developed into a mine over the next 24 months. The figure below illustrates the major parts of the development plan. First the company expects to present the ESIA to the Peruvian authorities prior to the end of 2010. There will then be a period of review by the government that is expected to last 6 to 9 months. In late 2010 and early 2011, the detailed project engineering is expected to commence and is estimated to be completed in approximately 9 months. Following ESIA approval the Company is expected to advance the permitting process by obtaining the necessary construction and operating permits. In late 2011, once the proper permits are obtained, the principal off-site project infrastructure is expected to be developed. This will include the power line, the upgrading of the access road, the construction of the water supply pipeline and drilling of any additional production water wells. Any temporary construction housing will be installed in preparation for the on-site construction. Finally, the onsite construction is expected to start in the 2nd quarter of 2012, or earlier depending on the end of the rainy season and continue through the dry season. Commercial production is expected to start in early part of the fourth quarter of 2012, or earlier if the rainy season permits liner installation sooner.
Item / Period Q4 2010
Q1 2011
Q2 2011
Q3 2011
Q4 2011
Q1 2012
Q2 2012
Q3 2012
Q4 2012
ESIA Review
Detailed Engineering
Permitting
Off-site Infrastructure Construction
Site Development
Production
1.11 Operating Cost Estimate Mining costs were prepared on a year-by-year basis with costs varying mostly due to changing haulage distances. The life-of-mine average mining costs will be $1.68 per tonne of the total material moved. The cost for hauling and placing ore on the pad will be $0.71 per tonne. The process costs are estimated to be $3.19 per tonne of processed ore and the G&A is estimated to be $1.17 per processed tonne or $4.2 million per year. The average life-of-mine, on site operating cost

Rev: 0 Date: October 2010 J07.82.13.02: Feasibility Study – NI 43-101 Technical Report – Santa Ana Project 8
per ounce of silver will be $8.35. Including refining charges, doré transport and Peruvian production royalties, the average cash cost per ounce will be $9.02.
1.12 Capital Cost Estimate The project capital cost estimate has been prepared by two independent engineering companies. The mining costs were prepared by Independent Mining Consultants of Tucson, Arizona, and the process heap leach and infrastructure costs have been prepared by Ausenco Vector of Peru. The initial start up capital is estimated to be $68.8 million and the total life of mine capital cost is estimated to be $83.8 million. The initial capital equates to $1.56 per ounce of silver recovered. The life of mine capital costs used in the financial model includes detailed long-term plans for heap leach expansions as well as ongoing mine closure and monitoring. Sustaining capital expenditures are estimated at an average $1.4 million per year over the 11-year life of the mine.
Tabulated below are the Capital costs for each of the principal areas.
Table 1.4 Capital Cost Summary
Item Cost Civil Works $13,598,000 Water Supply $3,215,000 Process Plant $15,099,000 Auxiliary Facilities $5,859,000 Water Distribution $2,403,000 Electrical (LT & Distribution) $9,709,000 Crusher System $4,763,000 Preproduction Mine Development & Equipment $9,909,000 Owners Costs $4,226,000 Total Initial Capital $68,781,000
The estimates of the Capital Costs have been prepared to a feasibility level with a 15% contingency applied to the estimates. An additional 15% has been added for Engineering Procurement and Construction Management (EPCM).
1.13 Economic Analysis The project has a pre-tax internal rate of return (IRR) of 25.3%, a net present value of $85.3 million at a 5% discount rate and earnings before interest, taxes, depreciation and amortization (EBITDA) of $144 million over the 11-year life based upon $14.50 per ounce silver. Recovered silver production in the first six years averages 4.6 million ounces per year and the project is expected to produce an average of 4.0 million payable ounces of silver per year over the 11-year mine-life. Based upon a $14.50 silver price, the project achieves payback of capital in approximately 3.4 years. The Feasibility Study has been prepared using cost bids and estimates and production forecasts provided by qualified engineering consulting groups who have recent bids and cost structure experience relating to various Peruvian mining projects under development.
The project is sensitive to metal price and recovery. Additionally, given that the cash costs per ounce are $9.02 per ounce of silver, the project is also sensitive to variations in operating costs.

Rev: 0 Date: October 2010 J07.82.13.02: Feasibility Study – NI 43-101 Technical Report – Santa Ana Project 9
The project is least sensitive to capital cost variations and this can be explained by the relatively low cost of $1.56 per produced ounce for the initial capital.
Sensitivities to various parameters are summarized below:
Table 1.5 Cost Sensitivities
Case IRR NPV @ 5% NPV @ 0% Base Case 25% $85.3M $143.6M Recovery +10% 34% $127.4M $203.5M Recovery -10% 16% $43.1M $83.5M Metal Price +10% 34% $129.4M $206.5M Metal Price -10% 16% $41.0M $80.5M Initial Capital Cost +10% 23% $79.0M $136.7M Initial Capital Cost -10% 28% $91.6M $150.5M Operating Cost +10% 20% $59.1M $106.6M Operating Cost -10% 31% $111.5M $180.5M Metal Prices Oct. 6, 2010 - $22.92/oz Ag 70% $341.1M $508.0M
Note: Base case price is $14.50/oz Silver; London Silver spot price fix from October 6, 2010 = $22.92/oz Ag .All values are pre-tax.
1.14 Opportunities The study has identified areas of opportunities that will be analysed immediately in detailed engineering, column leach test work and future exploration:
1.14.1 Organic Growth The Feasibility Study leaves 36 million ounces of measured and indicated silver resources in either stockpiles or pit walls that can lead to expanded mine life on the order of 50%. Relatively minor additional capital will be required in order to increase the size of the heap leach pad and waste dump sites for which there is ample area for expansions (see Sections 23.4.5 and 23.12.3).
1.14.2 Exploration Upside The deposit is still open at depth, to the north and northwest, and the “North” anomaly is under-explored.
1.14.3 Enhanced Silver Recovery Analysis of the recently completed column leach studies indicates that higher recoveries are likely with a slightly finer crush size. At 80% passing 3/8 inch crush size the anticipated recovery is 75% of the silver and initial results from test work indicate the speed of silver recovery is greatly improved.
1.14.4 Operating Cost Reductions The project is sensitive to operating costs. The Company and its consultants believe that, once the project is in operation, many of the reagent consumption levels used in the Feasibility Study will be reduced with a beneficial effect on the operating costs. Additionally, assuming that a finer crush size is chosen, there is potential to reduce the cash costs by $0.30 to $0.40 per ounce resulting from

Rev: 0 Date: October 2010 J07.82.13.02: Feasibility Study – NI 43-101 Technical Report – Santa Ana Project 10
accelerated silver leaching rates and increased recoveries. Details of the finer crushing potentials are provided in Section 23.10.1.
1.15 Conclusions & Recommendations This Report recommends proceeding with detailed engineering and permitting based on:
• Positive economics with excellent exposure to up-side silver prices;
• Well-defined resources open to expansion and potential conversion to reserves;
• Favourable infrastructure; heap leach, power and access;
• Available local water supply;
• Well-defined permitting path; and
• Local community acceptance.
The study has identified areas of opportunities that will be analysed in ongoing engineering studies and test work:
• Reduce the crush size to minus 3/8” to improve silver recovery and leaching rate;
• Investigate reducing the process plant footprint to reduce capital costs; and
• As the sensitivity analysis shows, the project is sensitive to operating costs. BCM and its consultants will explore opportunities for reducing operating costs mainly through reducing reagent consumption both in ongoing leaching tests and after operations start-up.

Rev: 0 Date: October 2010 J07.82.13.02: Feasibility Study – NI 43-101 Technical Report – Santa Ana Project 11
2 Introduction
2.1 Terms of Reference and Purpose of the Report Ausenco Vector (Vector) was commissioned by Bear Creek Mining Corporation (BCM) to prepare a feasibility study and independent National Instrument 43-101 Technical Report on the Santa Ana Silver Project. The Project is located in south-eastern Peru. The feasibility study includes data and information provided by Vector and other professional and consultants. This work was started in June 2009 and summarized in a 7 October 2010 press release.
This report is intended for the use of BCM for the development and advancement of the Santa Ana Project. This document presents a feasibility study with technical statements of resources, reserves and results of an economic model. This report meets the requirements for NI 43-101 and the resources and reserve definitions defined therein.
This report utilizes metric units. Tonnes are defined as metric tonnes and ktonnes are 1000 metric tonnes. Metal grade of silver are in grams per metric tonne. Metal grades of lead and zinc are in percent by weight. All tonnages reported in this document are dry tonnes.
2.2 Project Team and Responsibilities The reserve and resources was updated based on all available drillhole assay information as of May 2010 by IMC with John Marek acting as qualified person for update of reserve and resources.
Mine plans, production schedules, and mine cost estimates were developed by IMC with John Marek acting as the qualified person for these tasks.
Review and interpretation of process testing, development of a preliminary process flow sheet, and process cost estimation was the responsibility of RDI with Deepak Malhotra Ph.D. acting as qualified person.
Preliminary design of the heap leach pad and estimation of costs for project infrastructure requirements were the responsibility of Ausenco Vector with Scott Elfen, Sean Currie and Thomas Wohlford acting as the qualified persons.
John Marek, Scott Elfen, Sean Currie and Thomas Wohlford have all visited the project. The most recent site visit was completed Mr. Wohlford 24-30 July 2010.
Table 2.1 lists the contributors to the FS and the Qualified Persons (QP) responsible for the report.

Rev: 0 Date: October 2010 J07.82.13.02: Feasibility Study – NI 43-101 Technical Report – Santa Ana Project 12
Table 2.1 Santa Ana Responsibility Matrix
Report Section Title Responsible Party
1 Summary Scott Elfen, Vector
2 Introduction Scott Elfen, Vector
3 Reliance on Other Experts Scott Elfen, Vector
4 Property Description and Location Scott Elfen, Vector
5 Accessibility, Climate, Local Resources, Infrastructure and Physiography Scott Elfen, Vector
6 History Scott Elfen, Vector
7 Geologic Setting John Marek, IMC
8 Deposit Types John Marek, IMC
9 Mineralization
9.1 General John Marek, IMC
9.2 SEM Deepak Malhotra, RDI
10 Exploration John Marek, IMC
11 Drilling John Marek, IMC
12 Sampling Method and Approach John Marek, IMC
13 Sample Preparation, Analysis and Security John Marek, IMC
14 Data Verification John Marek, IMC
15 Adjacent Properties Scott Elfen, Vector
16 Mineral Processing and Metallurgical Testing Deepak Malhotra, RDI
17 Mineral Resources and Mineral Reserve Estimates John Marek, IMC
18 Other Relevant Data and Information All
19 Interpretations and Conclusions Scott Elfen, Vector
20 Recommendations Scott Elfen, Vector
21 References Scott Elfen, Vector
22 Date and Certificates of Authors
23 Additional Requirements for Technical Reports on Development Properties
23.1 Mining John Marek, IMC
23.2 Mineral Processing Deepak Malhotra, RDI
23.3 Infrastructure Sean Currie, Vector
23.4 Geotechnical Sean Currie, Vector
23.5 Markets Scott Elfen, Vector
23.6 Environmental Considerations and Permitting Scott Elfen, Vector
23.7 Health, Safety, Environment and Community Thomas Wohlford, Vector
23.8 Project Execution Scott Elfen, Vector

Rev: 0 Date: October 2010 J07.82.13.02: Feasibility Study – NI 43-101 Technical Report – Santa Ana Project 13
Report Section Title Responsible Party
23.9 Economic Analysis Scott Elfen, Vector
23.10 Opportunities
23.10.1 Finer Crushing Deepak Malhotra, RDI
23.10.2 Northern Extension John Marek, IMC
23.10.3 Longer Mine Life John Marek, IMC
23.10.4 Deep Potential John Marek, IMC
24 Illustrations Scott Elfen, Vector

Rev: 0 Date: October 2010 J07.82.13.02: Feasibility Study – NI 43-101 Technical Report – Santa Ana Project 14
3 Reliance on Other Experts Project coordination and communication was the responsibility of Marc Leduc, Chief Operating Officer for Bear Creek Mining who is also a qualified person under the definitions within NI 43-101.
Bear Creek Mining Corp. has provided much of the information regarding the project property situation as well as background information on the property. Where possible, the authors have confirmed information provided by Bear Creek or previous authors by comparison against other data sources or by field observation. Where checks and confirmations are not possible, the authors have assumed that all information supplied is complete and reliable within normally accepted limits of error. During the normal course of the work, we have not discovered any reason to doubt that assumption.
Vector has not specifically reviewed or audited the property ownership documents at Santa Ana. Vector has relied on the opinion of Peruvian legal counsel to Bear Creek Mining. Estudio Grau Abogados provided a letter dated 19 October 2010 to Bear Creek Mining outlining the property ownership at Santa Ana and signed by Juan Carlos Escuder (partner), and Edgardo Portaro (Associate) which has been reviewed by Vector as support to the information provided in Section 4.

Rev: 0 Date: October 2010 J07.82.13.02: Feasibility Study – NI 43-101 Technical Report – Santa Ana Project 15
4 Property Description and Location The Santa Ana Property is located approximately 45 km west of Desaguadero, a small city located near the Bolivian – Peruvian border southwest of Lake Titicaca. Santa Ana is 120 km south of the much larger city of Puno in the Department of Puno in south-eastern Peru.
The Santa Ana property covers an area of 5,400 hectares in an area to the south of the village of Huacullani. The approximate UTM grid coordinates for the centre of the main portion of the property are 8,158,000 m North and 466,000 m East using the Prov. S. Am ’56 map datum (zone 19).
The property consists of six claims: the Karina 9-A, Karina 1, Karina 2, Karina 5, Karina 6 and Karina 7. Bear Creek has executed its option to acquire 100% interest in the six mineral claims which comprises 5,400 hectares. The claims were subject to payments under a finder's fee agreement to a Peruvian individual of which $15,000 was paid upon receipt of title and $15,000 was paid upon initiation of drilling. In addition, in accordance with the finder’s fee agreement, the property is subject to a 3% payment of the direct exploration expenditures to a maximum payment of $280,000.
The mineral titles were held on behalf of the Company by a third party. The Company initiated a process to transfer the titles to its name under a Supreme Decree, whereby a foreign controlled entity, such as Bear Creek Mining Corporation, can hold title to mineral rights located within the 50 kilometre border zone of Peru. The Company made a total payment of $7,000 to the third party upon transfer of title. This process was completed late in 2007 and the company now holds clear title to the claims. Table 4.1 presents a list of the claims and their sizes.
Table 4.1 Santa Ana Project Mining Concessions
Concession Name
Identification Code
Size (Hectares)
Karina 9-A 010146204 1000.00 Karina 1 010146304 700.00 Karina 2 010146404 1000.00 Karina 5 010367604 700.00 Karina 6 010367804 1000.00 Karina 7 010367704 1000.00

Rev: 0 Date: October 2010 J07.82.13.02: Feasibility Study – NI 43-101 Technical Report – Santa Ana Project 16
Figure 4.1 Location Map of Santa Ana

Rev: 0 Date: October 2010 J07.82.13.02: Feasibility Study – NI 43-101 Technical Report – Santa Ana Project
5 Accessibility, Climate, Local Resources, Infrastructure and Physiography
5.1 Access Access to the property is obtained by driving west 44 km from Desaguadero on paved and gravel roads to the village of Huacullani, then south on a good dirt road another 4.9 km to the project site. In good weather, two-wheel drive vehicles can easily access the property; off road or wet weather travel requires four-wheel drive vehicles.
5.2 Climate The climate of the region is typical of the high Andes of Peru. There is a pronounced dry season with little precipitation from May through September and a pronounced wet season from January through March. The temperatures are mild with average daytime high temperature above freezing. Occasionally, the overnight temperatures drop below freezing.
There are no climatic conditions that would cause the project great operational difficulty. The largest concern will be managing stormwater but this is a concern at all mine sites and can be managed with proper controls.
Vegetation is primarily the stiff bunch grass found at these altitudes in the Andes. Trees are nearly absent.
The property lies within a volcanic upland to the south of Huacullani. Elevations generally vary from 4150 to 4300 meters above mean sea level. A stream flows through the broad valley east of the deposit, which might be developed to provide some of the water requirements for mining and processing.
5.3 Local Resources Local resources are beneficial for resource projects. Huacullani is a small provincial town with small scale farming as the primary economic activity. Local farming is mostly limited to growing of market vegetables (potatoes and corn) and the herding of sheep, alpaca and cattle. The recently utilized exploration labour force came from the nearby communities. There is no history of mining in the area during the recent past.
5.4 Infrastructure Infrastructure is in-place for mine development with a good paved highway 8 km north of the project. Water for mining operations could be obtained from a large river located 10 km to the north of the project (next to the paved highway). Power for exploration was supplied by generators but for a mining operation a power line will be constructed and connected to the national grid at the sub-station located in Pomata (43 km to the northeast).
The project area has a moderate topography so the construction of site access roads is easy compared to other projects in Peru where there is more severe topography.
There is only one small structure within the project property and the exploration group used it during the drilling phase for offices and accommodations. The mine development plan describes installation of all new site infrastructure for the project.

Rev: 0 Date: October 2010 J07.82.13.02: Feasibility Study – NI 43-101 Technical Report – Santa Ana Project
5.5 Physiography The physiographic features are moderate to gentle and access is easy to all parts of the project either by 4x4 truck or on foot. The project is located at the top of a mesa shaped mountain with the top of the mesa forming a gentle bowl shape. The sides of the mesa are more rugged than the project site: consequently, the access road from Huacullani to the top of the mesa is more sinuous and steeper than other roads in the area. The project is located at the 4200 meter elevation on average.

Rev: 0 Date: October 2010 J07.82.13.02: Feasibility Study – NI 43-101 Technical Report – Santa Ana Project
6 History Bear Creek Mining Corporation became aware of old Colonial workings on the Santa Ana property and began a concerted exploration campaign during the second half of 2004. Otherwise, little is known of the exploration history of the property. The Spanish in the Colonial era had a modest, vein mining and exploration operation here with most of the workings concentrated at the southern end of the deposit.

Rev: 0 Date: October 2010 J07.82.13.02: Feasibility Study – NI 43-101 Technical Report – Santa Ana Project
7 Geologic Setting The Santa Ana property occupies a broad volcanic upland that lies between extensive exposures of thin-bedded gray lithic sandstones and red beds of the Puno group (Cretaceous to lower-Tertiary) that underlie both Huacullani and the region to the south of the ore body. The central and western portion of the upland is occupied by a sequence of fine-grained andesite flows and autobreccias that possibly belong to the Tertiary Tacaza group, strike generally north or northeast and dip to the west at angles ranging from 15° to 60°. To the west these Tertiary flows are capped by a coarse-grained dacitic porphyry that, in turn, is overlain unconformably by a thick sequence of Miocene- Pliocene dacitic volcanoclastic rocks. The andesite flows, autobreccias and dacitic porphyry are the mineral hosts.
Earlier descriptions of the mineralization described a northern Anomaly A and a southerly Anomaly B. Recent drilling has connected these zones so that they represent major structural orientations that contain continuous mineralization.
The andesite volcanic unit host the mineralization including veins and bulk tonnage material. Quartz-feldspar porphyry intrusives host minor mineralization in the northern Anomaly B and in the canyon south of Huacullani. The best evidence of attitude in the andesite rocks is the ledges of outcrop that, from a distance, appear to be flows striking north-northeast and dip west at 15° to 60°. This attitude would be in general accord with the attitude of some overlying flows observed to the west.
Presumably, the sandstones exposed to the north and south underlie the host volcanic field in the central part of Anomaly B. Total thickness of the volcanic package is not well defined.

Rev: 0 Date: October 2010 J07.82.13.02: Feasibility Study – NI 43-101 Technical Report – Santa Ana Project
8 Deposit Types The Santa Ana deposit is typical of intermediate-sulfidation polymetallic silver-bearing vein and stockwork deposits that, although epithermal, represent mineralization both laterally and vertically distal to an intrusive source rather than the shallow, very high-level mineralization commonly associated with hot springs systems.
These kinds of deposits are typically distal to porphyry copper systems and characterized by quartz, galena, sphalerite, pyrite, magnetite-pyrite, minor chalcopyrite and rhodochrosite mineralization in the sulfide zone with variable amounts of silver, generally in the form of argentite. Barite is locally abundant occurring as an important gangue mineral.
Depending on the host rocks available, these deposits occur as discreet veins, brecciated bodies, stockwork systems, or replacement deposits (in calcareous rocks). The oxidized portions of these deposits generally contain cerrusite, abundant manganese wad or other manganese oxides, abundant iron oxides and small amounts of argentite and cerargyrite. Both oxide and sulfide zones commonly contain economic mineralization in typical deposits of this type.

Rev: 0 Date: October 2010 J07.82.13.02: Feasibility Study – NI 43-101 Technical Report – Santa Ana Project
9 Mineralization
9.1 General The majority of mineralization is within two major structural trends and hosted within the andesite unit. Both vein and disseminated mineralization occur within these trends, with higher grade associated within veins, vein swarms, breccias and open space fillings.
Brecciation associated within the broad structural zones are thought to be tectonic in origin, with occasional overprints of hydrothermal brecciation.
The host rock has been described as primarily volcanic andesites with minor dykes and intrusive. XMOD analysis of 12 drillholes describes K-feldspars as the predominant gangue mineral, followed by illite and chlorite. The quartz content is low at less than 10%. The carbonate content is less than 5%.
Figure 9.1 is a thickness map of plus 20g/t silver at Santa Ana. The north-south trend of the northern two thirds of the deposit can be seen on this map. The southern third of the deposit is generally oriented north-easterly. This appears to be caused by a flexure in the structure where it bends to the west.
Figure 9.2 is an east-west cross section through the southern portion of the deposit, and Figure 9.3 is an east-west section through the northern portion of the deposit. Both sections illustrate the generally vertical character of the mineralization.
Higher grade zones within the deposit are ubiquitous but are not particularly continuous. The percentage of high grade (plus 200g) intercepts is relatively constant from drillhole to drillhole, but the continuity of those zones is spatially limited.
9.2 SEM A scanning electron microscope (SEM) study of 12 drillholes identifies argentite as the predominate silver mineralization. Argentite accounts for 85% of the total silver in the samples. Arsenopolybasite (AgCu)16 As2S11 and McKinstyrite (AgCu)2S were identified as the other silver bearing minerals in the study. Native silver was identified in one sample as a microscopic inclusion in barite. The zinc sulfide mineral sphalerite and the lead mineral galena were free of included silver.
The silver mineralization was mostly associated with goethite and pyrite.
The relative order of cyanide solubility of the silver mineralization is:
• Mineral Solubility
• Argentite 90%
• McKinstyrite ±60%
• Arsenopolybasite ±40%
The SEM study indicates low levels of cyanocide minerals. The cyanocide minerals are covellite and the manganese oxide sulfosalts.

Rev: 0 Date: October 2010 J07.82.13.02: Feasibility Study – NI 43-101 Technical Report – Santa Ana Project
Figure 9.1 Thickness of 20g/t Silver, Contours on 30, 50, 100 m

Rev: 0 Date: October 2010 J07.82.13.02: Feasibility Study – NI 43-101 Technical Report – Santa Ana Project
Figure 9.2 East-West Section at 8,157,700N, Silver Grades 15, 45, 100, 200 g/t

Rev: 0 Date: October 2010 J07.82.13.02: Feasibility Study – NI 43-101 Technical Report – Santa Ana Project
Figure 9.3 East-West Section at 8,158,300N, Silver Grades 15, 45, 100, 200 g/t

Rev: 0 Date: October 2010 J07.82.13.02: Feasibility Study – NI 43-101 Technical Report – Santa Ana Project 26
10 Exploration Bear Creek conducted exploration activities since mid-2004 at Santa Ana. Drilling finished in May 2010. Drilling activities are summarized in Section 11.
Exploration work at Santa Ana included detailed surface mapping, sampling of outcrops, hand trenching with channel sampling, geophysics, and diamond drilling. Surface trench data has not been used in the estimation of the resource, but was used as an exploration guide for drill site selection.
Bear Creek is unaware of exploration efforts on the property prior to its work in the district. Local prospectors and Colonial Spanish workings may have been the only prior work on the site.

Rev: 0 Date: October 2010 J07.82.13.02: Feasibility Study – NI 43-101 Technical Report – Santa Ana Project 27
11 Drilling Bear Creek has utilized HQ-size diamond core drilling methods for all drillhole sampling at Santa Ana. The drilling contractor, Bradley, utilized LD- 250 skid mounted drills. Most completed drillholes consisted of 70-degree angle holes at Santa Ana in order to cross cut the near vertical mineralization.
Drillhole collar surveys were completed using hand held GPS units, with an accuracy of ±3 meters, and then followed up with a survey by a total station with three geodesic points of order “B” located on the property from the closest IGN (Geographic National Institute) point on the Peruvian national grid. Down hole surveys were not completed in the exploration holes. The orientation of each exploration drillhole is based on the orientation of the drill mast.
In addition to the exploration borings, thirteen geotechnical, oriented core holes were completed. Downhole surveying was completed within each geotechnical, oriented core boring indicating a deviation of 1 to 2 degrees.
Drillhole collars are currently abandoned with a concrete marker with pertinent drill data inscribed on the marker at the collar.
As of June 2010, the following drilling information was completed, including logs and assays. IMC received the data for the determination of this resource.
Santa Ana Drill Data as of June 2010
• 349 drillholes
• 60,143.1 meters of drilling
• 28,694 assay intervals
• 28,694 intervals assayed for silver, zinc, lead, and copper.
New holes added to the Santa Ana database since February 2009
• 43 drillholes
• 4,567.85 meters of drilling
• 1,978 assay intervals
• 1,978 intervals assayed for silver, zinc, lead, and copper.
Drill core is logged and split at site. Half core is transported to a commercial sample preparation lab as outlined in Section 12 on sampling method and approach.
Figure 11.1 presents a drillhole location map for Santa Ana as of June 2010. The holes coloured blue were available in the February 2009 database. Holes plotted in red were added between February 2009 and June 2010. The plot outline also represents the physical size of the block model assembled for the current resource estimates.

Rev: 0 Date: October 2010 J07.82.13.02: Feasibility Study – NI 43-101 Technical Report – Santa Ana Project 28
The drilling at Santa Ana is of sufficient density and of proper orientation to support the estimation of resources as reported in Section 17.0. True thickness and grade of the mineralization is defined by multiple holes at Santa Ana due to the bulk character of the deposit. The true thickness Santa Ana is the overall width and depth of the deposit which is in the range of 300 to 500m.
Figure 11.1 Drillhole Location Map

Rev: 0 Date: October 2010 J07.82.13.02: Feasibility Study – NI 43-101 Technical Report – Santa Ana Project 29
12 Sampling Method and Approach All mineral sampling for determination of economic resources was collected from HQ-size diamond drill core. The core is logged and split on site. Split core is then delivered to a commercial lab for preparation.
Drill sampling is typically completed on two meter intervals, as marked by Bear Creek field geologists. Core is split in half using manual mechanical core splitters and half-core is returned to the core boxes. Bear Creek staff then collect each half split 2-meter core sample interval and mark the samples using duplicate sample tag: one tag in the sample bag, and the other sample tag retained and recorded with the drillhole designation and interval sampled. The assay lab, therefore, has the sample tag number, but does not have the drillhole ID designation or sample interval for any of the samples. Samples are bagged by Bear Creek personnel and are transported by a vehicle driven by Bear Creek employees from the Santa Ana camp site to Puno for shipment by the Cruz del Sur bus line from Puno to Lima, Peru. The analytical lab, ALS Chemex, picks up the samples at the bus station for transport to the lab in Lima, where the samples are prepared for analysis.
Bear Creek has implemented a procedure for determination of sample density. Whole core samples are weighed on site before sample splitting. Core samples are subsequently air dried and weighed in air. Then the samples are coated with paraffin and weighed in air again. Finally the samples are immersed in water and the water displacement is measured.
As of June 2010, Bear Creek completed 843 density determinations. Most of the samples represent the andesite rock unit, with a few dykes, post mineralized rock and sedimentary units represented in the 843 samples. The average dry density of all 814 mineralized andesite samples was 2.47, and the average dry density for all 30 post mineralized and sedimentary samples was 2.18.
Results presented in this report include all available density data to date.
The sampling method applied by Bear Creek is reliable due to the use of large diameter drill core. The method is not susceptible to the impacts of ground water inflows and down hole contamination as are other drilling procedures. Core recoveries are good and their does not appear to be any drilling related factors that could affect the reliability of the results.

Rev: 0 Date: October 2010 J07.82.13.02: Feasibility Study – NI 43-101 Technical Report – Santa Ana Project 30
13 Sample Preparation, Analysis and Security The analytical laboratory, ALS-Chemex performs sample preparation and analyses at its facilities in Lima, Peru. The laboratory is located at Calle 1 LT-1A Mz-D, esq. Calle A, Urb. Industrial Bocanegra, Callao 01, Lima, Peru. ALS Chemex is an internationally known analytical laboratory commonly used by the mining industry. ALS Chemex has been the primary lab for all of Bear Creek’s analytical results for the Santa Ana Project.
Half core samples are retrieved at the Lima bus station by ALS-Chemex personnel and logged into the ALS-Chemex tracing system for preparation and assay.
Samples are crushed and pulverized to create a sample pulp, using standard crushing and pulverizing equipment and procedures. Samples are first dried at 110-120°C and then crushed with either an oscillating jaw crusher or a roll crusher. The ALS-Chemex procedure for crushed material is that more than 70 percent of the sample must pass a 2mm (#10 mesh) screen. The entire sample is crushed, and a portion, typically 250g, is subdivided for pulverizing using a rifle splitter. The remainder of the crushed material, the coarse reject, is returned to Bear Creek for storage. The split portion derived from the crushing process is pulverized using a ring mill. The ALS Chemex procedure is to pulverize the sample such that more than 85 percent of the sample is finer than 75 microns (#200 mesh); producing a sample pulp. A portion of the sample pulp is used in the sample digestion and analytical process to achieve and assay result.
As a result of the data review and verification discussed in this section and the following section, IMC and John Marek (qualified person for mineral reserves and mineral resources) have formed the opinion that the Santa Ana sample preparation, analysis, and security have resulted in a data base that is reliable for the estimation of mineral reserves and mineral resources as described in Section 17.0.
13.1 Analytical Procedure Bear Creek selected the ore-grade acid digestion with atomic absorption spectroscopy (AAS) AAS finish as the analytical method (ALS code AA62b) for the mineralization at Santa Ana. The ore-grade digestion is a three-acid digestion procedure using hydrofluoric, nitric, and perchloric acids for maximum digestion of the sample. This method, followed by hydrochloric acid leach and AAS analysis, will provide accurate silver analyses in the range of 1.0 to 1,000 g/t Ag.
Similar methods of ore-grade digestion are used for the lead, zinc, and copper analyses. ICP methods are used for determining gold and other trace elements. When higher gold values are anticipated, gold values are also determined using fire-assay preparation and AAS finish.
13.2 Quality Control Procedures (QA/QC) A QA/QC program to verify consistency of analytical results has been in place since Bear Creek started work at Santa Ana. The QA/QC procedures are summarized below and discussed in more detail in the following paragraphs.
• Certified standards and blanks are periodically inserted by Bear Creek personnel in the sample submission stream to ALS Chemex;
• Check assays on pulps are submitted to a third party lab; and

Rev: 0 Date: October 2010 J07.82.13.02: Feasibility Study – NI 43-101 Technical Report – Santa Ana Project 31
• The remaining half core samples from every 50th core box are resampled and sent to the ALS-Chemex lab as a check on sample preparation procedures.
Standards are inserted in sequence with the regular rock samples from half-split core. Since the inserted sample standards are pulps rather than rock, the analytical lab is aware that they are QA/QC samples; however, the lab does not know whether they are standards, blanks, or re-runs of former pulps. Bear Creek inserts one of six standard sample pulps, selected randomly, with every 20 regular samples. The sample standards have been prepared by one of three laboratories: RockLabs Australia, CIMM Labs Lima, or by Inspectorate Labs Lima. CIMM and Inspectorate are internationally known analytical labs that service the mining industry, and have an assay lab in Lima, Peru. Rock Labs is an internationally known provider of sample standards to the mining industry.
Typically two to five standards have been inserted into the sample stream for each drillhole completed to date. Bear Creek tracks the reported assay of the standards with the mid-point of the known range, and triggers a possible re-assay of sample batches for which the difference between the two values is greater than +/- 10% or 2 times the standard deviation. This event has occurred a few times during the project life. The final decision on sample reassays also considers the real difference between the standard assay and the known mid-point. For example, a standard assay of 2.0 g/t Ag for a mid-point of 1.2 g/t Ag, while a difference of 167%, is not statistically sufficient to trigger a reassay of a sample batch. Should re-assays of a sample batch and standard be required, the corrected assays are input into the database. This procedure assures consistency of assays from ALS-Chemex.
Blanks are inserted in the sample stream as part of the standards insertion process. Some of the early “blanks” were actually low-grade standards of approximately 1 g/t. Recent “blanks” from RockLabs are indeed certified values of 0.0. Drillholes added since July 2008 tend to have one “blank” per hole as part of the standards submission.
Check assays are completed by sending splits from prepared pulps to a third party laboratory to rerun the assay. Roughly 1 out of every 10 pulps has a portion separated and sent to the Inspectorate Assay Laboratory in Lima for an independent re-assay of the pulp.
Starting in late 2007, Bear Creek initiated a program of half core preparation and assaying by retrieving the last full 2 meter core interval from every 50th core bock. The remaining half core after sampling is bagged and shipped to ALS-Chemex for preparation and assay as a check on the original half sample preparation and assay.
Bear Creek also retrieves the full and complete internal ALS-Chemex QA/QC data as an additional check on the consistency of the assays received from that lab.
Assay results from ALS-Chemex are received electronically for incorporation into the database. The electronic transfer process helps to minimize data entry errors into the database. Bear Creek also verifies the electronic data against the hard copy certificates of assay also provided by ALS-Chemex.
13.3 Sample Security Bear Creek maintains control of the surface and drillhole samples from the drill rig to delivery of individually sealed samples in sealed shipping sacks at the bus depot in Puno for transport to the assay lab. Bear Creek retains the pulps and coarse rejects from the Santa Ana drillhole samples at its secure warehouse in Lima and retains the boxed half-core at a secure storage warehouse in Puno.

Rev: 0 Date: October 2010 J07.82.13.02: Feasibility Study – NI 43-101 Technical Report – Santa Ana Project 32
14 Data Verification IMC completed the following tasks as part of the due diligence data verification of the Santa Ana project:
• Comparison of the June 2010 database against the previously provided February 2009 data;
• Spot check of the July 2008 certificates of assay versus the assay information recorded in the February 2009 database;
• Analysis of blanks and standards results for both 2009 and 2010 data bases;
• Analysis of pulp check assays for both 2009 and 2010 data bases; and
• Half core duplicate assays analysis based on February 2009 drilling.
As a result of the tasks completed above, IMC holds the opinion that the database can be used for the determination of mineral reserves and mineral resources.
14.1 Review of the Incremental Data collected between March 2009 and June 2010 The comparison of the recent June 2010 data set versus the previous February 2009 database indicated that 43 new drillholes totalling 4,568 meters of drilling with 1,978 assay intervals were added to the database.
In June 2010 IMC received updated topography for the Santa Ana deposit. The new topographic survey was conducted by a company called Digital Globe, based in Longmont, Colorado, USA. The updated topography was done in the PSAD _19S system and was supplied to IMC as contour data. The updated topography is used both in the June 2010 database and block model.
IMC checked the drillhole collars versus the topographic information listed above and found them to be consistent.
IMC has focused on the verification of silver in this report as that is the only metal for which there will be economic credit. Bear Creek does maintain an appropriate QA/QC program on the contained zinc and lead at Santa Ana.
14.2 Certificate Check IMC selected 10 drillholes from the February 2009 database for detailed comparison of the paper certificate of assay versus the electronic database. The certificates of assay for these 10 holes were transferred to IMC as PDF files via email communication with Bear Creek personnel. The 10 holes were selected by IMC, as follows:
DDH-SA-8 DDH-SA-26 DDH-SA-50 DDH-SA-135
DDH-SA-168 DDH-SA-172 DDH-SA-176 DDH-SA-180
DDH-SA-191 DDH-SA-197
Assay Certificate data for silver, copper, lead and zinc from ALS Chemex was entered by IMC personnel and this data was checked against the data in the drillhole database provided by Bear Creek Mining.

Rev: 0 Date: October 2010 J07.82.13.02: Feasibility Study – NI 43-101 Technical Report – Santa Ana Project 33
Out of the 813 assay intervals that IMC checked against certificates, there were no assay differences found for silver, zinc, or lead. In summary, the certificate check did not identify any issues with the assay information in the electronic data set.
Several of the holes selected in the list above were identified from the check assay results as holes were outliers occurred. The certificates were reviewed to see if sample swap issues could have explained the check assay outliers.
IMC has not completed a check of certificates for the 43 holes drilled in 2010.
14.3 Standards Pulp standards or Certified Reference Material (CRM) are inserted roughly every 20 intervals by Bear Creek geologists. Since split core is received by ALS-Chemex and standards are pulps, the lab does know that the insertion is either a standard or blank. They however, do not know which standard or blank.
IMC completed a review of the silver standards values versus the reported values from ALS-Chemex. As of February 2009 there were 1,078 standards in the database with certified mid-values that are greater than 1.0. The new 2010 drilling data has 54 additional standards analysis and 52 ‘blanks’.
IMC has sorted the values that are 1.0 g/t or less out for separate review as “blanks”. The standards with low silver values of 1.0 g/t appear to be treated as “blanks” in the Bear Creek insertion process. The figures below show the comparison of silver standards with grade above 1.0 g/t versus reported ALS-Chemex assay results. Figure 14-1 illustrates all the 2006, 2007, and 2008 standards. Figure 14.2 shows the standards results analysed in 2009 and 2010.
Included in Figure 14.1 are 115 assays from the standard CIMM-24. In the Excel file provided to IMC this standard has Two Certified Silver Grades, the values are 3.5 g/t (27 intervals) and 4.1 g/t (88 intervals). These observations are of silver grades well below economic interest. However, the certified value for this standard should be verified and the correct CRM values used.
The newer drilling data included three higher grade standards, BCSA-4357 with a CRM value of 37.6 g/t, BSCA-1234 at 24.6 g/t, and BSCA-3875 having a certified value of 48.2 g/t silver.
Between 2006 and 2009 the CRM checks were generally unbiased in the range of interesting economic grades. IMC has reviewed the standards from 2006 that appear to be outside the expected ranges. Historically these may have been due to the data recording and insertion process.

Rev: 0 Date: October 2010 J07.82.13.02: Feasibility Study – NI 43-101 Technical Report – Santa Ana Project 34
Figure 14.1 2006, 2007 and 2008 Assay Standards Greater than 1.0 g/t

Rev: 0 Date: October 2010 J07.82.13.02: Feasibility Study – NI 43-101 Technical Report – Santa Ana Project 35
Figure 14.2 2009 and 2010 Assay Standards Greater than 1.0 g/t
The results of the 2010 CRM checks indicate a very slight high bias of silver values by ALS-Chemex, in grades above 20.0 g/t. The new standards analyses show no indications of sample swaps. In the historic data there are a few outliers that may be due to sample swaps in the sample handling or database process.
14.4 Blanks The standards file provided to IMC contains:
• In the February 2009 database there are 172 inserted pulps with certified values of 0.0 g/t silver;
• 110 inserted pulps with certified values of 1.0 g/t silver are contained in the February 2009 data;
• During 2009-2010 there were 24 samples inserted with certified values of 1.0 g/t silver; and
• There are 28 new samples with certified values of 0.0 g/t silver.
IMC has chosen to treat both of those standards sets as “blanks” in that the 1.0 g/t material is substantially lower grade than any potential economic consideration.

Rev: 0 Date: October 2010 J07.82.13.02: Feasibility Study – NI 43-101 Technical Report – Santa Ana Project 36
June 2010 Certified Value of 0.0 g/t (Rock Labs_29)
• Number Inserted 24
• Average Reported Grade 1.104 g/t
• Percentage reported between 1.0 and 1.99 g/t 58%
• Percentage reported between 2.0 and 2.99 g/t 21%
• Percentage greater than or equal to 3.00 g/t 0%
• Maximum value 2 g/t
June 2010 Certified Value of 1.0 gm/t (Rock Labs_35)
• Number Inserted 28
• Average Reported Grade 1.161 g/t
• Percentage reported between 1.0 and 1.99 g/t 47%
• Percentage reported between 2.0 and 2.99 g/t 11%
• Percentage greater than or equal to 3.00 g/t 11%
• Maximum value 3 g/t
February 2009 Certified Value of 0.0 g/t
• Number Inserted 172
• Average Reported Grade 1.18 g/t
• Percentage reported between 1.0 and 1.99 g/t 50%
• Percentage reported between 2.0 and 2.99 g/t 20%
• Percentage greater than or equal to 3.00 g/t 5%
• Maximum value 5 g/t
February 2009 Certified Value of 1.0 g/t
• Number Inserted 110
• Average Reported Grade 1.51 g/t
• Percentage reported between 1.0 and 1.99 g/t 40%
• Percentage reported between 2.0 and 2.99 g/t 35%
• Percentage greater than or equal to 3.00 g/t 10%
• Maximum value 5 g/t
IMC was able to confirm that the outlier blanks values listed in the 2009 data did trigger questions within the Bear Creek system.

Rev: 0 Date: October 2010 J07.82.13.02: Feasibility Study – NI 43-101 Technical Report – Santa Ana Project 37
In summary, none of the ALS-Chemex assays of blank values reported grades that were greater than about ¼ of the lowest potentially interesting economic cutoff grade. Figure 14.3 shows the assay results of the 2009 and 2010 ‘blank’ standards.
Figure 14.3 Results of Sep-2010 Blanks from RockLabs Standards
14.5 Pulp Check Assays Bear Creek routinely sends duplicate pulps out for reassay at the Inspectorate Assay Lab in Lima as a measure of the ability of ALS-Chemex to repeat their results on the same pulp. Figures 14.4 and 14.5 present the XY and QQ plots of silver from the February 2009 and June 2010 data base ALS-Chemex assays versus the Inspectorate AAS finish duplicate assay. Correlation is good and there is no evidence of bias or inappropriate variability within the 2009 and recent 2010 assay procedure.
There are 193 recent (2009-2010) duplicate pulp analyses. This is approximately four repeat assays per drillhole completed in late 2009 to mid-2010. The mean of the recent drilling original values is 17.95 g/t and the mean of the duplicates are 17.70 g/t. Historically, there were 2,573 duplicates in the February 2009 data set, with the ALS-Chemex mean of 24.7 g/t and the Inspectorate duplicate of 24.4 g/t.
In June 2010 IMC also received duplicate assay data for zinc and lead. Figures 14.6 and 14.7 present XY plots of zinc and lead of the 2009-2010 original ALS-Chemex assays versus the Inspectorate AAS finish duplicate assay. The XY plots of these elements show no bias or reason for concern.

Rev: 0 Date: October 2010 J07.82.13.02: Feasibility Study – NI 43-101 Technical Report – Santa Ana Project 38
Figure 14.4A XY Plot 2009 Data, ALS- Chemex Silver vs. Inspectorate Silver Check
(Chemex Avg=24.7 g/t : Inspectorate Avg=24.4 g/t)

Rev: 0 Date: October 2010 J07.82.13.02: Feasibility Study – NI 43-101 Technical Report – Santa Ana Project 39
Figure 14.4B QQ Plot 2009 Data, ALS-Chemex Silver vs. Inspectorate Silver Check
(5th to 99th Percentiles Plotted)

Rev: 0 Date: October 2010 J07.82.13.02: Feasibility Study – NI 43-101 Technical Report – Santa Ana Project 40
Figure 14.5A XY Plot 2010 Data, ALS-Chemex Silver vs. Inspectorate Silver Check
(Chemex Avg=17.95 g/t : Inspectorate Avg=17.70g/t)

Rev: 0 Date: October 2010 J07.82.13.02: Feasibility Study – NI 43-101 Technical Report – Santa Ana Project 41
Figure 14.5B QQ Plot 2009 Data, ALS-Chemex Silver vs. Inspectorate Silver Check
(5th to 99th Percentiles Plotted)

Rev: 0 Date: October 2010 J07.82.13.02: Feasibility Study – NI 43-101 Technical Report – Santa Ana Project 42
Figure 14.6 XY Plot, ALS-Chemex Zinc vs. Inspectorate Zinc Check
(Chemex Avg=0.35% Zn: Inspectorate Avg=0.34% Zn)

Rev: 0 Date: October 2010 J07.82.13.02: Feasibility Study – NI 43-101 Technical Report – Santa Ana Project 43
Figure 14.7 XY Plot, ALS-Chemex Lead vs. Inspectorate Lead Check
(Chemex Avg=2.17% Pb: Inspectorate Avg=2.14% Pb)

Rev: 0 Date: October 2010 J07.82.13.02: Feasibility Study – NI 43-101 Technical Report – Santa Ana Project 44
14.6 Half Core Duplicates Samples In 2007 Bear Creek personnel began a half core check program in which the second half of the remaining drill core is send out for re-assay as a check against the original split core sample. This sample is selected as the last full 2m sample run in the 50th core box. The following results are based on data February 2009. No half core sample results from March 2009 to June 2010 were sent to IMC.
The half core duplicates were delivered to IMC in the form of an Excel file with the title ‘duplicates’. The second half core sample is sent to ALS-Chemex for preparation and assay in the identical method as the original samples. There are assays for silver, zinc, lead, and copper for each of the selected drillhole intervals. This report focuses on the results for silver.
The 350 split core samples are from 284 drillholes.
Figure 14.8 is an XY plot of the original ALS-Chemex assay versus the half core duplicate assay. The plot shows that within the core duplicate assay, six intervals have significantly lower grades than their original assays. The questionable intervals are listed in Table 14.1.
Table 14.1 Half Core Questionable Intervals
Drillhole From (m)
To (m)
Sample Number
Original Silver (g/t)
Half Core Silver (g/t)
Difference (g/t)
DDH-SA-124 40 42 16945 949.0 42.0 907.0 DDH-SA-2B 134 136 4444 576.0 458.0 118 DDH-SA-156 150 152 22266 271.0 68.0 203.0 DDH-SA-112 208 210 17182 209.0 85.0 124.0 DDH-SA-19 26 28 51387 194.0 127.0 67.0
DDH-SA-187A 100 102 24440 188.0 27.0 161.0 DDH-SA-64B 150 152 13643 50.0 143.0 -93.0
The grade differences illustrated in Table 14.1 are generally in the high-grade range, indicating that there is a significant variability within the high grade assays. These types of assay values occur in every drillhole but their size and continuity is quite variable.
IMC also applied several statistical hypothesis tests on the data illustrated in Figure 14.8. The two data sets pass all of the following statistical tests indicating that the two samples could have come from the same population with 95% confidence, including: T-Test on Mean; Pair T Test on Sample differences; Binomial Test; and the Komologorov-Smirnoff test of populations.
Detail review of the data did identify that two of the high-grade samples in the above list incurred a nearly matching value in a previous or following interval. This result could indicate that there may be some mislabeling of the sample intervals. Alternatively, the physical vein orientation could cross from one half-sample to the other across an adjacent sample interval.

Rev: 0 Date: October 2010 J07.82.13.02: Feasibility Study – NI 43-101 Technical Report – Santa Ana Project 45
Figure 14.8A XY Plot of Half Core Duplicates
(350 Samples, Original Mean=25.6 g/t : Duplicate Mean=21.0 g/t)

Rev: 0 Date: October 2010 J07.82.13.02: Feasibility Study – NI 43-101 Technical Report – Santa Ana Project 46
Figure 14.8B QQ Plot of Half Core Duplicates
(0 to 100th Percentiles, Points are not equal percentiles)

Rev: 0 Date: October 2010 J07.82.13.02: Feasibility Study – NI 43-101 Technical Report – Santa Ana Project 47
15 Adjacent Properties There are no adjacent mineral properties that have bearing upon Santa Ana.

Rev: 0 Date: October 2010 J07.82.13.02: Feasibility Study – NI 43-101 Technical Report – Santa Ana Project 48
16 Mineral Processing and Metallurgical Testing
16.1 Metallurgical Test Work Detailed leach test work has been performed on several representative composite ore samples taken from the Santa Ana ore body. The test work shows that the long-term recovery of silver will be 70% when the ore is crushed to 80% passing 19mm. Recent analysis of the earlier test work and an on-going column leach test on ore crushed to 80% passing 9.5 mm, has indicated that the recovery of silver will increase to at least 75% and a significantly shorter recovery period can be obtained. However, the FS and the economic analyses have all been based on the 19mm crush case and 70% long-term recovery.
16.1.1 Metallurgical Testing – Phase I The project has no recent mining history. BCM approached the metallurgical testing in a systematic fashion in three phases.
The samples for the Phase I test program were coarse assay rejects. Ten intervals were selected to represent all areas of known mineralization including both high and low grade mineralization. The samples assay ranged from 52g/t Ag to 172g/t Ag.
16.1.1.1 Test Procedures Three laboratories performed tests on the samples.
• ALS/Chemex Laboratories in Lima performed 24-hour shaker tests on the coarse assay rejects.(#10 mesh);
• Plenge Lab in Lima performed 96-hour bottle roll tests on samples ground to 50% -200 mesh; and
• McClelland Laboratories performed 168 hour bottle roll tests on coarse assay rejects (#10 mesh).
16.1.1.2 Test Results and Conclusions
Table 16.1 Phase I Metallurgical Test Results
Laboratory Type Duration Size Silver Rec. %
ALS Shaker 24 hours 10 mesh 55.3 Plenge Bottle Roll 96 hours 200 mesh 84.5
McClelland Bottle Roll 168 hours 10 mesh 71.3
The tests demonstrated the viability of cyanide leaching of these ores as well as a recovery sensitivity to size and leach times.

Rev: 0 Date: October 2010 J07.82.13.02: Feasibility Study – NI 43-101 Technical Report – Santa Ana Project 49
16.1.2 Metallurgical Testing – Phase II BCM initiated a series of bottle roll and column tests to simulate the effect of fine grinding high-grade ores and adding the pulp to crushed low-grade ores for heap leaching. The process is known as pulp agglomeration.
BCM selected half core samples from the results of assays to be representative of the ore body. The high grade sample assayed 106 g/t, the low grade ores [heap grade] assayed 37 g/t.
The tests were done at McClelland Laboratories in Sparks, Nevada.
16.1.2.1 Bottle Roll Tests 168 hour bottle roll tests were performed on heap grade ores at p80 19mm and the high grade ores at p80 212 micron, p80 150 micron and p80 75 micron (200 mesh). Table 16.2 presents results of the Phase II bottle roll testing.
Table 16.2 Santa Ana Core Composites, Phase II Bottle Roll Test Results
Metallurgical Results Extraction
(% Ag) Heap-Grade (p80-19mm) p80 212µm High Grade
(p80-150 µm) p80-75 µm
24 hrs. 33.0 58.3 61.6 63.7 28 hrs. 36.8 70.8 73.0 79.1 72 hrs. 39.9 77.2 80.8 83.1
168 hrs. 46.0 85.8 88.3 88.4 Residue (g/t Ag) 20.33 16.33 13.33 13.33
Cal Head (g/t Ag) 37.69 114.97 113.77 115.17
16.1.2.2 Column Tests Three 150 day column leach tests were done on:
• Heap Grade ore at p80 19mm;
• High Grade ore at p80 19mm;
• Pulp Agglomeration with 20% high grade at p80 150 micron; and
• And 80% heap grade at p80 19mm.

Rev: 0 Date: October 2010 J07.82.13.02: Feasibility Study – NI 43-101 Technical Report – Santa Ana Project 50
Table 16.3 Santa Ana Core Composites, Phase II Column Test Results
Metallurgical Results
Extraction (% Ag)
High/Heap Grade Pulp
Agglomeration High Grade Heap Grade
5 days 15.0 0.6 4.2 50 days 55.9 50.2 52.5
109 days 62.9 61.3 61.0 150 days 65.2 65.3 63.8 Residue (g/t Ag) 11.16 39.6 13.34
Cal Head (g/t Ag) 33.39 114.11 36.84
Reagent Consumption
(kg/t at 150 days)
NaCN 3.12 3.58 3.11 Lime 6.00 2.50 2.50
The bottle roll tests indicated that grinding high-grade ores finer than 150 micron was not effective for recovery. The grind of 212 micron was only moderately effective.
In the column tests, virtually identical recoveries were obtained for the three columns.
The slight advantage in recovery of a pulp agglomeration process does not justify the capital cost of the equipment (i.e., grinding mills and thickeners) or the operating cost of ore separation and operation of the system.
16.1.2.3 Cyanide Amenability Tests (Shaker) The series of Cyanide Amenability tests were done as part of the Phase II testing. A shaker test involves placing a sample in a cyanide solution and shaking for 24 hours.
Table 16.4 presents results of all the shaker tests, including the Phase I tests.
Table 16.4 Santa Ana Core Composites, All Shaker Test Results
Test Holes Samples Size Grade (g/t)
Recovery (%)
Duration (hr)
Phase I 5 10 2 mm 112.3 55.5 24 Phase II 7 14 2 mm 109.6 63.9 24 Phase III 23 55 74 µm 50.4 69.2 24
The shaker tests demonstrated that cyanide solubility was reasonably consistent across the ore body.

Rev: 0 Date: October 2010 J07.82.13.02: Feasibility Study – NI 43-101 Technical Report – Santa Ana Project 51
The shaker tests along with the other Phase I and Phase II tests provide BCM with sufficient data to select drill locations for a representative master sample for definitive testing.
16.1.3 Metallurgical Testing – Phase III The Phase III testing included:
• Whole rock and ICP identification;
• Bottle roll tests at three crush sizes;
• Column tests at three crush sizes; and
• Comminution testing.
16.1.3.1 Sample Selection BCM selected three locations for representative metallurgical samples on the basis of the Phase I and II test results. Three PQ size holes were drilled and a master composite created with whole core.
Table 16.5 presents the master composite make up and Figure 16.1 illustrates the drilling and sampling location within the Santa Ana project.
Table 16.5 Phase III Master Composite Description
Hole ID Intervals Weight
(kg) Depth Range
(m) 01 2 586.7 5-78
02A 7 560.4 5-75 03 8 511.0 2-100
Total 1658.1 kg.
The Master Composite was shipped to McClelland Laboratory. McClelland Labs reduced the core to p80 63-mm in stage crushing and thoroughly blended the crushed product. A split was taken from the Master for bottle roll and column tests at 63 mm and comminution testing. Splits were taken from the Master Composite and stage crushed to 37.5 mm and 19-mm for bottle roll and column testing. The range of silver assays and calculated heads from the tests was 52-60 g/t.

Rev: 0 Date: October 2010 J07.82.13.02: Feasibility Study – NI 43-101 Technical Report – Santa Ana Project 52
Figure 16.1 Master Composite Sample Location Map
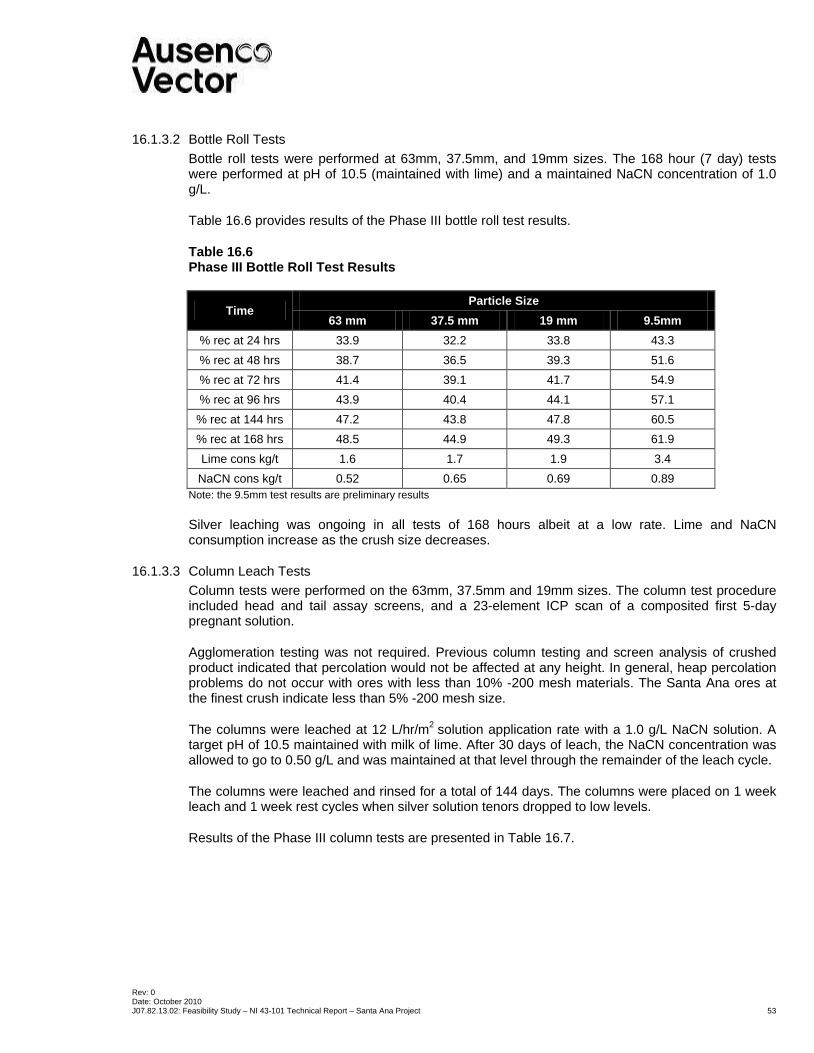
Rev: 0 Date: October 2010 J07.82.13.02: Feasibility Study – NI 43-101 Technical Report – Santa Ana Project 53
16.1.3.2 Bottle Roll Tests Bottle roll tests were performed at 63mm, 37.5mm, and 19mm sizes. The 168 hour (7 day) tests were performed at pH of 10.5 (maintained with lime) and a maintained NaCN concentration of 1.0 g/L.
Table 16.6 provides results of the Phase III bottle roll test results.
Table 16.6 Phase III Bottle Roll Test Results
Time Particle Size
63 mm 37.5 mm 19 mm 9.5mm % rec at 24 hrs 33.9 32.2 33.8 43.3 % rec at 48 hrs 38.7 36.5 39.3 51.6 % rec at 72 hrs 41.4 39.1 41.7 54.9 % rec at 96 hrs 43.9 40.4 44.1 57.1
% rec at 144 hrs 47.2 43.8 47.8 60.5 % rec at 168 hrs 48.5 44.9 49.3 61.9 Lime cons kg/t 1.6 1.7 1.9 3.4
NaCN cons kg/t 0.52 0.65 0.69 0.89 Note: the 9.5mm test results are preliminary results
Silver leaching was ongoing in all tests of 168 hours albeit at a low rate. Lime and NaCN consumption increase as the crush size decreases.
16.1.3.3 Column Leach Tests Column tests were performed on the 63mm, 37.5mm and 19mm sizes. The column test procedure included head and tail assay screens, and a 23-element ICP scan of a composited first 5-day pregnant solution.
Agglomeration testing was not required. Previous column testing and screen analysis of crushed product indicated that percolation would not be affected at any height. In general, heap percolation problems do not occur with ores with less than 10% -200 mesh materials. The Santa Ana ores at the finest crush indicate less than 5% -200 mesh size.
The columns were leached at 12 L/hr/m2 solution application rate with a 1.0 g/L NaCN solution. A target pH of 10.5 maintained with milk of lime. After 30 days of leach, the NaCN concentration was allowed to go to 0.50 g/L and was maintained at that level through the remainder of the leach cycle.
The columns were leached and rinsed for a total of 144 days. The columns were placed on 1 week leach and 1 week rest cycles when silver solution tenors dropped to low levels.
Results of the Phase III column tests are presented in Table 16.7.

Rev: 0 Date: October 2010 J07.82.13.02: Feasibility Study – NI 43-101 Technical Report – Santa Ana Project 54
Table 16.7 Phase III Column Test Results
Sample Size (mm)
Leach/Rinse (days)
Ag Recovery (%)
Calculated Head
Master Comp. p80 63-mm 145 45.0 54.90 Master Comp. p80 37.5-mm 144 54.0 55.96 Master Comp. p80 19-mm 144 64.8 60.82
The silver recovery is based on the calculated head. The calculated head is the sum of all the silver in solution through the leach/rinse cycle plus the silver in the residues as determined by duplicate fire assays.
Table 16.8 presents reagent consumptions for the column test.
Table 16.8 Phase III Column Test Reagent Consumptions
Sample 63-mm 37.5-mm 19-mm Lime Kg/t 3.31 3.38 5.76 NaCN Kg/t 1.14 1.18 1.15
The column test charges were treated with the amount of dry lime as indicated by the bottle roll tests. The 63-mm and 37.5-mm columns reached the desired pH level of 10.5 at the onset of leaching and maintained pH levels with modest additions of milk of lime.
The 19-mm column initially reached the desired pH level but within 30 days the pH had dropped to levels as low as 9.2. The adjustment to the desired pH level required large amounts of milk of lime. The milk of lime must be added in small increments to avoid plugging the column.
The column test results indicated that the p80 19mm crush size should be utilized for the feasibility study and the project.
The column data for all sizes indicate an early return of silver values followed by a long period of steady but small returns. This behaviour is illustrated in Figure 16.2 and these leach curves are typical for silver ores. A finer crush favours the early return and the long-term recovery.
Column leach times understate the time required in the heap. Columns tend to plug flow, heaps tend to diffusion flow. Empirical formulas have been developed to predict heap requirements or field days. The early return period of the curve is multiplied by 3 times, the curve break area is at 2.5 times and the tail-out is at a 1/1 ratio. BMC has utilized a 360 day complete leach cycle for silver production. The leach cycle includes allowances for placement, wetting of ore, solution retention in the heap and processing to a silver bar. Recovery data derived from Santa Ana laboratory column testing is illustrated in Figure 16.2 along with the modelled recovery curve used in the financial model.
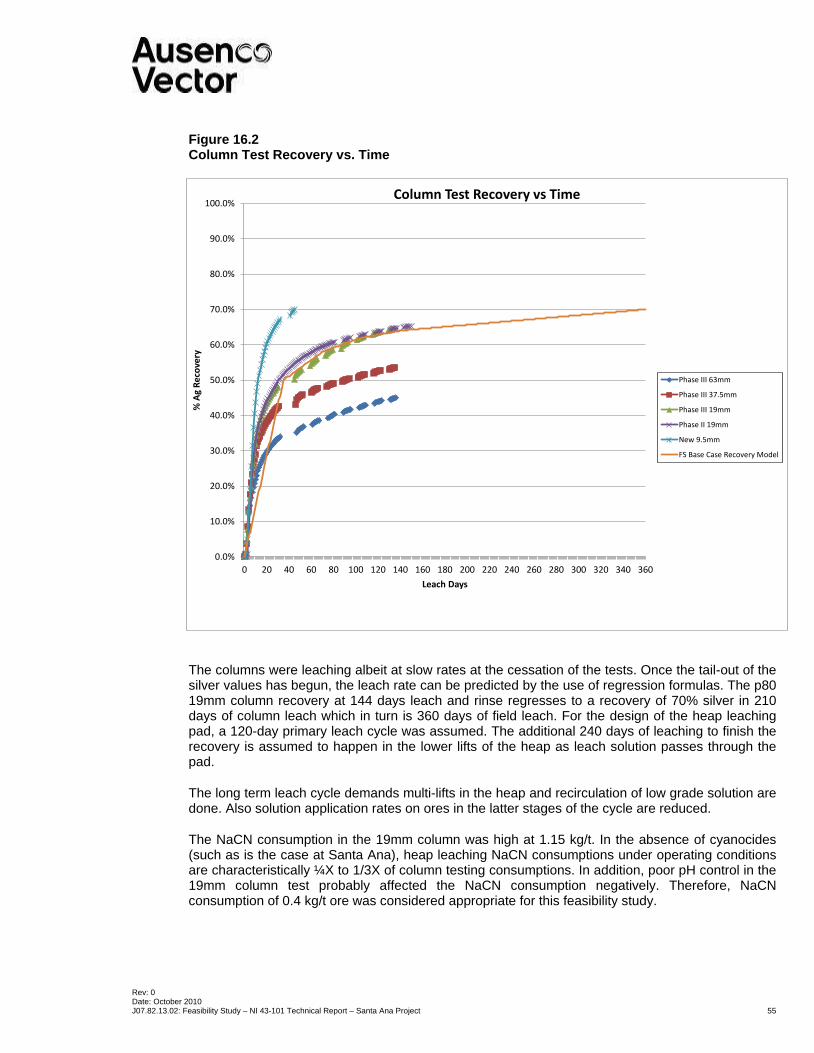
Rev: 0 Date: October 2010 J07.82.13.02: Feasibility Study – NI 43-101 Technical Report – Santa Ana Project 55
Figure 16.2 Column Test Recovery vs. Time
The columns were leaching albeit at slow rates at the cessation of the tests. Once the tail-out of the silver values has begun, the leach rate can be predicted by the use of regression formulas. The p80 19mm column recovery at 144 days leach and rinse regresses to a recovery of 70% silver in 210 days of column leach which in turn is 360 days of field leach. For the design of the heap leaching pad, a 120-day primary leach cycle was assumed. The additional 240 days of leaching to finish the recovery is assumed to happen in the lower lifts of the heap as leach solution passes through the pad.
The long term leach cycle demands multi-lifts in the heap and recirculation of low grade solution are done. Also solution application rates on ores in the latter stages of the cycle are reduced.
The NaCN consumption in the 19mm column was high at 1.15 kg/t. In the absence of cyanocides (such as is the case at Santa Ana), heap leaching NaCN consumptions under operating conditions are characteristically ¼X to 1/3X of column testing consumptions. In addition, poor pH control in the 19mm column test probably affected the NaCN consumption negatively. Therefore, NaCN consumption of 0.4 kg/t ore was considered appropriate for this feasibility study.
0.0%
10.0%
20.0%
30.0%
40.0%
50.0%
60.0%
70.0%
80.0%
90.0%
100.0%
0 20 40 60 80 100 120 140 160 180 200 220 240 260 280 300 320 340 360
% A
g Re
cove
ry
Leach Days
Column Test Recovery vs Time
Phase III 63mm
Phase III 37.5mm
Phase III 19mm
Phase II 19mm
New 9.5mm
FS Base Case Recovery Model

Rev: 0 Date: October 2010 J07.82.13.02: Feasibility Study – NI 43-101 Technical Report – Santa Ana Project 56
The lime consumption in the 19mm was very high, at 5.86 kg/t mostly due to the attempt to correct the initial low pH from the column. A review of all previous tests indicate the 3.0 kg/t lime to be added during crushing will be adequate.
16.1.3.4 Comminution Testing Phase III comminution testing resulted in the following data:
• Low Energy Impact Test 10.3 kwh/t; and
• Abrasion Index 0.0539
The low energy impact test is a measure of power required to crush the ore to 19mm size. This ore is moderate to low in power requirements.
The abrasion index is a relative measure of the wear to be expected on crushers and screens. This ore has a very low abrasion index. Wear will be minimal.
16.1.4 Process Selection A heap leach operation at p80 19mm crush size is appropriate for the Santa Ana Project.
The relatively low silver grade (>50 g/t) combined with the 15% differential in heap leach recovery vs. milling recovery does not justify the much higher capital and operating costs of milling.
A Merrill-Crowe (zinc precipitation) is appropriate for recovery of silver. Economic studies comparing carbon adsorption vs. Merrill-Crowe recovery in gold/silver ores show that for a silver/gold ratio of over 4/1 the Merrill-Crowe presents the best economic case.
The Santa Ana silver/gold ratio is 7142/1.
16.2 Silver and Gold Recovery Silver recovery of 70.0% is projected for the Santa Ana Project. The recovery is predicted on a p80 19mm crush size and a 360 day total (primary and secondary) leach cycle.
Gold recovery of 75% is projected for the Santa Ana Project. The master composite for the definitive test program contained gold at 0.006-.008 g/t of gold. The definitive test column at p80 19mm extracted 0.008 g/t of gold in seven days of leaching or a recovery of 100%. Both the initial assay and the solution assays from which the extracted gold was calculated are at or below assay limits. The actual recovery is questionable. A 75% recovery is a conservative estimate.

Rev: 0 Date: October 2010 J07.82.13.02: Feasibility Study – NI 43-101 Technical Report – Santa Ana Project 57
17 Mineral Resources and Mineral Reserve Estimates Estimated mineral resources and mineral reserves at Santa Ana were developed from a computer based block model of the mineralization. The mineral resource was based on the application of the floating cone open pit computer program to that model. The floating cone was used to determine the component of mineralization with reasonable expectation of economic extraction.
The mineral reserve was based on a detailed mine plan. The mine plan was guided by additional floating cone results that guided mine phase designs and mine plans that incorporated access roads and appropriate equipment operating room. The mineral reserve is the total of all proven and probable category ore that is planned for processing within the mine plan.
This section describes the block model and summarizes the mine plan and floating cone that result in the mineral reserves and mineral resources. Section 23 presents a more detailed discussion of the mine plan.
17.1 Block Model The block model was developed using blocks sized 5 x 5 m in plan and 5m high. The selection of this small block size was based on a number of judgments including the width of high-grade mineralization and the potential to eventually mine the deposit with smaller mining equipment.
The block model is assembled in the UTM coordinate system and is parallel to the UTM grid. Topographic information was assigned to the model based on topographic maps provided to IMC from Bear Creek. The topographic maps are consistent with field observations and with drillhole collar coordinates.
Table 17.1 Santa Ana Block Model Parameters
Santa Ana Block Model Size and Location Block Size 5 x 5 meters
Bench Height 5 meters Number of block
East 300 North 480
Benches 104 Model Limits
East 465,600 467,100 North 8,157,000 8,159,400
Elevation 3,900 4,420
17.1.1 Data Base The data base for the block model assembly was developed from 349 diamond drillholes. The following summarizes the data available as of June 2010:

Rev: 0 Date: October 2010 J07.82.13.02: Feasibility Study – NI 43-101 Technical Report – Santa Ana Project 58
• Number of Drillholes: 349 holes
• Meters of Drilling: 60,143.7 meters
• Number of Drill Intervals: 28,923 intervals
• Number of Silver Assays: 28,696 assayed intervals
Each of the intervals that were assayed for silver was also assayed for copper, lead, and zinc. Copper, lead, and zinc were modelled, but the heap leach process applied for metal recovery at Santa Ana does not recover the lead, zinc, or copper.
17.1.2 Rock Type and Estimation Boundaries Population bounds or estimation zone boundaries have been assigned to the Santa Ana Block model. There are four estimation zones, two zones are to align the estimation parameters with the predominate mineralization directions. Figure 17.1 illustrates the zone assignments applied to the model on the 3990 meter elevation. Zone 1 has been estimated with a North-South oriented ellipse; while model blocks and composites in Zone 2 were estimated with the ellipse oriented North 40° East.
The host rock is primarily volcanic andesite with minor dykes and intrusives. There are post mineral volcanics that overly the andesites on the western edge of the deposit. They just appear on the northwest edge of Figure 17.1 on the 3990 elevation. The post mineralization volcanics are barren and were assigned as Zone 3. Also added to the Santa Ana block model is a barren sedimentary rock Zone 4. Zone 4 is mainly on the northern end of the deposit. No grades were assigned in either of Zones 3 or 4 as they are barren or low grade.

Rev: 0 Date: October 2010 J07.82.13.02: Feasibility Study – NI 43-101 Technical Report – Santa Ana Project 59
Figure 17.1 Illustration of Zone Codes, 3990 Elevation

Rev: 0 Date: October 2010 J07.82.13.02: Feasibility Study – NI 43-101 Technical Report – Santa Ana Project 60
17.1.3 Density Assignment Bear Creek collects density data on a regular basis by weighing whole core samples in two steps: 1) dry and, 2) suspended in water. IMC has spot checked the calculation of the individual densities from each sample. In total there were 843 density measurements provided to IMC. The density results correlate well with rock type but showed no correlation with the silver grade of the sample. Consequently, a simple density assignment by rock type was applied to the block model:
• Rock Type Dry Specific Gravity
• Mineralized Tuff 2.469
• Post Mineral Tuff 2.059
• Sediments 2.318
17.1.4 Block Grade Estimation Block grades were estimated for silver, and zinc using Indicator Kriging (IK). Lead and copper were estimated using linear kriging. The indicator kriging procedure that was applied for silver and zinc was used to establish a computer generated grade contour. The boundary or contour is generally referred to as a discriminator value. Silver incorporated a discriminator value of 15.0 g/t Ag, and zinc utilized a discriminator value of zinc 0.13% Zn. These grade contours were used to segregate a moderate grade population from a lower grade population within the deposit. Grades were estimated above and below the discriminator values, and only inside zones 1 and 2 (Mineralized Tuff).
Assay data was composited to 5m down-hole composites. Prior to compositing, individual assay values were cut in order to limit the influence of high-grade outliners on the block grade distribution.
Assay Cuts Prior to Compositing:
• Silver +1000 g/t set to 1000 g/t 21 assays
• Lead +4.5% set to 4.5% 35 assays
• Zinc +4.5% set to 4.5% 28 assays
• Copper +0.35% set to 0.35% 15 assays
The Santa Ana drillholes were composited to 5m down hole or length composites for use in block grade estimation after the above cuts were completed on assays.
Cumulative frequency plots were generated for each of the metals. These were evaluated to determine breaks or boundaries within the mineral population. Review of those graphs resulted in the use of population breaks for both silver and zinc at 15 g/t and 0.13% respectively. No grade boundaries were applied to lead or copper.
The 15 g/t discriminator was used to establish an indicator kriged boundary of plus 15g/t blocks versus lower grade blocks for silver. For zinc, the discriminator grade was 0.13%. Both indicators were sorted on a 50% probability level to establish whole block assignments where the blocks have a greater than 50% chance of being above 15 g/t silver. A similar approach was used for zinc with a 0.13% discriminator.

Rev: 0 Date: October 2010 J07.82.13.02: Feasibility Study – NI 43-101 Technical Report – Santa Ana Project 61
Table 17.2 summarizes the kriging parameters used to establish the indicator codes within the model.
Table 17.2 Kriging Parameters for Silver and Zinc Indicator Grade Breaks
Area, Metal Discriminator
Major Axis Sub-Major Range Search Spherical
Variogram
Bearing Plunge Dip Major Inter. Vert. Major Inter. Minor Nugget Total Sill
Silver, 15 gm/t
Zone 1 (North) 0 0 0 65 30 90 65 30 90 0.10 1.00
Zone 2 (South) 40 0 0 65 30 90 65 30 90 0.10 1.00
Zinc, 0.13 %Zn
Zone 1 (North) 0 0 0 65 30 90 65 30 90 0.10 1.00
Zone 2 (South) 40 0 0 65 30 90 65 30 90 0.10 1.00
Maximum Composites = 10, Minimum Composites = 2, Maximum of 3 per hole.
Although the zones utilize different search orientations, the zone boundaries 1 and 2, were not treated as hard boundaries for the indicator assignment. Composite grades were allowed to comingle between the zones. However, zones 3 and 4 were not estimated and are considered barren.
Once the silver and zinc indicators codes were assigned to the model, the respective block grades were estimated using ordinary linear kriging inside and outside of the indicator areas, treating the indicator breaks as hard boundaries. A maximum of 10 composites were used and a minimum of 2 were used to assign the grade. A maximum of 3 composites per drillhole were allowed within the search process.

Rev: 0 Date: October 2010 J07.82.13.02: Feasibility Study – NI 43-101 Technical Report – Santa Ana Project 62
Table 17.3 Kriging Parameters for Block Grade Estimation
Area, Metal Major Axis Sub-Major Range Search Spherical Variogram High Grade LimitDiscriminator Bearing Plunge Dip Major Inter. Minor Major Inter. Minor Nugget Total Sill Limit Search M
Silver Grade for + 15 gm/t BlocksZone 1 (North) 0 0 0 65 30 90 65 30 90 0.10 1.00 200 gm/t 33Zone 2 (South) 40 0 0 65 30 90 65 30 90 0.10 1.00 200 gm/t 33Silver Grade for less than 15 gm/t BlocksZone 1 (North) 0 0 0 65 30 90 65 30 90 0.10 1.00 200 gm/t 15Zone 2 (South) 40 0 0 65 30 90 65 30 90 0.10 1.00 200 gm/t 15Zinc Grade for +0.13 % BlocksZone 1 (North) 0 0 0 65 30 90 65 30 90 0.10 1.00 2.00% 33Zone 2 (South) 40 0 0 65 30 90 65 30 90 0.10 1.00 2.00% 33Zinc Grade for less than 0.13% BlocksZone 1 (North) 0 0 0 65 30 90 65 30 90 0.10 1.00 2.00% 15Zone 2 (South) 40 0 0 65 30 90 65 30 90 0.10 1.00 2.00% 15Lead GradeZone 1 (North) 0 0 0 65 30 90 65 30 90 0.10 1.00 1.30% 33Zone 2 (South) 40 0 0 65 30 90 65 30 90 0.10 1.00 1.30% 33Copper GradeZone 1 (North) 0 0 0 65 30 90 65 30 90 0.10 1.00 1.30% 33Zone 2 (South) 40 0 0 65 30 90 65 30 90 0.10 1.00 1.30% 33Maximum Composites = 10, Minimum Composites = 2, Maximum of 3 per Hole

Rev: 0 Date: October 2010 J07.82.13.02: Feasibility Study – NI 43-101 Technical Report – Santa Ana Project 63
Lead and copper were estimated based on ordinary linear kriging without the application of indicator grade boundaries. Table 17.3 summarizes the search and kriging parameters used to estimate the block grades.
The high-grade limit on Table 17.3 was used to reduce the impact of high-grade composites on the grade estimate. For example, in Silver Zone 1, a silver value of 200 g/t utilized a search limit of 33-m. Consequently, high grades over 200 g/t could not be extended more than a 33-m radius.
17.1.5 Bottom Limit Once the block grades were assigned for silver, lead, zinc, and copper, a limit was applied below the bottom of the drillholes to stop the downward extrapolation of the extensive vertical search. A boundary was established that limited downward extrapolation below the bottom of a drillhole to less than 30 m. Any block value that was more than 30-m below a drillhole was assigned a zero value within the model.
An inverse distance procedure was applied as an indicator to determine the presence or absence of assay information. That inverse distance indicator was used to clip the mineralization if there were extrapolated block values below the 30-m search limit. Table 17.4 details the bottom limit ‘estimation’ parameters.
Table 17.4 Inverse Distance Estimation for Bottom Limit of Grades
Area, Metal Power Weight
Major Axis Bearing
Major Axis
plunge
Sub-Major Dip
Search major
Search Intermediate
Search Minor
Silver Grade ID 5th 0 0 0 90 90 30
17.1.6 Classification Blocks were coded as measured, indicated or inferred based on the silver grade estimate. The kriged standard deviation (square root of the kriged variance) and the number of composites were used to estimate the silver grade and were used to establish the block classification. The parameters are summarized below:
Category Classification Inferred A silver grade was estimated
Indicated Silver grade was estimated, and the kriged standard deviation is less than or equal to 1.05
Measured
Silver grade was estimated, and the kriged standard deviation is less than or equal to 0.65, and 4 or more composites used to estimate the grade (2 or more drillholes)
17.2 Mineral Resources and Mineral Reserves Mineral resources were established based on the block model and the results of an approximate open pit geometry. The floating cone algorithm was used to establish the component of the block model that meets the criteria for reasonable expectation of economic extraction for the resource. The mineral resource presented in this section is completely contained within a computer generated open pit geometry.

Rev: 0 Date: October 2010 J07.82.13.02: Feasibility Study – NI 43-101 Technical Report – Santa Ana Project 64
The mineral reserve is the result of a detailed annual mine plan. The mineral reserve is the sum of all proven and probable class ore that is planned for processing during the mine life. The floating cone algorithm was used to guide the development of the mine plan, however, the mine plan includes mine roads, and proper equipment working room.
John M. Marek P.E. of Independent Mining Consultants, Inc. was in responsible charge of the mineral reserve and mineral resource estimates and is the qualified person for this section. Mr. Marek is independent of Bear Creek mining.
17.2.1 Mineral Reserves The mine plan that results in the mineral reserve will be discussed in more detail in Section 23. The basic economic input and the mine schedule is presented in this section for completeness.
The floating cone algorithm was used to guide to the development of the final pit design and the extraction sequence for the Santa Ana open pit. Table 17.5 summarizes the economic input assumptions that were used for the floating cone runs. These values were based on the results of the previously completed PEA and do not reflect the final cost estimates from this feasibility study.
The final pit was guided by a silver price of $13.00 /oz. However, multiple cones were developed to provide guidance for the design of practical mining pushbacks of phases. The breakeven and internal cutoffs for a range of metal prices are also shown on Table 17.5. Economic credit was only applied to measured and indicated silver mineralization within the cones used for mine planning guidance.
A series of 6 phases or pushback designs were developed for input to the mine schedule. Figure 17.2 illustrates the final pushback and correspondingly the final pit design that contains the mineral reserve. The waste rock facility illustrated in Figure 17.2 does not represent the optimized geotechnical design and was used only to account for waste volume and hauling distances. Details of the optimized waste rock facility are provided in Section 23.4.7. The total material movement of ore, low grade and waste within the final pit is 109,704 kt of which 37,077 kt of ore is planned for processing.
Table 17.6 summarizes the mine production schedule for the Santa Ana feasibility study. Proven and Probable ores are combined on the mine schedule and are the only materials considered for economic benefit within the mine plan and mineral reserve. The total of all ore processed within the feasibility study mine plan matches the total proven plus probable mineral reserves on Table 17.7.

Rev: 0 Date: October 2010 J07.82.13.02: Feasibility Study – NI 43-101 Technical Report – Santa Ana Project 65
Table 17.5 Santa Ana Floating Cone Input Data
Item Units Input Parameters Mining Cost $ / tonne Material $1.73 Leach Cost $ / tonne Ore $4.00 Pad Cost $ / tonne Ore $0.48
Rehandle Haul $ / tonne Ore $0.88 G&A Cost $ / tonne Ore $1.33
Total $ / tonne Ore $6.69 Process Recovery Percent 70% Refining Charge $/oz $0.40
Refining Recovery Percent 99.7% Slope Angle Degrees 40
Metal Price
$/Troy oz $/g Breakeven g/t Internal g/t 5.00 0.1608 81.6 64.7 6.00 0.1929 67.0 53.2 7.00 0.2251 56.9 45.2 8.00 0.2572 49.4 39.2 9.00 0.2894 43.6 34.7 10.00 0.3215 39.1 31.1 11.00 0.3537 35.4 28.1 12.00 0.3858 32.3 25.7 13.00 0.4180 29.8 23.7 14.00 0.4501 27.6 21.9 15.00 0.4823 25.7 20.4 16.00 0.5144 24.1 19.1

Rev: 0 Date: October 2010 J07.82.13.02: Feasibility Study – NI 43-101 Technical Report – Santa Ana Project 66
Figure 17.2 Final Pit Configuration
Figure 17.2 does not illustrate the optimized geotechnical design for the waste rock facility as presented in Section 23.4.7. The waste storage area shown was used only for storage and hauling distance accounting.

Rev: 0 Date: October 2010 J07.82.13.02: Feasibility Study – NI 43-101 Technical Report – Santa Ana Project 67
Table 17.6 Mine Production Schedule, Santa Ana Feasibility Study
Time Period
Cutoff (g/t)
Crusher Feed Low Grade at 27g Waste
(kt) Total
Material (kt) Ore
(kt) Silver (g/t)
To Stockpile
(kt) Silver (g/t)
Preproduction Q1 23 23
Preproduction Q2 34 37 52.6 16 29.9 599 652
Preproduction Q3 34 182 49.3 67 30.5 1,260 1,509
Preproduction Q4 34 196 49.0 100 30.4 1,115 1,411
Y1, Q1 34 721 51.8 254 30.7 2,085 3,060 Y1, Q2 34 791 56.4 269 30.5 2,000 3,060 Y1, Q3 34 832 62.1 219 30.5 2,009 3,060 Y1 Q4 34 841 66.5 173 30.4 2,046 3,060
Y2 30 3,600 60.5 329 28.4 8,571 12,500 Y3 32 3,600 59.1 494 29.6 8,606 12,700 Y4 33 3,600 57.6 953 30.0 8,147 12,700 Y5 28 3,600 59.0 90 27.5 8,550 12,240 Y6 24 3,600 55.6 7,725 11,325 Y7 24 3,600 53.1 7,552 11,152 Y8 24 3,600 49.7 5,844 9,444 Y9 24 3,600 47.0 4,706 8,306
Y10 24 1,713 44.8 1,789 3,502 Total 34,113 55.0 2,964 29.9 72,627 109,704

Rev: 0 Date: October 2010 J07.82.13.02: Feasibility Study – NI 43-101 Technical Report – Santa Ana Project 68
Table 17.7 Process Schedule with Stockpile Reclaim
Time Period
Cutoff (g/t)
Crusher Feed Ore
(kt) Silver (g/t)
Preproduction Q1
Preproduction Q2 34 Preproduction Q3 34 Preproduction Q4 34
Y1, Q1 34 900 51.3 Y1: 3,600 kt
at 58.4 g/t
Y1, Q2 34 900 55.6 Y1, Q3 34 900 61.1 Y1 Q4 34 900 65.4
Y2 30 3,600 60.5
Y3 32 3,600 59.1 Y4 33 3,600 57.6 Y5 28 3,600 59.0 Y6 24 3,600 55.6 Y7 24 3,600 53.1 Y8 24 3,600 49.7 Y9 24 3,600 47.0
Y10 24 3,600 37.0 Reclaim Low-grade Stockpile Y11 1,077 29.9
Total 37,077 53.0
17.3 Mineral Resources Estimated mineral resources were based on a larger floating cone that was generated at a silver price of $16.00 /oz. Seventeen percent lower process and mining costs were utilized in the resource cones as compared with those on Table 17.4. Slope angles and process recoveries were unchanged from those on Table 17.5. The internal cutoff grade for the input economics was 15 g/t.
The resource cone did allow economic credit for inferred mineralization. However, no economic analysis or credit for inferred mineralization is included anywhere in this feasibility study.
Once the resource floating cone was established, the incremental resource mineralization between the mineral reserve and the resource cone was calculated by subtraction. Consequently, Table 17.8 summarizes the mineral resources that are in addition to mineral reserves and do not include the mineral reserves.

Rev: 0 Date: October 2010 J07.82.13.02: Feasibility Study – NI 43-101 Technical Report – Santa Ana Project 69
Table 17.8 Mineral Reserves and Mineral Resources
Mineral Reserves Cutoff Grade, variable 27 to 24 g/t Silver by year
Category kt Silver (g/t)
Lead (%)
Zinc (%)
Copper (%)
Contained Silver
Million ozs Measured 8,951 57.6 0.37 0.66 0.02 16.6 Indicated 28,126 51.5 0.33 0.55 0.02 46.6
Measured + Indicated 37,077 53.0 0.34 0.58 0.02 63.2
Mineral Resource in Addition to Reserves Cutoff Grade = 15 g/t Silver
Measured 13,386 34.6 0.30 0.51 0.02 14.9 Indicated 51,337 35.1 0.30 0.50 0.02 57.9
Measured + Indicated 64,723 35.0 0.30 0.50 0.02 72.8
Inferred 21,632 40.6 0.32 0.49 0.02 28.2
Zinc, lead and copper are reported because they are contained. Zinc, lead and copper do not contribute economic benefit.
Rev: 0 Date: October 2010 J07.82.13.02: Feasibility Study – NI 43-101 Technical Report – Santa Ana Project 70
18 Other Relevant Data and Information No additional information or explanation is necessary to make this Technical Report understandable and not misleading.
Details of the Feasibility Study can be found in Section 23.

Rev: 0 Date: October 2010 J07.82.13.02: Feasibility Study – NI 43-101 Technical Report – Santa Ana Project 71
19 Interpretations and Conclusions Ausenco Vector has relied on John Marek, the QP for sections 7 through 14 of this Technical Report, for the detailed review of the geology, mineralization, sampling and block modelling presented in this Technical Report on the Feasibility Study of the Santa Ana Project. The assumptions and resulting data input have been completed in accordance with acceptable industry standards.
At the Feasibility-level, the Santa Ana project reflects:
• Positive economics with excellent exposure to up-side silver prices. For example, a change in silver price from the assumed $14.50 per ounce used in the FS to the London closing on October 6, 2010 of $22.92 decreases the Capital Payback period from 3.4 to 1.4 years and increases the NPV and IRR by approximately 300% and 175%, respectively;
• Well-defined resources open to expansion and conversion to reserves;
• Favorable infrastructure; heap leach, power and access;
• Available local water supply;
• Well-defined permitting path; and
• Local community acceptance.
The key results and highlights of this study include:
• The Santa Ana project can be in production by the later part of 2012;
• Proven and Probable Mineral Reserves containing 63.2 million ounces of silver at Santa Ana;
• Santa Ana Project pre-tax NPV of $85.3 million at a 5% discount rate and IRR of 25.3% at $14.50 per ounce silver. After tax net present value of $66.5 million and IRR 21.8%;
• 11 year mine life producing 44.2 million ounces of silver;
• Average annual saleable silver production of 4.6 million ounces per year for the first 6 years;
• Cash cost of $9.02 per ounce silver for the 11 years LOM;
• Capital costs of $68.8 million with Capital Payback in 3.4 years at $14.50/ oz Ag.;
• At $22.92 per ounce silver the project would have a pre-tax IRR of 70.2% and an NPV at 5% of $341 million. On an after tax basis the IRR would be 52.6% and NPV $232 million;
• At current silver prices of $22.92 per ounce, free cash flow estimated at $46 million per year for the first 6 years with a 1.4 year pay back;
• Numerous upside opportunities being explored including increase of silver recovery through finer crushing, reductions in cash costs, and an extended mine life plan to include an additional 35.7 million ounces silver; and
• The Santa Ana deposit remains open, mainly at depth and to the north where the northernmost holes contain up to 22 meters @ 124 g/t Ag from surface.

Rev: 0 Date: October 2010 J07.82.13.02: Feasibility Study – NI 43-101 Technical Report – Santa Ana Project 72
20 Recommendations The authors of this Technical Report on the Feasibility of the Santa Ana Project recommend proceeding with detailed engineering and permitting.
The study has identified areas of opportunities that will be analysed in later engineering studies and test work:
Reduce the crush size to improve recovery and leaching rate. Produce “trade-off” studies to examine required additional capital expenditures and crushing costs versus benefits in the form of reduced cash costs per ounce of silver.
Investigate reducing the process plant footprint to reduce capital costs; and
As the sensitivity analysis shows, the project is sensitive to operating costs. BCM and its consultants will explore different ways to reduce operating costs mainly by reducing reagent consumption in the process during operations.

Rev: 0 Date: October 2010 J07.82.13.02: Feasibility Study – NI 43-101 Technical Report – Santa Ana Project 73
21 References The following documents were utilized in the development of this Technical Report.
Independent Mining Consultants, Inc., 2008: National Instrument 43-101 Technical Report, Santa Ana Resource Estimate, prepared for Bear Creek Mining Corporation, 12 May 2008 and amended in July of 2008.
Estudio Grau Abogados, letter outlining the property ownership at Santa Ana, prepared for Bear Creek Mining Corporation, 19 October, 2010.
Ausenco Vector, 2010: Proyecto Santa Ana Informe de Ingenieria – Estudio de Factibilidad Definitiva, prepared for Bear Creek Mining Corporation, 2010-Pending.
Ausenco Vector, 2010: Santa Ana Definitive Feasibility Study Pit Slope Design, prepared for Bear Creek Mining Corporation, 2010-Pending.
Ausenco Vector, 2010: Santa Ana Definitive Feasibility Study Seismic Hazard Study, prepared for Bear Creek Mining Corporation, 2010-Pending.
Ausenco Vector, 2010: Definitive Feasibility Study Hydrological and Hydrogeological Report Santa Ana Project, prepared for Bear Creek Mining Corporation, 2010-Pending.
Ausenco Vector, 2010: Estudio de Drenaje Acido de Roca, Proyecto Santa Ana, prepared for Bear Creek Mining Corporation, 2010-Pending.
Ausenco Vector, 2010: Estudio de Impacto Ambiental Proyecto Santa Ana, prepared for Bear Creek Mining Corporation, 2010-Pending.
Heap Leaching Consulting S.A.C., 2010: Estudio de Factibilidad para el Procesamiento Metalurgico de 10,000 MTPD Proyecto Santa Ana, Procesos y Facilidades, prepared for Ausenco Vector, 14 August 2010.
Heap Leaching Consulting S.A.C., 2010: Estudio de Factibilidad para el Laboratorio de Analisis Quimico, Proyecto Santa Ana, Procesos y Facilidades, prepared for Ausenco Vector, 2010-Pending.
Heap Leaching Consulting S.A.C., 2010: Estudio de Factibilidad para la Planta de Tratamiento de Aguas Acidas, Proyecto Santa Ana, Procesos y Facilidades, prepared for Ausenco Vector, 2010-Pending.
Heap Leaching Consulting S.A.C., 2010: Estudio de Factibilidad para Agua Potable, Red de Alcantarillado y Tratamiento de Aguas Residuales, Proyecto Santa Ana, Procesos y Facilidades, prepared for Ausenco Vector, 2010-Pending.
Heap Leaching Consulting S.A.C., 2010: Estudio de Factibilidad para Servicios Complimentarios, Proyecto Santa Ana, Procesos y Facilidades, prepared for Ausenco Vector, 2010-Pending.
Samuel Engineering, Inc., 2010: Santa Ana Water Supply Pipeline Study, prepared for Ausenco Vector, 2010-Pending.
Rev: 0 Date: October 2010 J07.82.13.02: Feasibility Study – NI 43-101 Technical Report – Santa Ana Project 74
Promotora de Proyectos S.A.C., 2010: Estudio de Factibilidad, Línea de Transmisión 60 kV Subestación Pomata – Subestación Santa Ana y Subestaciones, prepared for Ausenco Vector, 2010-Pending.

Rev: 0 Date: October 2010 J07.82.13.02: Feasibility Study – NI 43-101 Technical Report – Santa Ana Project 75
22 Date and Certificates of Authors The date of this report is: 21st October 2010.
The certificates of John Marek, Scott Elfen, Sean Currie, Deepak Malhotra and Thomas Wohlford follow. Mr. Wohlford visited the site most recently in July 2010. The other authors have relied on his observations during that site visit to augment and confirm the current status of the deposit.


Rev: 0 Date: October 2010 J07.82.13.02: Feasibility Study – NI 43-101 Technical Report – Santa Ana Project 82
23 Additional Requirements for Technical Reports on Development Properties
23.1 Mining
23.1.1 Summary Santa Ana is planned to be mined using conventional open pit hard rock methods to deliver 3,600 kt of ore per year (10,000 tpd) to the crusher for heap leach processing. The total material movement at the mine is planned to be around 12,500 kt per year (34,725 tpd) for years 1 through 5. After that time the waste stripping requirements begin to taper down.
Mining will utilize 5m benches. Drilling and blasting is planned for all material to be moved. Blast hole sampling and assaying will be required for ore control within the pit. Bear Creek currently plans to utilize a mining contractor at Santa Ana. An estimate of contract mining cost has been developed for this study based on the direct operating costs of standard mining equipment combined with contractor equipment ownership costs and profit margin.
The major mine equipment that was the basis of the study includes:
• 3 - Blast Hole Drills with 45,000lb pull down and 6 inch bits;
• 3 - 8.6 cubic meter front end loaders;
• Up to 14 - 63 metric tonne trucks; and
• Appropriate mine auxiliary and support equipment is also planned and scheduled.
The mine production schedule is summarized on Table 23.1. The annual mine plan and waste storage drawings are summarized on Tables 23.6 through 23.16. Three quarterly mine plans were developed for the preproduction period and Year 1 of the mine plan, however, only the annual plans are presented in this text for brevity.
23.1.2 Introduction Independent Mining Consultants, Inc. developed the mine plan, equipment requirements, capital costs, and contractor operating costs. Preproduction stripping costs were calculated as part of the operating costs; however, they have been treated as capital costs within the project financial analysis.
The process cost and recovery input information to the mine plan was provided to IMC by Bear Creek personnel working with the process testing and design team members.

Rev: 0 Date: October 2010 J07.82.13.02: Feasibility Study – NI 43-101 Technical Report – Santa Ana Project 83
Table 23.1A Mine Production Schedule
Time Period
Crusher Feed Low Grade at
27 g Total
Cutoff Ore Silver To Stockpile Silver Waste Material
(g/t) (kt) (g/t) (kt) (g/t) (kt) (kt) Preproduction
Q1 23 23
Preproduction Q2 34 37 52.6 16 29.9 599 652
Preproduction Q3 34 182 49.3 67 30.5 1,260 1,509
Preproduction Q4 34 196 49.0 100 30.4 1,115 1,411
Y1, Q1 34 721 51.8 254 30.7 2,085 3,060 Y1, Q2 34 791 56.4 269 30.5 2,000 3,060 Y1, Q3 34 832 62.1 219 30.5 2,009 3,060 Y1, Q4 34 841 66.5 173 30.4 2,046 3,060
Y2 30 3,600 60.5 329 28.4 8,571 12,500 Y3 32 3,600 59.1 494 29.6 8,606 12,700 Y4 33 3,600 57.6 953 30.0 8,147 12,700 Y5 28 3,600 59.0 90 27.5 8,550 12,240 Y6 24 3,600 55.6
7,725 11,325
Y7 24 3,600 53.1
7,552 11,152 Y8 24 3,600 49.7
5,844 9,444
Y9 24 3,600 47.0
4,706 8,306 Y10 24 1,713 44.8
1,789 3,502
Total
34,113 55.0 2,964 29.9 72,627 109,704

Rev: 0 Date: October 2010 J07.82.13.02: Feasibility Study – NI 43-101 Technical Report – Santa Ana Project 84
Table 23.1B Process Schedule with Stockpile Reclaim
Time Period
Crusher Feed Cutoff Ore Silver (g/t) (kt) (g/t)
Preproduction Q1
Preproduction Q2 34
Preproduction Q3 34
Preproduction Q4 34
Y1, Q1 34 900 51.3 Y1, Q2 34 900 55.6 Y1, Q3 34 900 61.1 Y1, Q4 34 900 65.4
Y2 30 3,600 60.5 Y3 32 3,600 59.1 Y4 33 3,600 57.6 Y5 28 3,600 59.0 Y6 24 3,600 55.6 Y7 24 3,600 53.1 Y8 24 3,600 49.7 Y9 24 3,600 47.0
Y10 24 3,600 37.0 Y11 1,077 29.9 Total 37,077 53.0
23.1.3 Project Production Rate Consideration Alternative production rates were evaluated by IMC and Bear Creek during the PEA evaluation in 2009. No further evaluation of production rate alternatives was required at this time. The feasibility mine plans focus on producing 10,000 tpd of ore to the crusher.
23.1.4 Economic Pit Limits As discussed in Section 17, the floating cone algorithm was used as a guide to the development of the final pit and mine pushback designs. Economic and process recovery information that was used as input to the mine design cones was summarized on Table 17.4.
The mining cost was based on the results from the PEA study including the haulage between the crushing plant and the heap leach. Processing costs were provided by Bear Creek based on work from the process contractor (HLC, 2010). The slope angles for the cones were based on the Ausenco Vector Pit Slope Design report (Ausenco Vector, 2010) with a reduction in slope angle to reflect the impacts of haul roads in the cones. These parameters and the resulting cone geometries

Rev: 0 Date: October 2010 J07.82.13.02: Feasibility Study – NI 43-101 Technical Report – Santa Ana Project 85
were used to guide phase design and final pit design. They are not intended to represent engineered cost and stability estimates or to be used for financial analysis.
Figure 23.1 illustrates the cone produced at the silver price of $13.00/oz. This cone was used as a guide to design the final pit.
Cones were generated for silver prices ranging from $5.00/oz to $15.00/oz. Cones run at silver prices lower than $13.00/oz. were used to determine the regions containing the most valuable material. Figure 23.2 shows nested cones between $8.00 /oz and $13.00/oz silver sliced at the 4200 bench elevation.

Rev: 0 Date: October 2010 J07.82.13.02: Feasibility Study – NI 43-101 Technical Report – Santa Ana Project 86
Figure 23.1 Floating Cone Guide to Final Pit Design (at $13.00 Ag)

Rev: 0 Date: October 2010 J07.82.13.02: Feasibility Study – NI 43-101 Technical Report – Santa Ana Project 87
Figure 23.2 Nested Cones on the 4200 Level

Rev: 0 Date: October 2010 J07.82.13.02: Feasibility Study – NI 43-101 Technical Report – Santa Ana Project 88
23.1.5 Phase Designs A total of six phases were designed for the development of a practical mine production schedule. The sequence of the phase geometries corresponds with cones of increasing silver price allowing the more valuable material to be mined earlier in the mine life. Phases were designed with proper equipment operating room, working geometries and access roads.
The following criteria were followed in designing the phases:
• Bench Height: 5 meters
• Interramp Slope Angle: 40 degrees
• Haul Road Width: 21 meters
• Haul Road Gradient: 10 percent
• Minimum pushback width: ~100 meters
A minimum pushback width of 100 meters was chosen to provide adequate working room and to allow for access to multiple ore zones on a single bench.
In order to minimize preproduction stripping and at the same time provide adequate ore on a single bench once production begins, the size of Phase 1 was adjusted to contain a year and a half of ore. This also provides an ore cushion if there is a delay in opening the subsequent phase.
Figure 23.3 illustrates the ultimate pit design. It can be compared with Figure 23.1, the floating cone at $13.00/oz silver.
Figure 23.4 shows the phases sliced at the 4200m bench level to be compared with the cones sliced at the 4200 level in Figure 23.2.

Rev: 0 Date: October 2010 J07.82.13.02: Feasibility Study – NI 43-101 Technical Report – Santa Ana Project 89
Figure 23.3 Ultimate Pit Configuration

Rev: 0 Date: October 2010 J07.82.13.02: Feasibility Study – NI 43-101 Technical Report – Santa Ana Project 90
Figure 23.4 Pit Phase at the 4200 m Bench

Rev: 0 Date: October 2010 J07.82.13.02: Feasibility Study – NI 43-101 Technical Report – Santa Ana Project 91
23.1.6 Mine Plan and Production Schedules The mine production schedule was developed from the previously described model and mine phase designs. The schedule was developed to deliver 3,600 kt of ore per year (10,000 tpd) to two semi-mobile crushers and then to a leach pad. Pre-stripping of later phases is scheduled simultaneously with mining of ore in earlier phases to ensure sustained ore release to the crushers throughout the mine life.
Table 23.1 summarizes the scheduled movement of ore, low-grade ore, and waste by year over the mine life. Pre-production and the first year of production are broken out into quarters to show greater detail. A graphic of the mine schedule is presented in the first graph of Figure 23.5. The remaining graphs show the feed to the mill and contained/recovered silver.

Rev: 0 Date: October 2010 J07.82.13.02: Feasibility Study – NI 43-101 Technical Report – Santa Ana Project 92
Figure 23.5 Graphic Summary Mine Production Schedule

Rev: 0 Date: October 2010 J07.82.13.02: Feasibility Study – NI 43-101 Technical Report – Santa Ana Project 93
23.1.6.1 Description of the Schedule For the first five years of mine life, the cutoff grade for ore has been raised above the breakeven cutoff of 30 g/t. The cutoff for each year in the schedule was established to maximize the project’s return on investment.
The cutoff strategy produces an improved net present value for the project compared to other cutoff strategies that were considered. To evaluate the schedule, the same economics were used as for running floating cones that were shown on Table 17.5. When creating the schedule, loader capacities were also considered in order to prevent scheduling material movement rates that required fractional pieces of equipment.
The cutoff grade for low grade material in the first five years is increased from the internal cutoff of 24 g/t to 27 g/t to account for an added $0.88/tonne cost to rehandle material from the low-grade stockpile to the crusher. Ore from the low-grade stockpile is sent to the crusher during year 10 and year 11.
The mine schedule shows little material movement in the first quarter of preproduction. This quarter is set aside for the construction of mine access roads. The ore that is mined in stripping during the next three quarters of preproduction is stockpiled near the crushers to be combined with ore mined in year one to provide the crushers with a constant feed of 10,000 tpd during Year 1.
During preproduction, both Phase 1 and Phase 2 are opened in an effort to release enough ore to sustain the crusher feed in Year 1. These two phases are not adjacent to each other so the initial year appears as two separate pit operations.
Figures 23.6 through 23-16 illustrate the mine and waste storage plan.

Rev: 0 Date: October 2010 J07.82.13.02: Feasibility Study – NI 43-101 Technical Report – Santa Ana Project 94
Figure 23.6 Phase Open Pit at the End of Preproduction

Rev: 0 Date: October 2010 J07.82.13.02: Feasibility Study – NI 43-101 Technical Report – Santa Ana Project 95
Figure 23.7 Phase Open Pit End Year 1

Rev: 0 Date: October 2010 J07.82.13.02: Feasibility Study – NI 43-101 Technical Report – Santa Ana Project 96
Figure 23.8 Phase Open Pit End Year 2

Rev: 0 Date: October 2010 J07.82.13.02: Feasibility Study – NI 43-101 Technical Report – Santa Ana Project 97
Figure 23.9 Phase Open Pit End Year 3

Rev: 0 Date: October 2010 J07.82.13.02: Feasibility Study – NI 43-101 Technical Report – Santa Ana Project 98
Figure 23.10 Phase Open Pit End Year 4

Rev: 0 Date: October 2010 J07.82.13.02: Feasibility Study – NI 43-101 Technical Report – Santa Ana Project 99
Figure 23.11 Phased Open pit End Year 5

Rev: 0 Date: October 2010 J07.82.13.02: Feasibility Study – NI 43-101 Technical Report – Santa Ana Project 100
Figure 23.12 Phase Open Pit End Year 6
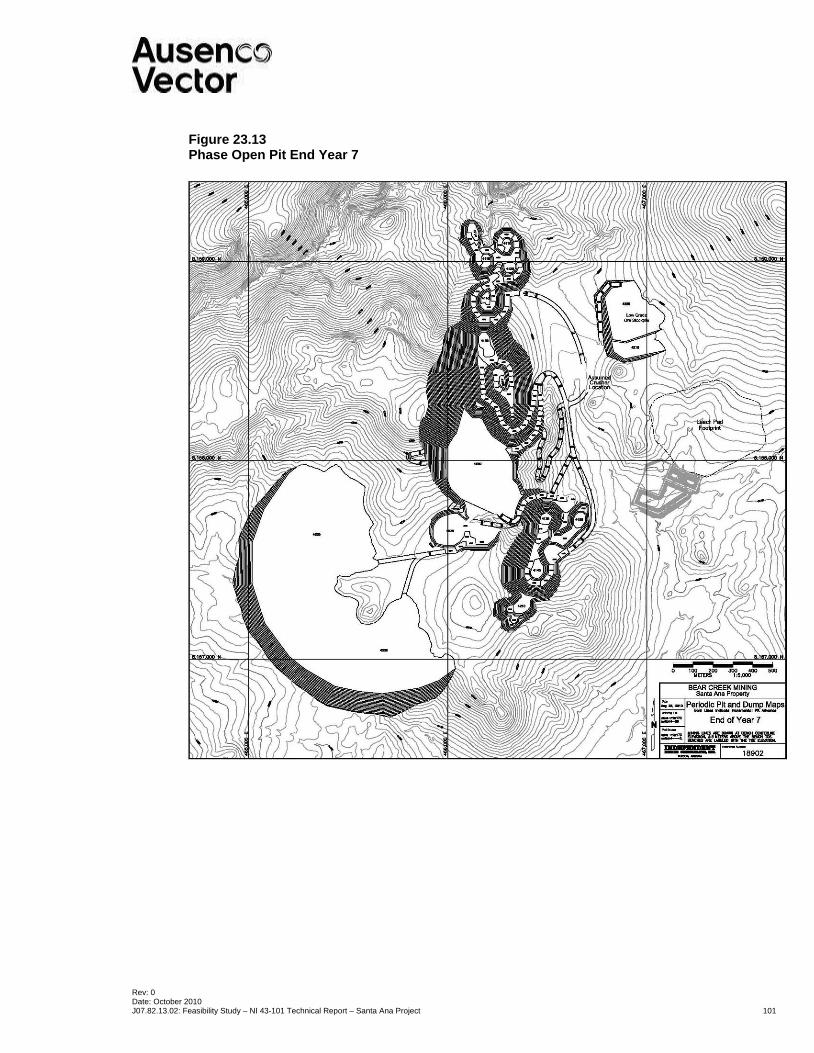
Rev: 0 Date: October 2010 J07.82.13.02: Feasibility Study – NI 43-101 Technical Report – Santa Ana Project 101
Figure 23.13 Phase Open Pit End Year 7

Rev: 0 Date: October 2010 J07.82.13.02: Feasibility Study – NI 43-101 Technical Report – Santa Ana Project 102
Figure 23.14 Phase Open Pit End Year 8

Rev: 0 Date: October 2010 J07.82.13.02: Feasibility Study – NI 43-101 Technical Report – Santa Ana Project 103
Figure 23.15 Phase Open Pit End Year 9

Rev: 0 Date: October 2010 J07.82.13.02: Feasibility Study – NI 43-101 Technical Report – Santa Ana Project 104
Figure 23.16 Phase Open Pit End Year 10

Rev: 0 Date: October 2010 J07.82.13.02: Feasibility Study – NI 43-101 Technical Report – Santa Ana Project 105
23.1.6.2 Alternative Mine Schedules The Santa Ana pit design and production schedule was developed to maximize the project return with $13.00 / oz silver. Changes in the silver price could change the mine strategy to match the conditions.
A prolonged down turn in the silver price would result in a shorter mine life with a cash cost per ounce around $8.00/oz silver. A sustained long term price of around $19.00/ounce would result in an extension of the mine life to take advantage of the substantial tonnage of lower grade material that surrounds the Santa Ana feasibility pit.
All three of the mine schedules: 1) Feasibility, 2) Low Tonnage, and 3) Large Tonnage utilized the same pushback designs for the first 3 pushbacks. Consequently, the decision to change the strategic course of the mine can be made as late as year 2 or 3. Consequently, implementation of the base case Feasibility Schedule on Table 23.1 can be modified after start up to deal with a range of economic conditions. The mine plan provides substantial flexibility to deal with both positive and negative changes in the silver price.
Table 23.2 summarizes the Low Tonnage, low cost pit that could be utilized in a low silver price condition.
Table 23.3 summarizes the Large Tonnage, long life pit option should silver prices enjoy a prolonged up turn.
Table 23.2A Production Schedule for Potential Low Tonnage Pit
Time Period
Cutoff (g/t)
Crusher Feed Low Grade at 27 g Waste
(kt) Total
Material Ore (kt)
Silver (g/t)
To Stockpile (kt)
Silver (g/t)
Preproduction 30 495 45.0
No Low Grade Stockpile
3,105 3,600 Y1 30 3,105 55.4 7,945 11,050 Y2 30 3,600 62.1 7,450 11,050 Y3 30 3,600 56.5 8,210 11,810 Y4 30 3,600 52.5 6,676 10,276 Y5 30 3,600 61.0 5,632 9,232 Y6 30 1,971 65.7 3,420 5,391
Total
19,971 58.1 42,438 62,409

Rev: 0 Date: October 2010 J07.82.13.02: Feasibility Study – NI 43-101 Technical Report – Santa Ana Project 106
Table 23.2B Process Schedule with Stockpile Reclaim
Time Period
Cutoff (g/t)
Crusher Feed Ore (kt)
Silver (g/t)
Preproduction 30
Y1 30 3,600 54.0 Y2 30 3,600 62.1 Y3 30 3,600 56.5 Y4 30 3,600 52.5 Y5 30 3,600 61.0 Y6 30 1,971 65.7
Total 19,971 58.1
Table 23.3A Production Schedule for Potential Large Tonnage Pit
Time Period
Cutoff (g/t)
Crusher Feed Low Grade at 27g Waste
(kt) Total
Material (kt)
Ore (kt)
Silver (g/t)
To Stockpile
(kt) Silver (g/t)
Preproduction 30 887 53.8 252 24.3 1,884 3,023 Y1 30 2,713 56.5 650 24.7 7,962 11,325 Y2 30 3,600 56.5 1,551 24.5 8,439 13,590 Y3 30 3,600 60.2 1,116 24.7 8,874 13,590 Y4 28 3,600 59.6 726 23.4 9,264 13,590 Y5 27 3,600 55.9 913 22.9 9,077 13,590 Y6 27 3,600 51.1 939 22.9 9,051 13,590 Y7 27 3,600 51.8 839 22.9 9,151 13,590 Y8 27 3,600 51.7 909 23.2 7,776 12,285 Y9 25 3,600 45.0 831 22.2 6,894 11,325
Y10 20 3,600 45.1 64 19.5 5,396 9,060 Y11 19 3,600 46.6 5,460 9,060 Y12 19 3,600 41.0 5,460 9,060 Y13 19 3,600 38.9 7,234 10,834 Y14 19 3,600 40.3 8,905 12,505 Y15 19 3,600 42.6 6,572 10,172 Y16 19 3,600 45.7 4,855 8,455 Y17 19 729 45.3 1,127 1,856 Total
58,329 49.2 8,790 23.6 123,381 190,500

Rev: 0 Date: October 2010 J07.82.13.02: Feasibility Study – NI 43-101 Technical Report – Santa Ana Project 107
Table 23.3B Process Schedule with Stockpile Reclaim
Time Period
Cutoff (g/t)
Crusher Feed Ore (kt)
Silver (g/t)
Preproduction 30
Y1 30 3,600 55.8 Y2 30 3,600 56.5 Y3 30 3,600 60.2 Y4 28 3,600 59.6 Y5 27 3,600 55.9 Y6 27 3,600 51.1 Y7 27 3,600 51.8 Y8 27 3,600 51.7 Y9 25 3,600 45.0
Y10 20 3,600 45.1 Y11 19 3,600 46.6 Y12 19 3,600 41.0 Y13 19 3,600 38.9 Y14 19 3,600 40.3 Y15 19 3,600 42.6 Y16 19 3,600 45.7 Y17 19 3,600 28.0 Y18 3,600 23.6 Y19 2,319 23.6 Total 67,119 45.8
23.1.7 Waste and Stockpile Storage Waste from the mine is sent to a single waste dump southwest of the pit while low-grade material is sent to a low-grade stockpile northeast of the pit during the first five years of production.
The time sequence illustrations of the mine and material storage plans are shown in Figures 23.6 through 23.16. They illustrate the material storage as described in the following paragraphs.
The waste storage area shown the Figure 23.6 to 23.16 annual maps do not reflect the final reclamation geometry as illustrated later in Section 23.21. The waste dumps on the mine plan drawings were used to calculate storage volumes and hauling distances.
Uneconomic rock mined from the open pit is hauled to the storage area and dumped from a constant elevation of 4255 meters. It is constructed in a semicircular shape by increasing the radius with the addition of waste. This geometry results in the shortest haul distance possible over the mine life. At the crest, the dump has a final radius of 713 meters and a maximum elevation for this

Rev: 0 Date: October 2010 J07.82.13.02: Feasibility Study – NI 43-101 Technical Report – Santa Ana Project 108
single lift case is 85 meters. Prior to construction of the dump, all top soil is to be removed from the footprint of the toe to be used in reclamation.
The low-grade stockpile is stacked from the bottom up in 5 meter lifts. The first lift is dumped at the 4190 meter elevation and the crest of the final lift is at 4220 meters. Construction of the dump begins in preproduction and ends in year five. The stockpile is re-mined in years ten and eleven to be sent to the crusher.
23.1.8 Mine Operations and Equipment Mine mobile equipment was selected to meet the production requirements as outlined on Table 23.4. Mine equipment was selected on the basis of establishing an efficient, safe, and low cost mine operation. Bear Creek currently contemplates using a mining contractor and as such, the selection of the mining equipment fleet will actually be established by that contractor.
The approach applied to this study was to select the most efficient fleet as if the project were to be owner operated. The costs of operating that equipment were then converted to contractor costs including ownership and profit markup.
Mining is schedule for 360 days/year, and 3 shifts per day of 8 hours duration. Four crews will be required to maintain the shift schedule. The ramp up of scheduled shifts during preproduction is planned as follows:
• Preproduction Quarter 1: 60 Shifts/Qtr
• Preproduction Quarters 2 through 4: 180 Shifts/Qtr, 2 Shifts/day
• Years 1 through 10: 1080 Shifts/Year, 3 Shifts/day
It has been assumed that there will be 7 hours worked during a shift with a standard efficiency of 50 minutes per hour resulting in 350 operating minutes per shift. This term is sometimes referred to as effective time per shift. All equipment productivities reported herein are based on 350 operating minutes per shift.
The in-place material densities were presented in Section 17 Mineral Resources and Mineral Reserve Estimates. A 40% swell factor and 2.5% in-situ moisture content has been used for all equipment calculations. The material will re-compact slightly on the waste dumps so that a 30% swell from in-situ has been used for waste dump design.
There are two components or functions that will be completed with the mine equipment.
• Mining from the pit and delivery of ore to the crusher, low grade to the stockpile, and waste to the waste storage facility; and
• Haulage of the crushed material from the crusher to the heap leach pad and spreading of the material with a dozer on the heap leach pad.
The following discussion of equipment addresses the open pit mining.
Drilling will be completed with conventional track mounted blasthole drills. Pull down levels of 45,000 lbs (100,000 kg) were judged to be appropriate for the material at Santa Ana with bit diameters of 6 inches (15.25 cm). Drillholes will be sampled and assayed for ore control Holes will be loaded with ANFO and blasted prior to loading.

Rev: 0 Date: October 2010 J07.82.13.02: Feasibility Study – NI 43-101 Technical Report – Santa Ana Project 109
Loading is planned to utilize front-end loaders with 8.6 cubic meter buckets. Loaders were selected to match the production requirements and to utilize their mobility when dealing with multiple pushbacks. The front-end loaders will also be used for auxiliary functions including minor rehandling at the crusher stockpile and mine road construction etc.
Haulage is planned with 63t haul trucks for all material.
Track dozers are 310 HP (D8 Class) units and graders are 14ft moldboard (Cat 14m class). A 50,000 liter water truck is provided for dust suppression. A drill for pioneering and secondary breakage is provided along with a 2 cubic meter excavator for general mine support.
Other minor support equipment is also provided in the equipment list. The minor items include but are not limited to items such as: lube and fuel trucks, light plants, pickups, blasting trucks, and loader-tire handlers.
Once the ore has been crushed, it will be delivered by conveyor to a haul truck for transport to the heap leach pad. A front end loader will not be required to load the leach trucks. The same 63t haul trucks will be used for this task. For most years, 2 or 3 additional trucks will be working to deliver material to the heap.
A D8 Class dozer equipped with a ripper is allocated to the leach pad for spreading, ripping and preparing the material on the pads.
Table 23.4 summarizes the major mine equipment. The top of the table presents the mine equipment, and the lower portion summarizes the equipment for the heap leach haul and spreading.
The estimated contractor personnel to operate and maintain the equipment is summarized on Table 23.5. Contractor supervisory staff is also shown on the table.
The owners supervisory, engineering, and geology staff at the mine are not included in the personnel list on Table 23.5 because they are included in the owner’s cost.

Rev: 0 Date: October 2010 J07.82.13.02: Feasibility Study – NI 43-101 Technical Report – Santa Ana Project 110
Table 23.4 Mine Major Equipment Fleets for Development of Contractor Costs
Mine Major Equipment Fleet On Hand for Primary Mine Operations
Equipment Type ppq1 ppq2 ppq3 ppq4 yr1q1 yq1q2 yr1q3 yr1q4 2 3 4 5 6 7 8 9 10 11Blast Hole Drill, 45,000 lb pull down 1 2 3 3 3 3 3 3 3 3 3 3 3 3 3 3 3 0Wheel Loader, 8.6 cu meter 1 1 2 2 3 3 3 3 3 3 3 3 3 3 2 2 2 2Haul Truck, 63 tonne 1 3 6 7 9 9 9 9 10 11 11 11 11 11 11 11 11 11310 HP Track Dozer 2 3 3 3 3 3 3 3 3 3 3 3 3 3 3 3 3 314 FT Motor Grader 1 1 1 1 2 2 2 2 2 2 2 2 2 2 2 2 2 250000 Ltr Water Trk 1 1 1 1 1 1 1 1 1 1 1 1 1 1 1 1 1 1Atlas Copco ROC D7 Drill 1 1 1 1 1 1 1 1 1 1 1 1 1 1 1 1 1 12 Cu Yd Excavator 1 1 1 1 1 1 1 1 1 1 1 1 1 1 1 1 1 1TOTAL 9 13 18 19 23 23 23 23 24 25 25 25 25 25 24 24 24 21
Mine Major Equipment Fleet On Hand for Heap Leach Loading, Hauling, Dozing, and Ripping
Equipment Type ppq1 ppq2 ppq3 ppq4 yr1q1 yq1q2 yr1q3 yr1q4 2 3 4 5 6 7 8 9 10 11
Haul Truck, 63 tonne 0 0 0 0 2 2 2 2 2 2 2 3 3 3 3 3 3 3310 HP Track Dozer 0 0 0 0 1 1 1 1 1 1 1 1 1 1 1 1 1 1TOTAL 0 0 0 0 3 3 3 3 3 3 3 4 4 4 4 4 4 4Notes: Replacements for haul trucks have considered the combined fleet from both the mine and the leach haul Contractors will utilize alternative equipment, The fleet and equipment types above are recommendations for an efficient operation

Rev: 0 Date: October 2010 J07.82.13.02: Feasibility Study – NI 43-101 Technical Report – Santa Ana Project 111
Table 23.5 Contractor Manpower Requirements
Contractor Salaried Staff Labor Requirements
JOB TITLE ppq1 ppq2 ppq3 ppq4 yr1q1 yq1q2 yr1q3 yr1q4 2 3 4 5 6 7 8 9 10 11Secretaries / Clerks 1 1 1 1 1 1 1 1 1 1 1 1 1 1 1 1 1 1Mine General Foreman 1 1 1 1 1 1 1 1 1 1 1 1 1 1 1 1 1 1Mine Shift Foreman 4 4 4 4 4 4 4 4 4 4 4 4 4 4 4 4 4 4Drill & Blast Foreman 1 1 1 1 1 1 1 1 1 1 1 1 1 1 1 1 1 1Maintenance General Foreman 1 1 1 1 1 1 1 1 1 1 1 1 1 1 1 1 1 1Maintenance Foreman 4 4 4 4 4 4 4 4 4 4 4 4 4 4 4 4 4 4TOTAL STAFF PERSONNEL 12 12 12 12 12 12 12 12 12 12 12 12 12 12 12 12 12 12
Hourly Labor Requirements for Primary Mining Operations
JOB TITLE ppq1 ppq2 ppq3 ppq4 yr1q1 yq1q2 yr1q3 yr1q4 2 3 4 5 6 7 8 9 10 11MINE OPERATIONS:Drill Operator 3 4 8 8 12 12 12 12 12 12 12 12 8 8 8 8 4 0Loader Operator 3 4 8 8 12 12 12 12 12 12 12 12 8 8 8 8 4 4Haul Truck Driver 3 12 20 20 28 28 32 32 32 36 36 32 28 28 24 24 12 8Track Dozer Operator 6 8 8 8 8 8 8 8 8 8 8 8 8 8 8 8 8 4Grader Operator 3 4 4 4 8 8 8 8 8 8 8 8 8 8 8 8 8 4Service Crew 2 3 3 3 3 3 3 3 3 3 3 3 3 3 3 3 3 2Blasting Crew 4 4 4 4 4 4 4 4 4 4 4 4 4 4 4 4 4 0Laborer 4 4 4 4 8 8 8 8 8 8 8 8 8 8 8 8 8 2Operations Total 28 43 59 59 83 83 87 87 87 91 91 87 75 75 71 71 51 24MINE MAINTENANCE:Mechanic 2 8 12 12 14 14 14 16 16 16 16 16 14 14 12 12 8 10Mechanic's Helper 1 4 6 6 7 7 7 8 8 8 8 8 7 7 6 6 4 5Welder 1 4 6 6 7 7 7 8 8 8 8 8 7 7 6 6 4 5Electrician 1 4 6 6 7 7 7 7 8 8 8 8 7 7 6 6 4 5Fuel & Lube Man 6 6 6 6 8 8 8 8 8 8 8 8 8 8 8 8 4 1Tire Man 6 6 6 6 8 8 8 8 8 8 8 8 8 8 8 8 4Laborer 6 6 6 6 8 8 8 8 8 8 8 8 8 8 8 8 4Maintenance Total 23 38 48 48 59 59 59 63 64 64 64 64 59 59 54 54 32 26VS&A at 5 8 11 11 14 14 15 15 15 16 16 15 13 13 13 13 9 5TOTAL LABOR REQUIREMENT 56 89 118 118 156 156 161 165 166 171 171 166 147 147 138 138 92 55Maint/Operations Ratio 0.82 0.88 0.81 0.81 0.71 0.71 0.68 0.72 0.74 0.70 0.70 0.74 0.79 0.79 0.76 0.76 0.63 1.08
Hourly Labor Requirements for Leach Loading, Hauling, Dozing, and Ripping
JOB TITLE ppq1 ppq2 ppq3 ppq4 yr1q1 yq1q2 yr1q3 yr1q4 2 3 4 5 6 7 8 9 10 11MINE OPERATIONS:Haul Truck Driver 8 8 8 8 8 8 8 8 12 12 12 12 12 12Track Dozer Operator 4 4 4 4 4 4 4 4 4 4 4 4 4 4Operations Total 12 12 12 12 12 12 12 12 16 16 16 16 16 16MINE MAINTENANCE:Mechanic 2 2 2 2 2 2 2 2 4 4 4 4 4 4Mechanic's Helper 1 1 1 1 1 1 1 1 2 2 2 2 2 2Welder 1 1 1 1 1 1 1 1 2 2 2 2 2 2Electrician 1 1 1 1 1 1 1 1 2 2 2 2 2 2Maintenance Total 5 5 5 5 5 5 5 5 10 10 10 10 10 10VS&A at 2 2 2 2 2 2 2 2 3 3 3 3 3 3TOTAL LABOR REQUIREMENT FOR LEACH HAULAGE 19 19 19 19 19 19 19 19 29 29 29 29 29 29Maint/Operations Ratio 0.42 0.42 0.42 0.42 0.42 0.42 0.42 0.42 0.63 0.63 0.63 0.63 0.63 0.63Notes:1. Service Crew operates Rock Drill, Excavators, Water Truck, etc.2. VSA Basis: 10%

Rev: 0 Date: October 2010 J07.82.13.02: Feasibility Study – NI 43-101 Technical Report – Santa Ana Project 112
23.2 Mineral Processing Heap Leaching Consulting in coordination with Ausenco-Vector prepared the design criteria for the metallurgical process considering information related to plant capacity and operating conditions. The information used in the design criteria was obtained from field work, metallurgical testing programs, and leach pad design prepared by Vector. Some data was assumed from experience on similar projects and from mathematical calculation.
The basic process consists of material from the open pit transported to the crushing plant, which will comprise two crushing stages and one classification stage. The final crushed ore product will consist of 80 percent passing 19mm and will be conveyed to the temporary stockpile. The reclaim system will consist of one fixed conveyor stockpile to withdraw material from the stockpile and deliver onto trucks. Trucks will transport the ore from the stockpile to the heap leach pad, which will receive 10,000 tpd of ore containing 53 g/t of silver. A sodium cyanide solution will be drip irrigated on the heap to dissolve silver minerals. The estimated dissolution of silver is 70% and the pregnant solution will flow to the Merrill-Crowe plant to produce a precipitate, which will be smelted to produce a silver/gold doré bar.
23.2.1 Flowsheets The project process flowsheet development considered the design criteria, field work, leach pad design, water system distribution and electric system distribution as inputs; plus, smelting, reagent system preparation, effluents detoxification, water distribution and plant facilities for a heap leaching process to recover precious metals. The Merrill-Crowe process was selected as the optimum alternative to recover the precious metals as a precipitate. The precipitate will be sent to the retorting stage, and finally will be smelted to produce a Dore bar. The process flowsheet developed for the feasibility study is provided as Figure 23.17 (full flow sheet in Figure 24.2).
23.2.2 Mass Balance The parameters determined in the design criteria were used to calculate the mass balance of the process: leaching, Merrill-Crowe Plant, smelting, reagents handling, effluent detoxification process, water distribution, and plant facilities. The information obtained was used to select the appropriate equipment and flow streams for the metallurgical process as illustrated in Figure 23.17.
23.2.3 Piping and Instrumentation Based on the information obtained on the leaching process, mechanical area, piping and instrumentation, the piping and instrumentation diagrams were developed. The diagrams include mechanical equipment, instrumentation equipment, piping, valves, effluent detoxification plant equipment, water distribution and plant facilities.
23.2.4 Production Plan The production plant was prepared using the mine plan prepared by IMC and consists of periods of three months until the ore reserves are exhausted and the additional time required to reach maximum dissolution of silver bearing minerals. The metallurgical recovery of silver by the leaching process is 70% with leaching periods of 120 days for the primary leach cycle and a total leach time of 360 days. The estimated monthly production is 306,255 ounces of silver.
23.2.5 Process Description The metallurgical process comprises the following operations: ore crushing, ore transportation to the leach pad, leach pad irrigation, leaching solutions handling, zinc dust precipitation, smelting and gases treatment.

Rev: 0 Date: October 2010 J07.82.13.02: Feasibility Study – NI 43-101 Technical Report – Santa Ana Project 113
23.2.5.1 Crushing Run of Mine Ore (ROM) will be delivered by 63t haul trucks to the dump pocket of a single jaw crusher located to the west of the pit. The installation was designed to allow one truck to approach the dump pocket. The discharge from the dump pocket will flow by gravity to the apron feeder. The apron feeder will discharge onto a grizzly with a 200 mm nominal spacing. The feeder will be employed to feed the primary crusher. The primary crusher and grizzly feeder undersize products will be sent to a vibrating screen in an open circuit with a cone crusher. The cone crusher will be operated with an approximate 20-mm closed side setting to ensure that the final screen undersize product will be 80% passing 19-mm. The screen undersize product will be dropped onto an overland conveyor provided with a belt scale. A simplified flowsheet is provided as Figure 23.17.
A hydraulic rock breaker will be installed to clear crusher blockages caused by oversized rocks. Chains are to be installed on the base of the crusher dump pocket before operations commence to allow break up of impacted rocks prior to maintenance around the top of the crusher. The primary and secondary crusher service pedestal crane will be located adjacent to the crusher to service equipment located around and within the crusher structure. A metal detector and belt magnet at the discharge conveyor that feeds the screen will be used as tramp metal protection system.
Coarse ore from the overland conveyor will be fed to the coarse ore stockpile with a live capacity of approximately 6-hrs (3,000t) and dead capacity of one day. The desired design basis for the stockpile is to provide sufficient ore capacity to allow for one day down time. The conical coarse ore stockpile will not be covered. The reclaim system will consist of one fixed conveyor stockpile to withdraw material from the stockpile and deliver onto trucks and a radial stacker building the coarse ore.
The parameters used to design the crushing circuit are listed below,
• Total capacity, 10,000 t/d
• Capacity, 555 t/hr
• Maximum particle size, 24-inch
• Final product, 80% passing ¾-inch (19-mm)
• Low Energy Impact Test, 10.3 kw-hr/t
• BBWI, 17.1 kw-hr/t
• Abrasion index, 0.0539
• Specific Gravity, 2.43
• Bulk density, 1.65
• Ore moisture, 3-4%
• Operation, 18 hr per day.

Rev: 0 Date: October 2010 J07.82.13.02: Feasibility Study – NI 43-101 Technical Report – Santa Ana Project 114
Figure 23.17 Santa Ana Heap Crushing Flowsheet

Rev: 0 Date: October 2010 J07.82.13.02: Feasibility Study – NI 43-101 Technical Report – Santa Ana Project 115
23.2.6 Ore Transport Crushed ore will be transported by 63t trucks to the leach pad and dumped into leach cells. The material will be placed on the pad in 7m high lifts and pushed to the final placement with a dozer in accordance with the stacking plan developed for the project heap leach pad. Prior to leaching the top of the leach cell will be ripped by a dozer to ensure proper infiltration of the leach solutions.
23.2.7 Irrigation System The design considers cells of approximately 50m x 120m (6,000 m2) with their respective flow lines and drip irrigation system considering as initial point the distribution of manifolds, which will be fabricated with schedule 40 steel pipe of 300mm diameter. There will be four distribution pipes of 150mm diameter that will be connected with an irrigation system.
The drip irrigation system comprises HDPE pipes of 150mm diameter and Lay Flat™ hoses of 100mm installed with hoses of 16mm diameter and drips of 4 litres per hour and separated by 63 cm.
23.2.8 Leaching The leaching operation is a hydrometallurgical process of precious metals dissolution. The cyanide solution is spread on the top of the ore heap using drip emitters and percolates through the pile. Particles of silver and gold are dissolved. The pregnant solution flows to and collects in the pregnant pond. The nominal flow of cyanide solution is 10 l/hr/m2 and the design is based on 11 l/hr/m2.
23.2.8.1 Cyanide Solution Pumping The pH of the cyanide solution will be adjusted between 10.5 to11 and the cyanide concentration will be adjusted to 1000ppm. Also, 4ppm of antiscalant will be added. The solution will be pumped from the barren solution tank to the leach pad by means of one horizontal centrifugal pump. The process design includes two pumps; one on-line and the other on standby. Each pump has an adjustable-speed drive that varies the speed of the pump motor.
Once the solution is delivered to the pad, the main solution pipeline will be divided in two parts to border the leach pad. Within the active leach cells irrigation systems will be installed. The solution that feeds the barren tanks will come from the Merrill-Crowe process and the concentration of cyanide will be adjusted to 1000 ppm.
The process water required will be taken from the barren pond, storm water pond or fresh make-up water according to the requirement of the operation. One submergible pump will be installed in each pond.
23.2.8.2 Pregnant Solution Collection The pregnant solution that percolates through the leach pad will be collected in a pregnant pond where floating vertical pumps will be installed. One pond is called pregnant pond and will collect high grade solution and the other one is an intermediate pond and will receive low grade solution.
23.2.8.3 Pregnant Solution Pumping The pregnant solution will be pumped to the unclarified solution tank using two submergible vertical pumps. Each pump has an adjustable-speed drive that varies the speed of the pump motor. One of the pumps is on-line while the other is a standby spare.

Rev: 0 Date: October 2010 J07.82.13.02: Feasibility Study – NI 43-101 Technical Report – Santa Ana Project 116
The floating vertical pumps will be installed on barges equipped with a special maintenance system. The barges will be steel platforms supported on floating polyethylene.
23.2.9 Merrill-Crowe Plant The Merrill-Crowe process recovers silver and gold from the pregnant solution in form of precipitate. Zinc powder is added to the clarified and deaerated pregnant solution to precipitate precious metals.
The design has considered a Merrill-Crowe plant to treat 571 m3/hr of pregnant solution containing silver and gold. The capacity of the plant assures the treatment of 10,000 tpd of silver ore from the pit. The precipitation process comprises the following stages: clarification, deaeration and precipitation with zinc dust. A simplified process flowsheet is provided as Figure 23.18.
23.2.9.1 Clarification The unclarified pregnant solution will be pumped to the clarifiers at the rate of 571 m3/hr. The design considers two centrifugal pumps, one operating and other in standby. Each pump has an adjustable-speed drive that varies the speed of the pump motor. One of the pumps is on-line while the other is a standby spare. Clarifiers are three leaf pressure filters, two operating and one in standby.
When one filter is saturated, the flow of solution will be sent to the third filter. At this moment the other filter will be cleaned and prepared to operate. This operation will be practiced in determined periods in order to assure the constant feed of pregnant solution to the clarifiers and avoid unexpected problems. It has been estimated that each filter will be cleaned 1 to 2 times daily. The resultant solids will be collected and recycled to the leach pad by a pumping system.
Prior to the operation of the clarifying filter a pre-coat layer will be applied, this will be reinforced with the addition of body feed. During the filtration cycle, solid particles will be retained and the solution leaving the filter will contain 1 Nephelometric Turbidity Units (NTU) of suspended solids.
When one filter is out of operation, it will be cleaned by pumping barren solution or process water. In this way, solids and remaining pre-coat will be removed.
23.2.9.2 Deaeration The objective is to remove dissolved oxygen from the clarified solution. The elimination of oxygen is important in the precipitation process because an excess of oxygen will oxidize zinc particles and the efficiency of the precipitation process is affected. Other negative aspect is the presence of excessive quantities of suspended solids in the solution, which may passivate the surface of zinc particles.
A vacuum tower will be employed as deaeration unit and will be equipped with control levels, distributor, support and fill. The vacuum is required to maintain a high vacuum within the tower and removes the oxygen from the solution. The clarified and deaerated solution is withdrawn from the bottom of the tower by a liquid sealed pump, which prevents re-entry of air.
The solutions from the clarifiers contain approximately 8-ppm of dissolved oxygen and pass down while it is distributed around the diameter of the tower. The solution leaves the tower with less than 1-ppm of dissolved oxygen.

Rev: 0 Date: October 2010 J07.82.13.02: Feasibility Study – NI 43-101 Technical Report – Santa Ana Project 117
Figure 23.18 Process Flowsheet

Rev: 0 Date: October 2010 J07.82.13.02: Feasibility Study – NI 43-101 Technical Report – Santa Ana Project 118
23.2.9.3 Precipitation Zinc dust is used to precipitate precious metals by means of an electrochemical reaction. Lead nitrate is added to catalyse the reaction. Adequate zinc dust is required to provide a coherent deposit on the filter surface through which the silver bearing solution passes, to make certain that sufficiently close contact is made with the zinc particles to obtain maximum precipitation efficiency. Zinc dust, lead nitrate and sodium cyanide solution will be added in an emulsifying tank.
The solution containing the precipitate will be pumped by means of liquid sealed centrifugal pumps to the filter presses. The design considers two pumps with variable speed, one operating and other in standby and its pumping capacity is 571 m3/hr of solution. The precipitate will be collected in three filter presses, equipped with 55, 1200 mm x 1200 mm plates, and designed to treat 191 m3/hr of solution. Two filters will operate and one will be in standby. The process flowsheet presented as Figure 23-17 indicates a forth filter press may be added to the system in the future.
When one filter is saturated, the flow of solution will be sent to the third filter while the saturated filter is discharged, cleaned and prepared to operate. This operation will be practiced in determined periods in order to assure the constant feed of solution to the filters and avoid unexpected problems. The resultant solids will be collected, dried, and sent to the retorting stage.
Before discharging the filter, air will be injected to reduce the moisture content of the precipitate. The solution from the filters will be recycled to the barren solution tank.
23.2.10 Smelting Process The smelting process has been designed to produce Silver/Gold Dore bars with high silver content from the precipitates obtained through the Merrill-Crowe process. The smelting process includes retorts to eliminate mercury, an induction furnace, a gases collection system and slag treatment.
23.2.10.1 Retorting The precipitate from the filter press contains mercury, which comes from the leaching process and it is recovered in the Merrill-Crowe plant. The design considers three retorts, which operate following heating and cooling stages. Table 23.6 details the retort process.

Rev: 0 Date: October 2010 J07.82.13.02: Feasibility Study – NI 43-101 Technical Report – Santa Ana Project 119
Table 23.6 Retorting Process
Description Temperature (co)
Time (hours)
Initial heating 0 to 300 1.5 Maintain temperature 300 2 Final heating 300 to 540 3 Maintain temperature 540 4 Cooling 100 5.5
Total time 16
During the retorting process, air enters the retorts and collects all the gases. These gases will go to a first condenser equipped with a water cooling system and metallic mercury is precipitated to the mercury recovery tank. The gases report to a second condenser to assure the complete precipitation of mercury. The system includes a column loaded with granular activated carbon to collect any remaining mercury vapour. The retorting process will allow the release of gases without mercury content to the atmosphere. A gas extractor system will help to remove the gases.
23.2.10.2 Smelting An induction furnace will be used to smelt the precipitate. Upon completion of the retorting process, the precipitate is dried and mixed with fluxes such as potassium nitrate, manganese dioxide, silica, sodium carbonate and fluorite. The charge is loaded into the crucible. The smelting process takes approximately 3 hours. The molten charge is poured in ingots and the final product of this process is a doré bar with high content of silver.
The doré bars will be deposited in a safe room and will be transported to the market following a schedule, which will be determined with taking the silver production into account.
The smelting process area includes a gas collection system to collect all the gases produced during the smelting process.
23.2.11 Chemical Reagents The chemical reagents that will be used in the process are lime, sodium hydroxide, sodium cyanide, antiscalant, lead nitrate, and detoxification reagents (hydrogen peroxide, copper sulphate) to destroy cyanide and precipitate some compounds in the cyanide detoxification process. The reagents will be stored in three separated areas; one for lime, located near the leach pad; one for cyanide and sodium hydroxide, located near the process plant; and the last one will be used to store all the other reagents.
23.2.11.1 Lime Addition Lime will be stored in a special area. One tonne bags will be transported by trucks near the crushing plant and leach pad. The main lime addition point will be the crushing plant and a dry reagent feeder will be used to add lime.
23.2.11.2 Sodium Hydroxide Sodium hydroxide will be added to the sodium cyanide mix tank and the effluent detoxification process. Sodium hydroxide will be received and stored as a powder in 25-kg bags. Water and

Rev: 0 Date: October 2010 J07.82.13.02: Feasibility Study – NI 43-101 Technical Report – Santa Ana Project 120
sodium hydroxide are added to a mixing tank to achieve a concentration of 30 percent. The preparation of sodium hydroxide will be completed in batches. A pump will be used to add sodium hydroxide solution to the sodium cyanide preparation tank.
When the cyanide destruction plant operates, the sodium hydroxide solution will be pumped to the plant.
23.2.11.3 Sodium Cyanide Sodium cyanide will be received and stored as briquettes in 1-tonne bags. Process water and sodium cyanide briquettes are mixed to achieve a concentration of 25 percent. A service hoist is used to discharge the contents of the bags through a charge chute and into an agitating mix tank with process water. The design considers two sodium cyanide preparation tanks.
Pumps transfer sodium cyanide from the mix tank to the storage tank. Any spillage in the cyanide area is recovered in a sump and pumped to the mix tank. Circulating pumps provide a distribution loop for sodium cyanide use in the leaching circuit and Merrill-Crowe plant. Sodium cyanide is pumped through this loop at a controlled pressure. The unused solution returns to the storage tank. The design considers two pumps with variable speed with a capacity of 20 m3/hr of solution.
23.2.11.4 Antiscalant Antiscalant will be used to avoid the formation of precipitates in the pipes, equipment and accessories of the process plant. The antiscalant solution will be added in the barren solution tank, pregnant pond and storm water pond. The addition of antiscalant will be permanent in the first two points.
The concentration of antiscalant must be maintained between 5 and 10 ppm in the leaching and pregnant solutions.
23.2.11.5 Lead Nitrate Process water and lead nitrate are mixed to achieve a concentration of 5 percent. The mixing tank will have a capacity of 0.36 m3. The solution will be sent to the emulsifying tank.
23.2.11.6 Zinc Dust The zinc dust feed system comprises one bin and one screw feeder, which feeds the material to the emulsifying tank. The maximum capacity of the feeder will be 30.5 kg/hr and the estimated consumption of zinc dust is 17 to 25 kg/hr.
23.2.11.7 Precoat Process water and diatomaceous earth are mixed to achieve a concentration of 0.3 to 2 percent. The mixing tank will have a capacity of 13.3 m3. The solution will be pumped to the clarifier filters or filter presses to form a layer of 1.5 to 10-mm on the filtration medium. The solution will recirculate between the pre-coat tank, clarifier filter or filter press.
23.2.11.8 Body Feed Process water and diatomaceous earth are mixed to achieve a concentration of 0.5 to 5 percent. The mix tank will have a capacity of 11 m3. The solution will be pumped to the clarifier filters.
23.2.11.9 Hydrogen Peroxide Hydrogen peroxide will be used in the effluent detoxification plant to destroy cyanide.

Rev: 0 Date: October 2010 J07.82.13.02: Feasibility Study – NI 43-101 Technical Report – Santa Ana Project 121
23.2.11.10 Copper Sulphate Process water and copper sulphate are mixed to achieve a concentration of 5 percent. The mixing tank will have a capacity of 200-m3. The solution will be pumped to the storage tank, which will have two pumps for supply to the effluent detoxification plant.
23.2.11.11 Reagent Requirements Lime and Sodium
Lime and Sodium Cyanide are the major reagents used in the heap leach Merrill-Crowe circuit. Table 16.9 presents the primary reagent consumptions projected for the p80 19mm crush size.
Table 23.7 Primary Reagent Consumption
Reagent Consumption Addition Trim
Lime (@ 80% CaO) 3.0 kg/t Crushing Heap or Barren Solution
Sodium Cyanide 0.4 kg/t Barren Solution Barren Solution
The lime consumption was estimated from the test program. The p80 19-mm columns had pH control problems at the initial addition rate of 2 kg/t. The 3.0 kg/t addition will assure that the heap will maintain the pH at 10.5 or above. The sodium cyanide requirement was derived from the column tests. Heap leach consumptions run from ¼ to 1/3 the column consumptions.
Other Reagents
The zinc powder requirement of 1g Zn/1g Ag was confirmed in tests at McClelland Laboratories, and utilized in the feasibility study.
Operating Merrill-Crowe plants with the same tenor of silver in solution report requirements as low as 0.6g Zn/1g Ag.
The reagent consumption was determined using information from metallurgical tests, stoichiometric calculation and experience on similar projects.
23.3 Infrastructure
23.3.1 Power Electrical power to the Santa Ana facilities will be provided from the Peruvian grid (Sistema Electrico Interconectado Nacional - SEIN) by a new line to be built connecting the existing Pomata substation in the town of Pomata to the Santa Ana substation. In addition, there will be 10kV primary lines and distribution substations.
The electrical power transmission line will supply the power required for the future Santa Ana operations with a power of 6MW.
The following facilities will be involved:
Rev: 0 Date: October 2010 J07.82.13.02: Feasibility Study – NI 43-101 Technical Report – Santa Ana Project 122
• 60kV bars expansion of the existing Pomata substation and installation of connection equipment for the 60kV line to the Santa Ana substation;
• 60kV transmission line from the existing Pomata substation to the Santa Ana substation, about 48.55 km of a three-phase circuit with two guard wires;
• A new substation for the Santa Ana mining operation, which includes the installation of a transformation cell (step-down cell) 60/10/4.16kV - 5/5/1.7MVA (ONAN), 6.25/6.25/2.13 (ONAF) and distribution cells in 10kV;
• Communication systems; and
• Emergency power will be provided by diesel generators.
23.3.2 Access Road In order to develop the Santa Ana project, it will be necessary to improve the existing mine access road between the existing interstate highway and the project site. Additional mine site roads will also be necessary for daily operation of the mine.
In general terms, the roads included in this study have a total width of 7,2m including a diversion ditch. The slopes along these access roads are generally intended to be kept between 4 and 10%. Due to the relative steepness of the property some roadway sections will require slopes as great as 15% or more. Further details and technical data on the access road development are provided in the DFS Engineering Design Report (Ausenco Vector, 2010).
23.3.2.1 Mine Access Road Access to the project site is proposed as improvements to an existing rural road that comes from the town of Huacullani and continues south, passing through the proposed Santa Ana mine site to permit the mobilization of heavy equipment and materials along the entire 4.3km length. This road improvement is relatively inexpensive as it gets closer to Huacullani, as the existing ground surface is very flat and the road alignment does not present many horizontal curves. This road improvement increases in costs as it approaches the mine site, where the ground is steeper and mainly rocky.
23.3.2.2 Main Haul Road The main haul road runs from the end of the mine access road and has a total length of 1.3km until it joins the perimeter access road of the leach pad. Its location and alignment are strategic since complementary haul roads to the open pit and crusher join this access as well as the access road that goes to the offices and camp site.
23.3.2.3 Auxiliary Access Road These roads are divided into two alignments: the first auxiliary access road has a length of 2.4 km starting from station 0+620 of the main haul road and finishing where the general offices are located. The second auxiliary access road has a total length of 2.6 km and connects the west side of the leach pad perimeter access road with the acid water treatment plant, after passing through the general offices and camp site.
23.3.2.4 Diversion Access Road A diversion access road is planned to permit continued access to the south for local residents while maintaining proper mine site security and safety. This road alignment, a rerouting of existing traffic, starts at the end point of the main access road, located at the north of the leach pad, going around the upper slopes until it meets the existing road located on the south direction of the process ponds, for a total length of 5.6 km.

Rev: 0 Date: October 2010 J07.82.13.02: Feasibility Study – NI 43-101 Technical Report – Santa Ana Project 123
Figure 23.19 illustrates the general mine site arrangement including the proposed Diversion Access road.
Figure 23.19 Access Roads General Layout
23.4 Geotechnical The civil structures of the area, such as the leach pad, waste dump, solution ponds and process plant, are located at an average elevation of 4200 m masl and cover an area bounded roughly by the UTM coordinates: 8,159,000 to 8,156,500 mN and 464,500 to 468,500 mE. Five predominant geotechnical (surficial) units have been identified within the project area.
23.4.1 Geotechnical Units Moist grasslands composed of saturated moist organic soils have a surface thickness that varies from 0.20 to 2.00 m. These soil units vary from very wet to saturated and are located, specifically, along streams northeast and southeast of the leach pad, southeast of the waste facility area and within the footprint of the process plant and solution ponds. This material will require removal where it underlies project facilities.
Colluvial deposits are distributed around the toe of rocky outcrops covering much of the proposed leach pad footprint and the access road alignments. Colluvium consists of soils whose formation was caused by gravity, or natural landscape degradation. These deposits consist of clayey sand with gravel, clayey gravel with sand and clay with gravel. Typical clay content consists of medium to

Rev: 0 Date: October 2010 J07.82.13.02: Feasibility Study – NI 43-101 Technical Report – Santa Ana Project 124
high plasticity. Cohesionless material typically has loose to medium dense consistency. On-site colluvium is generally in a moist condition, with angular gravel fragments and scattered cobbles and boulders. Colluvium falls into the following Unified Soil Classification System (USCS) codes: SC, GC and MS. These materials are suitable for foundations.
Less common are the alluvial deposits, which are present in small streams, tributaries and in the lower reaches of the heap leach pad area and process pond footprints. Alluvium consists of a thin layer of subangular gravel and sand, with some silt and clay. The alluvial soil is typically moderately dense, and classifies as USCS codes GM, SC, SM and CL-ML.
Residual soils are the predominant geotechnical unit in the project area. Residual soils comprise much of the near surface material underlying the waste dump, much of the leach pad, solution ponds and process plant areas. Residual soil deposits are generated in situ through the alteration processes of bedrock units and comprise generally clay and clayey sand with low to medium plasticity, classified in the USCS as CL and SC. This unit is suitable for the heap leach pad, waste dump, solution ponds and process plant foundations depending on the degree of compaction that is required after stripping the surface.
During the investigation the presence of bedrock was determined through the mapping of rocky outcrops, diamond drilling, and excavation of test pits. Bedrock is present at shallow depth in much of the study area including the location of the leach pad, waste dump, solution ponds and process plant. Bedrock underlying proposed project facilities is suitable for foundation purposes.
23.4.2 Piezometric Level Based on field investigations within the proposed heap leach pad footprint, groundwater exists at depths from 1.45 to 13.30 m below the current ground surface. Artesian conditions were recorded in drillholeDH_SA10-107. In the area of waste rock facility the groundwater level was recorded between 0.85 m and 53.0 m.
Groundwater was recorded during drilling between 0.0 m to 19.95 m in the area of the process plant and solution ponds.
23.4.3 Foundation Level During the geotechnical investigations a recommended depth of excavation to the foundation was determined for the leach pad, waste dump, solution ponds and process plant. The criterion for this depth was based primarily on finding a rigid non-yielding foundation resulting in minimal differential settlement.
Based on these investigations, the heap leach pad may be founded on the surface of the residual and colluvial soils deposits, bedrock and to a lesser extent alluvial deposits. According to drilling results, bedrock is located 19.10 m below the existing ground surface in the central part of the pad and less than 3.30 m in the northern and eastern sections. The bedrock ranges from 2.60 to 11.30 m in depth in the western section of the pad and is of very poor quality near the surface, but improves with depth.
The waste dump foundation is at minimal depth and is on residual soil surface and bedrock. Drilling indicates that the bedrock is between 1.0 and 4.0 m depth and is from very bad to bad quality at the surface, improving with depth.

Rev: 0 Date: October 2010 J07.82.13.02: Feasibility Study – NI 43-101 Technical Report – Santa Ana Project 125
The foundation level of the solution ponds is on residual and colluvial soils deposits, bedrock and to a lesser extent alluvial deposits. Drilling indicates that the bedrock is between 1.0 to 3.40 m in depth, and is very poor to poor quality at the surface, improving with depth.
The process plant is next to the solution ponds, and the foundation is on residual soils and bedrock. Test pits and drilling indicate that the bedrock is found between 1.0 and 4.6 m in depth, and is of very poor to poor quality, improving at depth.
The camp and offices are located approximately 500 m south of the solution ponds. The foundation level is on bedrock and colluvial deposits. Test pits indicate that the foundation level is 1.0 m above the colluvial material.
23.4.4 Open Pit / Pit Slopes Geotechnical investigations were conducted for the Santa Ana open pit area, including: oriented core drilling, geomechanical and oriented core logging, and surface outcrop mapping and sampling. Select samples were delivered to a laboratory for estimating strength parameters of intact rock. These parameters assist in slope stability analyses of the proposed pit walls.
The open pit area consists mainly of volcanic rocks, mostly andesite of porphyritic to aphanitic texture, and post-mineralization tuffs in the northwest side. Other minor lithologies found were quartz feldspar, hypabissal dikes, breccia and sandstone.
A structural control as part of a syncline with NW-SE trend was observed, which crosses the southern part of the pit area. Predominant joint sets were found to strike NW, NS, EW and NE.
From the field and lab investigation the rock mass was geomechanically characterized, finding a fractured to very fractured, but hard andesite; and low fractured but relatively weak post-mineralization tuff.
Slope stability was first evaluated through kinematic analysis to define the maximum bench face and interramp angles in each rock type, as a function of the potential sliding planes or wedges, and then through limit equilibrium analysis to verify or optimize the proposed interramp angles by analysing global slopes.
Recommended interramp slope angles are 40° for sectors of low RQD rock mass by using a 5 m single bench design, 43° for the post-mineralization tuff with high RQD and 44° for andesite with high RQD, the last ones permitting the use of a 10-m double bench design.
For further optimization of the interramp slope angles, the geological model of the deposit and the geomechanical database need to be improved. A more detailed RQD model can be completed after training technical personnel to correctly gather this parameter in future drilling works, or as mining progresses.
Open pit slope stability is sensitive to the estimated phreatic condition. Therefore, it is strongly recommended to maintain the phreatic surface as far as possible from the slope faces by implementing permanent horizontal drains and pumping water from the open pit bottom during operation. Installation of piezometers around the final pit area is recommended for monitoring the impact of the pumping and drainage measures during operation, and for permanent review of slope stability.

Rev: 0 Date: October 2010 J07.82.13.02: Feasibility Study – NI 43-101 Technical Report – Santa Ana Project 126
A monitoring program of displacements of the crest slopes, particularly those that are higher, is recommended as stability oriented control through frequent surveying of control points in the slopes from permanent survey stations.
23.4.5 Heap Leach Facility Construction The leach pad and process ponds design was prepared by Vector in accordance with the design criteria provided by BCM and complementary data calculated or obtained from the various field campaigns. This design includes:
• Definition of the design parameters for the leach pad;
• Field geotechnical investigation;
• Development of the ore stacking plan;
• Stability analysis for the most critical sections;
• Hydrological and hydraulic calculations for diversion channels;
• Preparation of a water balance for the leach pad; and
• Earthworks volumes and materials quantities estimation.
Further details of the leach pad design are described in Ausenco Vector's DFS Engineering Design Report (Ausenco Vector, 2010). Summary design information useful to developing capital costs is presented herein.
Figure 23.20 Santa Ana's Heap Leach Pad First Stage Layout

Rev: 0 Date: October 2010 J07.82.13.02: Feasibility Study – NI 43-101 Technical Report – Santa Ana Project 127
23.4.5.1 Design Criteria and Approach The criteria and approach used to develop the DFS design of the heap leach pad were provided to Vector by BCM and are listed as follows:
• The preferred heap leach pad location was selected from a previous Scoping Study (Vector, 2009).);
• Ultimate heap leach storage capacity equals approximately 42 million tonnes (MT) of crushed ore for an operational life of 11 years;
• A daily production rate was estimated at 10,000 tpd or 3,650,000 tpy;
• The first phase of the heap leach pad is designed for a 4.18 Mt capacity or the first year’s production;
• The ultimate heap leach pad will see two additional phases;
• The ore stacking plan includes 7 m lifts stacked at the internal angle of repose of the ore (about 37°) with internal benches 81 m wide resulting in an overall slope of 2.5H:1V;
• The ore lifts top surfaces of each ore lift was assumed to be horizontal;
• The assumed ore density is 165t/m3;
• Every phase of the heap leach pad will have a perimeter access road for materials transportation and construction activities;
• On-site borrow sources have been identified for construction materials (such as low permeability soil, drainage gravel, etc.);
• An underdrain system will be constructed beneath the entire heap leach pad footprint to control groundwater flow beneath the liner system;
• The heap leach pad foundation will be covered with a composite liner system consisting of a 300mm thick low-permeability soil and an overlying LLDPE geomembrane;
• The minimum static design factor of safety for stability analysis of the heap leach pad is 1.5 while the minimum dynamic factor of safety is 1.0; and
• The maximum design earthquake (MDE) with a recurrence interval of 2,500 years or a 2 percent probability of exceedance in 50 years was used to estimate the potential maximum seismic deformations of the heap leach pad during operational life.
23.4.5.2 Leach Pad Materials Description Materials necessary for construction of the design heap leach pad are summarized in the following paragraphs. The DFS Engineering Design Report (Ausenco Vector, 2010) provides complete details.

Rev: 0 Date: October 2010 J07.82.13.02: Feasibility Study – NI 43-101 Technical Report – Santa Ana Project 128
Figure 23.21 Santa Ana's Leach Pad Ultimate Phase Layout
Low Permeability Soil
A low permeability soil layer consisting of inorganic, mostly fine-grained soil will be placed immediately beneath the geomembrane liner. In order to prevent damaging the geomembrane, the maximum particle size shall be 38 mm. The material shall have a plasticity index of 15 percent or higher. This material shall be placed in horizontal lifts that ensures a thickness of 300 mm after compaction, moisture conditioned to within plus or minus 2 percent of the optimum moisture content, and compacted to a minimum of 95 percent of the maximum dry density (ASTM D-698).
Rock Fill
Rock fill will be used for erosion control structures discharging storm water flow from the diversion channels to the natural valleys. This material is anticipated to be obtained from inert mine waste materials with a value of D50 value equal to 250mm and will be mixed with concrete.
Drainage Gravel
The underdrain ditches will be a part of the heap leach pad design and will be filled with a granular material consisting of inorganic, free-draining, durable sand and gravel with a 38mm maximum particle size and a maximum of 5 percent fines. The material used will be inert and placed in maximum 1 m thick loose lifts.

Rev: 0 Date: October 2010 J07.82.13.02: Feasibility Study – NI 43-101 Technical Report – Santa Ana Project 129
Anchor Trenches Fill
Fill material used to backfill geomembrane anchor trenches will consist of the material excavated from the trenches and will be backfilled into the anchor trenches after the geomembrane installation is completed. There will be no lift placement, moisture conditioning or compaction requirements, except the top surface must be wheel-rolled by a rubber-tired backhoe or front-end loader to seat and seal the fill surface.
23.4.5.3 Underdrain System The underdrain system will collect the flow of water beneath the heap leach pad and divert it downstream of the heap leach facilities. This system consists of a network of perforated HDPE pipes laid out in a "herringbone" pattern and placed in trenches filled with drainage gravel. The underdrain system must be constructed after the unsuitable materials have been removed from the facility limits and the final grading surface has been excavated.
23.4.5.4 Liner System The design geomembrane is single-side textured 2 mm linear low density polyethylene (LLDPE) geomembrane meeting the minimum requirements of the Geosynthetics Research Institute (GRI) standards.
23.4.5.5 Solution Collection System Solution collection pipelines will lie on the installed liner system to collect and evacuate the solution draining down through the stacked ore to the process ponds. Solution collection piping is sized to adequately pass the assumed design solution flow and minimize solution hydraulic head on the liner system. The overdrain system is installed in a pattern similar to the underdrain system.
23.4.6 Process Ponds Construction In accordance with established project design criteria and information collected during the field geotechnical investigations, process pond design included the following key components:
• Definition of the design parameters for the process ponds;
• Field geotechnical investigation;
• Development of the ponds operational process;
• Design of the process ponds and plant site platform;
• Stability analysis for the most critical sections;
• Hydrological and hydraulic calculations for the pond dimensions;
• Preparation of a water balance for the process ponds; and
• Earthwork volumes and materials quantities estimation.
The Vector DFS engineering design report (2010) provides additional details on process ponds design. A brief description of the process ponds components follows.

Rev: 0 Date: October 2010 J07.82.13.02: Feasibility Study – NI 43-101 Technical Report – Santa Ana Project 130
Figure 23.22 Santa Ana's Process Ponds Layout
23.4.6.1 Design Criteria and Approach Key criteria and assumptions used to design the process ponds at the feasibility level are summarized in the following list:
• The process ponds location was based primarily on favourable site conditions and proximity to the design location for the heap leach pad;
• Three separate ponds comprise the process ponds, namely: the PLS pond, the ILS pond and the storm water pond with storage capacities of 17,750m3, 18,000m3 and 141,700m3, respectively;
• Each pond has a minimum free board of 500mm without considering the perimeter safety berms;
• Two sedimentation ponds are included to prevent sediments from entering the process ponds; one for the PLS pond and another for the ILS pond;
• All the process ponds are interconnected with spillways that shall alleviate any overflow occurring in the PLS and/or ILS ponds;

Rev: 0 Date: October 2010 J07.82.13.02: Feasibility Study – NI 43-101 Technical Report – Santa Ana Project 131
• Site borrow sources have been identified for specific construction materials (such as structural fill material, drainage gravel, etc.);
• An underdrain system will be constructed underneath the limits of the process ponds and plant site platform to capture groundwater flow beneath these facilities;
• The liner system for the PLS and ILS ponds consist of a geosynthetic clay liner (GCL) as the low permeability soil layer and a double HDPE geomembrane system with a geonet layer between the two liners;
• The liner system for the stormwater pond consists of a composite liner system based on a geosynthetics clay liner (GCL) and a HDPE geomembrane layer;
• The PLS and ILS pond designs include a leak detection system integrated into the double liner system;
• The minimum design static factor of safety for stability analysis of the process ponds is 1.5 and the minimum dynamic factor of safety is 1.0; and
• The maximum design earthquake (MDE) has a recurrence interval of 2,500 years or a 2 percent probability of exceedance in 50 years) and was used to estimate the potential maximum seismic deformations of the process pond slopes during operational life.
23.4.6.2 Process Ponds Materials Description Construction materials necessary for building the process ponds are similar to those described for the heap leach pad with the exception of the low permeability soil liner that has been replaced by a geosynthetic clay liner (GCL).
23.4.6.3 Underdrain System The underdrain system for the process ponds is similar to the system described for the heap leach pad and consists of a network of HDPE perforated pipes set out in a "herringbone" pattern and placed in trenches filled with drainage gravel. The underdrain system must be constructed after the unsuitable materials have been removed from the facility limits and the final grading surface has been excavated.
23.4.6.4 Liner System The process ponds will be lined in two different ways: the PLS and ILS ponds will have a double liner system while the stormwater pond will have a single composite liner. However, for both cases, the low permeability soil layer use beneath the heap leach pad liner system is replaced by a geosynthetic clay liner (GCL). GCL placement permits steeper side slopes for the ponds (up to 1.5H:1V) in order to achieve more storage capacity within the same footprint.
The PLS and ILS ponds will have a double geomembrane liner system with a geonet (which will serve as a leak detection layer) between them. The storm water pond will have a single geomembrane liner system. In both cases, the geomembrane will be a smooth, 1.5mm thick HDPE liner.
23.4.7 Waste Rock Facility Construction Ausenco Vector designed a waste rock facility in accordance with design criteria provided by BCM and in accordance with industry standard practice. A summary of key design components follows:
• Preparation of preliminary layouts for this facility;

Rev: 0 Date: October 2010 J07.82.13.02: Feasibility Study – NI 43-101 Technical Report – Santa Ana Project 132
• Stability analysis of the waste rock facility’s most critical sections;
• Definition and sizing of preliminary water management structures; and
• Estimation of earthwork, material quantities and costs for staged construction.
The design of the waste rock facility is detailed in the DFS Engineering Design Report (Ausenco Vector, 2010) and is briefly summarized herein.
Figure 23.23 Santa Ana's Waste Rock Facility Layout
23.4.7.1 Design Criteria and Approach The following summary items present key design criteria and assumptions used to develop the waste storage facility.
• The waste dump location was determined as the most feasible as a result of a Scoping Study (Ausenco Vector, 2009) comparing several potential sites;
• In accordance with the mine plan developed for BCM, the waste storage facility was design to contain approximately 95 Mt of uneconomic mined rock material;

Rev: 0 Date: October 2010 J07.82.13.02: Feasibility Study – NI 43-101 Technical Report – Santa Ana Project 133
• The first stage of the waste rock facility is design to contain the first year’s production of 8.5 Mt;
• During operations, haul trucks will deposit mine waste from the upper platform at the natural angle of repose estimated at 37° or 1.34H:1V (short term conditions);
• The recommended final layout includes benches necessary to increase the overall side slopes to 2.5H:1V for long term slope stability conditions;
• The minimum design static factor of safety for slope stability analysis is 1.5 while the minimum design dynamic factor of safety is 1.0;
• Dynamic analyses utilize a maximum design earthquake (MDE) with a recurrence interval of 2,500 years or a 2 percent probability of exceedance in 50 years. for during operational life conditions;
• A waste rock facility diversion channel was designed to safely pass a 500-yr recurrence storm event; and
• A sedimentation pond will be constructed downstream of the waste rock facility to collect surface water flow originating from the waste rock facility. The pond will provide a monitoring point prior to release to the environment.
23.4.7.2 Waste Rock Facility Material Descriptions Construction materials necessary for the waste rock facility foundation include underdrain gravel and HDPE drain pipes.
23.4.7.3 Underdrain System An underdrain system will be constructed at the waste rock facility to evacuate any shallow groundwater and contact meteoric water from the facility. Based on studies to date, Santa Ana mine waste has a very low acid generating potential. Therefore, a liner system and/or an effluent collection system are not necessary for the facility.
23.4.8 Seismicity and Seismic Hazards Vector prepared a site-specific, comprehensive seismic hazard analysis as part of the FS (Vector, 2010). The study was developed to review the tectonics of the project area, review available data on historical and instrumented seismicity, identify seismogenic sources, estimate the regional seismic attenuation effects, estimate the deterministic and probabilistic ground motions at the site and develop response spectra for both soil and rock conditions at the site.
Tectonics is governed by the subduction mechanism in the southwestern region of Peru, where the Nazca plate dips beneath the South American plate with an average angle of 30º up to300 km in depth. Also, various faults systems have been recognized in the southern region of Peru. The nearest active fault to the project site is the Cuenca de Charaña fault, located 77km southward of the mine site, and the East Peñas fault, located 98km to the east. Although these faults have not been sufficiently studied, they are near surface faults with the potential to generate destructive local seismic effects.
According to the reviewed seismic history of the project area, during the last 400 years earthquakes have occurred with intensities of up to modified Mercalli intensity, MMI=V. in the project area, although the area is scarcely populated and greater intensities not reported could have occurred.

Rev: 0 Date: October 2010 J07.82.13.02: Feasibility Study – NI 43-101 Technical Report – Santa Ana Project 134
For the seismic hazard evaluation, subduction and continental sources have been considered, using different attenuation laws in each case. The seismic catalogue was updated to 2009. The nearest faulting systems have also been identified for analysis.
The deterministic analysis estimates that the maximum credible earthquake at the Santa Ana project site will cause a peak ground acceleration of 0.32g in bedrock and 0.45g in very dense soil sites as a result of the intermediate and superficial subduction seismic activity, respectively.
For the probabilistic analysis, updated seismic zonal sources have been identified. Due to scarcity of information on the seismic activity related to continental faults, these source zones have also been modeled as areas having similar seismic characteristics instead of discrete linear sources. Earthquake recurrence rates were calculated for each seismic source from the compiled historical catalogue. These parameters were used as input into the probabilistic seismic hazard analysis. Results are presented in terms of ground motion as a function of annual exceedance probability, the reciprocal of the average return period.
For the seismic design of common facilities in the Santa Ana project, a 475-year return period is recommended, which corresponds to a 10% probability of exceedance in a 50 year time period. Considering the site classification system proposed by the International Building Code (IBC, 2006), the peak ground acceleration for this return period at the project site is 0.25 g, 0.26 g and 0.43 g, for site classes B, C and D, respectively. Design ground motions at varying exposure levels have been estimated and detailed in the Seismic Hazard Study (Ausenco Vector, 2010) report. Selection of applicable return period events or perceived risk is beyond the scope of this report.
23.4.9 Instrumentation and Monitoring In order to monitor the geotechnical behaviour of the projected facilities, survey instruments will be installed at strategic locations around the project area. The monuments will be surveyed routinely according to an established monitoring plan and the readings used to track movements with time. As these monitoring instruments are very important throughout the project life, a set of hydraulic piezometers, to monitor groundwater conditions and slope inclinometers have been proposed in an area downstream of the leach pad, process ponds and the waste dump. Details and locations of the instrumentation elements and the monitoring schedules are provided in the DFS Engineering Design Report (Ausenco Vector, 2010).
23.5 Markets The principal commodity of silver is freely traded, at prices that are widely known, so that prospects for sale of any production are virtually assured. Silver is considered both a precious and industrial metal having increasing applications in industrial uses and high-technology sectors. The price of silver historically tracks gold; however, in recent years those ratios have been more volatile. BCM used the average silver price of US$14.50/oz. for the Base Case economic model which corresponds to an average forecasted long-term consensus price from 45 capital market analyses as of September 2010.

Rev: 0 Date: October 2010 J07.82.13.02: Feasibility Study – NI 43-101 Technical Report – Santa Ana Project 135
Source: available street research
A cost estimate of $0.63/oz has been provided by Johnson Matthey to BCM for transportation from Peru to the US and metal refining according to the cost structure indicated in Table 23.7.

Rev: 0 Date: October 2010 J07.82.13.02: Feasibility Study – NI 43-101 Technical Report – Santa Ana Project 136
Table 23.8 Dore Transport and Refining Costs
Item Quantity Units Cost Basis 5,000 kg per shipment Peru transport $3.43 per kg Air transport $7 per kg Fuel Surcharge $0.3 per kg Basic transport $0.20 per kg Total Transport (USD) $0.34 /oz Treatment $0.29 /oz
Total $0.63 /oz
23.6 Environmental Considerations and Permitting The project has been designed to meet industry standards of environmental compliance. The heap leach and solution ponds have been designed industry standards of containment and stability. The waste rock storage facilities are designed to capture and manage any flows that may originate from the waste rock. Finally an initial closure plan has been developed that will provide covers for both the heap leach and waste rock facilities that will result in safe and environmentally compliant closure of the mine. The lab tests on spent ore and waste rock have shown that the site has a very low potential to produce acid rock drainage (ARD).
The Company is currently advancing the permitting process and expects to submit the Environmental and Social Impact Assessment (ESIA) to the Peruvian authorities before the end of 2010. All additional necessary permitting will be processed once the ESIA has been approved by the national government.
The Company has maintained good working relationships with the local communities
23.7 Health, Safety, Environment and Community
23.7.1 Hydrogeological Evaluation Vector (2010) completed a feasibility-level hydrogeological evaluation of the Santa Ana project site, including:
• Field Investigations: such as, permeability testing, piezometer and test well installations, mapping of springs, sampling for water quality, and groundwater level monitoring; and
• Hydrogeological characterization: such as, estimates of permeability and aquifer parameters, estimates of groundwater recharge and discharge relationships, numerical groundwater modelling, and open pit infiltration estimates.
23.7.1.1 Field Investigations Field investigations included drilling and installation of 15 groundwater piezometers and 2 test wells. Permeability testing (Lugeon and Lefranc) was performed during drilling and included 61 permeability tests in open boreholes and installed piezometers. In addition, two pumping tests were conducted to evaluate potential water supply yield and aquifer parameters. Groundwater level monitoring was conducted during the period of April to August 2010. Groundwater samples were

Rev: 0 Date: October 2010 J07.82.13.02: Feasibility Study – NI 43-101 Technical Report – Santa Ana Project 137
collected from a total of 9 points for water quality analysis. Surface water mapping included mapping of spring locations in the study area.
23.7.1.2 Conceptual Hydrogeological Model The site is situated in a mountainous and previously glaciated area. Groundwater flow is strongly influenced by site topography with recharge and downward flow occurring within the highland areas and groundwater discharge and upward flow occurring within the stream bottoms. This pattern of flow is evidenced by both the measured piezometric surface in piezometers and relationships to springs and streams. Groundwater discharge to the streams supports flow during the dry winter months. Calculations of runoff, real evapotranspiration and total precipitation based on published climatic data, resulted in a value of effective infiltration (aquifer recharge) of about 0.12 mm/day (7% of total average annual precipitation).
Unconsolidated sediments are confined to the valley bottoms and consist of alluvium, colluvium and glacial outwash with generally limited thickness (less than 1.0 to1.5 m) except in the Zorrillo River valley where a thickness of 18m was found in one of the exploration boreholes.
Regional andesite bedrock typically has a low primary porosity. Permeability and storage are dependent upon degree of jointing, fracturing and faulting within the bedrock, which ultimately controls movement of groundwater.
Based on results of testing, bedrock permeability measurements are variable, ranging from a low of approximately 10-7 cm/sec to a high of 10-2 cm/sec. In the areas of the Waste Rock Facility, Heap Leach Facility and proposed open-pit areas, observed bedrock permeabilities are relatively lower (with a geometric mean of 2 x 10⁻⁵ cm/sec).
23.7.1.3 Simulation of Groundwater Inflow to Proposed Open-Pit Areas A groundwater model was constructed and calibrated to field water level measurements to: 1) confirm the conceptual hydrogeological model; 2) provide estimates of pit inflow rates; and, 3) evaluate potential groundwater impacts and potential needs for dewatering. The geometric mean and range of permeability values determined from the model calibration were in close agreement with field measurements.
Using the steady-state calibrated groundwater model, a transient-state model was used to simulate groundwater inflow to the open pit during different stages of development including the end of mining. The projected pit inflow shows steady increases over the life-of-mine as the pit widens and deepens, reaching a maximum predicted inflow of 7.5 m3/hour (2 L/s) after 10 years of mining. Provided the small projection of pit inflow, requirements for pit dewatering will be minimal
23.7.2 Water Supply The amount of fresh water required by the Santa Ana facilities is approximated at 73.8 m3/hour (20.5 L/s) with a peak delivery of 109.4 m3/hour (30.4 L/s). The well field and water supply pipeline will be designed for this peak demand.
23.7.2.1 Water Well Fields Water quantities are limited and environmentally and socially sensitive in the region of the Santa Ana mine. Groundwater near the facilities was, therefore, not considered as a main source of water for the project; however an area does exist for auxiliary, short-term groundwater supply in fractured andesitic rocks if required.

Rev: 0 Date: October 2010 J07.82.13.02: Feasibility Study – NI 43-101 Technical Report – Santa Ana Project 138
The primary water supply for the project will be from the basin-fill deposits of the Challacollo Valley along the Callacame River, which lies 7.8 km from the mining facilities (Figure 24.1). A 339 hectare parcel along the Callacame River was explored using surface resistivity geophysical methods. After completion of geophysics, a piezometer and a water supply test well were drilled in the area. Aquifer testing of the water supply test well was conducted for determination of aquifer parameters. Aquifer testing results were favorable and indicated that a well field in the area could produce on the order of 108 m3/hr (30 L/s) or more. Water samples collected from the test well were submitted to an internationally-approved analytical laboratory for analysis and the results indicate that the quality of the groundwater is suitable for anticipated mine uses, including public water supply. It is estimated a total of 3 production wells in the area will meet the water supply needs for the project, including back-up capacity.
23.7.2.2 Water Pipeline The Santa Ana water supply and pipeline originates north-northeast of the proposed plant utilizing two 100m³ 125 hp well pumps capable of 194 m total dynamic head (TDH). The water is then piped for 12.2 km following existing roads to a water storage tank located approximately 60 m above the plant. Pipe for this project is 150 mm carbon steel, HDPE SDR 11 and SDR 17 and 200 mm HDPE SDR 9 depending on pressures in the line. This alignment will require two booster pump stations to overcome 374 m of static head and various head losses. Each booster pump will supply 100 m³/hr at 75 and 150 hp to overcome 136 m and 238 m of TDH respectively. Water from the storage tank will then flow to the plant by gravity.
23.7.3 Waste Geochemistry This section discusses the geo-chemical characterization of waste rock material and of the materials which will make up the final pit surface.
The objective of the study was to characterize representative waste rock material from the perspective of potential generation of acidity and/or leaching of metals in such a manner as to ensure that any negative effects are mitigated in a timely manner in the context of any future projects.
23.7.3.1 Sampling The sampling criteria utilized corresponded to the most representative lithologies and alterations for both waste rock and the final pit surface. The lithologies sampled were andesite, quartz-feldspar-porphyry (QFP) dikes and breccias.
The sampling procedure included the identification of representative drillholes, integrating the information from vertical drilling (in accordance with geological sections) with horizontal information (geological mapping), in order to represent the waste rock area, the area which is not economically viable for exploitation and areas which BCM considers to be low grade (<20% Ag) or low ore zones.
A list of boreholes representative of the entire waste rock deposit was obtained based on the most recent drilling plan, in order to minimize the effects of weathering (oxidation) on older drill samples.
Sampling of the final pit surface considered the drillholes where the bottom of the pit was taken into account, in accordance with the pit design provided by BCM.
The execution of the sampling plan is described in detail below:

Rev: 0 Date: October 2010 J07.82.13.02: Feasibility Study – NI 43-101 Technical Report – Santa Ana Project 139
• When considering waste rock, the segment corresponding to the waste rock was first identified, and then samples were taken every ten centimetres for every two meters of core samples; and
• When considering the final pit walls, the segment to be sampled was identified, and a sample two meters in length was then extracted, taking half of the sample found in the core boxes.
Thirty samples of waste rock material and 23 samples of the material which will make up the final pit surface were collected.
23.7.3.2 Results The materials analyzed contained low levels of both sulfur and sulphide(<0.24%),and are made up of materials such as quartz, clays, and aluminosilicates, which are very stable materials, and slow to react in terms of acid consumption. The presence of barite in these samples calls for caution, due to its association with the presence of base metal sulphides, such as the sphalerite and galena encountered in samples of the QFP dike and the Andesitic Lava materials.
Mn, Sr, and Zn could be considered elements of interest in the analysis conducted of total metallic elements present and short term leach testing. However, further analysis must be conducted on these elements, given that their potential to dissolve is conditioned by the manner in which this waste is disposed of affecting the oxygen reducing conditions of the surrounding environment, and other factors. The high Pb content (750-4160 ppm) encountered in solid samples should be taken into account, even though the pH of the surrounding environment remains neutral, a factor which is not considered conducive to the release of this metal.
Kinetic tests were conducted on two composites of the material which will make up the final pit surface, on fractured sandstone. For 23 weeks of pH testing, values remained within the 5.17 to 6.68 range (near-neutral). Sulphide levels did not exceed 27 mg/L, which is indicative of the fact that oxidation in the cell developed at a slow rate. For metal leaching, the mobility of elements such as lead (Pb), magnesium (Mn) and zinc (Zn) was evaluated, the results of which are included in the Acid Rock Drainage study conducted by Ausenco Vector (2010).
23.7.3.3 Conclusions The results of this study indicate that the pH of effluents that come into contact with the model waste materials tested will remain in near-neutral conditions over the long term, and the monitoring of elements such as Mn, Sr, Zn and Pb throughout the length of mine operations is recommended in order to determine the mobilization potential of metals in any effluent discharge.
23.7.4 Closure Closure legislation (Peruvian Law 28090) requires that every mining operation must have an approved closure plan and financial guarantees capable of covering the estimated closure costs. The closure plan must be developed and submitted to the Ministry of Energy and Mines (MINEM) within a year of the approval of the ESIA, and must be approved by the MINEM prior to receipt of permission to operate.
The ESIA is required to include a conceptual closure plan for the operation, with the objective of ensuring the physical and chemical stability of the diverse components of the project after closure and returning the environment to a condition similar to that found before implementation of the project.

Rev: 0 Date: October 2010 J07.82.13.02: Feasibility Study – NI 43-101 Technical Report – Santa Ana Project 140
The plan must address progressive, final and post closure stages, and also include a contingency plan in the event of temporary or early closure.
23.7.4.1 Reclamation and Closure by Facility The principal activities at closure relate to the open pit, leach pad, and waste stockpiles, assuring physical and geochemical stability, including appropriate measures to mitigate the impacts of acid generating material (such as construction of low permeability cover systems).
Typical principal closure activities likely for the project, based on the FS design, are described below. More assessment will be required in conjunction with detailed level engineering and the development of the ESIA for the project.
Open Pit
The open pit must be hydrologically and hydrogeologically analyzed in order to determine if the groundwater and precipitation reporting to the pit during closure and post-closure phases could accumulate and create a lake. These studies will provide the volumes of water that will be discharged. It is assumed that for the pit the following principal closure activities will be required:
• Reshaping of parts of the pit; and
• Construction of water management structures.
Leach Pad
For the leach pad, it is assumed that the following principal closure activities will be required:
• Reshaping slopes of the leach pad;
• Construction of water management structures;
• Installation of a low permeability cover system; and
• Revegetation of the leach pad area.
Waste Rock Facilities
It is assumed that for the Waste Rock Facilities (WRF) the following principal closure activities will be required:
• Reshaping of WRF slopes;
• Construction of water management structures, where needed;
• Installation of organic or inert cover soils over the WRF; and
• Revegetation of the WRF.
Processing Areas and Buildings
In addition, the closure plan provides for demolition of facilities and most constructed infrastructure, and leveling of the affected areas. It is assumed that for the plant and processing areas, office buildings and camp site, the following principal closure activities will be required:

Rev: 0 Date: October 2010 J07.82.13.02: Feasibility Study – NI 43-101 Technical Report – Santa Ana Project 141
• Demolition and/or removal/disposal of structures;
• Reshaping/grading of disturbed areas;
• Installation of organic cover soils;
• Revegetation of disturbed areas; and
• Construction of water management structures, where required.
General
Depending on the requirements of government regulators and the local communities, it is possible that ownership of some of the infrastructure, i.e. the electrical transmission line, camps, and road access might be transferred to the community for its use post-closure.
23.7.4.2 Post Closure Post-closure refers to the monitoring and maintenance following completion of closure activities, which verify compliance with the closure objectives.
23.7.4.2.1 Maintenance After the final closure, a minimum 3 year period of active maintenance must follow, in order to ensure both the physical and chemical stability of the mine site. It is recommended that a team is made responsible for maintenance and should remain on site during this period. Once active maintenance has been completed, a passive maintenance stage will begin, during which the team will carry out inspections and periodic work. A minimum of 2 years is required for this stage.
The maintenance team should be composed of an engineer and a group of workers. They will be required to monitor the physical and chemical stability of the closed components and carry out any maintenance activities required.
23.7.4.2.2 Monitoring The maintenance team must permanently monitor the facilities during the active closure stage and periodically monitor during the passive closure stage.
23.8 Project Execution The project will be developed into a mine over the next 24 months. The figure below illustrates the major parts of the development plan. First the company will present the ESIA to the Peruvian authorities prior to the end of 2010. There will then be a period of review by the government that is expected to last 6 to 9 months. In late 2010 and early 2011, the detailed project engineering will commence and is estimated to be completed in approximately 9 months. Following ESIA approval the Company will advance the permitting process by obtaining the necessary construction and operating permits. In late 2011, once the proper permits are obtained, the principal off-site project infrastructure will developed. This will include the power line, the upgrading of the access road, the construction of the water supply pipeline and drilling of any additional production water wells. Any temporary construction housing will be installed in preparation for the on-site construction. Finally, the onsite construction will start in the 2nd quarter of 2012 or earlier depending on the end of the rainy season and continue through the dry season. Commercial production will start in early part of the fourth quarter of 2012, or earlier if the rainy season permits liner installation sooner.

Rev: 0 Date: October 2010 J07.82.13.02: Feasibility Study – NI 43-101 Technical Report – Santa Ana Project 142
Table 23.9 Project Development Plan
Item / Period Q4 2010
Q1 2011
Q2 2011
Q3 2011
Q4 2011
Q1 2012
Q2 2012
Q3 2012
Q4 2012
ESIA Review
Detailed Engineering
Permitting
Off-site Infrastructure Construction
Site Development
Production
23.9 Economic Analysis
23.9.1 Economic Model
23.9.1.1 General Criteria General technical-economic parameters used in the model are summarized in Table 23.10¡Error! No se encuentra el origen de la referencia. The model is presented before taxes and assumes 100-percent equity (i.e. no leverage) to provide an unbiased view of the project’s merits. It has been estimated using 4th Quarter 2010 United States dollars. There is no provision for inflation or currency fluctuations.
The financial model assumes the following general model criteria:
Table 23.10 General Model Criteria
Description Values Construction Period 24 months Mine Life (after preproduction) 11 years Life of Mine (LoM) Ore Tonnage 37,077,000 Life of Mine (LoM) Silver Grade (g/t) 53.00 Average Annual Recovered Silver, Years 1-11 (oz/year) 4,008,694 Average Annual Recovered Gold, Years 1-11 (oz/year) 650 Silver Average Price (U.S.$/oz) Gold Average Price (U.S.$/oz)
$14.50 $950.00
Cost Basis 4th Quarter 2010 Inflation/Currency Fluctuation None Leverage 100% Equity Income Tax Pre-tax
23.9.1.2 Mine and Process Production Table 23.11 shows the mine and processing production schedules for the life of the mine.

Rev: 0 Date: October 2010 J078213.02: Feasibility Study – NI 43-101 Technical Report – Santa Ana Project 143
Table 23.11 Life of Mine Production Schedule
23.9.1.3 Average LoM Operating Costs Table 23.10 shows the life of mine and average life-of-mine operating costs for the project.
Table 23.12 Operating Cost
Description Fixed or Variable Life of Mine Cost
Average Annual Cost (11 Year
Average) Average Annual Cost
per Tonne Ore
Operating Costs Mining Variable $ 207,645,368 $ 18,876,852 $5.60
Crushing, Leaching and Lab Work Variable $ 118,150,772 $ 10,740,979 $3.19 G&A Fixed $ 43,523,427 $ 3,956,675 $1.17
Totals $ 369,319,566 $ 33,574,506 $9.96
Total PPDUnits or Average -1 1 2 3 4 5 6 7 8 9 10 11 12
MINEOre Processed Crushed t 37,077,000 3,600,000 3,600,000 3,600,000 3,600,000 3,600,000 3,600,000 3,600,000 3,600,000 3,600,000 3,600,000 1,077,000 0
Silver Ore Grade g/t 53.00 58.35 60.50 59.10 57.60 59.00 55.60 53.10 49.70 47.00 36.97 29.87 0.00CONTAINED METALSSilver oz 63,179,850 6,754,123 7,002,433 6,840,393 6,666,779 6,828,819 6,435,293 6,145,937 5,752,412 5,439,906 4,279,476 1,034,280 0
PROCESSProcess RecoveriesRecovered Silver oz 44,223,686 3,891,414 4,870,714 4,808,098 4,688,007 4,759,872 4,553,203 4,337,766 4,075,210 3,846,436 3,139,158 1,125,752 128,055 Recovered Gold (.006 g/t-ore) oz 7,152 694 694 694 694 694 694 694 694 694 694 208 - Contained Metal with Transit Loss:Loss in Transit % 0.00 0.00 0.00 0.00 0.00 0.00 0.00 0.00 0.00 0.00 0.00 0.00 0.00Silver oz 44,223,686 3,891,414 4,870,714 4,808,098 4,688,007 4,759,872 4,553,203 4,337,766 4,075,210 3,846,436 3,139,158 1,125,752 128,055
Metal Payfors Silver % 99.75% 99.75% 99.75% 99.75% 99.75% 99.75% 99.75% 99.75% 99.75% 99.75% 99.75% 99.75% 99.75%Payable Silver oz 44,113,127 3,881,685 4,858,538 4,796,078 4,676,287 4,747,972 4,541,820 4,326,922 4,065,022 3,836,820 3,131,310 1,122,937 127,735
Net Weight Deduction oz 500 451 454 460 456 467 478 491 502 537 151 (6)Gold % 95.00% 95.00% 95.00% 95.00% 95.00% 95.00% 95.00% 95.00% 95.00% 95.00% 95.00% 95.00% 95.00%Payable Gold oz 4,700 475 428 431 437 434 443 454 466 477 511 144 -
Payable Metals:Silver oz 44,113,127 3,881,685 4,858,538 4,796,078 4,676,287 4,747,972 4,541,820 4,326,922 4,065,022 3,836,820 3,131,310 1,122,937 127,735Gold oz 4,700 475 428 431 437 434 443 454 466 477 511 144 - Total oz 44,117,827 3,882,160 4,858,966 4,796,509 4,676,724 4,748,406 4,542,264 4,327,376 4,065,488 3,837,297 3,131,821 1,123,081 127,735
Production Year

Rev: 0 Date: October 2010 J07.82.13.02: Feasibility Study – NI 43-101 Technical Report – Santa Ana Project 144
23.9.1.4 Capital Cost Summary The project capital cost estimate has been prepared by two independent engineering companies. The mining costs were prepared by Independent Mining Consultants of Tucson, Arizona, and the process heap leach and infrastructure costs have been prepared by Ausenco Vector of Peru. The initial startup capital is estimated to be $68.8 million and the total life of mine capital cost is estimated to be $83.8 million. The initial capital equates to $1.56 per ounce of silver recovered. The life of mine capital costs used in the financial model include detailed long-term plans for heap leach expansions as well as ongoing mine closure and monitoring. Sustaining capital expenditures are estimated at an average $1.4 million per year over the 11-year life of the mine.
Tabulated below are the Capital costs for each of the principal areas.
Table 23.13 Capital Cost Summary
Item Cost Civil Works $13,598,000 Water Supply $3,215,000 Process Plant $15,099,000 Auxiliary Facilities $5,859,000 Water Distribution $2,403,000 Electrical (LT & Distribution) $9,709,000 Crusher System $4,763,000 Preproduction Mine Development & Equipment $9,909,000 Owners Costs $4,226,000 Total Initial Capital $68,781,000
The estimates of the Capital Costs have been prepared to a feasibility level with a 15% contingency applied to the estimates. An additional 15% has been added for Engineering Procurement and Construction Management (EPCM).
23.9.1.5 Sustaining Cost Summary Table 23.14 summarizes sustaining capital requirements over the life of the mine.

Rev: 0 Date: October 2010 J078213.02: Feasibility Study – NI 43-101 Technical Report – Santa Ana Project 145
Table 23.14 Sustaining Cost
Year Yr 1 Yr 2 Yr 3 Yr 4 Yr 5 Yr 6 Yr 7 Yr 8 Yr 9 Yr 10 Yr 11 Yr 12 Total
Leach Pad 4,591,326$ 4,313,126$ 8,904,452$ Waste Dump Facility 382,461$ 427,645$ 345,663 229,201$ 256,479$ 213,634$ 144,080$ 153,563$ 157,309$ 329,829$ 2,639,864$ Contracted Indirects 57,369$ 752,846$ 51,849$ 34,380$ 685,441$ 32,045$ 21,612$ 23,034$ 23,596$ 49,474$ -$ -$ 1,731,648$
Contingency 57,369$ 752,846$ 51,849$ 34,380$ 685,441$ 32,045$ 21,612$ 23,034$ 23,596$ 49,474$ -$ -$ 1,731,648$ Total 497,199$ 6,524,663$ 449,361$ 297,962$ 5,940,487$ 277,724$ 187,304$ 199,632$ 204,502$ 428,777$ -$ -$ 15,007,612$
Sustaining Capital Summary

Rev: 0 Date: October 2010 J078213.02: Feasibility Study – NI 43-101 Technical Report – Santa Ana Project 146
23.9.1.6 Working Capital Working Capital was calculated as the largest amount of funds required during the initial operating period to provide for the cash disbursement for expenses prior to the cumulative revenue offsetting the cumulative expenses; that is, when the operation becomes self-sustaining in its cash flow.
The revenue was calculated on a weekly basis, based on the leaching cycle of the material. The following ramp-up resulted:
• Month 1: 0 percent production;
• Month 2: 71 percent production;
• Month 3: 83 percent production;
• Month 4: 89 percent production;
• Month 5: 91 percent production; and
• Month 13: 100 percent production.
Revenue was projected based on receipt of 100 percent of production revenue, five weeks after the shipping date. Weekly shipment of product starts six weeks after ore crushing begins.
Average weekly expenditure rates were calculated from the operating costs for Year 1. The processing and G&A labour costs were calculated as being disbursed on average every two weeks; transport, treatment and refining cost for product were calculated by reducing revenue payments. 100% of contract mining, 33% of processing and 25% of G&A costs were calculated as weekly disbursals; the balance of expenses were timed to be expended one month after being invoiced.
The largest deficiency of funds would occur in Week 10, at an amount of $6,654,870. This working capital cost was input into the economic cash flow, in production year +1.
23.9.1.7 Base Case Analysis The base-case financial model was developed on information presented in this report as listed in Tables 23.9, 23.10, 23.11, 23.12.
The NPV at a discount rate of five (5%) percent (pre-tax) over the assumed mine life is $85,283,009. The Internal Rate of Return (IRR) is 25.3 percent before income tax, depreciation and IGV. Payback is estimated to be approximately 3.4 years after start of production. The base-case sensitivities according to discount rate are presented in Table 23.13
Table 23.15 Base Case Sensitivities
NPV before tax, depreciation, and IGV for varying discount rates:
Discount Rate 0% 5% 8% NPV ($/millions) $143,577,074 $ 85,283,009 $ 61,441,705

Rev: 0 Date: October 2010 J078213.02: Feasibility Study – NI 43-101 Technical Report – Santa Ana Project 147
23.9.1.8 Sensitivity Analysis to Base Case In this section, cost and price sensitivities are presented in Table 23.14, initial capital cost and operating cost in Table 23.15, recovery sensitivities are presented in Table 23.16. Graphical presentations are shown in Figures 23.22 and 23.23, which follow the tables.
Table 23.16 Silver Price Sensitivities
Silver Metal Price -20% -10% 0% 10% 20% Silver Metal Price ($/oz) $11.60 $13.05 $14.50 $15.95 17.40
NPV @5% ($) ($3,425,766) $41,036,612 $85,283,009 $129,437,875 $173,497,288
IRR (%) 4% 16% 25% 34% 42%
Table 23.17 Capital Cost and Operating Cost Sensitivities
Initial Capital Cost -20% -10% 0 10% 20%
NPV @5% ($) $97,857,856 $91,570,432 $85,283,009 $78,995,585 $72,708,161
IRR (%) 32% 28% 25% 23% 20%
Operating Cost -20% -10% 0 10% 20%
NPV @5%($) $137,733,914 $111,508,461 $85,283,009 $59,057,556 $32,832,103
IRR 36% 31% 25% 20% 13%
Table 23.18 Sensitivities on Recovery
Overall Silver Recovery 56% 63% 70% 77% 84%
-20% -10% 0.00% 10% 20%
NPV ($ millions) $715,108 $43,101,995 $85,283,009 $127,382,953 $169,395,001
IRR (%) 5% 16% 25% 34% 41%

Rev: 0 Date: October 2010 J078213.02: Feasibility Study – NI 43-101 Technical Report – Santa Ana Project 148
Figure 23.24 NPV Sensitivity Analysis
Figure 23.25 IRR Sensitivity Analysis
23.9.1.9 Economic Model The base-case financial model presentation for cash flow is presented in Table 23.17.
(150,000,000)
(100,000,000)
(50,000,000)
-
50,000,000
100,000,000
150,000,000
200,000,000
250,000,000
300,000,000
-40% -30% -20% -10% 1.00 10% 20% 30% 40%
$
Santa Ana Sensitivity Analysis NPV @ 5% Before Tax
Capital Cost Operating Cost Recovery Ag Price
-10%
0%
10%
20%
30%
40%
50%
60%
70%
-40% -30% -20% -10% 1.00 10% 20% 30% 40%
$
Santa Ana Sensitivity Analysis IRR Before Tax
Capital Cost Operating Cost Recovery Ag Price

Rev: 0 Date: October 2010 J07.82.13.02: Feasibility Study – NI 43-101 Technical Report – Santa Ana Project 149
Table 23.19 Base Case Financial Cash Flow
Units Total -2 -1 1 2 3 4 5 6 7 8 9 10 11 12 13 14 15 16 17 18
PRODUCTION SUMMARY
Production Data
Ore Processed t 37,077,000 3,600,000 3,600,000 3,600,000 3,600,000 3,600,000 3,600,000 3,600,000 3,600,000 3,600,000 3,600,000 1,077,000 0 0 0 0 0 0 0
Recovered Metals
Silver oz 44,223,686 3,891,414 4,870,714 4,808,098 4,688,007 4,759,872 4,553,203 4,337,766 4,075,210 3,846,436 3,139,158 1,125,752 128,055 0 0 0 0 0 0
Gold oz 6,458 694 694 694 694 694 694 694 694 694 208 0 0 0 0 0 0 0 0
GROSS INCOME FROM MINING
Market Price
Silver $/oz 14.50 14.50 14.50 14.50 14.50 14.50 14.50 14.50 14.50 14.50 14.50 14.50 14.50 0.00 0.00 0.00 0.00 0.00 0.00
Gold $/oz 950.00 950.00 950.00 950.00 950.00 950.00 950.00 950.00 950.00 950.00 950.00 950.00 950.00 950.00 950.00 950.00 950.00 950.00 950.00
Payable Metals
Silver oz 44,113,127 3,881,685 4,858,538 4,796,078 4,676,287 4,747,972 4,541,820 4,326,922 4,065,022 3,836,820 3,131,310 1,122,937 127,735 0 0 0 0 0 0
Gold oz 4,700 475 428 431 437 434 443 454 466 477 511 144 0 0 0 0 0 0 0
Metal Revenues
Silver $ 639,640,338 56,284,436 70,448,796 69,543,130 67,806,167 68,845,597 65,856,393 62,740,369 58,942,816 55,633,887 45,403,997 16,282,588 1,852,162 0 0 0 0 0 0
Gold 4,464,830 451,115 406,924 409,750 415,169 411,926 421,252 430,974 442,821 453,145 485,061 136,693 0 0 0 0 0 0 0
Total Gross Revenue $ 644,105,168 56,735,552 70,855,720 69,952,879 68,221,336 69,257,523 66,277,645 63,171,342 59,385,637 56,087,032 45,889,058 16,419,281 1,852,162 0 0 0 0 0 0
NSR CALCULATIONS
Shipping and Treatment Charge
Silver and Gold $0.63 $/oz 27,794,231 2,445,761 3,061,149 3,021,801 2,946,336 2,991,496 2,861,626 2,726,247 2,561,257 2,417,497 1,973,047 707,541 80,473 0 0 0 0 0 0
Total Transportation and TC/RC Charges $ (27,794,231) (2,445,761) (3,061,149) (3,021,801) (2,946,336) (2,991,496) (2,861,626) (2,726,247) (2,561,257) (2,417,497) (1,973,047) (707,541) (80,473) 0 0 0 0 0 0
NSR $ 616,310,937 54,289,791 67,794,572 66,931,079 65,275,000 66,266,028 63,416,019 60,445,096 56,824,380 53,669,535 43,916,011 15,711,740 1,771,689 0 0 0 0 0 0
ROYALTY CALCULATIONS
Peruvian Royalty Tax- 1% on first $60 million 1% $ (5,861,831) (542,898) (600,000) (600,000) (600,000) (600,000) (600,000) (600,000) (568,244) (536,695) (439,160) (157,117) (17,717) 0 0 0 0 0 0
Peruvian Royalty Tax- 2% on amount greater than $60 million 2% $ (602,556) 0 (155,891) (138,622) (105,500) (125,321) (68,320) (8,902) 0 0 0 0 0 0 0 0 0 0 0
Gross Income from Mining $ 609,846,550 53,746,893 67,038,680 66,192,457 64,569,500 65,540,707 62,747,698 59,836,194 56,256,136 53,132,839 43,476,851 15,554,623 1,753,972 0 0 0 0 0 0
OPERATING MARGIN
Operating Costs
Unit Costs 1.00
Average Mining and Material Handling $/t ore $5.05 6.08 6.28 6.52 6.51 6.46 6.12 5.67 4.79 4.65 3.36 4.13 0.00
Crushing, Leaching, and Lab work $/t ore $3.19 3.19 3.19 3.19 3.19 3.19 3.19 3.19 3.19 3.19 3.19 3.19 3.19
Average G&A $/t ore $1.17 1.17 1.17 1.17 1.17 1.17 1.17 1.17 1.17 1.17 1.17 1.17 1.17
Average Total Unit Operating Cost $/t ore 9.40 10.44 10.63 10.88 10.87 10.82 10.47 10.03 9.15 9.00 7.72 8.49 4.36
Annual Operating Costs
Mining and Material Handling $ (207,645,368) (21,886,427) (22,600,075) (23,468,653) (23,442,012) (23,266,228) (22,026,094) (20,410,122) (17,259,710) (16,733,273) (12,102,719) (4,450,055) 0
Crushing, Leaching, and Lab work $ (118,150,772) (11,471,877) (11,471,877) (11,471,877) (11,471,877) (11,471,877) (11,471,877) (11,471,877) (11,471,877) (11,471,877) (11,471,877) (3,432,003) 0
G&A $ (43,523,427) (4,212,000) (4,212,000) (4,212,000) (4,212,000) (4,212,000) (4,212,000) (4,212,000) (4,212,000) (4,212,000) (4,212,000) (1,260,090) (143,337)
Closure Costs
Closure Progressive $ 4,091,646.07$ (1,022,912)$ (2,045,823)$ (1,022,912)$ -$
Final Closure (Letter of Credit) $ 5,068,506.04$ (2,534,253)$ (2,534,253)$
Maintenance and Monitoring $ 3,612,667.09$ (722,533)$ (722,533)$ (722,533)$ (722,533)$ (722,533.42)$
Bond for Final Closure $ (789,198)$ (1,578,395)$ (2,367,593)$ (3,156,790)$ (3,945,988)$ (4,735,185)$ (5,524,383)$ (6,313,580)$ (7,102,778)$ (7,891,976)$ (8,681,173)$ (8,681,173)$ (6,146,920)$ (3,612,667)$ (2,890,134)$ (2,167,600)$ (1,445,067)$ (722,533)$
Subtotal Letter of Credit $ (3,946)$ (7,892)$ (11,838)$ (15,784)$ (19,730)$ (23,676)$ (27,622)$ (31,568)$ (35,514)$ (1,062,371)$ (2,089,229)$ (3,600,570)$ (2,564,988)$ (740,597)$ (736,984)$ (733,371)$ (729,759)$ (726,146)$
Total Annual Operating Costs $ (376,249,307) (37,574,250) (38,291,843) (39,164,368) (39,141,672) (38,969,835) (37,733,647) (36,121,620) (32,975,155) (32,452,664) (28,848,967) (11,231,377) (3,743,907) (2,564,988) (740,597) (736,984) (733,371) (729,759) (726,146)
Net Profit Before Depreciation $ 233,597,243 16,172,643 28,746,837 27,028,090 25,427,827 26,570,872 25,014,051 23,714,574 23,280,981 20,680,175 14,627,883 4,323,246 (1,989,935) (2,564,988) (740,597) (736,984) (733,371) (729,759) (726,146) Amortization of Santa Ana pre construction expenditures - $23.96 million $ (23,960,000) (2,108,333) (2,638,910) (2,604,985) (2,539,921) (2,578,856) (2,466,885) (2,350,163) (2,207,912) (2,083,965) (1,700,768) (609,922) (69,379) 0 0 0 0 0 0 Tax losses available for use (positive means carrying/ negative is applying) $ (14,414,000) (3,672,622) (10,741,378) 0 0 0 0 0 0 0 0 0 0 0 0 0 0 0 0
Depreciation $ (84,257,053) (10,391,687) (11,370,386) (11,437,790) (11,482,485) (12,373,558) (12,415,216) (8,979,416) (1,755,337) (1,718,608) (1,198,048) (871,228) (263,293) 0 0 0 0 0 0
Net Profit Before Taxes $ 149,340,190 0 3,996,163 12,985,314 11,405,422 11,618,458 10,131,950 12,384,994 19,317,732 16,877,603 11,729,067 2,842,096 (2,322,607) (2,564,988) (740,597) (736,984) (733,371) (729,759) (726,146)
Profit Sharing 8% $ (9,063,104) 0 (319,693) (1,038,825) (912,434) (929,477) (810,556) (990,800) (1,545,419) (1,350,208) (938,325) (227,368) 0 0 0 0 0 0 0
Subtotal 0 3,676,470 11,946,489 10,492,988 10,688,981 9,321,394 11,394,194 17,772,313 15,527,394 10,790,742 2,614,728 (2,322,607) (2,564,988) (740,597) (736,984) (733,371) (729,759) (726,146)
Income Tax @ 30% $ (31,267,708) 0 (1,102,941) (3,583,947) (3,147,896) (3,206,694) (2,796,418) (3,418,258) (5,331,694) (4,658,218) (3,237,222) (784,418) 0 0 0 0 0 0 0
Net Profit After Taxes $ 118,072,482 0 2,573,529 8,362,542 7,345,092 7,482,287 6,524,976 7,975,936 12,440,619 10,869,176 7,553,519 1,830,310 (2,322,607) (2,564,988) (740,597) (736,984) (733,371) (729,759) (726,146)
Add-Back Non-Cash Depreciation $ 84,257,053 10,391,687 11,370,386 11,437,790 11,482,485 12,373,558 12,415,216 8,979,416 1,755,337 1,718,608 1,198,048 871,228 263,293 0 0 0 0 0 0
Add-back amortization $ 23,960,000 2,108,333 2,638,910 2,604,985 2,539,921 2,578,856 2,466,885 2,350,163 2,207,912 2,083,965 1,700,768 609,922 69,379 0 0 0 0 0 0
Add-back tax loss carry forward $ 14,414,000 3,672,622 10,741,378 0 0 0 0 0 0 0 0 0 0
Capital Costs: 1.00
Mine, Process, Infrastructure & Owner's Costs $ (53,813,367) (10,762,673) (43,050,694)
Preproduction Mine Development & Equipment $ (9,908,563) (9,908,563)
Owners Costs $ (4,226,150) (4,226,150)
Spare Parts $ 0 (832,633) 0 0 0 0 0 0 0 0 0 0 0 832,633
Total Capital Costs $ (68,780,713) (10,762,673) (58,018,039)
Sustaining Capital 13,462,587
Sustaining Capital $ (15,007,612) (497,199) (6,524,663) (449,361) (297,962) (5,940,487) (277,724) (187,304) (199,632) (204,502) (428,777) 0 0 0 0 0 0 0 0
Working Capital Expenditures $ (6,654,870) (6,654,870) 0 0 0 0 0 0 0 0 0 0 0 0 0 0 0 0 0
Working Capital Recapture $ 6,654,870 0 0 0 0 0 0 0 0 0 0 6,654,870 0 0 0 0 0 0
IGV (VAT) 19% $ (13,068,335) (2,044,908) (11,023,427)IGV (VAT) Recapture- $8,442,000 million added for existing Santa Ana Balance 19% $ 21,510,335 10,779,755 10,730,581 0
Plus Salvage Value $ 2,500,000 0 0 0 0 0 0 0 0 0 0 0 2,500,000 0 0 0 0 0
ANNUAL CASH FLOW $ 115,020,895 (12,807,581) (69,041,467) 19,800,328 31,530,121 21,955,956 21,069,535 16,494,214 21,129,353 19,118,212 16,204,237 14,467,247 10,023,558 3,311,460 5,497,568 (64,988) (740,597) (736,984) (733,371) (729,759) (726,146)
CUMULATIVE CASH FLOW (12,807,581) (81,849,048) (62,048,720) (30,518,600) (8,562,644) 12,506,892 29,001,105 50,130,458 69,248,670 85,452,907 99,920,154 109,943,712 113,255,172 118,752,740 118,687,752 117,947,155 117,210,171 116,476,800 115,747,041 115,020,895
After Tax IRR
IRR = 21.8%NPV ($) @ 8.0% $46,502,778
NPV ($) @ 5.0% $66,458,082
NPV ($) @ 0.0% $115,020,895
ANNUAL CASH FLOW BEFORE TAX, IGV, & DEPRECIATION $ 143,577,074 (10,762,673) (58,018,039) 9,020,573 22,222,174 26,578,728 25,129,866 20,630,385 24,736,327 23,527,270 23,081,349 20,475,674 14,199,106 4,323,246 4,664,935 (2,564,988) (740,597) (736,984) (733,371) (729,759) (726,146)
CUMULATIVE CASH FLOW (10,762,673) (68,780,713) (59,760,140) (37,537,966) (10,959,238) 14,170,628 34,801,013 59,537,339 83,064,609 106,145,958 126,621,632 140,820,738 145,143,983 149,808,918 147,243,931 146,503,334 145,766,350 145,032,979 144,303,220 143,577,074
Before Tax IRR
IRR = 25.3% 2,094,155
NPV ($) @ 8.0% $61,441,705 (5.23)
NPV ($) @ 5.0% $85,283,009
NPV ($) @ 0.0% $143,577,074
Production Years Closure YearsPre-production Years
Rev: 0 Date: October 2010 J078213.02: Feasibility Study – NI 43-101 Technical Report – Santa Ana Project 150
23.9.2 Taxes and Royalties Along with the pre-tax financial model, a financial model was prepared that incorporated the prevailing Peruvian corporate tax regime and took into account the current tax situation of the holding company of the Santa Ana project. Only losses and expenses that can be used by the current holding company of the Santa Ana project were used, no additional tax advantages were used that could be applied from other projects were used.
The assumptions used in calculating the taxes were as follows.
• The Peruvian production royalty was applied to the gross revenue at 1% for the first $60 million of annual revenue, 2% on the next $60 million (increment of revenue $60 to $120 million) and 3% to any revenue above $120 per year;
• All capital was depreciated using straight line depreciation per year of 15%, with 10% being applied in year 7;
• $23.96 million of pre-production expenses were amortizes over the life of the project on a silver ounces units-of-production basis;
• Peruvian mandatory employee profit sharing of 8% is applied to the net profits. This cost is a pre-tax expense;
• A 30% Peruvian corporate tax was applied to the net profits;
• The company will have $14.414 million in tax loss carry-forward available in 2013 and this was applied in financial model to reduce payable taxes until the balance was reduced to zero; and
• In Peru the there is a value added tax called the IGV which is applied to all goods and services at a rate of 19%. The company can recuperate this tax as the production will be exported. The company will have a credit of $8.442 million that will be recuperated once commercial production starts. In addition, a total of $13.068 million in IGV will be paid during construction of the project. The Company can recuperate these taxes based on 19% of the gross revenues in the early years of production. In the financial model, the IGV is recuperated in the first 2 years of operation.
In the financial model, the company will pay $6.46 million in Peruvian production royalty, $9.06 million in mandatory employee profit sharing and $31.3 million in corporate income tax.
23.10 Opportunities
23.10.1 Finer Crushing Bear Creek has completed six column leach test at McClelland Labs and over one-hundred leach amenability tests. The results have consistently demonstrated that the Santa Ana ore responds well to conventional heap leaching techniques. The overall recovery is expected to be 70% silver for minus 19mm (¾ inch) crushed material. More recent column tests indicate that further improvements in recovery to 75% silver can be achieved by crushing the ore to minus 9.5mm (3/8 inch). The preliminary results of the finer crushed column tests are shown in Figure 16.2 and the increased recovery rate is clearly evident from this test.
McClelland Laboratories is currently performing a column test on minus 9.5mm (3/8 inch) crushed material. The 168hr. bottle roll test preliminary results indicated an 11.3% recovery gain over the p80 19mm bottle roll tests. A portion of the recovery gain can be attributed to faster leaching at the

Rev: 0 Date: October 2010 J078213.02: Feasibility Study – NI 43-101 Technical Report – Santa Ana Project 151
smaller size. The column test at p80 9.5mm through 49 days of leaching had extracted nearly as much silver as the p80 19mm column did in 144 days of leaching. The column work holds the promise of increasing the final silver recovery by 5% in one half of the leach time. BCM will release the results when this long-term test is finished. Initial results strongly indicate an improvement in recovery and acceleration of the silver leaching.
Reducing the crushed ore size to a minus 9.5mm product (3/8 inch) involves capital cost expenditures for a necessary third crusher stage adding approximately $2M in capital cost and 0.30/t in operating costs. With the additional recovery of silver this should result in a reduction in cash costs per ounce by $0.30 from the base case. Additional cost savings (not calculated) would be realized in reducing the amount of recirculation of solutions needed to complete the leach cycle.
Figure 23.25 below shows the recovery by grain size fraction achieved in the last ¾ inch (19mm) column leach test performed at McClelland Labs. It clearly shows that there is a large improvement in the recovery of silver when the material is crushed fine. This is why it is anticipated that there will be an increase in recovery when the crush size is reduced from ¾ of an inch (19 mm) to 3/8 of an inch (9.5 mm).
Figure 23.26 Silver Recovery vs. Ore Grain Size
23.10.2 Northern Extension The Company discovered a new style of base metal-rich mineralization in the northwest portion of the project 4 holes (SA-221, SA-222, SA-241 and SA-241A). The location of these four holes is shown in Figure 23.8 and the grades of the mineralized sections are tabulated below. This new zone includes abundant fine sulfide mineralization containing higher lead and zinc than is common in the central zone of the South Anomaly. This new zone trends towards the Northern Anomaly which has been a target for exploration for some time but has received only surface mapping and

Rev: 0 Date: October 2010 J078213.02: Feasibility Study – NI 43-101 Technical Report – Santa Ana Project 152
prospecting up to this time. The Company plans to expand its exploration efforts in this area to identify targets for future expansions of the mine plan.
Table 23.20 Northern Extension Drilling
Drillhole ID
Azimuth (degrees)
Inclination (degrees)
Total Depth
From(m)
To (m)
Depth Interval
(m) Silver (g/t)
Lead (%)
Zinc (%)
SA- 221 110 -60 106 74 104 30 36.1 1.3 2.3
SA- 222 110 -60 108.6 18 50 32 48.8 1.2 2.0
SA- 241 90 -70 152.6 36 56 20 28.6 1.4 1.3
and 86 98 12 63.5 2.1 1.2
and 116 132 16 47.4 0.3 0.5
SA- 241A 270 -70 115 66 96 30 62.7 1.1 0.5
Figure 23.27 Northern Drilling Location Map

Rev: 0 Date: October 2010 J078213.02: Feasibility Study – NI 43-101 Technical Report – Santa Ana Project 153
23.10.3 Longer Mine Life IMC prepared an alternative mine plan to the base case and it is discussed in detail in Section 23.1.6.2. Figure 23.28 shows the amounts of recoverable ounces of silver placed on the pad. Since both plans have a similar stripping ratio of approximately 2:1 this shows that the mine could be extended easily at the latter years of the project. The base case leaves 36 million ounces of measured and indicated silver resources in either stockpiles or pit walls that can lead to expanded mine life on the order of 50%. Relatively minor additional capital will be required in order to increase the size of the heap leach pad and waste dump sites for which there is ample area for expansions.
Figure 23.28 Current Mine Plan Production vs. Extended Life Alternate Plan
23.10.4 Deep Potential The mineralization at Santa Ana is controlled within wide structural corridors where the rock has been structurally shattered creating high permeability that was flooded with carbonate and silver mineralization. Many of the exploration holes end in ore-grade mineralization leaving the mineralization open for expansion at depth. Furthermore, high-grade structural feeder zones providing a source for the mineralizing fluids potentially underlie this large ore body and are considered targets for higher grade underground mining targets. The company will be targeting deep holes that will determine what type of mineralization occurs at depths of 300m to 400 m below the surface during 2011.

Rev: 0 Date: October 2010 J078213.02: Feasibility Study – NI 43-101 Technical Report – Santa Ana Project 154
24 Illustrations Figure 24.1 shows the general layout of the proposed Santa Ana mine, including the open pit, leach pad, waste rock facility, access roads, process plant and water supply pipeline.
Figure 24.2 shows the process flowsheet.

N 8 157 000N 8 157 000
N 8 160 000N 8 160 000
N 8 163 000N 8 163 000
E 465 000E 465 000
E 468 000E 468 000
E 471 000E 471 000
DATUM:
PROYECCIÓN:
APROBADO:
FECHA EMISIÓN:
ARCHIVO CAD:
REVISADO:
ESCALA:
DIBUJADO:
PROYECTO N°:
ZONA:
CLIENTE:
TÍTULO:
FIGURA Nº:
REVISIÓN:07.82.13.0219/10/2010C.TUEROSC.CÉSARD.PARRA
A
24.1UTMPSAD 56
191:30 000
X:\078213.XX BEAR CREEK - SANTA ANA PROJECT\078213.02 DFS\DESIGN\REV. A\NI43101\FIGURA 24.1.DWG
GENERAL LAYOUTSANTA ANA MINE
0600 300600 1 200 2 400
(EN METROS)1:30 000
EXISTING GROUND SURFACE CONTOURS
LIMIT OF CUT OR FILL
LEGEND
DESIGN LINE
EXISTING ACCESS ROAD
4200
EXISTING GULLIES
PROJECTED FACILITIES
GRADED SURFACE CONTOURS4200
PHASE 1, 2, 3 AND WASTE DUMP PROJECTEDSTACKING SURFACE CONTOURS4200
STOCKPILE LIMIT
OPEN PIT GRADED SURFACE CONTOURS4200
NOTAS:
1. IN JANUARY 2010, THE OWNER PROVIDED THE TOPOGRAPHY.
2. THE EXISTING FACILITIES LOCATED INSIDE THE CONSTRUCTION LIMITSWILL HAVE TO BE REMOVED AND/OR RELOCATED BY THE OWNERBEFORE THE BEGINNING OF CONSTRUCTION.
BEAR CREEK - MINING CORPORATIONDEFINITIVE FACILITY STUDY - SANTA ANA PROJECT
LEACH PAD, PONDS, WASTE DUMP, ACCESS ROADS AND FACILITIES
ISSUED FOR REVIEW
DIVERSION ACCESS ROAD
MINE ACCESS ROAD
WASTE ROCK FACILITY
OPEN PIT
ELECTRICAL TRANSMISSION LINE
TO POMATA
MAIN HAUL ROAD
TOP SOIL STOCKPILE 2
TOP SOIL STOCKPILE 1
LEACH PAD
PROCESS PLANT
CRUSHER
WATER TANK
WATER SUPPLY LINE
WATER SUPPLY WELL FIELD
SOLUTION PONDS

STREAM MASS BALANCE
L-01 L-02 L-03 L-04 L-05 L-06 L-07 L-08 L-09 L-10 L-11 L-12 L-13 L-14 L-15 L-16
DESCRIPTION UNITS
PHASE LIQUID LIQUID LIQUID SOLID / LIQUID SOLID / LIQUID LIQUID LIQUID SOLID LIQUID LIQUID LIQUID LIQUID LIQUID SOLID SOLID SOLID
SOLUTIONS (m3/h)(l) 571 0.0045 2.38 0.0182 0.190 0.0054 0.45 571 3.86 (l/s)
CONCENTRATION ppm (%)
------ ------ 10.7 (kg/hr) ------ ------ ------ ------ 928.3 (kg/day) 373.4 (kg/day)
FLOW
GOLD GRADE (AU)
(°C)
1%
SILVER GRADE (AG)
(g/m3) (%)
28.9-31.8
550
GOLD OUNCES 379.57
SILVER OUNCES 838.79
OPERATION TIME (hr) 24 24 24 24 24 24 2424 24 24
2.57
24
10
------
------
1%
------
------
------
------
------
2%
------
------
5%
------
------
99%
------
------
25% 10
------ ------
------ ------
25%
------
------
150 (ppm)
------
------
------
------
0.01 (%)
39.96 (%)
------
1,150
------
------
NOTES: LEGEND:
STREAM
CONTINUOUS PROCESS
DRAWING REFERENCE
NON-CONTINUOUS PROCESSSOLIDS
TEMERATURE
(Oz/day)
(Oz/day)
(g/m3) (%)
t/day
(kg/hr)(kg/day)
------
------
------
------
------
------
571
------
------
------
------
------
------
------
270
------
------
------
------
------
------
------
------
------
------
------
------
------
------
------
------
------
------
------
------
------
------
------
------
------ ------
------
------
------
------
------ 11927.9
------
------
------
------
------
8
270 ------------
SOLID SOLID
------
24 24
------
------
------
10,000
------
------
------
10.8
------
------
L-17 L-18
0.01 (gpt)
53.0 (gpt)
------
------
------
>80%
------
0.08 a 0.16
------
------
------ ------ 927.7 (kg/day)
379.57
838.79
0.08 a 0.16
3
11928
------------
------------
28.9-31.8
SLUDGE
B
CuSO4H2O2
ACIDWATER
SODIUMHYDROXIDE
SODIUMCYANIDE
SODIUM HYDROXIDEMIXING TANK
SODIUM CYANIDEMIXING TANK
SODIUM CYANIDEDOSING TANK
COMPRESSOR
FILTER PRESSES
BODY FEED TANK PRE COAT TANK
EFFLUENT DETOXIFICATION TREATMENT
DUST COLLECTION SYSTEM
SOLUTIONTANK
STOCKPILE
LIME STORAGE
NaOHBARREN SOLUTION
ACID WATER TREATMENT
LIMEFLOCCULANT
COMPRESSED AIR
------ ------
(*) Average temperature: 6 to 7 ºC
------ ------ ------ ------ ------ ------ ------ ------------ ------ ------------ ------
UNCLARIFIED
1. THE MASS BALANCE IS BASED ON10,000 TONNES/DAY OPERATIONAND A LEACH CYCLE OF 24 HR/DAY.
2. THE DESIGN ASSUMES AN OREMOISTURE CONTENT OF 4PERCENT IN THE WET SEASON AND3 PERCENT IN THE DRY SEASON.
3. GOLD AND SILVER GRADES ARETAKEN FROM THE PROJECTDESIGN CRITERIA
4. NOMINAL FLOW RATE IS 519 M3/HR.
DRY PRECIPITATE TORETORT
PRECIPITATE FROMFILTER PRESSES
PROCESS WATER
LEACH SOLUTIONTO
HEAP LEACH PAD135-PU-007/008
NaCN (25%)TO BARREN TANK
130-PU-005
antiscalantTO
BARREN TANK130-PU-020
NaCN (25%)TO EMULSIFIER
130-PU-006
ZINC DUSTADDITION145-TR-001
ADDITION OFLEAD NITRATE
SOLUTION145-TR-005
BODY FEEDADDITION TOCLARIFIERS
130-PU-009/010
PRE-COATADDITION TO FILTER
PRESSES130-PU-007/008
PRE-COATADDITION TO FILTER
CLARIFIERS130-PU-007/008
PREGNANT SOLUTIONTO MERRILL-CROWE
PLANT145-PU-001/002
ROMLIMETO
PAD
PREGNANT SOLUTIONTO PREGNANT
POND
antiscalantTO
PREGNANT POND130-PU-017
DATUM:
PROYECCIÓN:
APROBADO:
FECHA EMISIÓN:
ARCHIVO CAD:
REVISADO:
ESCALA:
DIBUJADO:
PROYECTO N°:
ZONA:
CLIENTE:
TÍTULO:
FIGURA Nº:
REVISIÓN:07.82.13.0220/10/2010C.TUEROSC.CÉSARD.PARRA
A
24.2UTMPSAD 56
19S/E
X:\078213.XX BEAR CREEK - SANTA ANA PROJECT\078213.02 DFS\DESIGN\REV. A\NI43101\FIGURA 24.2.DWG
OVERALL PROCESSMASS BALANCE
BEAR CREEK - MINING CORPORATIONDEFINITIVE FACILITY STUDY - SANTA ANA PROJECT
LEACH PAD, PONDS, WASTE DUMP, ACCESS ROADS AND FACILITIES
ISSUED FOR REVIEW