44 egypt. j. chem. vol. 62 · suspended particles are divided into two different layers as seen in...
TRANSCRIPT

Egypt. J. Chem. Vol. 62, No. 3 pp. 541 - 554 (2019)
*Corresponding author email: [email protected]; [email protected]: 10.21608/EJCHEM.2018.4113.1360©2019 National Information and Documentation Center (NIDOC)
IN THIS PAPER, local soil clay as a low cost and affordable adsorbent was employed for the successful removal of methylene blue (MB) and crystal violet (CV) dyes from an aqueous
binary system. The effect of various experimental conditions like adsorbate concentrations, time, temperature, and pH has been investigated. To know the adsorption performance of the dye molecules upon soil clay, the kinetics of the adsorption data were analyzed using various models such as pseudo-first-order and pseudo-second-order. This kind of study shows that the maximum adsorption reached at 2 min and uses the pseudo- second-order kinetics. The adsorption Kinetics have been investigated in the pH range of 2, 3.7, 7, and 8.7 at 25˚C and analyzed with two different models namely Langmuir and Freundlich. The interaction of dye molecules with soil clay has been investigated by SEM, EDS, FTIR, and XRD. Maximum removal of MB and CV up to 47.82 and 35.71 mg g-1, respectively was achieved by dye molecules adsorption onto soil clay. This effective removal method may provide a promising solution for eliminating of CV and MB dyes from wastewater.
Keywords: Soil, Methylene blue, Crystal violet, Binary system, Dye removal, Wastewater.
44Methylene Blue and Crystal Violet Dyes Removal (As A Binary System) from Aqueous Solution Using Local Soil Clay: Kinetics Study and Equilibrium IsothermsAhmed I. Abd-Elhamid1, Gomaa F. El Fawal2*, Magda A. Akl3
1Composite and Nanomaterials Department, Advanced Technology and New Material Research Institute (ATNMRI). City of Scientific Research and Technological Applications (SRTA-City), New Borg El-Arab City, 21934, Alexandria, Egypt.2Polymer Materials Research Department, Advanced Technology and New Material Research Institute (ATNMRI). City of Scientific Research and Technological Applications (SRTA-City), New Borg El-Arab City, 21934, Alexandria, Egypt.3Chemistry Department, Faculty of Science, Mansoura University, Mansoura, Egypt.
Introduction
Clean water is essential for a healthy life. A non-toxic environment and fresh water are society’s serious priorities. Yet, widespread pollution of fresh water and the industrial waste penetrating the ecosystem is beginning an alarming state. The development of agriculture and water system frameworks lead to more interest in water resources and especially for the treated wastewater in water system frameworks [1]. The presence of different environmental pollutants in drinking water has additionally increased worldwide health worries. Contamination of water bodies is mainly referred to the presence of toxic chemicals, including organic compounds (like dyes), and heavy metals [2]. Therefore, several techniques have been applied to treat the organics in wastewater; such as adsorption [3], nanofiltration [4], ozonation [5], and electroflotation [6]. Adsorption was found to
be a perfect technique for wastewater treatment in terms of economic cost, the simplicity of design, insensitivity of toxic substances, and ease of operation [7, 8].
Dyes are the greatest serious environmental problems which delivered into the environment from many industrial processes, such as cosmetics, textile, paper, food, printing, plastic, pharmaceutical, and leather [9]. Their presence in water bodies is unwanted as they are difficult to remove due to their tenacious and recalcitrant nature [10]. Dyes in water are undesirable even at very low concentrations - highly visible- and need to be removed before the wastewater discarded into the environment [11]. As a result, the photosynthetic phenomenon of aquatic life is greatly affected owing to the reduced light penetration [12]. However, dyes are fairly difficult to biodegrade and eliminate from dye

542
Egypt. J. Chem. 62, No. 3 (2019)
AHMED I. ABD-ELHAMID et al.
wastewater owing to their complex aromatic molecular structures and high solubility in water [13]. There are several dye wastewater treatment methods presented, including photo-degradation, coagulation, chemical oxidation, reverse osmosis, membrane filtration methods, biosorption, and ozonation [14-19]. However, these methods have higher operating costs or are unproductive in dye wastewater treatment. Adsorption has attracted the attention owing to its numerous advantages, for example, low cost and high efficiency related to other dye wastewater treatment methods. Several of adsorbents have been studied for dyes removal from aqueous solutions like, corncob and barley husk, cocoa pod husks, palm kernel shell, spent tea leaves, ginger waste, metal-organic frameworks (MOFs), activated carbon, peat, chitin, silica and graphene oxide [11, 20-28]. In this way, the application of soil as adsorbents of toxic dyes received significant consideration in the last time due to their low cost, available in a large amount, high surface area, and nontoxic [29].
Crystal violet (CV) and methylene blue (MB) have dangerous effects on living organisms on little periods of exposure. MB is used extensively as a colorant in the textile industry such as wool, silk, and cotton. It can cause many health problems like eye burns, cyanosis, and irritation of the skin [30]. CV (related to triphenylmethane group) is widely used as an animal drug in veterinary. Moreover, it is utilized as a biological dye to identify bloody fingerprints [31]. It is unsafe for humans and can cause cancer when consumed or inhaled [31].
Most of the reports in the literature study the adsorption of single adsorbate from the solution onto solids. Limited studies deal with binary or ternary blends adsorption on the solid surfaces. So the intention of this study has investigated the use of local soil to remove of MB and CV dyes from the binary system. In addition, we also thoroughly studied the kinetics of different aspects affecting the adsorption procedures such as dye concentration, soil dose, pH, and temperature.
Materials and Methods
MaterialsMethylene blue (MB) and Crystal violet (CV)
are purchased from Sigma-Aldrich (Germany) and used as received. Soil samples were obtained from Shoubk Ekrash village, Sharkia, Egypt.
MethodsPreparations of s-soilThe soil samples were dispersed in the lab.
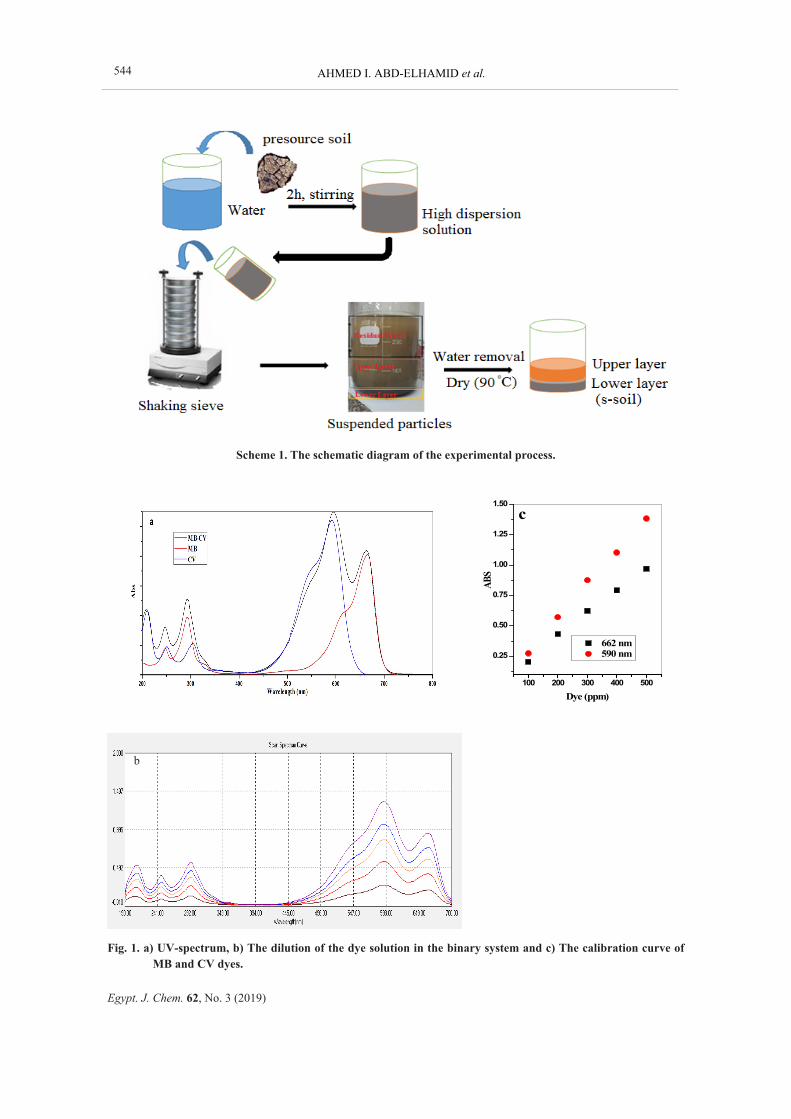
Briefly, 250 g of the presource soil (pr-soil) are added in 2.5 L distilled water with stirring at 500 rpm for 2 h to reach a high dispersion degree for the soils. The shaking sieve with a pore size (1, 2 mm, 45, 63, 125, 250, and 500 µm) was used to separate the suspension to its different size. The suspended particles are divided into two different layers as seen in scheme 1. After that, the solid- after removing excess water- was dried at 90 °C for 24 h. The lower layer (s-soil) was separated and used for dye removal experiments.
Samples characterization Fourier transform infrared spectroscopy (FT-IR) (Shimadzu FTIR-8400 S, Japan) was used to record the IR spectra of the soil. For all spectra, thirty scans were collected with a 4 cm-1 resolution.
X-ray diffraction analysis of soil was done using Shimadzu X-ray diffraction (7000, USA, Cu-Kα radiation). The radiation wavelength was 1.5406 Ǻ. The data were collected in the form of 2θ versus intensity (a.u) chart.
The surface morphology of the soil was analyzed using a scanning electron microscope (SEM) (JEOL, model JSM-6460LV, Tokyo, Japan) operated at an acceleration voltage of 20 kV. For this purpose, the soil pieces were coated with gold by JFC-1100E sputter (JOEL Ltd., Tokyo, Japan). Finally, elemental analysis was done using EDX.
Adsorption Process The dye adsorption (by s-soil) was studied
by determining the color change of the binary dye system (MB & CV) in the aqueous solution. The binary dye solution stock was prepared by using 0.2 % of MB and CV (1:1) in distilled water. Many experimental parameters were studied in a kinetic manner with stirring speed 500 rpm and the volume of the dye solution used was 20 mL such as dye concentrations (100, 200, 300, 400 and 500 ppm), amounts of s-soil (25-100 mg), and pH (2, 3.7, 7, 8.7) in addition to the temperature (25, 40, 55, and 70 °C). Finally, 0.5 mL of the suspension was removed and centrifuged. After that, of 0.1 mL of the centrifuged solution diluted with distilled water to 10 mL for further measurement. MB and CV concentration were measured at 662 and 590 nm, respectively, using UV/Vis Spectrophotometer (Double beam) (T80+, PG Instruments Ltd., UK.) [32-34].

543
Egypt. J. Chem. 62, No. 3 (2019)
METHYLENE BLUE AND CRYSTAL VIOLET DYES REMOVAL...
The dye removal efficiency (R %) is defined by Eq.1:
……. (1)
Where Ct is the concentration of dye at time t, and Co is the initial concentration.
Experimental parametersEffect of dye concentration The effect of dye concentration (100, 200,
300, 400, and 500 ppm) on the removal percent (R %) was studied. The adsorbent dose was 5 g L-1, the solution pH was 7 and the temperature was 25 °C.
Effect of soil clay dosageThe effect of soil dosage was done in the
concentration range of 1.25 –5.0 g L-1. The study was achieved at pH 7, at 25 °C for 10 min, and the initial dye concentration was 300 ppm.
Initial pH effect on the dye removalThe effect of pH range (2, 3.7, 7, and 8.7)
on the CV and MB dye adsorption was studied. The study was achieved with an initial dye concentration of 300 ppm, at 25 °C for 10 min, and the adsorbent dose was 5 g L-1.
Effect of the temperature on dye removalThe temperature ranges effect (25, 40, 55,
70 °C) on the adsorption of CV and MB dyes was studied. The study was done with initial dye concentration of 300 ppm, the adsorbent dose was 5 g L-1and pH was 7.
Adsorption kineticsTwo well-known kinetic models were
investigated. Pseudo-first-order presented by Lagergren equation [35] Eq. 2.
(2) Where qe (mg g-1) is the amount of sorption at equilibrium time, qt (mg g-1) is the amount of sorption at time t, and Kads (min-1) is the rate constant of pseudo-first-order sorption. Qe and qt can be calculated by Eq. 3 and 4.
(3)
Where Ce is the dye concentration at equilibrium time (mg L-1), Co is the initial concentration (mg L-1), V is the volume of dye solution (mL), and W is the mass of adsorbent (g)
(4) Where Ct is the dye concentration at different
time (mg L-1) Pseudo-second-order expressed by Ho equation [36] the equation developed in a linear form as Eq. 5.
(5)
Where Kads (g mg-1min-1) is the rate constant of pseudo-second-order reaction.
Adsorption isothermThe adsorption isotherm model was used to
clarify the interaction between the adsorbate and the adsorbent. The most famous models used for the description of it are Langmuir (Eq. 6) and Freundlich (Eq. 7).
(6)
(7)
Where Ce is the equilibrium concentration (mg L-1), qe is the amount adsorbed at equilibrium time (mg g-1), q◦ is the maximum dye species uptake per unit mass of adsorbent (mg g-1), and b is Langmuir constant (L mol-1). Kf (mg g-1) and “n” are Freundlich constants.
Whereas RL designates the shape of the isotherm and can be obtained from Eq. 8:
(8)
Where the RL is the separation parameter (RL > 1 unfavorable, RL = 1 linear, 0 < RL<1 favorable, RL = 0 irreversible)
Results and Discussion
UV-Vis-spectrumFigure 1a exhibits the characteristic
reflections of the MB, CV, and binary system dyes (MB&CV) using UV-Vis-spectrum. In the individual system, MB and CV dyes show maximum peak absorption at 662 and 596 nm, respectively. On the other hand, MB&CV dyes in binary system exhibit two maximum absorption peaks in the visible spectral region (662 and 596 nm) and three other small peaks in the UV region (294, 248 and 208 nm), which confirm the existence of both dyes in the solution. Those results agree with previous other work [32-34].
Upon the dilution of the dye solution, the intensity of the peaks decreases in both UV and Vis-regions as illustrated in Fig. 1b. This confirms that the dilution cause concentrations
544
Egypt. J. Chem. 62, No. 3 (2019)
AHMED I. ABD-ELHAMID et al.
Scheme 1. The schematic diagram of the experimental process.
100 200 300 400 500
0.25
0.50
0.75
1.00
1.25
1.50
662 nm 590 nm
ABS
Dye (ppm)
c
Fig. 1. a) UV-spectrum, b) The dilution of the dye solution in the binary system and c) The calibration curve of MB and CV dyes.
b
545
Egypt. J. Chem. 62, No. 3 (2019)
METHYLENE BLUE AND CRYSTAL VIOLET DYES REMOVAL...
reduction of both dyes in the binary system.
Figure 1c illustrates the calibration curve in the UV-Vis spectrometer for MB&CV dye in the binary system. The figure indicated that there is a relationship (linear) between the absorbance and the concentration for the two dyes in the binary.
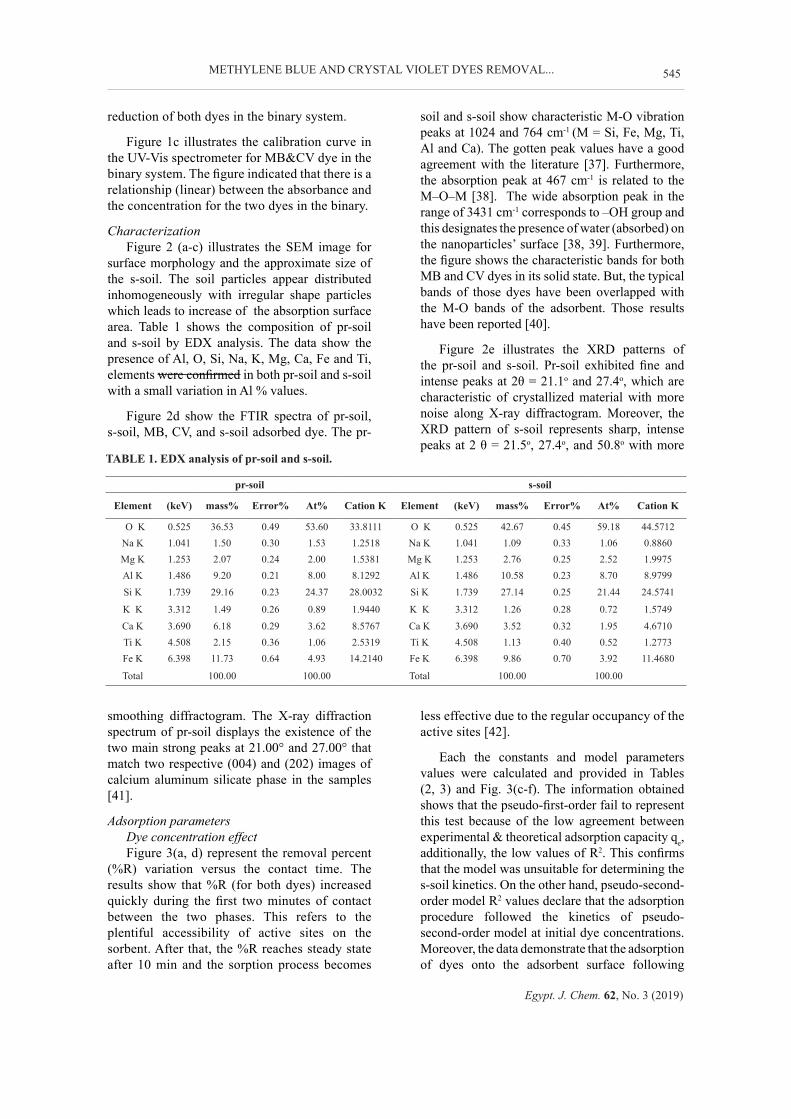
CharacterizationFigure 2 (a-c) illustrates the SEM image for
surface morphology and the approximate size of the s-soil. The soil particles appear distributed inhomogeneously with irregular shape particles which leads to increase of the absorption surface area. Table 1 shows the composition of pr-soil and s-soil by EDX analysis. The data show the presence of Al, O, Si, Na, K, Mg, Ca, Fe and Ti, elements were confirmed in both pr-soil and s-soil with a small variation in Al % values.
Figure 2d show the FTIR spectra of pr-soil, s-soil, MB, CV, and s-soil adsorbed dye. The pr-
soil and s-soil show characteristic M-O vibration peaks at 1024 and 764 cm-1 (M = Si, Fe, Mg, Ti, Al and Ca). The gotten peak values have a good agreement with the literature [37]. Furthermore, the absorption peak at 467 cm-1 is related to the M–O–M [38]. The wide absorption peak in the range of 3431 cm-1 corresponds to –OH group and this designates the presence of water (absorbed) on the nanoparticles’ surface [38, 39]. Furthermore, the figure shows the characteristic bands for both MB and CV dyes in its solid state. But, the typical bands of those dyes have been overlapped with the M-O bands of the adsorbent. Those results have been reported [40].
Figure 2e illustrates the XRD patterns of the pr-soil and s-soil. Pr-soil exhibited fine and intense peaks at 2θ = 21.1o and 27.4o, which are characteristic of crystallized material with more noise along X-ray diffractogram. Moreover, the XRD pattern of s-soil represents sharp, intense peaks at 2 θ = 21.5o, 27.4o, and 50.8o with more
TABLE 1. EDX analysis of pr-soil and s-soil.
pr-soil s-soil
Element (keV) mass% Error% At% Cation K Element (keV) mass% Error% At% Cation K
O K 0.525 36.53 0.49 53.60 33.8111 O K 0.525 42.67 0.45 59.18 44.5712Na K 1.041 1.50 0.30 1.53 1.2518 Na K 1.041 1.09 0.33 1.06 0.8860Mg K 1.253 2.07 0.24 2.00 1.5381 Mg K 1.253 2.76 0.25 2.52 1.9975Al K 1.486 9.20 0.21 8.00 8.1292 Al K 1.486 10.58 0.23 8.70 8.9799Si K 1.739 29.16 0.23 24.37 28.0032 Si K 1.739 27.14 0.25 21.44 24.5741
K K 3.312 1.49 0.26 0.89 1.9440 K K 3.312 1.26 0.28 0.72 1.5749Ca K 3.690 6.18 0.29 3.62 8.5767 Ca K 3.690 3.52 0.32 1.95 4.6710Ti K 4.508 2.15 0.36 1.06 2.5319 Ti K 4.508 1.13 0.40 0.52 1.2773Fe K 6.398 11.73 0.64 4.93 14.2140 Fe K 6.398 9.86 0.70 3.92 11.4680
Total 100.00 100.00 Total 100.00 100.00
smoothing diffractogram. The X-ray diffraction spectrum of pr-soil displays the existence of the two main strong peaks at 21.00° and 27.00° that match two respective (004) and (202) images of calcium aluminum silicate phase in the samples [41].
Adsorption parameters Dye concentration effect Figure 3(a, d) represent the removal percent
(%R) variation versus the contact time. The results show that %R (for both dyes) increased quickly during the first two minutes of contact between the two phases. This refers to the plentiful accessibility of active sites on the sorbent. After that, the %R reaches steady state after 10 min and the sorption process becomes
less effective due to the regular occupancy of the active sites [42].
Each the constants and model parameters values were calculated and provided in Tables (2, 3) and Fig. 3(c-f). The information obtained shows that the pseudo-first-order fail to represent this test because of the low agreement between experimental & theoretical adsorption capacity qe, additionally, the low values of R2. This confirms that the model was unsuitable for determining the s-soil kinetics. On the other hand, pseudo-second-order model R2 values declare that the adsorption procedure followed the kinetics of pseudo-second-order model at initial dye concentrations. Moreover, the data demonstrate that the adsorption of dyes onto the adsorbent surface following
546
Egypt. J. Chem. 62, No. 3 (2019)
AHMED I. ABD-ELHAMID et al.
4000 3500 3000 2500 2000 1500 1000 500
cm-1
pr-soil
s-soil
I
MB-dye
CV-dye
s-soil adsorbed dyed
20 40 60
PDF Card Calcium Aluminum SilicateCa Al2 Si2 O8
ICDD card No. 00-005-0528
pr-soil
2 θ
I (CP
S)
s-soil
e
Fig. 2. SEM images of s-soil (a-c) at different magnification, (d) FTIR spectrum of pr-soil and s-soil, and (e) XRD diffraction patterns of pr-soil and s-soil.
TABLE 2. Pseudo-First-order and Second-order kinetic models for dye various concentration.
Dye Concentration (ppm)
qe exp (mg g-1)
First-order kinetic parameter Second-order kinetic parameter
Kads (min-
1)qe cal (mg
g-1) R2 Kads (g mg-
1min-1)qe cal (mg
g-1) R2
MB
100 19.80 -6.90 3.60 0.866 4.53 20.00 0.997200 36.03 -0.51 12.88 0.952 0.20 37.03 0.990300 45.02 -0.32 16.60 0.852 0.12 45.45 0.993400 44.24 -0.51 17.00 0.805 0.14 45.45 0.992500 46.86 -0.28 13.80 0.695 0.13 47.62 0.994
CV
100 19.6 -2.23 3.80 0.880 0.71 20.00 0.996200 32.24 -0.46 33.88 0.910 0.24 33.33 0.995300 35.7 -0.37 11.22 0.710 0.56 35.71 0.999400 32.97 -0.44 14.45 0.570 0.37 34.48 0.996500 37.28 -0.12 9.77 0.170 0.19 37.04 0.997

547
Egypt. J. Chem. 62, No. 3 (2019)
METHYLENE BLUE AND CRYSTAL VIOLET DYES REMOVAL...
TABLE 3. Calculated equilibrium constants for adsorption of MB and CV on s-soil.
Dye Langmuir isotherm model Freundlich isotherm model
qo(mg g-1) b (mg-1) RL R2 1/ n Kf (mg g-1) R2
MB 47.62 0.23 0.042 0.99 0.093 4.26 0.97
CV 35.71 0.22 0.043 0. 99 0.13 3.56 0.99
0 2 4 6 8 10
20
30
40
50
60
70
80
90
100
λ = 662nm 100 ppm 200 ppm 300 ppm 400 ppm 500 ppm
t (min)
%R
a
0 1 2 3 4 5
-0.5
0.0
0.5
1.0
1.5
Lo
g (q
e-q t
)
t (min)
λ = 662nm
100 ppm 200 ppm 300 ppm 400 ppm 500 ppm
b
0 2 4 6 8 10
0.0
0.1
0.2
0.3
0.4
0.5λ = 662 nm
100 ppm 200 ppm 300 ppm 400 ppm 500 ppm
t/qt
t (min)
c
0 2 4 6 8 10
20
30
40
50
60
70
80
90
100
100 ppm 200 ppm 300 ppm 400 ppm 500 ppm
%Rλ = 590nm
t (min)
d
0 1 2 3 4 5-1.5
-1.0
-0.5
0.0
0.5
1.0
1.5
λ = 662nm 100 ppm 200 ppm 300 ppm 400 ppm 500 ppm
Log
(qe-
q t)
t (min)
e
0 2 4 6 8 10
0.0
0.1
0.2
0.3
0.4
0.5λ = 590nm
100 ppm 200 ppm 300 ppm 400 ppm 500 ppm
t/qt
t (min)
f
0 100 200 300
0
2
4
6
8
CVR2= 0.990Slope = 0.028Intercept = 0.13
MB CV
C e/q e
Ce
MBR2= 0.998Slope = 0.021Intercept = 0.09
g
0.0 0.5 1.0 1.5 2.0 2.5
1.3
1.4
1.5
1.6
1.7
Log Ce
MBR2= 0.812Slope = 0.093Intercept = 1.45
CVR2= 0.943Slope = 0.13Intercept = 1.27
MBCV
Log q
e
h
Fig. 3. Effect of MB and CV dyes concentration on (a, d) dye removal percent (%R); (b, e) pseudo-First-order kinetic model; (c, f) pseudo-Second-order kinetic model, respectively; (g) Langmuir and (h) Freundlich model (s-soil dose = 0.1g/20 ml, pH = 7 and T = 25 oC).

548
Egypt. J. Chem. 62, No. 3 (2019)
AHMED I. ABD-ELHAMID et al.
0 2 4 6 8 10
0.00
0.05
0.10
0.15
0.20
0.25
0.025g 0.050g 0.075g 0.100g
t/qt
t (min)
λ = 662nm
c
0 1 2 3 4 50.25
0.50
0.75
1.00
1.25
1.50
λ = 662nm 0.025g 0.050g 0.075g 0.100g
log
(qe-
q t)
t (min)
b
0 2 4 6 8 10
10
20
30
40
50
60
70
80
%R
0.025g 0.050g 0.075g 0.100g
t (min)
λ =590 nm
a
0 2 4 6 8 10
0.00
0.05
0.10
0.15
0.20
0.25
0.30
t (min)
λ = 662nmλ = 662nmλ = 662nmλ = 662nm 0.025g 0.050g 0.075g 0.100g
t/qt
λ = 590 nm
f
0 1 2 3 4 5
-0.5
0.0
0.5
1.0
λ = 590nm 0.025g 0.050g 0.075g 0.100g
log
(qe-
q t)
t (min)
e
0 2 4 6 8 10
10
20
30
40
50
60
%R
λ =590 nm
0.025g 0.050g 0.075g 0.100g
t (min)
d
Fig. 4. Effect of dose concentration (g/20ml) on adsorption process for both dyes MB and CV, (a, d) dye removal percent (%R); (b, e) pseudo-First-order kinetic model; (c, f) pseudo-Second-order kinetic model, respectively (dye concentration = 300 ppm, pH = 7 and T = 25 oC).
a pseudo-second-order reaction as qe values (experimentally) are in conformity with the qe values (calculated). Furthermore, the kads values (pseudo-second-order rate constant) were reduced by increasing concentration of absorbing dye in solution suggesting an absorption rate decreasing. This is apparently owing to the fast growth of positive charge on the surface - for initial uptake- of the dye on the surface of adsorbent, which prevents more dye uptake at the subsequent steps of reacting by columbic repulsion force. Almost these results designated that s-soil can be utilized to eliminate the dye successfully from solutions through monolayer mechanism.
Moreover, the dyes adsorption equilibrium isotherm was calculated (Tables 2, 3). The tables illustrate that the ultimate adsorption for MB and CV onto s-soil from binary solution were 47.62 and 35.71 mg g-1, respectively. Also, the
adsorption process of these dyes was founded to be fitted by the Langmuir model. In conclusion, the monolayer adsorption process happens onto the adsorbent surface and these agree with other work [43].
The RL (separation parameter) was: 0.042 (for MB) and 0.043 (for CV) for the initial concentration of dyes (100–500 ppm). Those values are designating their favorable adsorption upon adsorbent as it is within the range of 0–1. The 1/n numerical values are 0.13 and 0.09 for CV and MB, respectively. However, those values are less than the unit, which strongly supported favorable adsorption by the adsorbent overall studied adsorbent concentration.
Soil dose effect CV&MB removal percent from the water
solution in the binary system form was also investigated using different amounts of adsorbent.

549
Egypt. J. Chem. 62, No. 3 (2019)
METHYLENE BLUE AND CRYSTAL VIOLET DYES REMOVAL...
The removal process is highly affected by the amount of the contacting sorbent in the aqueous phase [44]. Figure 4(a, d) illustrates that removal percent of the dyes rapidly increased by increasing the adsorbent dose for both dyes at the first 2 min. After that %R reach steady state and this agreement with another work [45].
The acquired R2 values (correlation coefficients) for the linear plot of t/qt versus t of pseudo-second-order equation for the dyes (Fig. 4 b, e) greater than that belongs to the pseudo-first-order (Fig. 4 c, f). It was found that the adsorption kinetics were better fitted by pseudo-second-order kinetic model. In addition, Table 4 demonstrates that the qe values (experimental) agree totally with the calculated qe values. This indicates that the adsorption process –on s-soil- for both dyes follows the second-order kinetics.
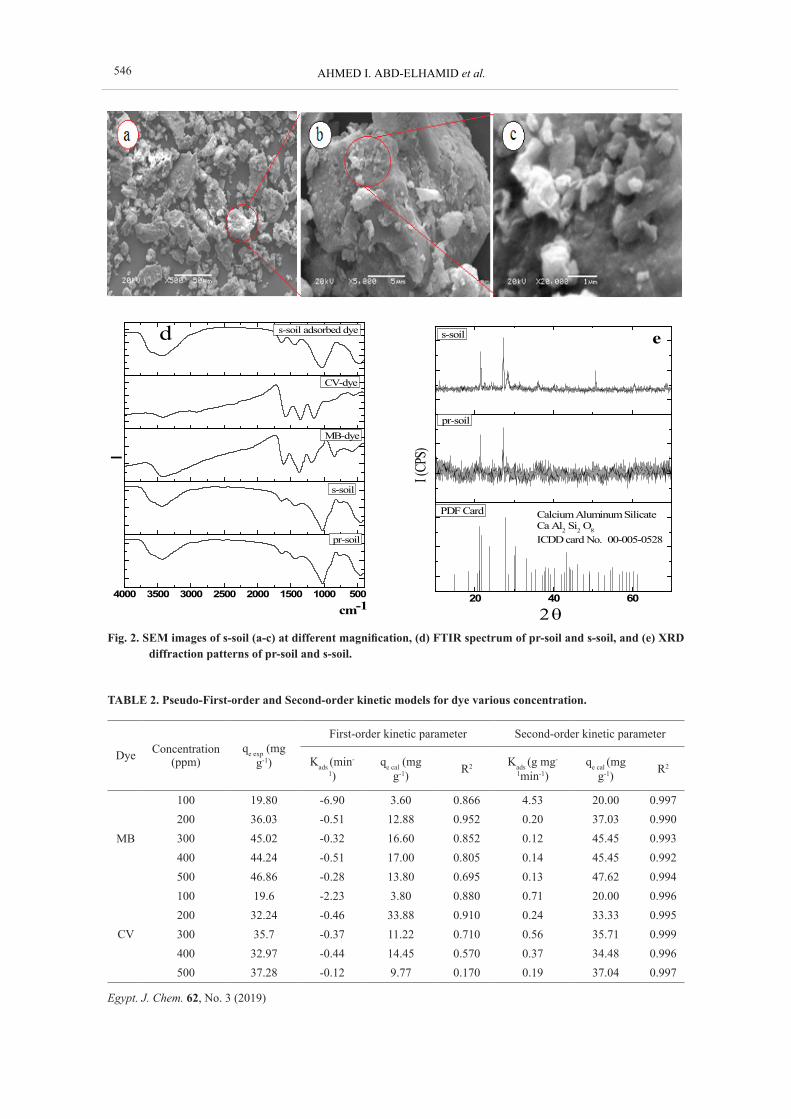
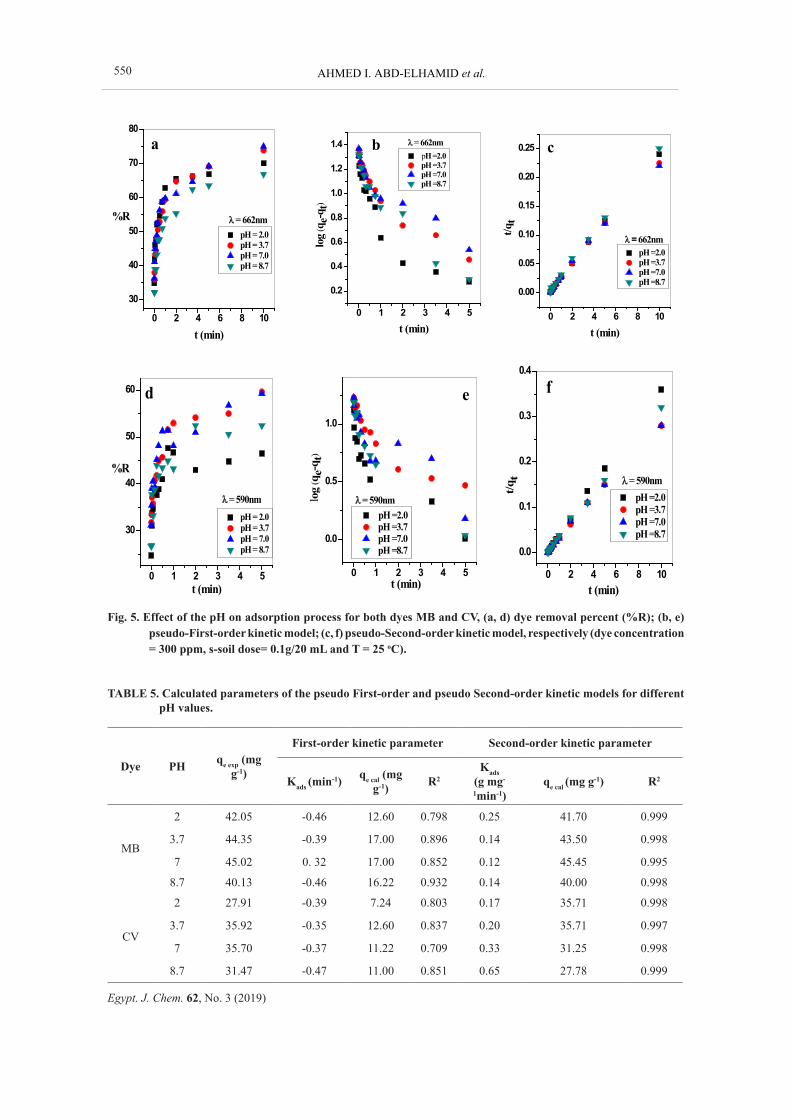
Initial pH effect Figure 5(a,d) introduce the removal percent
of both dyes at different pH. The results prove that R% increase quickly within the first 2 min and appears to be constant after this time for all the solution pH values. Dyes adsorption increases at pH values 3.7 and 7 while a decrease in pH values 2 and 8.7. Minor adsorption of CV and MB at an acidic pH may be referred to the existence of excess H+ ions occupying the adsorbent active sites which preventing adsorption of the dye [46]. In addition, the above behaviour can come from the electric layer polarity change on both the silica and alumina contents of the clay from positive to negative charge. These changes improve cationic dye removal from its aqueous solution by attracting the dye cations. Furthermore, the
hydroxylated oxides acid-base dissociation of the clay followed by ion exchange with the dye cations could be responsible for the maximum removal of the cationic dye from its solution. Above pH 7, the density of negative charge on the surface of the adsorbent decreased, this led to a slow decline in the clay removal ability. Yet, between pH values 3.5 and 7, the removal percent nearly the same indicates that the presence of high concentrations of hydronium ions does not influence the kinetics of adsorption and consequently, the removal is at its maximum.
Figure 5(b,e) and 5(c,f) represent plotting of the pseudo-first-order and pseudo-second-order adsorption kinetic models at various pH values for both CV and MB dyes, respectively. The calculated correlation coefficients and kinetic parameters were obtained are listed in Table 5. The table and figure data demonstrated that pseudo-second-order adsorption kinetic models fitted well with the experimental data depending on calculated R2 (> 0.990) and qe values.
(b, e) pseudo-First-order kinetic model; (c, f) pseudo-Second-order kinetic model, respectively
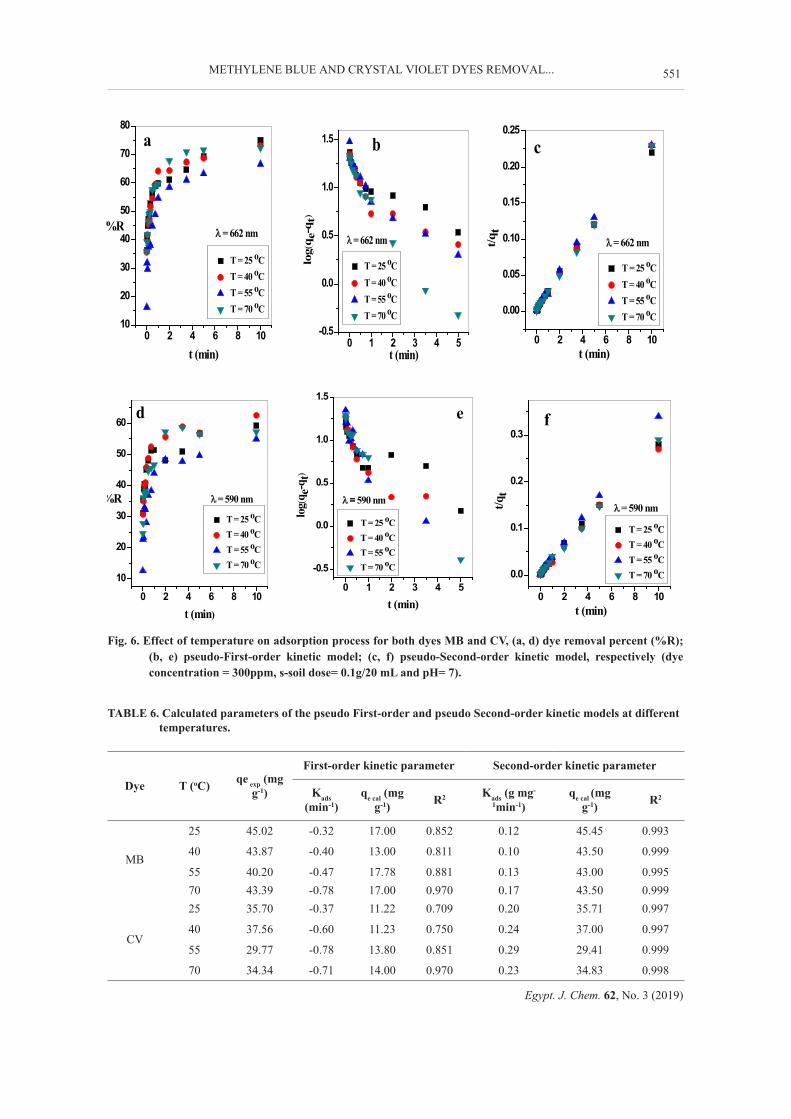
Temperature effect Figure 6 displays the temperature effect on the
MB and CV adsorption on the adsorbents. It can be seen that uptake percent increases rapidly at earlier steps of adsorption and the removal percent reaches to equilibrium overall temperature values.
Figure 6 (b,e) and 6 (c,f) display the linear relation of pseudo-first-order and pseudo-second-order adsorption kinetic models for CV and MB dyes, respectively. Table 6 illustrates the calculated values of qe and R2. The obtained R2 values
TABLE 4. Calculated parameters of the pseudo First-order and pseudo Second-order kinetic models for various s-soil doses.
Dye Adsorbent dose (g)
qe exp (mg g-1)
First-order kinetic parameter Second-order kinetic parameter
Kads (min-1) qe cal (mg g-1) R2 Kads (g mg-
1min-1) qe cal (mg g-1) R2
MB
0.025 44.16 -3.25 19.00 0.978 1.24 43.50 0.9990.050 50.11 -0.35 20.40 0.897 0.10 50.00 0.996
0.075 53.52 -0.41 19.00 0.875 0.15 52.60 0.9980.100 45.02 -0.32 16.60 0.852 0.12 45.45 0.995
CV
0.025 39.41 -0.28 14.80 0.856 0.11 40.00 0.994
0.050 39.60 -0.32 10.72 0.333 0.15 43.50 0.984
0.075 43.96 -0.37 11.22 0.709 0.19 35.71 0.997
0.100 35.70 -1.61 7.60 0.658 0.11 40.00 0.999
550
Egypt. J. Chem. 62, No. 3 (2019)
AHMED I. ABD-ELHAMID et al.
0 2 4 6 8 10
30
40
50
60
70
80
%R pH = 2.0 pH = 3.7 pH = 7.0 pH = 8.7
t (min)
λ = 662nm
a
0 1 2 3 4 5
0.2
0.4
0.6
0.8
1.0
1.2
1.4 λ = 662nm pH =2.0 pH =3.7 pH =7.0 pH =8.7
log
(qe-
q t)
t (min)
b
0 2 4 6 8 10
0.00
0.05
0.10
0.15
0.20
0.25
pH =2.0 pH =3.7 pH =7.0 pH =8.7
t/qt
t (min)
λ = 662nm
c
Fig. 5. Effect of the pH on adsorption process for both dyes MB and CV, (a, d) dye removal percent (%R); (b, e) pseudo-First-order kinetic model; (c, f) pseudo-Second-order kinetic model, respectively (dye concentration = 300 ppm, s-soil dose= 0.1g/20 mL and T = 25 oC).
0 1 2 3 4 5
30
40
50
60
λ = 590nm pH = 2.0 pH = 3.7 pH = 7.0 pH = 8.7
%R
t (min)
d
0 1 2 3 4 5
0.0
0.5
1.0
t (min)
pH =2.0 pH =3.7 pH =7.0 pH =8.7
λ = 590nmlog
(qe-
q t)
e
0 2 4 6 8 10
0.0
0.1
0.2
0.3
0.4
t/qt
t (min)
λ = 590nm pH =2.0 pH =3.7 pH =7.0 pH =8.7
f
TABLE 5. Calculated parameters of the pseudo First-order and pseudo Second-order kinetic models for different pH values.
Dye PH qe exp (mg g-1)
First-order kinetic parameter Second-order kinetic parameter
Kads (min-1) qe cal (mg g-1) R2
Kads (g mg-
1min-1)qe cal (mg g-1) R2
MB
2 42.05 -0.46 12.60 0.798 0.25 41.70 0.999
3.7 44.35 -0.39 17.00 0.896 0.14 43.50 0.998
7 45.02 0. 32 17.00 0.852 0.12 45.45 0.995
8.7 40.13 -0.46 16.22 0.932 0.14 40.00 0.998
CV
2 27.91 -0.39 7.24 0.803 0.17 35.71 0.998
3.7 35.92 -0.35 12.60 0.837 0.20 35.71 0.997
7 35.70 -0.37 11.22 0.709 0.33 31.25 0.998
8.7 31.47 -0.47 11.00 0.851 0.65 27.78 0.999
551
Egypt. J. Chem. 62, No. 3 (2019)
METHYLENE BLUE AND CRYSTAL VIOLET DYES REMOVAL...
0 2 4 6 8 1010
20
30
40
50
60
70
80
%R
T = 25 oC T = 40 oC T = 55 oC T = 70 oC
t (min)
λ = 662 nm
a
0 1 2 3 4 5-0.5
0.0
0.5
1.0
1.5
λ = 662 nm
T = 25 oC T = 40 oC T = 55 oC T = 70 oC
log(
q e-q
t)
t (min)
b
0 2 4 6 8 10
0.00
0.05
0.10
0.15
0.20
0.25
T = 25 oC T = 40 oC T = 55 oC T = 70 oC
t/qt
t (min)
λ = 662 nm
c
0 2 4 6 8 10
10
20
30
40
50
60
%R T = 25 oC T = 40 oC T = 55 oC T = 70 oC
t (min)
λ = 590 nm
d
0 1 2 3 4 5
-0.5
0.0
0.5
1.0
1.5
λ = 590 nm
T = 25 oC T = 40 oC T = 55 oC T = 70 oC
log(
q e-q
t)
t (min)
e
0 2 4 6 8 10
0.0
0.1
0.2
0.3
λ = 590 nm
T = 25 oC T = 40 oC T = 55 oC T = 70 oC
t/qt
t (min)
f
Fig. 6. Effect of temperature on adsorption process for both dyes MB and CV, (a, d) dye removal percent (%R); (b, e) pseudo-First-order kinetic model; (c, f) pseudo-Second-order kinetic model, respectively (dye concentration = 300ppm, s-soil dose= 0.1g/20 mL and pH= 7).
TABLE 6. Calculated parameters of the pseudo First-order and pseudo Second-order kinetic models at different temperatures.
Dye T (oC) qe exp (mg g-1)
First-order kinetic parameter Second-order kinetic parameter
Kads (min-1)
qe cal (mg g-1) R2 Kads (g mg-
1min-1)qe cal (mg
g-1) R2
MB
25 45.02 -0.32 17.00 0.852 0.12 45.45 0.993
40 43.87 -0.40 13.00 0.811 0.10 43.50 0.999
55 40.20 -0.47 17.78 0.881 0.13 43.00 0.99570 43.39 -0.78 17.00 0.970 0.17 43.50 0.999
CV
25 35.70 -0.37 11.22 0.709 0.20 35.71 0.997
40 37.56 -0.60 11.23 0.750 0.24 37.00 0.997
55 29.77 -0.78 13.80 0.851 0.29 29.41 0.999
70 34.34 -0.71 14.00 0.970 0.23 34.83 0.998

552
Egypt. J. Chem. 62, No. 3 (2019)
AHMED I. ABD-ELHAMID et al.
from pseudo-first-order and pseudo-second-order adsorption model are ≤0.990 and ≥0.990, respectively. Moreover, the calculated values of qe match highly effective with the experimental data. This suggests that the kinetic modeling of the temperature effect on the adsorption process is more likely fits to the models of the pseudo-second-order adsorption.
Conclusion
In the present study, the settling technique appears to be effective in the fractionation of local soil clay. The crystal violet and methylene blue dyes (in a binary system) successfully removed from aqueous medium over a soil sample (s-soil) fractioned from a local soil sample (pr-soil). The reaction between the dye species and the soil particles show fast adsorption kinetics. Referring to the qe and R2 values the pseudo-second-order model more fitted the adsorption kinetics process. According to Langmuir isotherm, the obtained soil can adsorb 47.82 and 35.71 mg g-1 for MB and CV. Those results give a promising solution for crystal violet and methylene blue dye removal from wastewater.
References
1. Valipour, M., How do different factors impact agricultural water management, Open Agriculture 1, 89-111 (2016).
2. Ihsanullah, A. A., Al-Amer, A.M., Laoui, T., Al-Marri, M.J., Nasser, M.S., Khraisheh, M., Atieh, M.A., Heavy metal removal from aqueous solution by advanced carbon nanotubes: Critical review of adsorption applications. Separation and Purification Technology, 157, 141 –161 (2016).
3. Abd El-Hamid, A. I., Aly, H. F., Removal of Fe (III) from Aqueous Solution Using Thiosalcylic Acid as An Efficient Adsorbent. Egypt Journal of Chemistry, 61, 617-627 (2018).
4. Chakraborty, S., De, S., Basu, J.K., Das, G.S., Treatment of a textile effluent: application of a combination method involving adsorption and nanofiltration. Desalination 174, 73–85 (2005).
5. Erol, F., Ozbelge, T.A., Catalytic ozonation with non-polar bonded alumina phases for treatment of aqueous dye solutions in a semi-batch reactor. Chemical Engineering Journal, 139, 272–283 (2008).
6. Belkacem, M., Khodir, M., Abdelkrim, S., Treatment characteristics of textile wastewater and
removal of heavy metals using the electroflotation technique, Desalination 228, 245–254 (2008).
7. Chawla, S., Uppal, H., Yadav, M., Bahadur, N., Singh, N., Zinc peroxide nanomaterial as an adsorbent for removal of Congo red dye from waste water, Ecotoxicology and Environmental Safety, 135, 68 –74 (2017).
8. Asmara, S. H., Sayed, A. A., Nahla, M. M., Mostafa, K., Adsorption of chromium (VI) from aqueous solution by glycine modified cross-linked chitosan resin. Egypt. Journal of Chemistry, 61, 530-540 (2018).
9. Liu, X., Yan, L., Yin, W., Zhou, L., Tian, G., Shi, J., Yang, Z., Xiao, D., Gu, Z., Zhao, Y., A magnetic graphene hybrid functionalized with beta-cyclodextrins for fast and efficient removal of organic dyes. Journal of Material Chemistry A 2, 12296 –12303 (2014).
10. Deepak, R., Radhey, S.S., Swagata, K., Lakhbeer, S.A., Vandana, M., Ecotoxic potential of a presumably non-toxic azo dye. Ecotoxicology and Environmental Safety, 148, 528-537 (2018).
11. Robinson, T., Chandran, B., Nigam, P., Removal of dyes from a synthetic textile dye effluent by biosorption on apple pomace and wheat straw, Water Research 36, 2824–2830 (2002).
12. Mahmoodi, N.M., Arami, M., Bahrami, H., Khorramfar, S., The effect of pH on the removal of anionic dyes from colored textile wastewater using a biosorbent, Journal of Applied Polymer Science 120, 2996–3006 (2011).
13. Kayan, B., Gozmen, B., Demirel, M., Gizir, A.M., Degradation of acid red 97 dye in aqueous medium using wet oxidation and electro-Fenton techniques, Journal of Hazardous Materials, 177, 95 –102 (2010).
14. Tunay, O., Kabdasli, I., Eremektar, G., Orhon, D., Color removal from textile wastewaters. Water Science Technology, 34, 9–16 (1996).
15. Forgacs, E., Cserhati, T., Oros, G., Removal of synthetic dyes from wastewaters: A review. Environmental International, 30, 953 –971 (2004).
16. Tehrani-Bagha, A.R., Mahmoodi, N.M., Menger, F.M., Degradation of a persistent organic dye from colored textile wastewater by ozonation. Desalination, 260, 34 –38 (2010).
17. Zhai, Q.Q., Bo, T., Hu, G.X., High photoactive and visiblelight responsive raphene/titanate nanotubes

553
Egypt. J. Chem. 62, No. 3 (2019)
METHYLENE BLUE AND CRYSTAL VIOLET DYES REMOVAL...
photocatalysts: preparation and characterization. Journal of Hazardous Materials, 198, 78 –86 (2011).
18. Alventosa-deLara, E., Barredo-Damas, S., Alcaina-Miranda, M.I., Iborra-Clar, M.I., Ultrafiltration technology with a ceramic membrane for reactive dye removal: Optimization of membrane performance. Journal of Hazardous Materials, 209, 492 –500 (2012).
19. Ghaedi, M.; Hajati, S.; Barazesh, B.; Karimi, F.; Ghezelbash, G.: Saccharomyces cerevisiae for the biosorption of basic dyes from binary component systems and the high order derivative spectrophotometric method for simultaneous analysis of Brilliant green and Methylene blue. Journal of Industrial and Engineering Chemistry, 19, 227 –233 (2013b).
20. McKay, G., Blair, H.S., Gardner, J.R., Rate studies for the adsorption of dyestuffs on chitin. Journal of Colloidal Interface Science, 95, 108–119 (1983).
21. McKay, G., Analytical solution using a pore diffusion model for a pseudo irreversible isotherm for the adsorption of basic dye on silica. American Institute of Chemical Engineers Journal, 30, 692–697 (1984).
22. Ho, Y.S., McKay, G., Sorption of dye from aqueous solution by peat. Chemical Engineering Journal, 70, 115–124 (1998).
23. Hameed, B.H., Spent tea leaves: a new non-conventional and low-cost adsorbent for removal of basic dye from aqueous solutions. Journal of Hazardous Materials, 161, 753–759 (2009).
24. Carmen, E., Mohamed, A., Sayed, M., Hager, A., Doaa, O., Renee, I. A., Yasser, M. M., Carbon nanotubes as superior sorbent for removal of phenol from industrial waste water. Egypt Journal of Chemistry, 61, 74-84 (2018).
25. Zawani, Z., Luqman, C.A., Choong, T.S.Y., Equilibrium, kinetics and thermodynamic studies: adsorption of remazol black 5 on the palm kernel shell activated carbon (PKS-AC). Europ Journal of Science Reseach, 37, 63–71 (2009).
26. Ahmad, R., Kumar, R., Adsorption studies of hazardous malachite green onto treated ginger waste. Journal of Environmental Management, 91, 1032–1038 (2010).
27. Bello, O.S., Ahmad, M.A., Adsorptive removal of a synthetic textile dye using coca pod husks. Journal of Toxicological & Environmental
Chemistry, 93, 1298–1308 (2011).
28. Han, Y., Sheng, S., Yang, F., Xie, Y., Zhaoa, M., Li, J-R., Size exclusive and coordination-induced selective dye adsorption in a nanotubular metal–organic framework. Journal of Material Chemistry A, 3, 12804–12809 (2015).
29. Bu, R., Chen, F., Li, J., Li, W., Yang, F., Adsorption capability for anionic dyes on 2-hydroxyethyl ammonium acetate-intercalated layered double hydroxide. Colloids Surfaces A: Physicochemical and Engineering Aspects, 511, 312 –319 (2016).
30. Senthilkumaar, S., Varadarajan, P.R., Porkodi, K., Subbhuraam, C.V., Adsorption of methylene blue onto jute fiber carbon: Kinetics and equilibrium studies. J. Colloidal Interface Science, 284, 78–82 (2005).
31. Saeed, A., Sharif, M., Iqbal, M., Application potential of grapefruit peel as dye sorbent: kinetics, equilibrium and mechanism of Crystal Violet adsorption. Journal of Hazardous Materials, 179, 564–572 (2010).
32. Courtie, M., Epias, M., Kinetic Modeling of Methylene Blue and Crystal Violet Dyes Adsorption on Alginate-Fixed Water Hyacinth in Single and Binary Systems. American Journal of Analytical Chemistry, 4, 17-24 (2013).
33. Fumihiko, O., Noriaki, N., Naohito, K., Adsorption Capability of Cationic Dyes (Methylene Blue and Crystal Violet) onto Poly-γ-glutamic Acid. Chemical and Pharmaceutical Bulletin, 65, 268-275 (2017).
34. Ahmed, I., Hisham, A., Removal of Fe (III) from aqueous solution using thiosalcylic acid as an efficient adsorbent. Egypt. Journal of Chemistry, 61, 617-627 (2018).
35. Lagergren, S., About the theory of so called adsorption of soluble substances. K. Sven. Vetenskapsakad. Handlingar Band. 24, 1– 39 (1898).
36. Ho, Y.S., McKay, G., The sorption of lead (II) ions on peat. Water Research, 33, 578 – 584 (1999).
37. Ponchami, S., Dipankar, J. B., Pankaj, D., Manash, R. D., Cationic and anionic dye removal from aqueous solution using montmorillonite clay: evaluation of adsorption parameters and mechanism. Desalination Water Treatment, 57, 8372–8388 (2016).
38. Ghebaur, A., Gaˆrea, S.A., Iovu, H., The influence

554
Egypt. J. Chem. 62, No. 3 (2019)
AHMED I. ABD-ELHAMID et al.
of inorganic host type in the drug—Layered silicate biosystems, UPB Scientific Bulletin, Series B: Chemistry and Materials Science, 73, 169−176 (2011).
39. Chen, Y-M., Tsao, T-M., Wang, M-K., Removal of crystal violet and methylene blue from aqueous solution using soil nano-clays, In: International Conference on Environment Science and Engineering. IPCBEE. 8, 252–254 (2011).
40. Aguiar, J.E., Cecilia, J.A., Tavares, P.A.S., Azevedo, D.C.S., Rodríguez, C. E., Lucena, S.M.P., Silva, J.I.J., Adsorption study of reactive dyes onto porous clay heterostructures. Applied Clay Science, 135, 35–44 (2017).
41. Davis, C.S., Matthew, A.A., Eder, C.L., Simone, F. P. P., Renato, C., Caroline, S.; Pascal S.T., Fernando, M. M., Application of Carbon Composite Adsorbents Prepared from Coffee Waste and Clay for the Removal of Reactive Dyes from Aqueous Solutions. Journal of Brazil Chemical Society, 26, 924-938 (2015).
42. Iqbal, M., Saeed, A., Biosorption of reactive dye by loofa sponge-immobilized fungal biomass of P Han erochaete chrysosporium. Process
Biochemical, 42, 1160–1164 (2007).
43. Zhou, Y., Zhang, M., Hu, X., Wang, X., Niu, J., Ma, T., Adsorption of Cationic Dyes on a Cellulose-Based Multicarboxyl Adsorbent, Journal of Chemical Engineering Data., 58, 413–421 (2013).
44. Zafar, S.I., Bisma, M., Saeed, A., Iqbal, M., FTIR spectrophotometry, kinetics and adsorption isotherms modeling, and SEM-EDX analysis for describing mechanism of biosorption of the cationic basic dye methylene blue by a new biosorbent (sawdust of silver fir; Abies pindrow). Fresenius Environmental Bulletin, 17, 2109–2121 (2008).
45. Ahmad, R., Studies on adsorption of crystal violet dye from aqueous solution onto coniferous pinus bark powder (CPBP). Journal of Hazardous Materials, 171, 767–773 (2009).
46. Monash, P., Pugazhenthi, G., Adsorption of crystal violet dye from aqueous solution using mesoporous materials synthesized at room temperature. Adsorption 15, 390–405 (2009).
(Received 10/6/2018;accepted 17/10/2018)
المائية المحاليل من الثنائى) (كنظام البنفسجى الكريستال و الزرقاء المثيلين صبغتى إزالة بإستخدام الطمى المستخلص من التربة المحلية: دراسة حركية و توازنية
احمد ابراهيم عبد الحميد1، جمعه فاروق الفوال2، ماجدة عقل3 1قسم المواد المركبة والنانونية - معهد بحوث التكنولوجيا المتقدمة واالمواد الجديدة - مدينة األبحاث العلمية والتطبيقات
التكنولوجية - مدينة برج العرب الجديدة - اإلسكندرية - مصر.2قسم بحوث المواد البوليمريه - معهد بحوث التكنولوجيا المتقدمة واالمواد الجديدة - مدينة األبحاث العلمية والتطبيقات
التكنولوجية - مدينة برج العرب الجديدة - اإلسكندرية - مصر.3قسم الكيمياء - كليه العلوم - جامعه المنصورة - المنصورة - مصر.
هذه الورقة تعرض إزالة الصبغة الزرقاء و البنفسجية من النظام الثنائي المائي عن طريق االمتزاز على طين التربة المحلية باعتبارها ماده منخفضة التكلفة ومتاحة بكثرة. تم دراسة تأثير مختلف الظروف التجريبية على عمليه األمتزاز أداء إدمصاص جزيئات الصبغات الحرارة. ولتحديد الممتز، درجة الحموضة ودرجة مثل تركيزات األصباغ، وزن على طين التربة ، تم تحليل حركية بيانات اإلمتزاز باستخدام نماذج متعددة مثل نموذج معدل من الدرجة األولى والثانية. يبين هذا النوع من الدراسة أن الحد األقصى لالمتزاز الذي تم التوصل إليه كان خالل دقيقتين ويستخدم حركية الطلب الزائفة الثانية. وقد تم دراسة متساوي االضمحالل في نطاق األس الهيدروجيني من 2 ، 3.7 ، 7 ، و 8.7 عند 25 درجة مئوية وتحليلها مع نموذجين مختلفين هما Langmuir و.Freundlich تم دراسة تفاعل جزيئات الصبغ مع طين التربة بواسطة SEM و EDS و FTIRو XRD. كان الحد األقصى الزاله الصبغة الزرقاء و البنفسجية هو 47.82 و 35.71 ملغم / غرام ، على التوالي عن طريق امتصاص جزيئات الصبغات على التربة الطينية. تقدم هذة الطريقه حالً
واعًدا إلزالة الصبغات الزرقاء و البنفسجية من مياه الصرف الصحي.