4.6 flooding and climate change - flood catalog:...
TRANSCRIPT
152
4.6 Flooding and climate changeDr PJ Baxter1, Dr I Moller2, Dr T Spencer2, Dr RJ Spence3 Dr S Tapsell41University of Cambridge, Department of Community Medicine2University of Cambridge, Cambridge Coastal Research Unit3University of Cambridge, Department of Architecture4Flood Hazard Research Centre, Middlesex University
Coastal Flooding
Summary
❏ Climate change in the UK is likely to be associated with an increased risk of severe floodingin low-lying coastal areas and the return time of severe flooding events is likely to besignificantly reduced.
❏ Emergency plans to mitigate the effects of such floods should be reviewed urgently.
❏ A detailed risk assessment of the likely effects on health of a major flood of low-lying areas isurgently needed.
❏ Further research into methods of coastal engineering leading to design guidelines for coastaldefences is needed.
4.6.1 IntroductionOn a world scale, global warming and a consequent significant rise in sea level would have severeimpacts for some low-lying coasts and islands. The consequences for the UK are in generalperceived as amenable to technological control, such as through the construction of more resilientsea defences. Perhaps the best example is the Thames Barrier, which was erected to protect Londonfrom severe floods with a design that allowed for a predicted sea level rise until the year 2030.Thischapter is possibly one of the first attempts to address the issue of coastal floods, from theperspective of human risk and the health consequences as a result of rising sea levels and a potentialincrease in storminess. Our analysis presents a complex picture in which we find significantlimitations in the current state of hazard and risk analysis of coastal floods and recommends thatthese need to be addressed before the impact of climate change on human health can besatisfactorily estimated.
4.6.2 Key questions for future risk scenario development This chapter focuses on coastal flooding (sea defences) and omits discussion of coastal erosion(coastal defences). It assesses the human consequences of potential flooding events which couldhave impacts on a disaster scale.The reference event in this analysis is the East Coast Floods of 1953in which 307 people died.
The following questions are to be addressed.
❏ If there were a recurrence of a major flood, as exemplified by the 1953 flood event, whathazards would it present today and in a future scenario of climate change?
❏ Can the current probabilities of major coastal flood events be estimated and how would thesebe affected by the future climatological estimates, both in terms of return periods and severity?
❏ What would be the loss of life and health implications for society of such a future event?
153
❏ Can increases in the risk of major coastal flooding be prevented by engineering measures(improved coastal defences) alone?
❏ What other mitigation measures may be needed to reduce vulnerability to such events?
The reactions of society to climate change also need to be considered.To answer these questionswe have reviewed:
1. Flood disaster model: East Coast floods, 1953
2. The forcing factors: climate change scenarios
3. Flood characteristics
4. Sea defences and coastal management issues
5. Causes of vulnerability
6. Human health consequences of floods
7. Mitigation measures
4.6.3 East Coast floods 1953This remarkable event was documented by Greave (1956)1 and Summers (1978)2, and is presentedhere as a model for future flood disaster events. On Saturday 31 January and Sunday 1 February1953 a great storm surge, accompanied by gale force winds, swept over the north of the UK,causing widespread flooding of coastal areas. The waters of the North Sea, whipped by thenortherly gales to huge tidal levels, smashed through the sea wall defences in hundreds of placesfrom Spurnhead to Kent.The damage extended over 1000 miles of coastline, and involved breachesin the defences at some 1200 sites. In some places not a mile of sea wall remained intact. 307 peoplelost their lives and over 32 000 had to be evacuated from their homes.Whole communities wereisolated. 24 000 houses were flooded and damaged - some beyond repair.
During the Saturday morning the winds reached force 10 with gusts up to 125 mph. In eastScotland the wind flattened thousands of acres of forest.The mean sea level rose by 0.6 m.Windslashed the surface of the water with waves over 4.9 m height, the high waves being generated bythe very long fetch, i.e. the sea track over which the winds were blowing. It seems probable thatthe surge had an elevation of about 2.6 m all along the Norfolk coast. Levels were particularly highat King’s Lynn (3 m for comparison, a category 3 hurricane creates a surge of 3-4 m). Fortunatelythere had not been heavy rain or melting snow in the uplands and so rivers were not in flood orswollen at the time, if they had been the results would have been far greater in extent, wideningthe area and scope of the disaster.The East Coast defences and the authorities responsible for themwere totally unprepared.
The sea attacked in two ways:
❏ wave action or scour against sea walls and dunes until they were breached (e.g. Lincolnshire,north Norfolk and parts of Kent); and
❏ sea surging up estuaries and overtopping and breaching river banks (e.g. Suffolk and Essex).
Some descriptions of deaths are given by Greave1 (Appendix).The worse effects were in CanveyIsland. A few people had been warned in time to take refuge in their house lofts. However, mostwere awakened at about 1.10am by a roar as the nearby sea wall was breached and the water
154
thundered past their doors in an irresistible avalanche. Within 15 minutes the water was abovewindow sill level. Much damage to walls, doors and windows was caused by floating debris beingflung against houses. Many people were drowned in their beds. Others died of shock or exposureas they scrambled on to house roofs and waited in the dark and cold for help to come. Some peoplecollapsed and slipped from places of refuge into the water and drowned. Especially vulnerable werethe old, those living alone and those prone to respiratory or rheumatic illness. Fifty-eight peopledied that night on Canvey, but it was noted that the death rate climbed significantly during thetwo months following the disaster, as compared with the same two months the previous year2.
This description illustrates some of the impacts of the flooding that need to be considered as far ashuman risk is concerned.The most devastating consequences were from the breach of the defencesor banks by a wave of water carrying with it debris that smashed open houses, swept away peopleand caused drowning with little warning. Bungalows were at greatest risk for the occupants whohad no upstairs for refuge. Since the flooding occurred in winter, many who survived the initialdrowning subsequently died from exposure.Thus the elderly and small children would be the mostvulnerable in such events, and the low temperature of the water would induce drowning on suddenimmersion and also cause death in survivors by the subsequent development of hypothermia.Thetiming would be crucial, depending on whether the flooding occurred during a time of the dayor at night when people would be least prepared. Other factors need to be considered. Forexample, at Tilbury the sewage works were submerged, creating additional problems and anightwatchman was killed by coal gas escaping from a fractured main.Today, technological hazardswould be substantially greater, for example, with the storage of chemicals and fertilisers in manyplaces.
According to the Environment Agency (1999)3 :“The 1953 flood was the most devastating flood of recent times.Although the tide of 31 January 1953was only a moderate spring tide, a large surge had been generated which was amplified by winds as itprogressed southwards along the east coast. Sea levels in the North Sea rose over 2m higher than tidalpredictions.The severity of the disaster was certainly increased because it all happened in darkness.Therehas been a series of less destructive floods since 1953.”
“After the flood defences failed in the 1953 storm, many of them were rebuilt and improved using 1953levels as a maximum.The Thames Barrier was built as recommended in the Government’s report on the1953 flood, although not completed until 1982.The design recognised that sea level was rising by 0.8cm per year and allows for the rise to continue until 2030.The barrier, which will cope with events up toa return frequency of 1 in 1000 years, was designed to protect London and upper parts of the Thamesestuary from storm surges. As well as tidal defences, about 126 500 domestic and commercial propertiesrely on sea defences for their protection and some 366 000 people live in houses liable to flooding fromthe sea. For Wales, the figures are 33 000 properties and 84 000 people.”
However, these estimates of the numbers of people at risk may be open to question. Even in the1953 East Coast floods it appears that adequate assessment of the extent of the flooding was notmade, for example, records were based only on the areas where existing houses were impacted.

155
4.6.4 Forcing factors: climate change scenarios for the UnitedKingdomClimatologists agree that there are two main issues involved in the assessment of future coastalflooding risk: the rate of sea level rise and whether storminess will increase as the result of climatechange.
Sea level rise
The UK Climate Impacts Programme Technical Report No 1, 1998, describes four possibleclimate futures for the UK. Global mean sea level is set to rise in all four scenarios, the rate ofincrease ranging from 2.4 cm per decade to 10 cm per decade.The change in mean sea level aroundthe UK coast closely follows that at a global scale and leads to a large reduction in the returnperiods for certain high tide levels around parts of the UK coast. Natural vertical land movementsmust also be considered. Thus the report concludes that the relative sea level rise by the 2050sunder the Medium High scenario could be 41 cm in East Anglia and 21 cm in the west ofScotland. At the East Coast we can take 6 mm per year as the best estimate of sea level rise as aresult of a fall in the land and rise in sea level.Thus the report concludes that for Harwich a hightide level of 5.6 m above datum that currently has a return period of 1 in 100 years (probability of1% per annum) would have a 10 year return period (probability of 10% per annum) - an extremeexample of the UK coastline for the 2050s. Furthermore, this return period and the resultantincreased risk of flooding makes no allowance for a potential increase in storminess.
“A rising sea level puts low lying land at greater risk of inundation.This may happen simply by the seacovering the land if it has no defences, but also by storms acting together with higher sea levels to overtopsea defences if they are not adapted.The overtopping of sea defences, during storm surges, is likely to occurmore frequently if mean sea levels rise. For example, floods which currently occur on the east coast ofEngland once in 100 years could have a return period of 50 years by 2050, and on the west coast (forexample at Avonmouth) the return period for a 100 year flood could reduce to 1.5 years.”3
Other experts talk about an increase in return rates of an order of magnitude so that the 1953 floodwhich is regarded as a 1 in 500 year event could become at least a 1 in 50 without including theincrease in storminess. A trend of rising sea level is already discernible around the UK coastline(Section 1.2.2)
Storminess
The potential for changes in storminess are regarded as ‘quite modest’. Summer gales couldbecome a little more frequent, as could very severe winter gales.The average number of gales peryear since 1881 is 12-15. By the 2080s, Scotland could see increases of severe gales up to 7%.Relatively little is known about modifications in the patterns of depressions that could lead, forexample, to storms arising back-to-back with one weakening the sea defences and the otherovertopping them. However, for trends that appear to show an increase in storminess in recentdecades the records over the century show that this could also be explained as part of the normalvariability. Wave heights have also been increasing in the North Atlantic, but this finding is alsoregarded by scientists as within normal variability.
156
Flooding
According to the Environment Agency (1999)3:
“Areas which are less than 5m above ordnance datum are at greatest potential risk of flooding from thesea. Some 5% of the population and 1.5% of the land lie below this level, but sea defences have reducedthe risk in many places. Furthermore, over 50% of all grade 1 agricultural land in England and Waleslies below this level.The east coast of England, particularly the area between the Humber and the Thames,is at the greatest risk of flooding from the sea.This is due to a range of factors:
❏ much of the land along the east coast is flat and low lying;
❏ a history of land reclamation has resulted in a substantial proportion of the coastal strip and some inlandareas lying below the high tide level and reclamation has interfered with the natural process of deposition;
❏ the relatively shallow waters of the North Sea result in the tide forming a special sort of wave which causescomplex tidal patterns; and
❏ storm surges may coincide with high tides to cause abnormally high water levels in the North Sea.
It is this interaction of the tide and storm surges that is the crucial factor in determining extreme waterlevels and the potential for flooding. Surges that occur at or near a neap tide are unlikely to causedangerously high sea levels, but at or near a high spring tide even a modest surge can cause flooding.Thegreatest danger is when a large storm surge coincides with the time of high water during an abnormallyhigh tide, although there is a tendency for the maximum surge to occur about four hours after high water.The east coast of England experiences an average of 19 storm surges over 0.6 m above ‘normal’ tide heighteach winter.The west coast has a similar frequency of surges and the south coast fewer. Severe wave actioncan add considerable height to water levels and can also contribute to the damage through battering. It canbe a crucial factor in the breaching or overtopping of sea defences.”
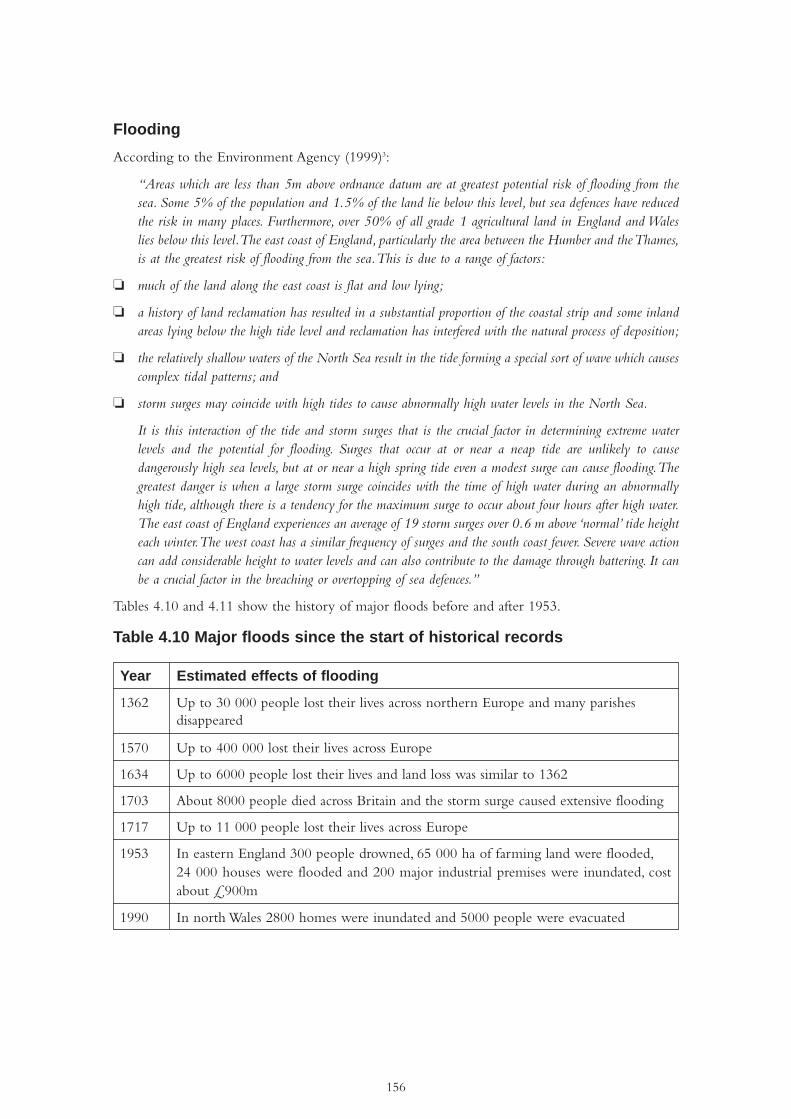
Tables 4.10 and 4.11 show the history of major floods before and after 1953.
Table 4.10 Major floods since the start of historical records
Year Estimated effects of flooding
1362 Up to 30 000 people lost their lives across northern Europe and many parishesdisappeared
1570 Up to 400 000 lost their lives across Europe
1634 Up to 6000 people lost their lives and land loss was similar to 1362
1703 About 8000 people died across Britain and the storm surge caused extensive flooding
1717 Up to 11 000 people lost their lives across Europe
1953 In eastern England 300 people drowned, 65 000 ha of farming land were flooded,24 000 houses were flooded and 200 major industrial premises were inundated, costabout £900m
1990 In north Wales 2800 homes were inundated and 5000 people were evacuated
157
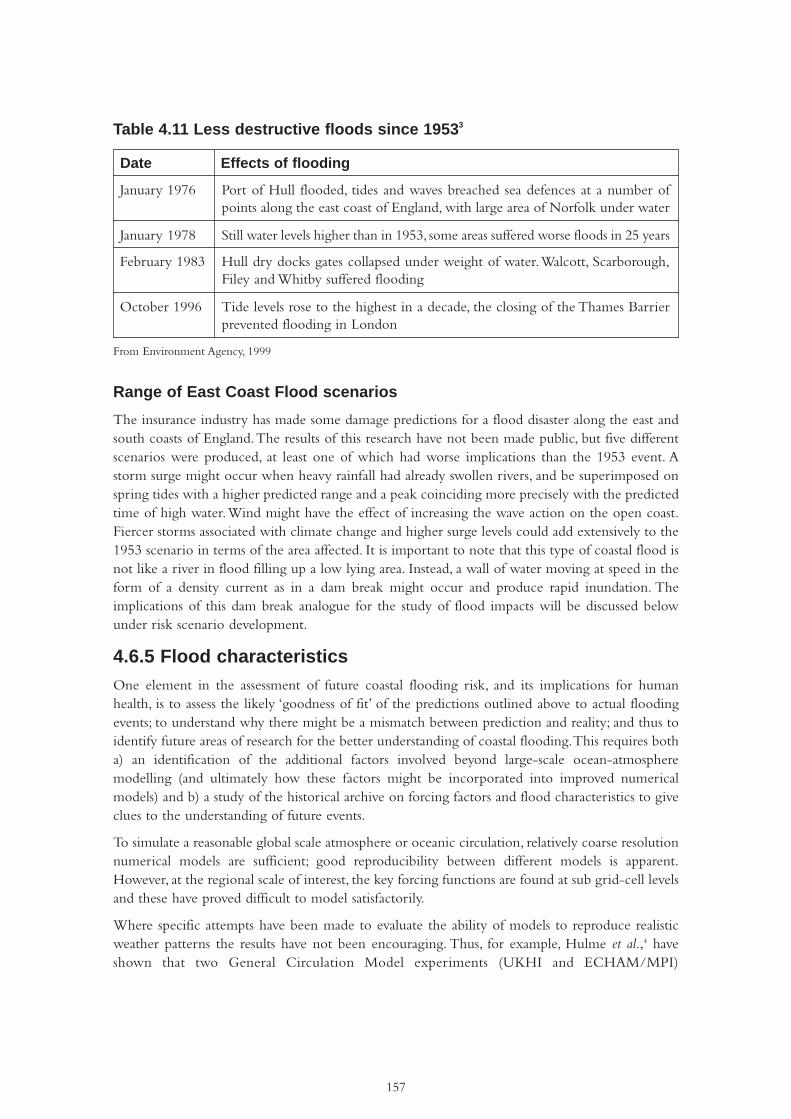
Table 4.11 Less destructive floods since 19533
From Environment Agency, 1999
Range of East Coast Flood scenarios
The insurance industry has made some damage predictions for a flood disaster along the east andsouth coasts of England.The results of this research have not been made public, but five differentscenarios were produced, at least one of which had worse implications than the 1953 event. Astorm surge might occur when heavy rainfall had already swollen rivers, and be superimposed onspring tides with a higher predicted range and a peak coinciding more precisely with the predictedtime of high water.Wind might have the effect of increasing the wave action on the open coast.Fiercer storms associated with climate change and higher surge levels could add extensively to the1953 scenario in terms of the area affected. It is important to note that this type of coastal flood isnot like a river in flood filling up a low lying area. Instead, a wall of water moving at speed in theform of a density current as in a dam break might occur and produce rapid inundation. Theimplications of this dam break analogue for the study of flood impacts will be discussed belowunder risk scenario development.
4.6.5 Flood characteristicsOne element in the assessment of future coastal flooding risk, and its implications for humanhealth, is to assess the likely ‘goodness of fit’ of the predictions outlined above to actual floodingevents; to understand why there might be a mismatch between prediction and reality; and thus toidentify future areas of research for the better understanding of coastal flooding.This requires botha) an identification of the additional factors involved beyond large-scale ocean-atmospheremodelling (and ultimately how these factors might be incorporated into improved numericalmodels) and b) a study of the historical archive on forcing factors and flood characteristics to giveclues to the understanding of future events.
To simulate a reasonable global scale atmosphere or oceanic circulation, relatively coarse resolutionnumerical models are sufficient; good reproducibility between different models is apparent.However, at the regional scale of interest, the key forcing functions are found at sub grid-cell levelsand these have proved difficult to model satisfactorily.
Where specific attempts have been made to evaluate the ability of models to reproduce realisticweather patterns the results have not been encouraging. Thus, for example, Hulme et al.,4 haveshown that two General Circulation Model experiments (UKHI and ECHAM/MPI)
Date Effects of flooding
January 1976 Port of Hull flooded, tides and waves breached sea defences at a number ofpoints along the east coast of England, with large area of Norfolk under water
February 1983 Hull dry docks gates collapsed under weight of water.Walcott, Scarborough,Filey and Whitby suffered flooding
October 1996 Tide levels rose to the highest in a decade, the closing of the Thames Barrierprevented flooding in London
January 1978 Still water levels higher than in 1953, some areas suffered worse floods in 25 years
158
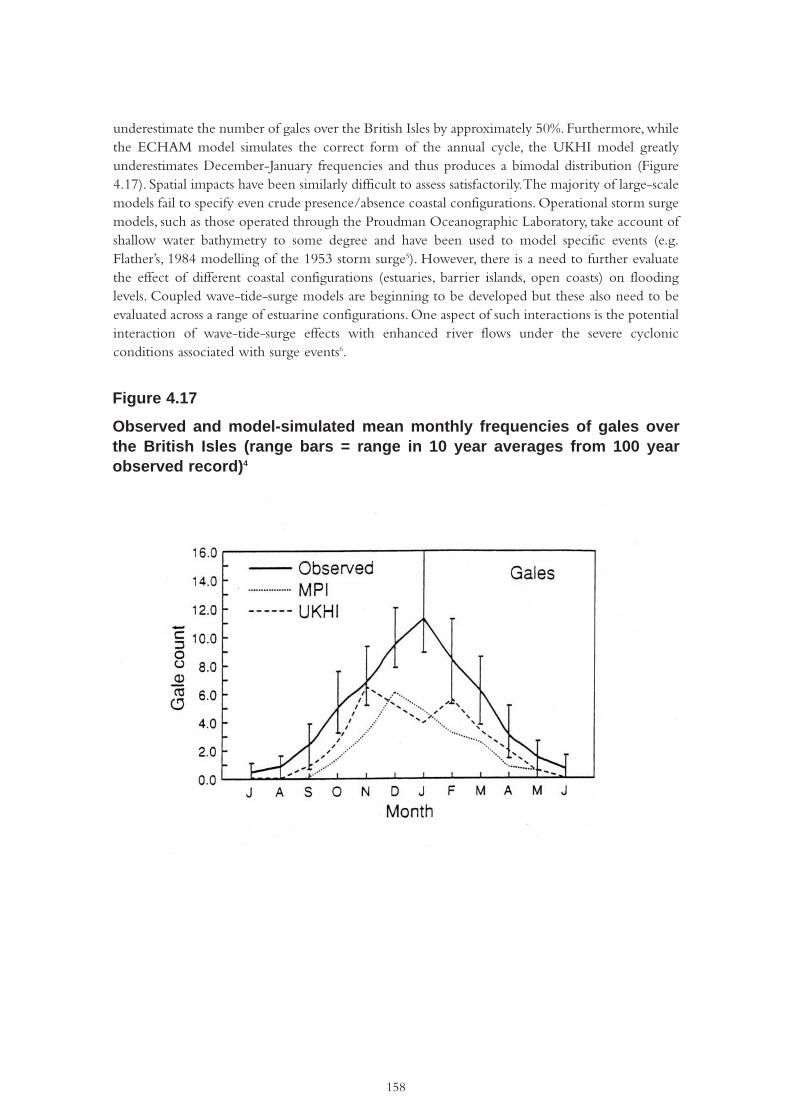
underestimate the number of gales over the British Isles by approximately 50%. Furthermore, whilethe ECHAM model simulates the correct form of the annual cycle, the UKHI model greatlyunderestimates December-January frequencies and thus produces a bimodal distribution (Figure4.17). Spatial impacts have been similarly difficult to assess satisfactorily.The majority of large-scalemodels fail to specify even crude presence/absence coastal configurations. Operational storm surgemodels, such as those operated through the Proudman Oceanographic Laboratory, take account ofshallow water bathymetry to some degree and have been used to model specific events (e.g.Flather’s, 1984 modelling of the 1953 storm surge5). However, there is a need to further evaluatethe effect of different coastal configurations (estuaries, barrier islands, open coasts) on floodinglevels. Coupled wave-tide-surge models are beginning to be developed but these also need to beevaluated across a range of estuarine configurations. One aspect of such interactions is the potentialinteraction of wave-tide-surge effects with enhanced river flows under the severe cyclonicconditions associated with surge events6.
Figure 4.17
Observed and model-simulated mean monthly frequencies of gales overthe British Isles (range bars = range in 10 year averages from 100 yearobserved record)4
159
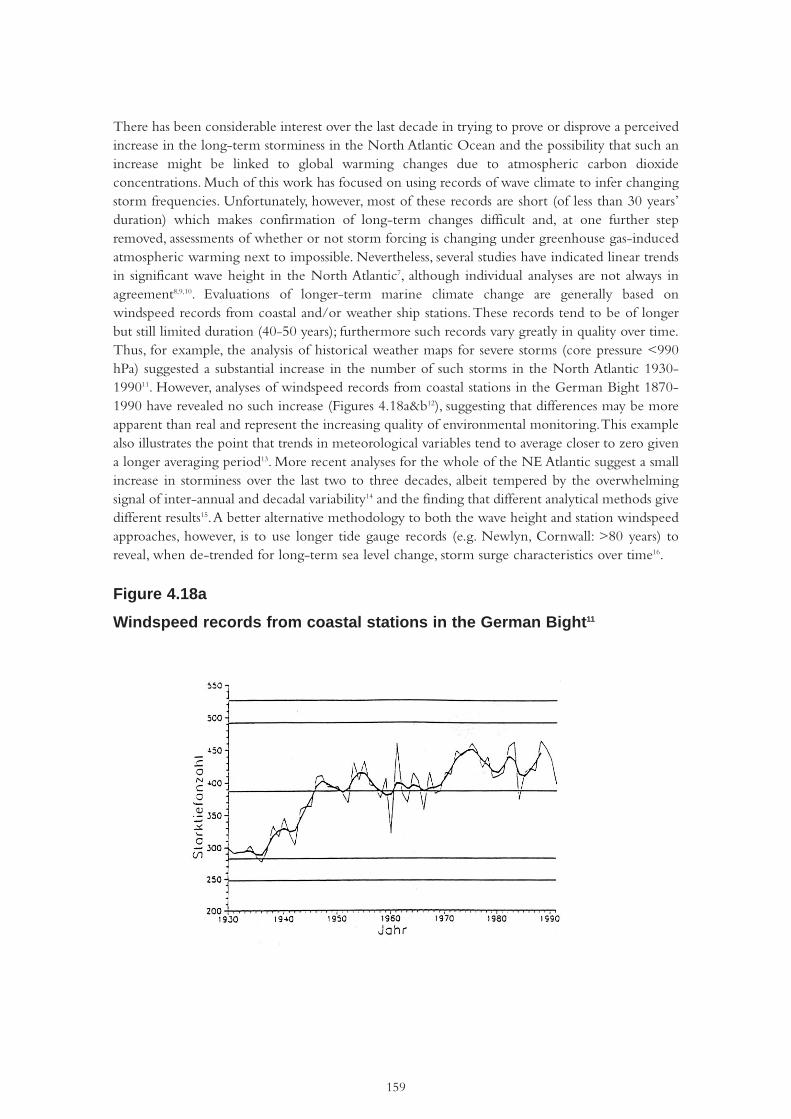
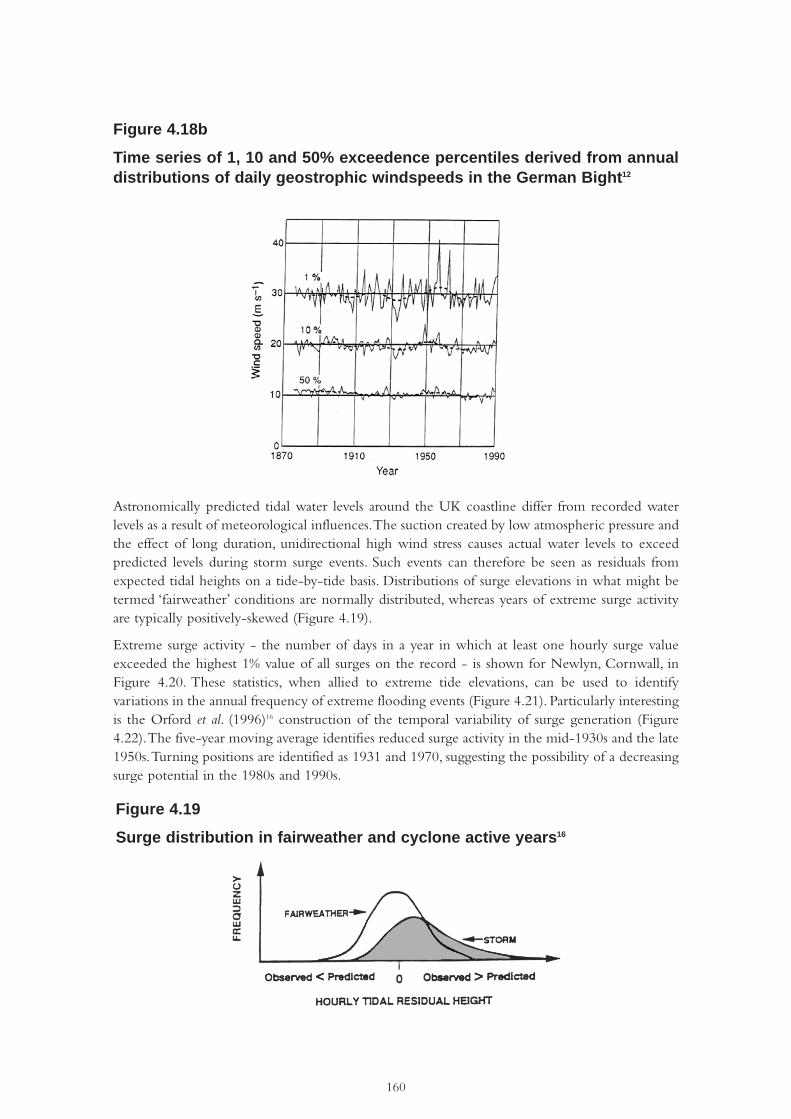
There has been considerable interest over the last decade in trying to prove or disprove a perceivedincrease in the long-term storminess in the North Atlantic Ocean and the possibility that such anincrease might be linked to global warming changes due to atmospheric carbon dioxideconcentrations. Much of this work has focused on using records of wave climate to infer changingstorm frequencies. Unfortunately, however, most of these records are short (of less than 30 years’duration) which makes confirmation of long-term changes difficult and, at one further stepremoved, assessments of whether or not storm forcing is changing under greenhouse gas-inducedatmospheric warming next to impossible. Nevertheless, several studies have indicated linear trendsin significant wave height in the North Atlantic7, although individual analyses are not always inagreement8,9,10. Evaluations of longer-term marine climate change are generally based onwindspeed records from coastal and/or weather ship stations.These records tend to be of longerbut still limited duration (40-50 years); furthermore such records vary greatly in quality over time.Thus, for example, the analysis of historical weather maps for severe storms (core pressure <990hPa) suggested a substantial increase in the number of such storms in the North Atlantic 1930-199011. However, analyses of windspeed records from coastal stations in the German Bight 1870-1990 have revealed no such increase (Figures 4.18a&b12), suggesting that differences may be moreapparent than real and represent the increasing quality of environmental monitoring.This examplealso illustrates the point that trends in meteorological variables tend to average closer to zero givena longer averaging period13. More recent analyses for the whole of the NE Atlantic suggest a smallincrease in storminess over the last two to three decades, albeit tempered by the overwhelmingsignal of inter-annual and decadal variability14 and the finding that different analytical methods givedifferent results15.A better alternative methodology to both the wave height and station windspeedapproaches, however, is to use longer tide gauge records (e.g. Newlyn, Cornwall: >80 years) toreveal, when de-trended for long-term sea level change, storm surge characteristics over time16.
Figure 4.18a
Windspeed records from coastal stations in the German Bight11
160
Astronomically predicted tidal water levels around the UK coastline differ from recorded waterlevels as a result of meteorological influences.The suction created by low atmospheric pressure andthe effect of long duration, unidirectional high wind stress causes actual water levels to exceedpredicted levels during storm surge events. Such events can therefore be seen as residuals fromexpected tidal heights on a tide-by-tide basis. Distributions of surge elevations in what might betermed ‘fairweather’ conditions are normally distributed, whereas years of extreme surge activityare typically positively-skewed (Figure 4.19).
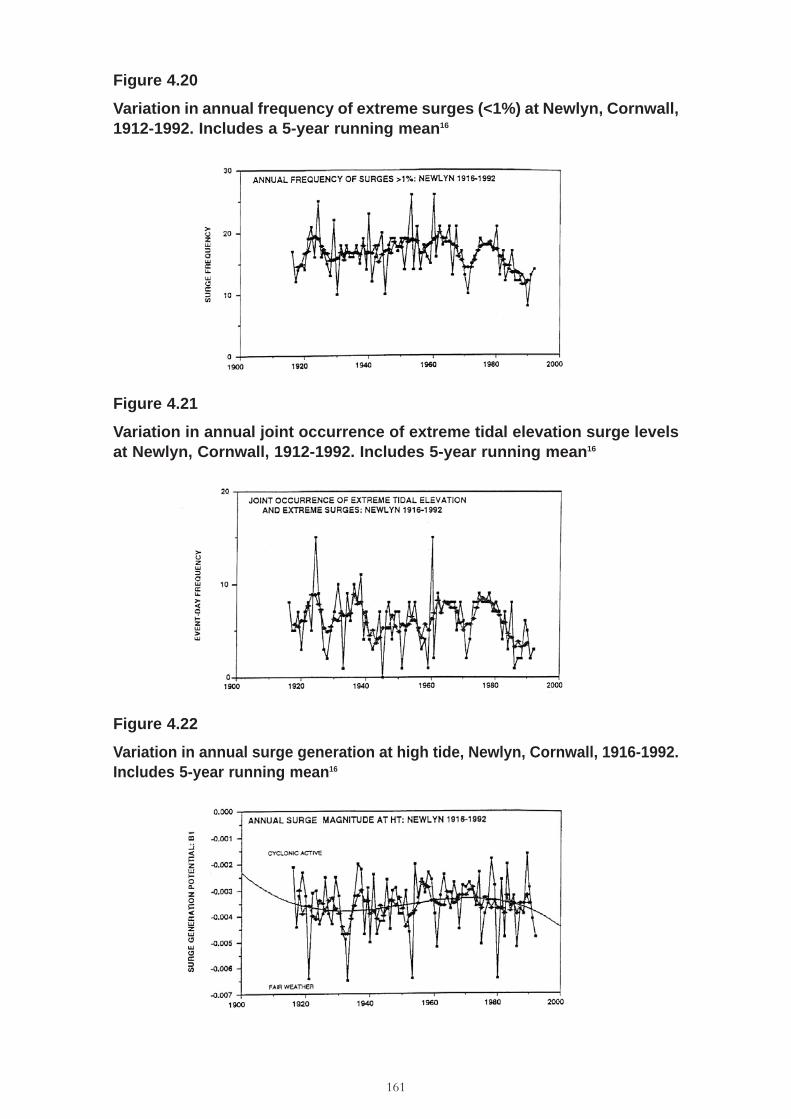
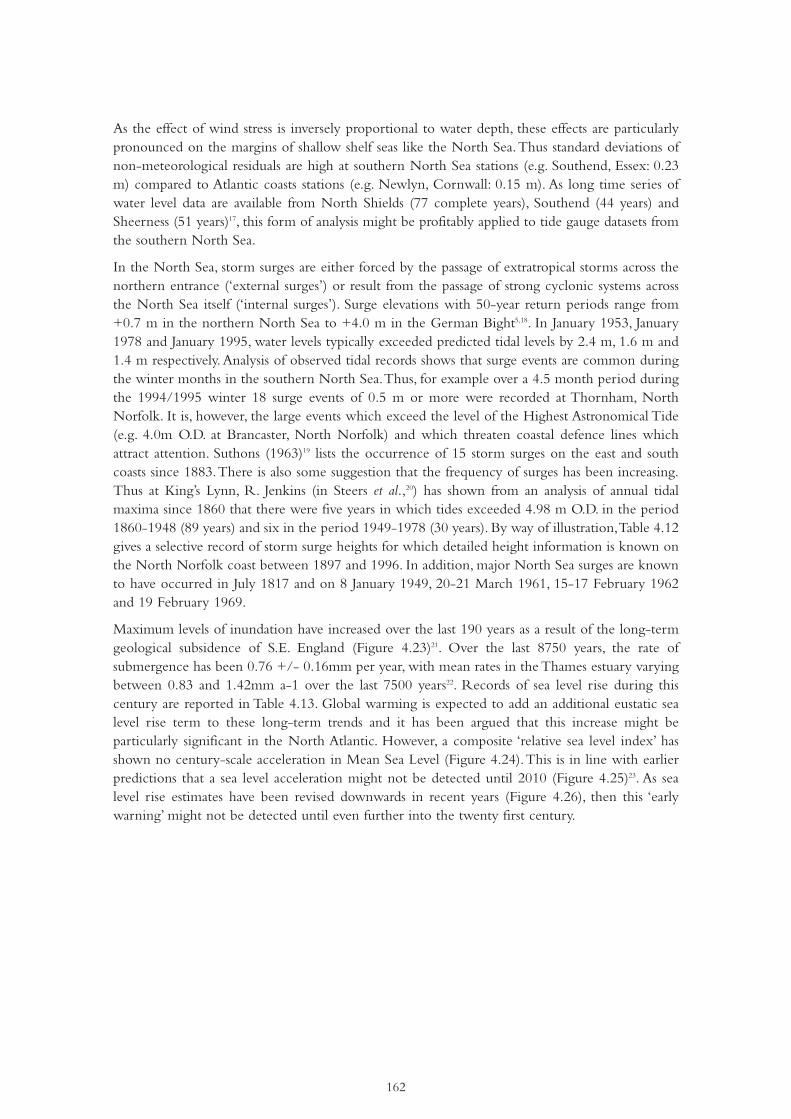
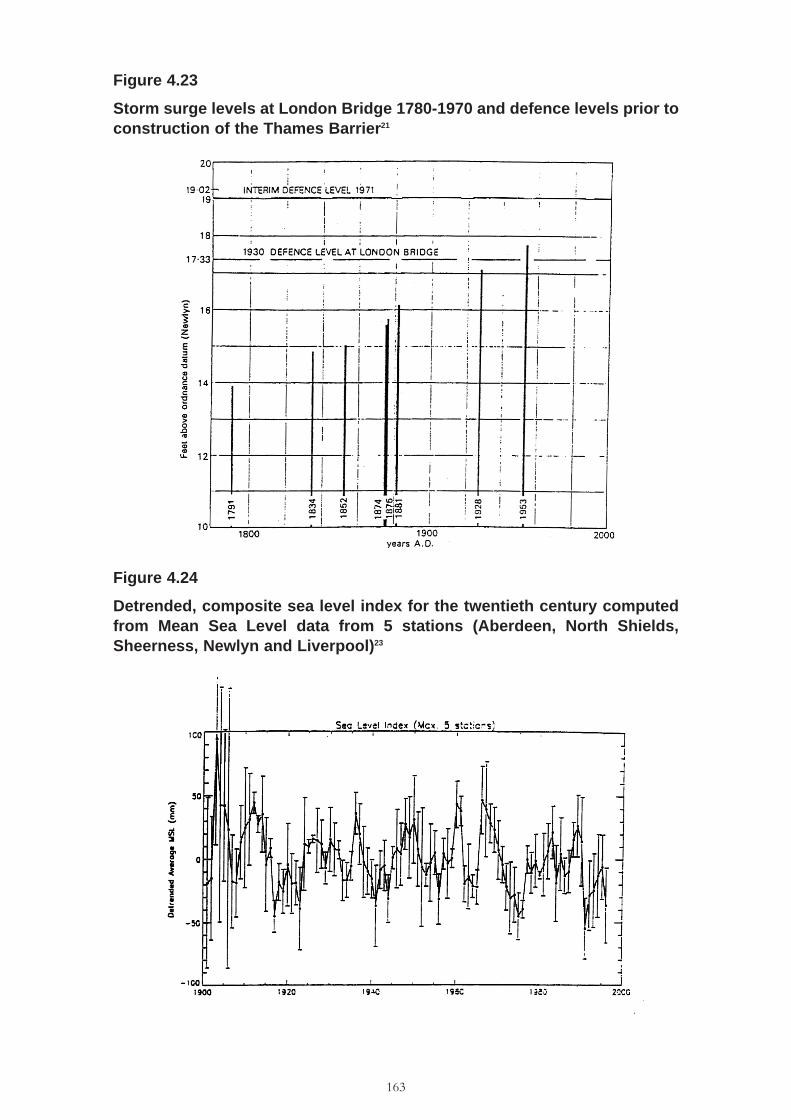
Extreme surge activity - the number of days in a year in which at least one hourly surge valueexceeded the highest 1% value of all surges on the record - is shown for Newlyn, Cornwall, inFigure 4.20. These statistics, when allied to extreme tide elevations, can be used to identifyvariations in the annual frequency of extreme flooding events (Figure 4.21). Particularly interestingis the Orford et al. (1996)16 construction of the temporal variability of surge generation (Figure4.22).The five-year moving average identifies reduced surge activity in the mid-1930s and the late1950s.Turning positions are identified as 1931 and 1970, suggesting the possibility of a decreasingsurge potential in the 1980s and 1990s.
Figure 4.18b
Time series of 1, 10 and 50% exceedence percentiles derived from annualdistributions of daily geostrophic windspeeds in the German Bight12
Figure 4.19
Surge distribution in fairweather and cyclone active years16
161
Figure 4.20
Variation in annual frequency of extreme surges (<1%) at Newlyn, Cornwall,1912-1992. Includes a 5-year running mean16
Figure 4.21
Variation in annual joint occurrence of extreme tidal elevation surge levelsat Newlyn, Cornwall, 1912-1992. Includes 5-year running mean16
Figure 4.22
Variation in annual surge generation at high tide, Newlyn, Cornwall, 1916-1992.Includes 5-year running mean16
162
As the effect of wind stress is inversely proportional to water depth, these effects are particularlypronounced on the margins of shallow shelf seas like the North Sea.Thus standard deviations ofnon-meteorological residuals are high at southern North Sea stations (e.g. Southend, Essex: 0.23m) compared to Atlantic coasts stations (e.g. Newlyn, Cornwall: 0.15 m). As long time series ofwater level data are available from North Shields (77 complete years), Southend (44 years) andSheerness (51 years)17, this form of analysis might be profitably applied to tide gauge datasets fromthe southern North Sea.
In the North Sea, storm surges are either forced by the passage of extratropical storms across thenorthern entrance (‘external surges’) or result from the passage of strong cyclonic systems acrossthe North Sea itself (‘internal surges’). Surge elevations with 50-year return periods range from+0.7 m in the northern North Sea to +4.0 m in the German Bight5,18. In January 1953, January1978 and January 1995, water levels typically exceeded predicted tidal levels by 2.4 m, 1.6 m and1.4 m respectively. Analysis of observed tidal records shows that surge events are common duringthe winter months in the southern North Sea.Thus, for example over a 4.5 month period duringthe 1994/1995 winter 18 surge events of 0.5 m or more were recorded at Thornham, NorthNorfolk. It is, however, the large events which exceed the level of the Highest Astronomical Tide(e.g. 4.0m O.D. at Brancaster, North Norfolk) and which threaten coastal defence lines whichattract attention. Suthons (1963)19 lists the occurrence of 15 storm surges on the east and southcoasts since 1883.There is also some suggestion that the frequency of surges has been increasing.Thus at King’s Lynn, R. Jenkins (in Steers et al.,20) has shown from an analysis of annual tidalmaxima since 1860 that there were five years in which tides exceeded 4.98 m O.D. in the period1860-1948 (89 years) and six in the period 1949-1978 (30 years). By way of illustration,Table 4.12gives a selective record of storm surge heights for which detailed height information is known onthe North Norfolk coast between 1897 and 1996. In addition, major North Sea surges are knownto have occurred in July 1817 and on 8 January 1949, 20-21 March 1961, 15-17 February 1962and 19 February 1969.
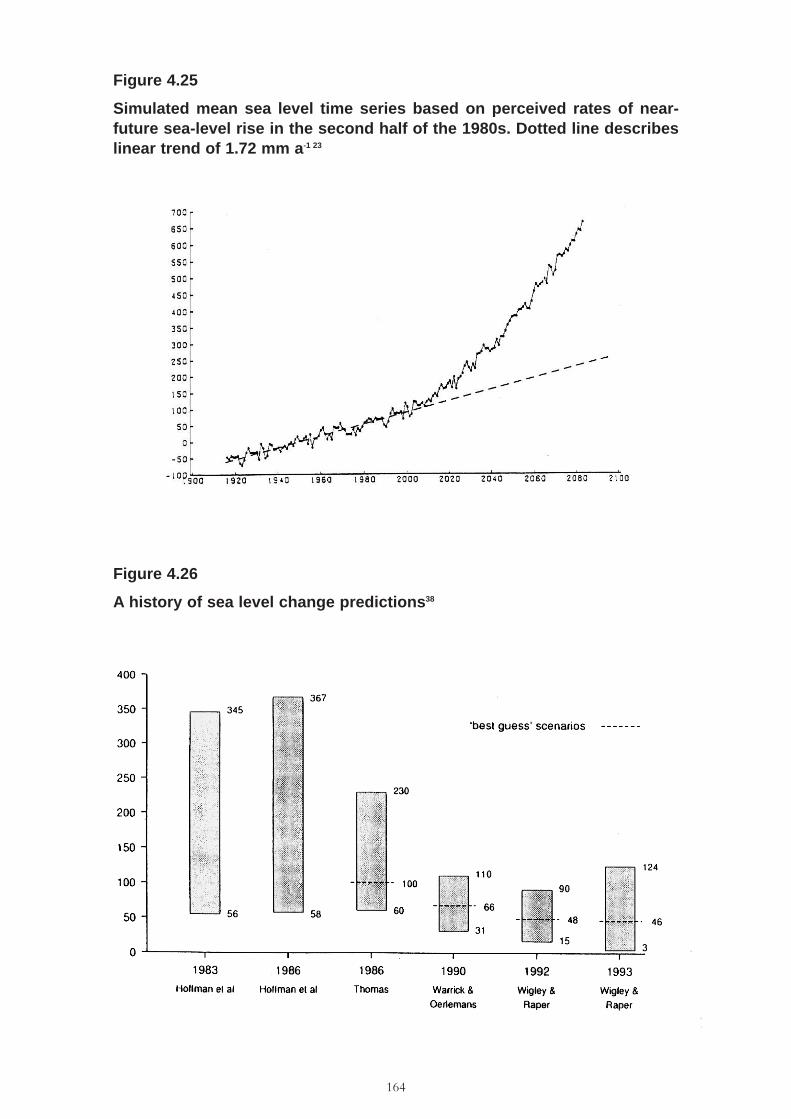
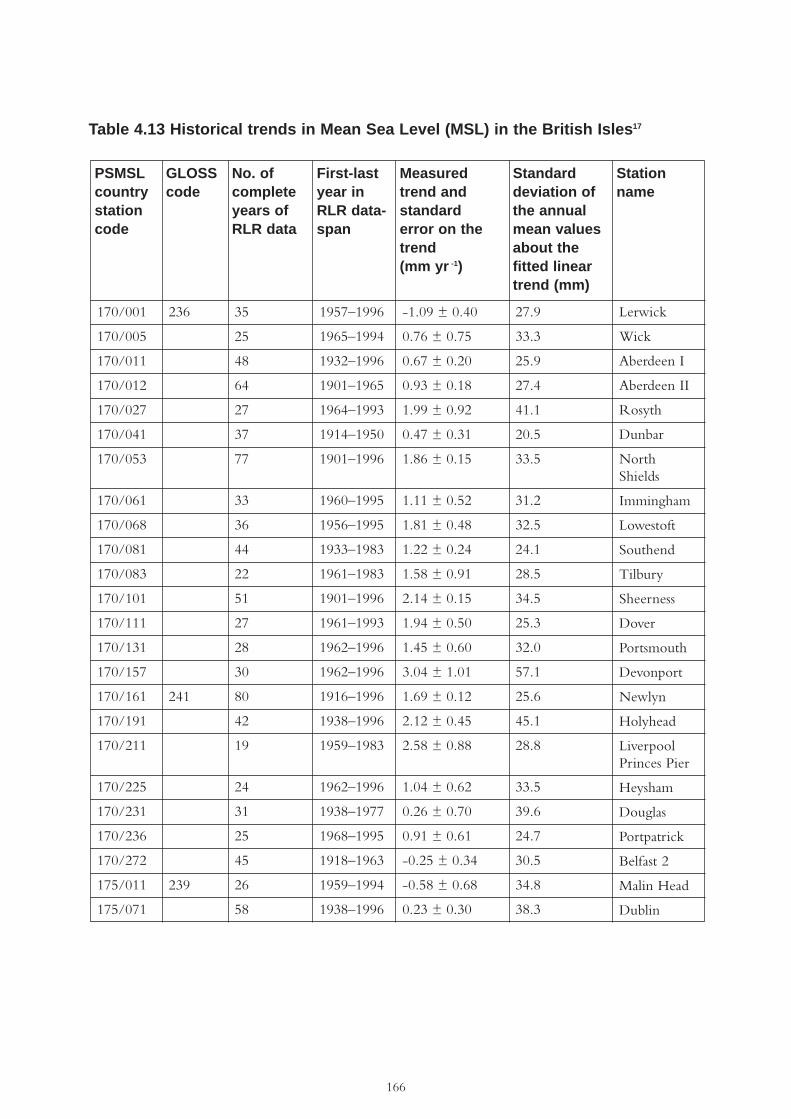
Maximum levels of inundation have increased over the last 190 years as a result of the long-termgeological subsidence of S.E. England (Figure 4.23)21. Over the last 8750 years, the rate ofsubmergence has been 0.76 +/- 0.16mm per year, with mean rates in the Thames estuary varyingbetween 0.83 and 1.42mm a-1 over the last 7500 years22. Records of sea level rise during thiscentury are reported in Table 4.13. Global warming is expected to add an additional eustatic sealevel rise term to these long-term trends and it has been argued that this increase might beparticularly significant in the North Atlantic. However, a composite ‘relative sea level index’ hasshown no century-scale acceleration in Mean Sea Level (Figure 4.24).This is in line with earlierpredictions that a sea level acceleration might not be detected until 2010 (Figure 4.25)23. As sealevel rise estimates have been revised downwards in recent years (Figure 4.26), then this ‘earlywarning’ might not be detected until even further into the twenty first century.
163
Figure 4.23
Storm surge levels at London Bridge 1780-1970 and defence levels prior toconstruction of the Thames Barrier21
Figure 4.24
Detrended, composite sea level index for the twentieth century computedfrom Mean Sea Level data from 5 stations (Aberdeen, North Shields,Sheerness, Newlyn and Liverpool)23
164
Figure 4.25
Simulated mean sea level time series based on perceived rates of near-future sea-level rise in the second half of the 1980s. Dotted line describeslinear trend of 1.72 mm a-1 23
Figure 4.26
A history of sea level change predictions38

165
Lo
cati
on
Rec
ord
ed w
ater
leve
ls (
m a
bo
ve O
rdn
ance
Dat
um
)
1897
1912
1953
1969
1976
1978
1990
1993
1995
Bla
kene
y4.
964.
88–4
.27
Bla
kene
y Q
uay
6.07
4.90
4.66
Stiff
key
4.66
4.57
5.55
4.45
Wel
ls5.
134.
274.
55–4
.66
4.91
Bur
nham
Ove
ry5.
495.
514.
67–4
.10
4.54
Bur
nham
4.43
4.35
4.62
4.55
–4.3
74.
55D
eepd
ale
Scol
t H
ead
Isla
nd5.
375.
22–4
.71
4.45
4.61
Tab
le 4
.12
Sto
rm s
urg
es o
n t
he
No
rth
No
rfo
lk c
oas
t fr
om
pu
blis
hed
rec
ord
s an
d f
ield
su
rvey
s (c
om
plil
ed b
y th
eC
amb
rid
ge
Co
asta
l Res
earc
h U
nit
)
166
Table 4.13 Historical trends in Mean Sea Level (MSL) in the British Isles17
PSMSLcountrystationcode
GLOSScode
No. ofcompleteyears ofRLR data
First-lastyear inRLR data-span
Measuredtrend andstandarderror on thetrend(mm yr -1)
Standarddeviation ofthe annualmean valuesabout thefitted lineartrend (mm)
Stationname
170/001
170/005
170/011
170/012
170/027
170/041
170/053
170/061
170/068
170/081
170/083
170/101
170/111
170/131
170/157
170/161
170/191
170/211
170/225
170/231
170/236
170/272
175/011
175/071
35
25
48
64
27
37
77
33
36
44
22
51
27
28
30
80
42
19
24
31
25
45
26
58
1957–1996
1965–1994
1932–1996
1901–1965
1964–1993
1914–1950
1901–1996
1960–1995
1956–1995
1933–1983
1961–1983
1901–1996
1961–1993
1962–1996
1962–1996
1916–1996
1938–1996
1959–1983
1962–1996
1938–1977
1968–1995
1918–1963
1959–1994
1938–1996
-1.09 ± 0.40
0.76 ± 0.75
0.67 ± 0.20
0.93 ± 0.18
1.99 ± 0.92
0.47 ± 0.31
1.86 ± 0.15
1.11 ± 0.52
1.81 ± 0.48
1.22 ± 0.24
1.58 ± 0.91
2.14 ± 0.15
1.94 ± 0.50
1.45 ± 0.60
3.04 ± 1.01
1.69 ± 0.12
2.12 ± 0.45
2.58 ± 0.88
1.04 ± 0.62
0.26 ± 0.70
0.91 ± 0.61
-0.25 ± 0.34
-0.58 ± 0.68
0.23 ± 0.30
27.9
33.3
25.9
27.4
41.1
20.5
33.5
31.2
32.5
24.1
28.5
34.5
25.3
32.0
57.1
25.6
45.1
28.8
33.5
39.6
24.7
30.5
34.8
38.3
Lerwick
Wick
Aberdeen I
Aberdeen II
Rosyth
Dunbar
NorthShields
Immingham
Lowestoft
Southend
Tilbury
Sheerness
Dover
Portsmouth
Devonport
Newlyn
Holyhead
LiverpoolPrinces Pier
Heysham
Douglas
Portpatrick
Belfast 2
Malin Head
Dublin
236
241
239
167
4.6.6 Coastal management issues
Current responsibility for the maintenance of sea defences
In England, the responsibility for flood and coastal defence policy lies with the Ministry ofAgriculture, Fisheries and Food (MAFF). This includes the administration of legislation, whichenables flood and coastal defence works to be carried out.The legislative framework is based onthe Coast Protection Act of 1949, the Land Drainage Acts of 1991 and 1994, and the EnvironmentAct of 1995. The Coast Protection Act was created for the protection of the coastline againsterosion from the sea, whilst the Lane Drainage Acts, the Water Resources Act and the EnvironmentAct provide the political framework for flood defence. MAFF provides national strategic guidanceand specialist help supported by a comprehensive research and development programme24. Avariety of authorities have powers for the implementation of flood and coastal defence policy andthe construction of defence works. These include local authorities, Internal Drainage Boards,private landowners, and the Environment Agency.The Environment Agency has a supervisory rolefor all aspects of flood defence in England and Wales, including flooding from the sea.The Agencyalso has permissive powers for establishing and maintaining sea defence works and flood defenceworks on watercourses designated as main rivers.The work of the Agency is discharged through anational network of Regional and Local Flood Defence Committees. Over 240 organisations havebeen involved in the administration, financing and delivery in the coastal zone24.Whilst individualflood and coastal defence works are designed, constructed and maintained by local operatingauthorities, MAFF may provide a substantial contribution to the funding of capital defence worksundertaken by the Environment Agency, local authorities or drainage boards.
According to the Agricultural Select Committee report on Flood and Coastal Defence25, there aresignificant gaps in the delivery of national policy priorities at the local level. This is due to thedisparate legislative framework for flood and coastal defence activities, and the patchy andinadequate coordination between operating authorities. This problem is now being addressedthrough coastal groups and the development of shoreline management plans. Such changes in theorganisation of responsibilities will need to be taken into account in future coastal flooding riskanalyses.
The nature and the current state of the sea defences
Due to the varied nature of the East Anglian coastline and the division of coastal protection andflood defence responsibilities, there exists a wide range of sea defence solutions. Over one-fifth ofthe region between the Humber and the Thames is below flood risk level26. Approximately 1500km of defences protect the region from tidal flooding. In agricultural and sparsely populated areasof South Humberside, Lincolnshire and parts of Norfolk and Suffolk, flood protection is generallyprovided by earth and stone banks, some of which have some form of seaward slope protection27.In low-lying, more populated areas with appreciable wave action, the sea defences include concretestepwork or concrete slabs on the seaward side of the bank, topped by a splash wall, which, by wavereflection, reduces overtopping of the structure. The Wash defences consist of banks fronted byextensive saltings, which under most conditions act to break the waves long before they reach thestructure. Reinforced concrete sea walls and associated groyne systems protect urban areas. Mostcliffed sections of the coast where there is development are protected with sea walls andrevetments. In some cases flood protection is provided by the maintenance or enhancement ofnatural features, such as the profiling of the shingle bank at Blakeney in Norfolk. Beachnourishment has also been done in several places along the East Coast. Most recently, shore-parallelbreakwaters have been constructed near Sea Palling and Caister in Norfolk.
168
The risk of flood damage to property, infrastructure, and human health will depend to a largeextent on the state of the sea defence systems in any given location.While major reinforcementand extension of the sea defence infrastructure was undertaken along the East Coast after thedevastating floods of 195326, many of these defences are reaching the end of their design life. Inmany parts of the East Coast, the defences are becoming increasingly vulnerable to wave damagedue to a lowering of fronting beaches. Estuarine embankments have often been built of indigenousmaterials not suitable for sea walls, such a peat, silt and weakly structured clays27.A further problemwith the construction of banks is the unconsolidated strata underlying the structures. Settlement isanother common problem, leading to fissuring and attrition on the side facing the water27. Thenational Sea Defence 1995 Survey Update, dealing with the condition of sea defences, 24 revealedthat in the Anglian Region, 36.3% (Phase 1; NRA maintained defences); 41.9% (Phase 2); LocalAuthority maintained defences); and just 3.4% (Phase 3); privately owned defence) sea defenceswere in good condition. The survey also showed that 12.2% (Phase 1) and 64.9% (Phase 3) seadefences in the Anglian region were in poor condition (i.e. that moderate work and maintenanceis required to return the defences to a good condition as originally built).A flood risk assessmentthat takes into account the state of the sea defences is now urgently needed and is necessary if thehealth risk from future storm surges is to be determined.
Present and likely future shoreline management planning approaches
Flood defence works carried out by the Environment Agency are funded by central taxationrevenues through a combination of Capital Grants and Revenue Support Grants (through localcouncils). All coastal defence schemes have to be justified by cost-benefit analysis. Due to everincreasing demands from local authorities for grant-in-aid, a priority scoring system for sea defenceschemes was introduced in April 199825. Every project proposal is screened against national criteriato determine the order of priority in which eligible projects will be funded by MAFF.The scoringprocedure is made on the basis of the priority, urgency and economics of the scheme proposed. Inkeeping with MAFF’s national strategic aim, projects based on flood warning, the provision ofurban coastal defences, and urban flood defences are given greatest priority.This system has beenheavily criticised because it is extremely difficult for any rural scheme to qualify for funding. Sitesof international environmental significance were given added weight under the revised priorityscoring system in 1999.The Select Committee25 found that at present there seems to be a shortageof finance for all but the most urgent of works and that operating authorities could maintain vitallocal flood and coastal defence programmes only with major difficulty.The Environment Agencyhas estimated that £1.3 billion will need to be spent on renovating sea and flood defence capitalworks over the next 10 years - this equates approximately to the current rate of spending. As aconsequence of the downward movement of the East Anglian region relative to the UK land massas a whole and the sea level rise caused by global warming, a relative sea level rise of 6mm per yearis taken into account in the crest heights of flood defences when they are renewed or replaced.
While such upgrading of sea defences will have to be carried out in urban areas, alternativeapproaches are being sought for agricultural coastal areas. Greater priority has recently been givento so-called soft engineering approaches to flood and coastal defence.The mitigation of erosionand flooding is achieved through increased reliance on natural features, such as beaches, mudflatsand flood plains. It has been recognised that the traditional hard engineering approach, based onsubstantial human intervention in the natural processes, often had adverse effects on the adjoiningcoastline, or on the site intended for protection itself, due to lack of understanding of the sedimenttransport mechanisms prevailing in the area. Soft engineering can replace reliance on the existing
169
ageing system of hard defences, but in most cases it is used to provide protection to the defencesalready in place. For example, on the Lincolnshire coast MAFF is investing approximately £120million over a 40-year period in the UK’s largest beach nourishment project25. One of the mostsignificant changes in coastal engineering in the last few years has been the introduction of offshorebreakwaters.The use of offshore breakwaters is considered a soft engineering approach because thestructures influence the wave-induced circulation near the coastline and encourage theaccumulation of beach material. Whilst breakwaters have been successfully used in shorelinestabilisation efforts, particularly in the USA, Japan and the Middle East, the work at Bognor Regis28
and Sea Palling29 indicates that the effect of these structures on the beach morphology is notcurrently fully understood for locations with the large tidal range and strong long-store drift typicalof much of the UK coastline. Further research is being carried out to establish design guidelinesfor UK schemes.
Since 1995, shoreline management practices in England and Wales have been guided by ShorelineManagement Plans (SMPs) to provide a more comprehensive and integrated approach to managingthe cost24. The primary aim of the SMP is to provide the framework for the development ofsustainable coastal defence policy for a particular stretch of coastline. SMPs are currently non-statutory and are the product of collaboration in coastal groups between maritime local authorities,statutory agencies and other organisations with coastal responsibilities. SMPs have been producedfor the entire English and Welsh coastlines and include environmental and other non-marketconsiderations in order to achieve environmentally sustainable solutions.As well as taking accountof local economic and development planning needs, the guidance offered in SMPs is based onprocesses occurring in coastal cells along the relevant section of coast.A recent review of the EastAnglian SMPs30, however, has revealed that there is still a substantial lack of knowledge regardingthese processes and the way in which they interact with sea defence measures.Although the coastalcells on which these plans are based are assumed to be discrete natural units within which sand andshingle-sized sediment is retained, detailed information on sediment transport pathways,particularly of fine sediments, within or between the cells, is often lacking.To provide an adequateassessment of the risk of coastal flooding, and thus the risk of flooding to human health, it isnecessary to qualify and, if possible, quantify the uncertainty introduced by this lack of information.
The three main options for shoreline management identified in the SMPs, are ‘managed retreat’,‘accommodation’, and ‘hold the line’.These options are currently being reassessed for the secondround of plans.
Assessment of past, present, and possible future adaptation strategies
As mentioned above, coastal defence and management policy and responsibilities are changing andsuch changes need to be incorporated in any coastal flood risk assessment. O’Riordan and Ward6
presented arguments in favour of a more participatory and mediated approach to consultation anddecision-making. In their opinion, a more integrated approach to shoreline management willfacilitate a workable consensus amongst the stakeholders and create an outcome which will becontinually reassessed.
Traditionally, there was a widespread perception that we have a duty to prevent land loss. Thisperception is slowly changing because of increased agricultural productivity per hectare and alessened need for domestic agricultural self-sufficiency24. These factors might in future beacknowledged in the implementation of local responses to flood defence and coastal protection of
170
agricultural land, including the managed realignment of the coastline. Such changes in perceptionwould, in turn, have important effects on the risk of coastal flooding. At present the managedabandonment of coastal areas, which are untenable in the long-term, is controversial because thereis no financial mechanism for the reimbursement of property holders and landowners whose assetsare sacrificed for the wider benefit of the community. Long-term adaptive policies that encouragemanaged retreat will have to be formulated.The Select Committee recommended that, in future,The Environment Agency should have powers to deter inappropriate development in flood plainland or require developers to set aside sufficient funds for the provision of flood defence worksbefore planning permission is granted.
4.6.7 Vulnerability
Population at risk
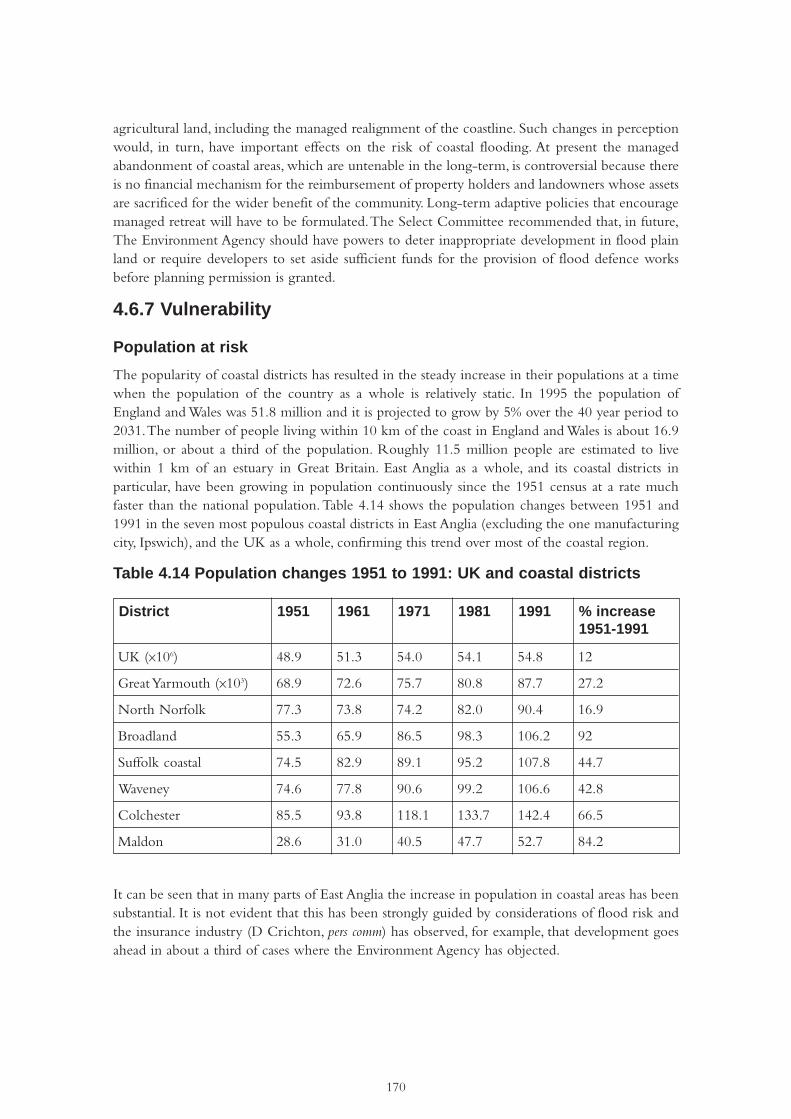
The popularity of coastal districts has resulted in the steady increase in their populations at a timewhen the population of the country as a whole is relatively static. In 1995 the population ofEngland and Wales was 51.8 million and it is projected to grow by 5% over the 40 year period to2031.The number of people living within 10 km of the coast in England and Wales is about 16.9million, or about a third of the population. Roughly 11.5 million people are estimated to livewithin 1 km of an estuary in Great Britain. East Anglia as a whole, and its coastal districts inparticular, have been growing in population continuously since the 1951 census at a rate muchfaster than the national population.Table 4.14 shows the population changes between 1951 and1991 in the seven most populous coastal districts in East Anglia (excluding the one manufacturingcity, Ipswich), and the UK as a whole, confirming this trend over most of the coastal region.
Table 4.14 Population changes 1951 to 1991: UK and coastal districts
It can be seen that in many parts of East Anglia the increase in population in coastal areas has beensubstantial. It is not evident that this has been strongly guided by considerations of flood risk andthe insurance industry (D Crichton, pers comm) has observed, for example, that development goesahead in about a third of cases where the Environment Agency has objected.
District 1951 1961 1971 1981 1991 % increase1951-1991
UK (x106) 48.9 51.3 54.0 54.1 54.8 12
Great Yarmouth (x103) 68.9 72.6 75.7 80.8 87.7 27.2
North Norfolk 77.3 73.8 74.2 82.0 90.4 16.9
Broadland 55.3 65.9 86.5 98.3 106.2 92
Suffolk coastal 74.5 82.9 89.1 95.2 107.8 44.7
Waveney 74.6 77.8 90.6 99.2 106.6 42.8
Colchester 85.5 93.8 118.1 133.7 142.4 66.5
Maldon 28.6 31.0 40.5 47.7 52.7 84.2
171
Building vulnerability
The vulnerability of buildings and their occupants to flood depends primarily on the height of theflood water in relation to the floor level of the house. Flood damage is worse if the water is fastflowing and if the flood water is sea water.Vulnerability estimates have been made for the UKbuilding stock31.
An important consideration affecting the likely number of casualties is that occupants of single-storey houses and mobile homes are much more likely to suffer loss and injury or death becausethey cannot escape or move their property to upper floors. Buildings built on piers to elevate themabove expected flood water would be safer for the expected flood, but may be more vulnerablethan conventionally founded buildings if higher flood waters occur. Census data unfortunatelyprovide little information on building types. Estimates have been made by CambridgeArchitectural Research Ltd based on regional data available on the distribution of building typesin an English house condition survey (1991).This suggests that a proportion of more vulnerablebuilding types - namely bungalows and mobile homes - in these coastal districts may besubstantially greater than the average in the population as a whole. Regionally, East Anglia has16.6% of bungalows in its urban dwelling stock compared with 6.9% for the south-east. It is notclear whether this proportion is changing with time or how far it applies to rural buildings also.In the East Coast floods in 1953, 65 deaths occurred when most of the bungalows betweenHunstanton and King’s Lynn were swept away2.
Sea coast defences
Although sea defences have been improved since 1953, sea-level rise and the expected greaterfrequency and severity of wind storms resulting from climate change will ensure that a high riskof catastrophic flooding remains in the coastal zone. In addition, many of the sea defencesestablished after 1953 are now reaching the end of their design lives. Concern about the presentflood and coastal defence infrastructure has been expressed by the House of Commons SelectCommittee on Agriculture in its Sixth Report (1998), which states25:
“... Flood and coastal defence policy cannot be sustained in the long-term if it continues to be founded onthe practice of substantial human intervention in the natural processes of flooding and erosion. Indeed, itis of great concern to us that the legacy of flooding and erosional problems arising from this practice - andthe likely increase in future of climatological and other environmental pressures on the UK’s ageing floodand coastal defence infrastructure - might combine to present flood and coastal defence authorities withinsuperable difficulties.”
Many of the ageing defences are being replace using alternative, ‘soft’, engineering schemes (forexample, beach re-charge or managed re-alignment).Very little is known about how these changesin coastal management affect natural processes in the coastal zone and thus how they affect thecharacteristics of possible future extreme flooding events.
The Environment Agency3 designs coastal defences to protect against a storm with a specified riskof recurrence, which is cost-effective and commensurate with current land use. Generally, there isgreater protection for urban areas than rural areas (Table 4.15).
172
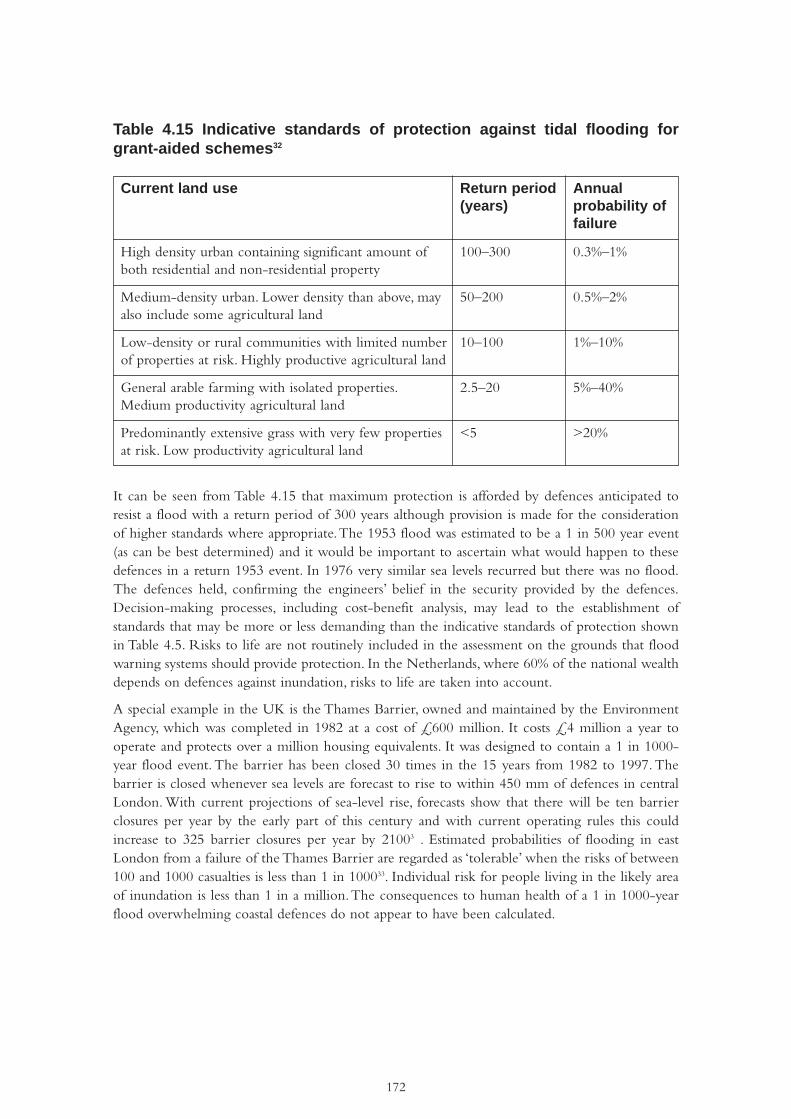
Table 4.15 Indicative standards of protection against tidal flooding forgrant-aided schemes32
It can be seen from Table 4.15 that maximum protection is afforded by defences anticipated toresist a flood with a return period of 300 years although provision is made for the considerationof higher standards where appropriate.The 1953 flood was estimated to be a 1 in 500 year event(as can be best determined) and it would be important to ascertain what would happen to thesedefences in a return 1953 event. In 1976 very similar sea levels recurred but there was no flood.The defences held, confirming the engineers’ belief in the security provided by the defences.Decision-making processes, including cost-benefit analysis, may lead to the establishment ofstandards that may be more or less demanding than the indicative standards of protection shownin Table 4.5. Risks to life are not routinely included in the assessment on the grounds that floodwarning systems should provide protection. In the Netherlands, where 60% of the national wealthdepends on defences against inundation, risks to life are taken into account.
A special example in the UK is the Thames Barrier, owned and maintained by the EnvironmentAgency, which was completed in 1982 at a cost of £600 million. It costs £4 million a year tooperate and protects over a million housing equivalents. It was designed to contain a 1 in 1000-year flood event. The barrier has been closed 30 times in the 15 years from 1982 to 1997. Thebarrier is closed whenever sea levels are forecast to rise to within 450 mm of defences in centralLondon. With current projections of sea-level rise, forecasts show that there will be ten barrierclosures per year by the early part of this century and with current operating rules this couldincrease to 325 barrier closures per year by 21003 . Estimated probabilities of flooding in eastLondon from a failure of the Thames Barrier are regarded as ‘tolerable’ when the risks of between100 and 1000 casualties is less than 1 in 100033. Individual risk for people living in the likely areaof inundation is less than 1 in a million.The consequences to human health of a 1 in 1000-yearflood overwhelming coastal defences do not appear to have been calculated.
Current land use Return period(years)
Annualprobability offailure
High density urban containing significant amount ofboth residential and non-residential property
100–300
50–200
10–100
2.5–20
<5
0.3%–1%
0.5%–2%
1%–10%
5%–40%
>20%
Medium-density urban. Lower density than above, mayalso include some agricultural land
Low-density or rural communities with limited numberof properties at risk. Highly productive agricultural land
General arable farming with isolated properties.Medium productivity agricultural land
Predominantly extensive grass with very few propertiesat risk. Low productivity agricultural land
173
Infrastructure
Studies of flood and storm surge casualties in other countries indicate that the failure of power, theperformance of the transportation infrastructure, and the maintenance of relief and rescue facilitiesare critical to minimising casualties and dealing with injuries. For the most at-risk coastal locations,detailed studies are needed of the infrastructure (roads, railways, airports, power transmission,telecommunications) and its propensity to be damaged, of the risk to emergency services (firebrigade, ambulance,A & E departments in hospitals, police) and their location and viability, and theexistence of places of safety within each local community. It is not generally appreciated that theeast coast floods in 1953 occurred against a backdrop of post-war Britain,when there were 500,000servicemen available for rescue work, together with military logistic tools such as landing craft,which were immediately put into the disaster response and would have undoubtedly made a largeimpact on the rescue capability of that time. None of this would be available in the present dayand it is not evident that the emergency services have drawn up emergency plans for respondingto a catastrophic coastal flood. Current initiatives by the Environment Agency are encouraging thedevelopment of such emergency plans by all potentially affected local authorities.
Forecasts and warnings
Coastal high water levels are predicted by a model used by the Met Office in Bracknell, which hasbeen constantly updated since it was first devised following the floods in 1953.The predictions forEast Anglia are normally very good and well validated to within 10-20 mm.The model was devisedand is updated by the Proudman Oceanographic Laboratory.The Environment Agency has for thelast three years been the central government body responsible for issuing warnings based upon itsuse. The Agency goes into flood warning mode from September to May, when wide-scaleforecasting is performed every 6 hours.The model can also be used to model synthetic sea levelsfor exceedence levels for sea coast defences.The model does not take into account changes in sealevel and increases in storminess caused by climate change. Local models exist, for example for theThames Barrier, which include river flows. Commensurate with developments in forecasts andwarnings would be the designation of risk zones for populations depending upon theirsusceptibility to flooding - the hazard maps on which such zones could be drawn by theEnvironment Agency will soon be available to the public.
Community preparedness
The extent to which most communities at risk are aware of the flooding hazard (through forexample, warning sources such as radio or TV), and are knowledgeable about evacuation measuresis limited. The Environment Agency launched a new awareness campaign in October 1999. Aspecial study would be needed for the risk assessment on the details of operation of the warningsystem, including lead times and criteria for evacuation of areas at risk. Details of flood warningplans for each area are available from the Environment Agency.

174
4.6.8 Human health consequences of floods
Floods and health
The impact of a coastal flooding event will depend upon the behaviour of the flow of water, itsvelocity and depth. In addition, wintry weather will greatly increase the risk of deaths fromexposure. After the East Coast floods there was a reported increase in mortality in the floodedcommunity in the three months and the year after the flood1,2. In the Netherlands flood of 1February 1953, resulting from the breach of a polder, extensive areas of the country were affectedand 1795 people died, mainly by drowning. Six medical problems were identified after the flood:
❏ identifying and recovering corpses;
❏ evacuating the sick and old;
❏ providing physicians with routine supplies;
❏ setting up emergency hospitals to take care of the evacuated;
❏ restoring hygienic services (food, water, sanitation); and
❏ taking measures to fight epidemics.
It was explicitly stated that the injured, as a group, did not represent a medical problem.The ageand sex specific mortality of those killed in the flood was estimated and a three- to four-foldgreater risk of death in the elderly was found34,35.
In the Bristol, England, flood on 10/11 July 1968, 13 cm of rain fell on the city of Bristol between5 am and 5 pm. About 3000 houses, shops and other buildings were flooded. The peak of therainfall coincided with a high spring tide, which blocked the outflow into the river Avon. Thewater level reached no higher than the ceilings of the ground floor and subsided in most cases afterabout 10 hours. One man was drowned in the flood. Of great interest is the effect this eventappears to have had on subsequent mortality and morbidity34,35. In the 12-month period after theflood the surgery attendance of the flooded population for whom records were available increasedby 53% (males 81%, females 25%), although the total number of people attending did not changesubstantially - the non-flooded group showed a slight fall in attendance.The difference betweenthe attendance of flooded and non-flooded men was statistically significant, as was the differencein attendance within the flooded group for the period before and after the flood.The increase inattendance by women was not significant. Hospital referrals from the flooded group more thandoubled during the year after the flood. This was again accounted for mainly by men. Hospitaladmissions showed the same trend. The reasons for illness were non-specific and no diagnosissuggested any direct physical relationship with the flood.
Mortality rates were also calculated for all homes in the city and in the county of Bristol whichhad been flooded, as well as those which had not been flooded. Surprisingly, mortality in theflooded group increased by 50%, mainly in the three-month period after the flood. The mostpronounced rise was in the age group 45-64, for both male and female deaths, otherwise theincreases were predominantly amongst those over 65, especially women over age 75. For the restof non-flooded Bristol deaths fell by 1%. Again no specific cause of death could be linked to theflooding and the increase was provisionally explained in terms of the psychological effects of theflooding. A similar pattern to mortality was observed in Canvey Island after the floods in 19532,3.Remarkably, this type of analysis does not appear to have been repeated in subsequent flood events.
175
On a world scale, floods present a major natural hazard34,36. For example, in flood-prone Bangladesh,approximately 15 000 people are killed each year on average due to flood disasters. Among allnatural disasters in the USA, floods are the main cause of death.Two thirds of the 6000 disastrousevents on record in the 1990s relate to floods and flood-generating storms. In the USA, with morethan 20 000 cities and communities subject to flash flooding alone, the average annual loss of lifedue to floods has been estimated at between 48 and 146 deaths. Notable floods occur in thePeople’s Republic of China where more than 40 million inhabitants are estimated to be affectedyearly by flood. Malilay37 has reviewed the literature, which shows continuing differential levels ofmortality associated with individual flood events in various areas of the world, and moreinvestigation is needed of the factors that contribute to flood-related deaths, illnesses and injuries.Surprisingly little information has been gathered that provides the level of insight given by thestudies of the East Coast flood in 1953 and the Bristol flood in 1968. In most events, however, thespectre of major epidemics of infectious diseases due to disruption of water purification and waste-water disposal systems does not appear to be realised through increases in endemic diseases such asmalaria and cholera in tropical areas. Large numbers of casualties with multiple injuries also do notseem to be a major problem. Releases of toxic substances in floods from hazardous chemical sitesis a potential hazard.The mental health effects of flood disasters have been studied, but more workon the long-term impacts on morbidity and mortality are warranted.
In summary, the main anticipated impact on humans of an East Coast flood would be deaths bydrowning, followed by deaths from exposure, which would occur in the phase of the disasterstriking. Some deaths would arise subsequently from delays in search and rescue, which would beinevitable with a large part of the country under water. Large numbers of injured requiring rapidtransfer do not appear to be an issue for the emergency services, though this may be a falseimpression created by the delays in rescue in severe flooding events when access to survivors in thefirst few hours after the event is impossible (so trauma victims die from lack of urgent attention).Clearly, the time of day would be very important in terms of both the size of impact and access tosurvivors (flooding at night is much more hazardous). Further increases in mortality and morbidityamongst survivors would occur in those who require regular primary care treatment, such as accessto insulin in diabetes sufferers, and other key maintenance medication in the chronic sick. For thissub-group of the population, including the elderly, expeditious removal from flooded areas to safehavens would be important. Provision of food and potable water and first aid to those largenumbers of people trapped in the flooded area, but otherwise unharmed, would be an immediateneed in the post-impact phase. Acute and longer-term mental health issues amongst survivorswould need to be addressed, as after other major disasters.The long-term impacts on morbidityand mortality as revealed by the Bristol flood study and the reporting after the East Coast floodsin 1953 show that illness and deaths may rise in non-specific ways. A ‘culling’ effect may behappening here, i.e. a hastening of death in those predisposed to die by underlying illness.
Risk scenarios
Hazard maps for coastal flooding are being used to produce risk maps delineating the populationat risk. Refined versions of risks maps should utilise the hazard areas of flood impact, and shouldinclude zones of graduated risk of death and injury.
Risk = hazard (probability of event) x value x vulnerability
176
‘Value’ in this equation could be the number of people at risk, with ‘vulnerability’ as the proportionof the population at risk, or most exposed, for a variety of reasons, to the flood impact (Section4.6.7). Establishing risk requires first of all an understanding of the most foreseeable floodscenarios. Some work on this is now in progress in the Environment Agency, with the aim ofproviding a standardised approach across the country.The worst scenario would be a flood in theabsence of any coastal defences and the Agency has performed a mapping exercise based on howfar the water would travel until the sea level equated with the land level.These so-called IndicativeFlood Plain Maps have now been generally released.The maps will be essential for estimating thetotal population at risk for disaster planning purposes. For assessing the risk in a reasonablyforeseeable flooding event a study of a dam break analogue with modelling of the consequentgravity current of water would be needed.
A reasonably foreseeable scenario for East Coast floods would be the breach of a section of thecoastal defences, or possibly a small number of breaches, during a storm/tide event comparable to1953.A breach could be for example, 50 m or 100 m wide, taking three days or 10 days respectivelyto repair. From the Humber to the Wash and around the Norfolk and Suffolk coasts the populationis dependent upon a wall of sea defences of variable strength: a failure in an extreme weather eventcould lead to even a small breach which could have devastating consequences.The developmentof a flood scenario under these circumstances is possibly politically difficult for the EnvironmentAgency and here research by independent workers would be invaluable in order to increase ourunderstanding of the impacts such an event would have on settlements and human health.
4.6.9 Mitigation measures A key factor in any analysis of risk is the extent to which society may take steps to protect itselfagainst the impact of climate change.The implications of these for risk also need to be studied indepth. Specific areas for mitigation strategies are described below.
Forecasts and warnings
Forecasts and warnings of flood hazard to the population have been the responsibility of theEnvironment Agency for the last three years. The Storm Tide Forecasting Service (Met Office)predicts height of tides, taking account of surge activity, and the Environment Agency determines,in accordance with pre-set criteria, the threshold of a combination of tide, wind speed and winddirection which if exceeded would trigger a six-hour warning before high water.Warnings go outthrough various routes and emergency services are put on alert. Flood wardens alert those in theareas they are designated to cover.The warning service is tailored to particular circumstances andthe degree of risk - warning systems range from individual telephone alerts to general radioannouncements. Only certain high-risk areas with relatively frequent flooding have siren warningsystems. Many thousands of other people live in areas where they are probably quite unaware thatthey could be impacted by a major coastal flood.The current indicative flood plan areas are basedon combinations of historical records, computer modelling and expert judgement.
The decision to evacuate settlements would be taken by the Police Technical Group, responsiblefor major incident planning in conjunction with county and borough councils.The understandingof the population for disaster planning, and the feasibility of the measures to evacuate people fromareas of risk, needs to be further evaluated.
177
Engineering measures
The sea defences are a combination of hard (concrete) and soft (e.g. sand dunes) ‘barriers’ (seeabove).The Environment Agency has compiled a directory of sea defences and it is possible thatsome parts may fall short of the indicative criteria laid down for them. Strengthening of theweakened parts of the defences is an ongoing process. Predicting sudden failure does not appeareasy and so predictions may not be routinely performed. Repairs of the sea defences do take intoaccount sea-level rise. The engineering issues involved in raising defences to combat rising sealevels needs to be further explored in terms of overall safety and risk, as well as cost. DEFRAprovides funds for approved capital works which, nevertheless, are a local responsibility.
Further work is needed on whether hardening of houses in some way in those areas most at riskwould be beneficial. Bungalows and trailers or caravans would be most at risk in a flood, asmentioned above.
Land use planning
Already, local planning departments give consent to about a third of the developments against theadvice of the Environment Agency. The population increase in coastal districts over the last fivedecades has been between 50-100% and the trend seems likely to continue. This demographicchange would be a key factor in any risk assessment. In the future the insurance industry mightplay a key part by refusing to provide cover to developments not recommended by theEnvironment Agency.
Community preparedness
Providing adequate public information on the flood risk is overdue.The Environment Agency rana public awareness campaign in October 1999 and this was repeated in 2000 and may help toimprove matters, but to date planning for flood emergency has been low key. For example, thehealth sector has not been drawn into a comprehensive disaster planning process. Emergencyplanning needs to be at the national, regional and local level with agreement on the worstreasonably foreseeable scenarios, as well as others which can be prepared for. The EnvironmentAgency is required to operate a programme of flooding incident exercises with other operatingauthorities. Undoubtedly much more work on the vulnerability of housing and the delineation offlood risk areas has been undertaken in the private sector, e.g. by insurance companies, than isavailable to researchers outside the industry.
Probabilities of extreme flooding events
Natural hazards such as sea surges are subject to non-linear behaviour, but a recent study ofextreme event statistics has concluded that the forecasting is still best done by a combination ofprobability statistics and numerical modelling based on the monitoring of past events (Julian Hunt,pers comm). The Health and Safety Executive has used the Thames Barrier example in itspublications on quantified risk assessment and tolerability of risk33. Individual and societal risks havebeen estimated using the annual probability of it being overcome by a tidal surge (1:1000), asdefined by its designed failure rate, and the population at risk of inundation should it fail.We mayuse the indicative criterion for the sea defences in the same way, but they are not, for probabilitypurposes, a single structure.Thus, the probability of inundation anywhere along the sea defences willdepend upon how well-correlated the impacts of a single surge event will be (i.e., whether all oronly parts of the coast will be affected by the same event), and so it is likely that the annual risk of
178
a group of people being drowned as a result of a breach somewhere along the defences will bepotentially higher than 1:200.An important additional consideration is the weakened state of thepresent defences as described above, which may add to the risk. A key question in any discussionof probability is what would happen in a very large event (greater than 1:1000 for the ThamesBarrier, or the 1:1000 event breaching the sea defences), when the loss of life could possibly bevery large indeed.An increase in storminess would make failure more likely, especially if the typesof storms change, by increasing wave and surge heights and damage to defences in an extremeevent. The 1 in 200 criterion (at best) seems inadequate, especially when the Thames Barrier isengineered to a 1 in 1000 year event, and further review of this figure and its basis is needed forrisk assessment purposes. These considerations do not appear to have been well debated in thepublic domain, but are essential for exploring the human consequences of floods.
The potential for mitigation in such a flooding event is high through further development of thewarning system and community preparedness. Timely evacuation would be the key measure toreduce risk, but it is not evident that a detailed risk assessment and an analysis of risk reductionmeasures has been undertaken. The Environment Agency is doing important work on disasterplanning, but this is not yet in the public domain.
4.6.10 Risk assessment: Summary of the direct and indirectimpacts on human health to be consideredA risk assessment would need to be based on a 1953-type flood model. It would need toincorporate mitigation measures and use scenario modelling of a sea surge and a flow of waterfollowing a sudden breach of the sea defences. One or more study areas could be chosen toevaluate the impact of flooding in different types of urban areas.The probability of such an extremeevent along the East Coast is stated to be 1 in 100 to 1 in 200 years, but this return period coulddecrease by an order of magnitude with the prospect of rising sea level and increased storminess.The following impacts would need to be evaluated further.
❏ Impact phase. Death by drowning and exposure. Potentially hundreds to several thousands ofpeople in the event of a breach, or several breaches, of the sea defence wall.
❏ Immediate post impact phase. Deaths of injured or sick and aged individuals unable to obtainfirst aid, or primary care or treatment in hospital during the ‘golden hours’. Perhaps as manyas 10% of the overall mortality figure.
❏ Recovery phase. Subsequent increase in morbidity (hospital referrals and hospital admissions)and non-specific mortality in the flooded group in the months after.
❏ Recovery phase and subsequent mental health sequelae. Mental health problems are likely tobe significant in survivors of a major event, but only a small proportion are likely to be severelyaffected by post-traumatic stress disorder or anxiety/depression as a result of the incident.Non-specific psychological syndromes may appear, but are unpredictable.
❏ Other causes of ill health.The risk of infections arising from floods in the UK appears to bequite low. Other hazards include the threat of toxic substances entering the flood water andadding to the health impact. Multiple disasters, e.g. floods causing train derailment, planecrashes at airports, chemical releases from factories in the line of the flood, will need to beconsidered as part of an overall risk assessment.
179
4.6.11 Conclusions and recommendationsCoastal and river flooding present some of the most serious natural hazards that the UK faces.Thischapter has focused on East Coast flooding risk, which is undoubtedly the most hazardous extremetype of flooding event.The effects of global warming are likely to make the return time of suchan event shorter and its impact more destructive.
Any estimate of the impact of an extreme East Coast event on human health will depend upon arisk assessment being performed which will take into account the hazard (sea surge, waves andtide), the probability of forcing events and their return times, the vulnerability of sea defences andthe efficacy of mitigation measures, as discussed above.The Environment Agency and the insuranceindustry have already done much work on these issues, but this does not appear to be in the publicdomain.
The social, structural, infrastructural, economic and human vulnerability to a catastrophic EastCoast flood needs to be evaluated by an interdisciplinary modelling study of a sea defence failureand the flow of flood water into one or more representative urban areas, work which is still at theresearch stage.
This preliminary work on human consequences of coastal flooding has highlighted a seriousnatural hazard to a substantial proportion of the UK population, even in the absence of climatechange effects.There is a need to review urgently the adequacy of the existing disaster reductionmeasures and bring the risk issues involved into the public domain.
Acknowledgements
We thank M. Hulme, R. Nicholls, S.Tapsell,T.Wilson, D. Crichton and M. McKenzie-Hedger fortheir assistance in the preparation of this chapter.
180
4.6.12 References1. Greave H.The Great Flood. Essex County Council, 1956.
2. Summers D.The East Coast floods. London: David & Charles, 1978.
3. Environment Agency.The state of the environment in England and Wales: coasts. London:TheStationery Office, 1999.
4. Hulme M, Briffa KR, Jones PD, Senior CA. Validation of GCM control simulations usingindices of daily airflow types over the British Isles. Climate Dynamics 1993; 9:95-105.
5. Flather RA.A numerical model investigation of the storm surge of 31 January and 1 February1953 in the North Sea. Q J Roy Meteorol Soc 1984; 110:591-612.
6. O’Riordan T, Ward R. Building trust in shoreline management: creating participatoryconsultation in shoreline management plans. Land Use Policy 1997; 14:257-276.
7. Carretero JC, Gomez M, Lozano I, deElvira AR, Serrano O, Iden K, Reisted M, Reichardt H,Kharin V, Stolley M, von Storch H, Gunther H, Pfizenmayer A, Rosenthal W, Stawarz M,Schmith T, Kaas E, Li T,Alexandersson H, Beersma J, Bouws E, Komen G, Rider K, Flather R,Smith J, Bijl W, deRonde J, Mietus M, Bauer E, Schmidt H, Langenberg H. Changing wavesand storms in the northeast Atlantic? Bull Am Meteorol Soc 1999; 79:741-760.
8. Carter DJT, Draper L. Has the north-east Atlantic become rougher? Nature 1988; 332:494.
9. Bacon S, Carter DJT. A connection between mean wave height and atmospheric pressuregradient in the north Atlantic. Int J Climatol 1993; 13:423-436.
10. Gulev SK, Hasse L. Changes of wind waves in the North Atlantic over the last 30 years. Int JClimatol 1999; 19:1091-1117.
11. Schinke H. Zum auftreten von zyklonen mit niedrigen kerndrfcken im Atlantisch-europaischen raum von 1930 bis 1991.Wissenschaften zeitschriftder Humboldt-Universitat zuBerlin, R. Mathematik/Naturwissen 1992; 41:17-28
12. Schmidt H, von Storch H. German Bight storms analysed. Nature 1993; 365: 791.
13. Kaas E, Li T-S, Schmith T. Statistical hindcast of wind climatology in the North Atlantic andnorthwestern European region. Climate Dynamics 1996; 7:97-110.
14. Schmith T, Kaas E, Li T-S. Northeast Atlantic storminess 1874-1995 reanalysed. ClimateDynamics 1998; 14:529-536.
15. Carnell RE, Senior CA, Mitchell JFB. An assessment of measures of storminess: simulatedchanges in Northern Hemisphere winter due to increasing CO2. Climate Dynamics 1996;12:467-476
16. Orford JD, Wheeler AJ, McCloskey JM, Dardis O, Doherty J, Gallagher KA. Variations inclimate forcing of coastal processes and the coastal response along the European Atlanticshoreline. Final Report, EU Environmental Programme - Phase II,‘Climate change and coastalevolution in Europe’ EV5V-CT94-0455. 1996.
17. Woodworth PL, Tsimplis MN, Flather RA, Shennan I. A review of the trends observed inBritish Isles mean sea level data measured by tide gauges. Geophys J Int 1999; 136:651-670.
18. Huthnance JM. Physical oceanography of the North Sea. Ocean Shoreline Manage 1991;16:199-231.
19. Suthons CT. Frequency of occurrence of abnormally high sea levels on the East and SouthCoast of England. Proc Inst Civil Engin 1963; 25:433-449.
181
20. Steers JA, Bayliss-Smith TP, Stoddart DR, Spencer T, Durbridge PM.The storm surge of 11January 1978 on the east coast of England. Geographical J 1979; 145:192-205.
21. Horner RW. Current proposals for the Thames barrier and the organization of theinvestigation. Phil Trans Royal Soc London A 1972; 272:179-185.
22. Shennan I,Woodworth PL. A comparison of late Holocene and twentieth-century sea-leveltrends from the UK and North Sea region. Geophysical J Int 1992; 109:96-105.
23. Woodworth PL. A search for accelerations in records of European mean sea level. Int JClimatol 1990; 10:129-143.
24. Environment Agency. National Sea Defence Survey Pp date 1995. Summary Report, Bristol:Environment Agency 1995.
25. The Stationery Office. Sixth Agricultural Select Committee report on flood and coastaldefence. London:The Stationery Office, 1998.
26. National Rivers Authority. Shoreline management: the Anglian perspective. In:The Future ofShoreline Management Conference Papers. Wiltshire/Ipswich: Sir William Halcrow andPartners and the National Rivers Authority Anglia Region, 1991.
27. Taylor HR, Marsden AE. Some sea-defence works in Eastern England. In: Shorelineprotection. London:Thomas Telford Ltd, 1983; 133-144.
28. King DM, Morfett JC, Pope DJ, Cooper NJ. A detached breakwater scheme: sedimenttransport and beach profile development at Elmer, West Sussex. Brighton; University ofBrighton, 1996.
29. Thomalla F. Happisburg to Winterton sea defences: effects of shore-parallel breakwaters onbeach morphology. PhD Thesis 1999. Norwich; School of Environmental Sciences, Universityof East Anglia, 1990.
30. Spencer T, Moller I. Review of Anglian SMP further study recommendations. ExecutiveSummary and Final Report (Environment Agency contract 000143321). Anglia Region;Environment Agency, 1998.
31. N’Jai A, Tapsell SM, Taylor D, Thompson PM, Witts RC, Parker DJ, Penning-Rowsell EC.Flood loss assessment report. London: Middlesex Flood Hazard Research Centre, MiddlesexUniversity, 1991.
32. MAFF. Flood and coastal defence project appraisal guide - economic appraisal (FCDPAG3).London: Ministry of Agriculture, Fisheries and Food, 1999.
33. Health and Safety Executive. Quantified risk assessment: input to decision-making. London:HMSO, 1989.
34. Baesjou. Problems of medicine during and after the flood in the Netherlands.Wld Med J 1955;2: 351-353.
35. Bennet G. Bristol flood 1968 - controlled survey of effects on health of a local communitydisaster. BMJ 1970; 3:454-458.
36. Seaman J. Epidemiology of natural disasters. Basel: Karger, 1984.
37. Malilay J. Floods. In: Noji EK, editor.The public health consequences of disasters. New York:Oxford University Press, 1997
38. Spencer T. Coral reefs and global climate change: thresholds, variability and uncertainty. CurrTop Biogoechem. 2000; in press.