48. variations in sediment physical properties and
TRANSCRIPT

Robertson, A.H.F., Emeis, K.-C., Richter, C., and Camerlenghi, A. (Eds.), 1998Proceedings of the Ocean Drilling Program, Scientific Results, Vol. 160
48. VARIATIONS IN SEDIMENT PHYSICAL PROPERTIES AND PERMEABILITYOF MUD-VOLCANO DEPOSITS FROM NAPOLI DOME AND ADJACENT MUD VOLCANOES1
Achim Kopf,2 M. Ben Clennell,3 and Angelo Camerlenghi4
ABSTRACT
Active mud volcanoes on the Mediterranean Ridge accretionary prism were sampled during Bannock Cruises 88 and 89 andOcean Drilling Program Leg 160. Permeability tests on undisturbed whole-round samples from Napoli dome (Site 971) using aback-pressured system at effective stresses that ranged from 200 to 700 kPa revealed low hydraulic conductivities of the clay-rich, undisturbed “mud breccias,” which ranged from 5 × 10⁻⁸ to 5 × 10⁻⁹ mm/s. In general, conductivities of sediments fromthe footwall, flank, and crest of Napoli dome dropped to half their value when the load was incrementally increased from 500up to 700 kPa. Pore volume, initially 50%−55%, was reduced to around 25% after multiple incremental loading between thepermeability tests. Experiments on remolded mud breccia from Napoli dome (Site 971) and adjacent mud volcanoes using ageotechnical shear box as well as a Vane apparatus revealed peak shear strengths of 200−400 kPa. Plasticity indices also varysignificantly for the mud-volcano deposits (i.e., from 25% to >40%), presumably because of variations in the composition andamount of the clay fraction. The friction angles obtained with shear tests indicate that montmorillonites (φ′ peak = 10°−15°)and fine grained carbonates (φ′ peak 27°−30°) are the two dominant mineral phases in the matrix. By comparison, hemipelagicsediments (calcareous ooze) show plasticity indices of <20% and shear strengths of >600 kPa with friction angles around 30°.
The driving force of the Mediterranean Ridge mud volcanism is believed to relate to regional tectonic compression resultingfrom collision of the African and Eurasian plates. The properties of the evaporitic overburden, as well as the degree of overpres-suring of mud at some depth, are thought to primarily control the activity. Phases of hemipelagic “background” sedimentation,as indicated by interfingering patterns with mud breccia, are accompanied by a build-up of pressure at depth until the subsurfi-cial, clay-rich muds are forced to extrude again. Low permeabilities, together with the grain-size variation (and indirectly vis-cosity) of the mud breccias, are considered to have a secondary effect on the episodicity in mud-volcanic activity on theMediterranean Ridge, resulting from blocking vents.
in me s
die rf
se
modtivf te
dget al.,pres-plexctedditer- and
edi-ean al.,Fig.sectagicig. 2).ort-
d in-996;d themi-
gestsemi-m atted
ane of gas vol-in theBur-er ex-uan-
23sch
Kin
INTRODUCTION AND GEOLOGICAL SETTING
Mud volcanism in subduction zones is a well-known phenome-non, described from the Barbados accretionary wedge (Brown andWestbrook, 1988; Henry et al., 1990), Makran (Fowler et al., 1985;Barber et al., 1986), Sumba (Breen et al., 1986), and Costa Rica(Shipley et al., 1990). The mechanisms of mud volcanoes formationare strongly dependent on the consolidation and saturation conditionsof fine-grained sediments at depth. Brown (1990) proposed a modelof the evolution of such sediments’ state of consolidation, followa specific stress path that eventually leads to the formation ofvolcanoes and sedimentary diatremes, after gas expansion in thspaces. The model was merely theoretical and based on the obtion of the distribution of the scaly fabric on exposed fossil mudpirs. An attempt made by Camerlenghi et al. (1995) to evaluatconsolidation path of mud-volcano sediments was based on sumud-volcano sediments, lacking the essential control of the ments’ characteristics with depth.
The collection and analysis of new data from boreholes in volcanoes is therefore essential to further development of the mthat explain the mechanisms and time scale of mud volcanic acIn particular, an explanation is needed for the unlithified state omud in spite of the considerable burial depth within or beneath thcretionary prism (e.g., Schulz et al., 1997).
1Robertson, A.H.F., Emeis, K.-C., Richter, C., and Camerlenghi, A. (Eds.), 1998.Proc. ODP, Sci. Results, 160: College Station, TX (Ocean Drilling Program).
2 Geologisches Institut, Albert-Ludwigs-Universität Freiburg, Albertstrasse 79104 Freiburg, Federal Republic of Germany. (Present address: GEOMAR, Wistrasse 1-3, 24148 Kiel, Federal Republic of Germany.) [email protected]
3Department of Earth Sciences, University of Leeds, Leeds LS2 9JT, United dom.
4Osservatorio Geofisico Sperimentale, P.O. Box 2011, 34016 Trieste, Italy.
gudporeerva-a-theacedi-
udels
ity.heac-
Mud volcanism and mud diapirism on the Mediterranean Riaccretionary complex were discovered in the eighties (Cita e1981 and 1989; Camerlenghi et al., 1992) and related to the comsional tectonics of the Mediterranean Ridge accretionary com(e.g., Camerlenghi et al., 1995). Geophysical data recently collesuggest that mud volcanoes are widespread on most of the Meranean Ridge and that individual mud domes vary greatly in scalesize (e.g., Cronin et al., 1997; see Fig. 1).
Two contrasting mud domes on the northern margin of the Mterranean Ridge accretionary complex were drilled during OcDrilling Program (ODP) Leg 160 (Emeis, Robertson, Richter, et1996). At both the apparently dormant Milano dome (Site 970; 1) and the currently active Napoli dome (Site 971; Fig. 1), a tranof holes was drilled from the adjacent clayey silts and hemipeloozes, across the flanks, to the crestal area of the structures (FThe dominant sediment types are variably clast-rich, matrix-supped muds characterized by very poor sorting with interbedded anterfingering hemipelagic sediments (Fig. 3; Robertson et al., 1Flecker and Kopf, 1996). The layered nature of the sediments anvertical and lateral gradational changes from “mud breccia” to hepelagic oozes, associated with mud-debris flows, strongly sugtheir extrusive origin. Biostratigraphic ages of the interbedded hpelagic deposits indicate that mud volcanism at Milano dates froleast 1.5−1.75 Ma, whereas the Napoli mud volcano was initiamore than 1.25−1.5 Ma (Fig. 2).
Geochemical studies show evidence of upward flow of methand higher hydrocarbon gases and also suggest the presencehydrates in the crestal areas of both the Milano and Napoli mudcanoes (see Emeis, Robertson, Richter, et al., 1996). Clasts withmud breccia are predominantly calcilutites, pelagic carbonates (digalian–Langhian age and younger), litharenites, and, to a lesstent, solid halite of postulated Messinian age. However, a small q
B,of-
g-
625

A. KOPF, M.B. CLENNELL, A. CAMERLENGHI
Gelendzhik
Prometheus 2
Nezhinka
MoscowMaidstone
Toronto
Napoli (971)
Milano (970)
Hilo
Monza
Jaen
Leipzig
Milford Haven
Stvor
33˚ 50'
24˚50'24˚40'24˚30'24˚20'24˚10'
24˚50'24˚40'24˚30'24˚20'24˚10'
33˚ 50'
33˚ 40'
33˚ 30'
The Olimpi Field
33˚ 40'
33˚ 30'
30°N
32°
34°
36°
38°
40°
42°
36°32°28°20°12°E
16° 24°
970971
-1000
-2000
-3000
IonianBasin
LevantineBasin
Cyprus
Africa
Greece
Italy
Aegean Sea
Crete
Mediterranean Ridge
line
of s
ectio
n
Turkey
NN
E
SSW
BergamoProcida
Figure 1. Outline map of the Eastern Mediterranean showing the location of the Milano mud volcano (Site 970) and Napoli mud volcano (Site 971) on the Med-iterranean Ridge, which was drilled during Leg 160 (Emeis, Robertson, Richter, et al., 1996). The roughly north-south–oriented line across the accretionarywedge is where the sketch of the cross section (Fig. 9) is placed. The enlarged area shows the Olimpi mud-volcano field (after Kopf et al., in press).
tity of fibrous calcite (thought to have precipitated from methane-derived fluid expulsion; e.g., Kopf et al., 1995) was also found. Theearly Miocene age of some of the clasts suggests that the source ofunconsolidated muds is presumed to be somewhere beneath a layerof Messinian evaporites.
During cruises of the Bannock in 1988 and 1989, gravity coreswere recovered from Napoli, Monza, and Hilo mud domes (for loca-tion see Fig. 1, upper right corner; Cita et al., 1989). On the Napoliand Monza volcanoes, typical mud breccias are overlain by a thinhemipelagic sediment cover both at the top and on several slope sites.In addition, in a basin beside Napoli dome, the transition from mud-volcano deposits to hemipelagic sediment exists (transitional sedi-ments are referred to as mixed sediment). From the crest of the Hilomud dome, layered successions of nannofossil ooze and sapropelswere recovered. None of the cores exceeds 5 m in length.
Purpose of the Study and Previous Work
In order to understand the mechanisms and timing of mud volca-nic activity in relation to the tectonic evolution of the MediterraneanRidge, different geotechnical approaches were used. This seemedparticularly important as an explanation is needed for the unlithifiedstate of the mud, although there is evidence for considerable burialdepth for several million years within or beneath the accretionaryprism (e.g., Schulz et al., 1997).
Previous investigators evaluated sediment physical properties(i.e., water content, density), shear strength, and permeability of soiland sediment (Casagrande, 1936, 1948; Bjerrum, 1954; Skempton,
626
1964; Boyce, 1976; Lupini et al., 1981; Schultheiss and Gunn, 1985).Testing procedures concerning the behavior of different soil sedi-ment types from engineering sciences (e.g., Casagrande, 1936; 1948;Bjerrum, 1954; Skempton, 1964) were applied to fine-grained marinesediments (e.g., Boyce, 1976; Lee, 1985). The residual strength ofsoils has been studied applying different testing procedures, and therelationships between physical properties of deep marine sedimentsand their mineralogy, pore fluid chemistry, and parameters like litho-static, hydrostatic, and pore fluid pressure as well as temperaturehave been shown. Much of this work has been summarized by Lupiniet al. (1981) and Moore (1991), and therefore will not be repeatedhere. The permeability of soils and rocks is of growing importance inengineering geosciences. The development of laboratory measure-ment methods as well as characteristics of different materials havebeen reviewed and outlined by Tavenas et al. (1983a, 1983b). In anextensive study, permeability was determined for several types ofmarine sediments (Bryant et al., 1975; Schultheiss and Gunn, 1985;Taylor and Leonard, 1990).
In this paper we present the geotechnical characterization of mud-volcano sediments from the analysis of five samples taken duringprevious cruises of the Bannock in 1988 and 1989 (e.g., Cita and Ca-merlenghi, 1990) as well as on five whole-round samples from Leg160 (Emeis, Robertson, Richter, et al., 1996) down to 200 meters be-low seafloor (mbsf). Studying the range of plastic response, shear re-sistance, and permeability of the mud can be a key to explain whythere is unlithified material at depth for a period of several millionyears. For the first time, a considerable number of undisturbed coresamples (down to 200 mbsf), as well as remolded sediment from mud

SE
DIM
EN
T P
HY
SIC
AL
PR
OP
ER
TIE
S A
ND
PE
RM
EA
BIL
ITY
627
9
2.5
3.0
3.5 sTWTT
1 km
971A
0
20
60
40
80
100
120
140
160
180
200mbsf
971B1CNannofossil ooze withsapropels and diatoms
Mud debrisflow deposits
Clast-richmud debrisflow deposits
SE
>0.46Ma
<1.5Ma
MiddlePliocene
>0.26Ma
turbidites
A
Figur eflectors visible in the migrated time sections are shownat the poli dome (after Robertson et al., 1996)
2.5
3.0
4.0 sTWTT
3.5
1 km
970A
Clast-richmud-debrisflow deposits
Mud debris-flow depositsand turbidites
Nannofossilooze
Nannofossil ooze<0.26Ma
970BNanno-fossil oozewithsapropelsand siltturbidites
Early toMiddle-latePleistocene
970CPebblymud
70D
Depth(mbsf)
0
20
60
40
80
100
120
140
160
180
200Nannofossil ooze>1.75Ma
Pebblymud
WSW ENE
<0.99Ma
>1.5Ma
97971E 971D
NW
Mousse-likesilty clay
with halite
Mousse-likesilty and sandy
clays
B
e 2. Summary of the lithostratigraphy of the (A) Milano and (B) Napoli mud volcanoes drilled during Leg 160. The most prominent seismic r bottom. Note the presence of inward-dipping reflectors beneath the flanks of both mud domes as well as a depressional moat surrounding Na

A. KOPF, M.B. CLENNELL, A. CAMERLENGHI
2Average clast area/section (mm )
20 40 60 80 100200
150
100
50
0
0 200 400 600 800 1000 1200 1400 / 0
Average clast size
50
0
Grain-size analysis ofmatrix
% clay, silt, and sand
POLYMICTIC GRAVELS
MATRIX-SUPPORTEDBRECCIA/CONGLOMERATE
CLAST-RICH MUD-DEBRISFLOW DEPOSIT
SAPROPEL BEARINGNANNOFOSSIL OOZE
SAPROPEL BEARING NANNOFOSSIL OOZE
SAPROPEL BEARING NANNOFOSSIL OOZE200
150
100
Dep
th (m
bsf)
clay
silt
sand
A
35
30
25
20
15
10
5
0
0 200 400 600 800 1000 1200 1400 / 0
% clay, silt, and sand
Average clast size
30
25
20
15
10
5
0
20 40 60 80 100
Grain-size analysis
NORECOVERY
2Average clast area/section (mm )
Dep
th (m
bsf)
B
20 40 60 80 100
Grain-size analysis
% clay, silt, and sand
50
40
30
20
10
0
0 500 1000 1500 2000 2500 3000 /0
Average clast area/section (mm )
Average clast size
50
40
30
20
10
0
2
Dep
th (m
bsf)
C
Figure 3. Grain-size and clast-area variation with depth at three holes drilled along a transect into the Milano dome. A. Hole 970A. B. Hole 970C. C. Hole 970D. Data were collected from the different mud-volcano deposits only (after Kopf et al., in press). (Continued next page.)
in
ere byov-
ole-, we
edure-ap-cu-
volcanoes, was available. The results will be related to previous mud-volcano studies (e.g., Yassir, 1990; Clennell, 1992; Barber et al.,1986).
LABORATORY TESTING METHODS
X-ray Diffraction and Grain-Size Analysis
Five X-ray diffraction (XRD) determinations of the mineralogicalcomposition of the clay-sized fraction of each whole-round samplewere carried out to complement the shipboard and post-cruise XRDanalysis of the bulk mud-volcano sediments (Emeis, Robertson,Richter, et al., 1996 and Robertson and Kopf, Chap. 45, this volume,respectively). The XRD analyses were conducted on dried smearslides of the finest fraction (<2 µm) obtained by double centrifugof the sediment sample dispersion.
628
g
The grain-size analyses on the matrix of the mud breccia wmade using a Coulter LS 100 particle-size analyzer postcruiseFlecker and Kopf (1996). We also examined 14 more samples to cer inadequately sampled intervals, as well as the Leg 160 whround samples (Table 1). To more easily compare the samplesused the same analyzer.
Physical Properties
Grain density GS (g/cm3), wet bulk density γB (g/cm3), dry bulkdensity γD (g/cm3), water content W (wt%), porosity n (vol%), andvoid ratio e (dimensionless) for mud-volcano sediments recoverfrom Leg 160 were determined as part of the shipboard measments (see “Physical Properties” section, “Explanatory Notes” chter, in Emeis, Robertson, Richter, et al., 1996). In addition, we callated:

SEDIMENT PHYSICAL PROPERTIES AND PERMEABILITY
20 40 60 80 100
100
80
60
40
20
Dep
th (m
bsf)
0
0 400 800 1200 1600 2000 / 0
Average clast size
100
80
60
40
20
0
% clay, silt, and sand
Grain-size analysis
2Average clast area/section (mm )
D
200
150
100
50
0
0 400 800 1200 1600 2000 / 0
Average clast size
20 40 60 80 100
Grain-size analysis
Dep
th (m
bsf)
% clay, silt, and sand2Average clast area/section (mm )
E
200
150
100
50
0
Average clast size
20 40 60 80 100
Grain-size analysis
50
40
30
20
10
0
0 100 200 300 400 500 600 700 800 / 0
50
40
30
20
10
0
2Average clast area/section (mm )
Dep
th (m
bsf)
F
% clay, silt, and sand
28
24
20
16
12
8
4
0
0 200 400 600 800
Average clast size /section (mm )
Average clast size
1000 / 0 20 40 60 80 100
24
20
16
12
8
4
0
Grain-size analysis
2 % clay, silt, and sand
Dep
th (m
bsf)
G
clay
silt
sand
NO CLASTSFigure 3 (continued). Grain-size and clast-area variation with depth at three holes drilled along a transect into the Napoli dome. D. Hole 971A. E. Hole 971B. F. Hole 971D. G. Hole 971E. Data were collected from the different mud-volcano deposits only (after Kopf et al., in press).
(A) wet and dry water contents as:
W(dry) = WW / Wg; W(wet) = WW / W (%), (1)
where W is the total wet sample weight, WW is the weight of the wa-ter and Wg is the dry weight of the sample.
Atterberg limits (Lambe and Whitman, 1969; Head, 1980), andthe original water content of the sealed whole-round (WR) samples
629

A. KOPF, M.B. CLENNELL, A. CAMERLENGHI
630
Table 1. Results from shear box tests and grain-size analyses.
Core, section, interval (cm)Depth (mbsf)
Shear tests Grain size analyses
Peak strength (kPa)
φp (°)
Residual strength (kPa)
φr (°)
Clay (%)
Silt (%)
Sand (%)
Mean (µm) Skewness
Standard deviation
Hemipelagic sedimentNannofossil ooze:
160-971A-10X-4, 132-140 25.35 621 30 <580 <28.3 23.35 76.65 - 30.19 2.21 49.42
Sapropel:160-971A-10X-4, 140-150 25.45 253 11.5 <226 <10.3 10.68 85.22 4.1 75.39 3.25 155.4
Transitional sediment160-971A-4H-2, 132-150 25.32 376 28 211 30.1 21.04 66.96 12 25.28 2.4 42.63
Mud-volcano sediment160-971B-16X-3, 99-119 139.93 199 29.3 338 17.7 38.83 61.17 - 6.52 2.38 8.36
251 17.9 155 11.2160-971D-3H-1, 130-150 18.8 348 27.7 273 21.8 22 69.54 8.46 19.99 2.61 31.9160-971B-19X-1, 130-150 166.2 399 30.4 260 20.9 18.63 77.2 4.17 18.7 1.77 21.63
295 23.4 282 22.5
were determined postcruise in the Department of Earth Sciences ofthe University of Leeds. The plasticity index Ip (%) has been calcu-lated as difference between the liquid (WL) and plastic (WP) limits. Allphysical properties of the samples taken during previous Bannockcruises were measured onshore with an analogous procedure in thegeotechnical laboratory of the Department of Earth Sciences of theUniversity of Milano.
Sediment Shear Strength
Undrained shear strength (SU) was determined on split cores dur-ing Leg 160 (Emeis, Robertson, Richter, et al., 1996). In addition tothese determinations, we applied the Wykeham-Farrance motorizedvane shear device (following the procedures of Boyce [1976]), to de-termine both peak (SP) and residual shear strength (SR). A Wykeham-Farrance standard geotechnical shear box was used for the WR sam-ples from Leg 160 (e.g., ASTM D3080-90, 1991). Samples were re-molded (because of for lack of undisturbed material), squeezed intoa cell of stainless steel (~60 × 60 × 30 mm inner size), and then loadedinitially with 1 kg (equivalent to ~44 kPa). Thereafter, the samplewas consolidated with a loading increment ratio of one (followingDemars and Chaney, 1992 [ASTM STP 777]; BS1377, 1991) until itreached ~1100 kPa. This sample, which was assumed to be normallyconsolidated, was then sheared at a rate of 0.002 mm/min for fourdays to ensure that failure occurred. The samples were slightly over-consolidated by loading them to an equivalent of 2300 kPa and thenunloading them to half the load (importing an overconsolidation ratioof 2 on the sediment) before shearing. We used these tests to assessthe degree of hardening and brittleness induced by overconsolidation.
After testing, samples were air-dried and divided into chips forthin section preparation and to make small subsamples for scanningelectron microscope (SEM) study.
Oedometer Tests
Non-back-pressured consolidation tests were conducted on fivesediment specimens (height = 2 cm, diameter = 5 cm) from Bannockcruises. From each sample, three specimens have been tested for con-solidation, one trimmed in vertical direction, one trimmed in horizon-tal direction, and one remolded at the natural water content. In orderto avoid complications caused osmotic effects between the salinepore water and the distilled water of the consolidation apparatus, cellswere filled with artificial seawater to simulate in situ conditions (Ca-merlenghi, 1991). Consolidation was attained for load increments be-
tween 12.5 and 2400 kPa vertical effective stress (the increments areoutlined in Table 2). Readings were taken manually after having al-lowed equilibration for 24 hr after each loading increment. The fol-lowing parameters were calculated from the results of these tests:
(B) the coefficient of consolidation cV, which dictates the time rateof volume and pore pressure change in the sediment when loaded:
cV = TV(50) H(50)2 / t(50) (cm2/s), (2)
where TV(50) = 0.197 (i.e., a time factor when 50% consolidation hastaken place), H(50) = H/2 − dH (H = original sample thickness, dH =thickness when 50% consolidation has taken place), and t(50) is thetime when 50% consolidation has taken place;
(C) the coefficient of volume compressibility, mV, for one-dimen-sional loading
mV = dh / (h dP) (cm2/kg), (3)
where h is the initial thickness, dh its variation with applied pres-sure, and dP the pressure variation (i.e., change in effective stress);
(D) the theoretical hydraulic conductivity K, deduced from theone-dimensional consolidation test using Terzaghi’s theory (Lambeand Whitman 1979):
K = cV mV γW (cm/s), (4)
where cV is the coefficient of consolidation, mV is the coefficient ofvolume compressibility, and γW is the unit weight of artificial oceanwater. The hydraulic conductivity is a critical parameter which con-trols the rate of fluid flow in the sediments, and is directly related tocV and the intrinsic permeability as shown above and below;
(E) the void ratio e as:
e = (Gs γw h As/Ws) – 1 (dimensionless), (5)
where Gs is the grain density (g/cm3), γw is the water specific gravity(dimensionless), h is the specimen height (cm), As is the specimenarea (cm2), and Ws the weight of the solid (g);
(F) the porosity n as:
SEDIMENT PHYSICAL PROPERTIES AND PERMEABILITY
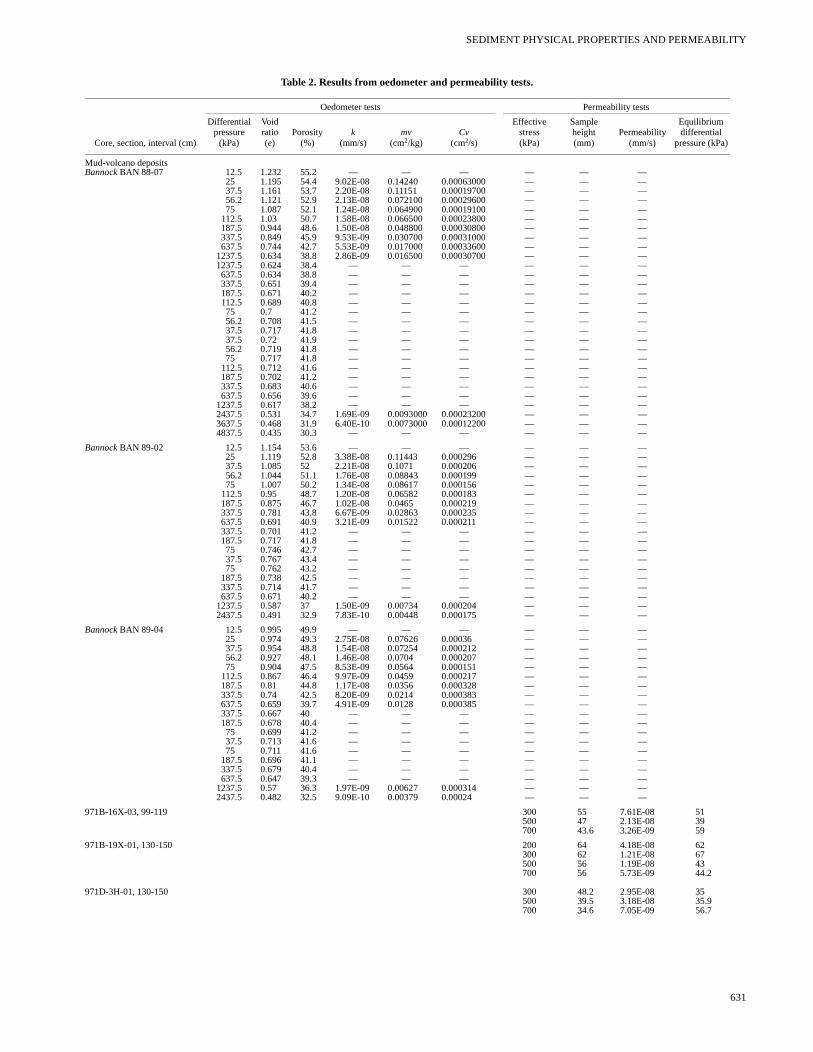
Table 2. Results from oedometer and permeability tests.
Oedometer tests Permeability tests
Core, section, interval (cm)
Differential pressure
(kPa)
Void ratio(e)
Porosity (%)
k (mm/s)
mv (cm2/kg)
Cv(cm2/s)
Effective stress(kPa)
Sampleheight (mm)
Permeability (mm/s)
Equilibrium differential
pressure (kPa)
Mud-volcano depositsBannock BAN 88-07 12.5 1.232 55.2 — — — — — —
25 1.195 54.4 9.02E-08 0.14240 0.00063000 — — —37.5 1.161 53.7 2.20E-08 0.11151 0.00019700 — — —56.2 1.121 52.9 2.13E-08 0.072100 0.00029600 — — —75 1.087 52.1 1.24E-08 0.064900 0.00019100 — — —
112.5 1.03 50.7 1.58E-08 0.066500 0.00023800 — — —187.5 0.944 48.6 1.50E-08 0.048800 0.00030800 — — —337.5 0.849 45.9 9.53E-09 0.030700 0.00031000 — — —637.5 0.744 42.7 5.53E-09 0.017000 0.00033600 — — —
1237.5 0.634 38.8 2.86E-09 0.016500 0.00030700 — — —1237.5 0.624 38.4 — — — — — —637.5 0.634 38.8 — — — — — —337.5 0.651 39.4 — — — — — —187.5 0.671 40.2 — — — — — —112.5 0.689 40.8 — — — — — —75 0.7 41.2 — — — — — —56.2 0.708 41.5 — — — — — —37.5 0.717 41.8 — — — — — —37.5 0.72 41.9 — — — — — —56.2 0.719 41.8 — — — — — —75 0.717 41.8 — — — — — —
112.5 0.712 41.6 — — — — — —187.5 0.702 41.2 — — — — — —337.5 0.683 40.6 — — — — — —637.5 0.656 39.6 — — — — — —
1237.5 0.617 38.2 — — — — — —2437.5 0.531 34.7 1.69E-09 0.0093000 0.00023200 — — —3637.5 0.468 31.9 6.40E-10 0.0073000 0.00012200 — — —4837.5 0.435 30.3 — — — — — —
Bannock BAN 89-02 12.5 1.154 53.6 — — — — — —25 1.119 52.8 3.38E-08 0.11443 0.000296 — — —37.5 1.085 52 2.21E-08 0.1071 0.000206 — — —56.2 1.044 51.1 1.76E-08 0.08843 0.000199 — — —75 1.007 50.2 1.34E-08 0.08617 0.000156 — — —
112.5 0.95 48.7 1.20E-08 0.06582 0.000183 — — —187.5 0.875 46.7 1.02E-08 0.0465 0.000219 — — —337.5 0.781 43.8 6.67E-09 0.02863 0.000235 — — —637.5 0.691 40.9 3.21E-09 0.01522 0.000211 — — —337.5 0.701 41.2 — — — — — —187.5 0.717 41.8 — — — — — —75 0.746 42.7 — — — — — —37.5 0.767 43.4 — — — — — —75 0.762 43.2 — — — — — —
187.5 0.738 42.5 — — — — — —337.5 0.714 41.7 — — — — — —637.5 0.671 40.2 — — — — — —
1237.5 0.587 37 1.50E-09 0.00734 0.000204 — — —2437.5 0.491 32.9 7.83E-10 0.00448 0.000175 — — —
Bannock BAN 89-04 12.5 0.995 49.9 — — — — — —25 0.974 49.3 2.75E-08 0.07626 0.00036 — — —37.5 0.954 48.8 1.54E-08 0.07254 0.000212 — — —56.2 0.927 48.1 1.46E-08 0.0704 0.000207 — — —75 0.904 47.5 8.53E-09 0.0564 0.000151 — — —
112.5 0.867 46.4 9.97E-09 0.0459 0.000217 — — —187.5 0.81 44.8 1.17E-08 0.0356 0.000328 — — —337.5 0.74 42.5 8.20E-09 0.0214 0.000383 — — —637.5 0.659 39.7 4.91E-09 0.0128 0.000385 — — —337.5 0.667 40 — — — — — —187.5 0.678 40.4 — — — — — —75 0.699 41.2 — — — — — —37.5 0.713 41.6 — — — — — —75 0.711 41.6 — — — — — —
187.5 0.696 41.1 — — — — — —337.5 0.679 40.4 — — — — — —637.5 0.647 39.3 — — — — — —
1237.5 0.57 36.3 1.97E-09 0.00627 0.000314 — — —2437.5 0.482 32.5 9.09E-10 0.00379 0.00024 — — —
971B-16X-03, 99-119 300 55 7.61E-08 51500 47 2.13E-08 39700 43.6 3.26E-09 59
971B-19X-01, 130-150 200 64 4.18E-08 62300 62 1.21E-08 67500 56 1.19E-08 43700 56 5.73E-09 44.2
971D-3H-01, 130-150 300 48.2 2.95E-08 35500 39.5 3.18E-08 35.9700 34.6 7.05E-09 56.7
631

A. KOPF, M.B. CLENNELL, A. CAMERLENGHI
6
Table 2 (continued).
Oedometer tests Permeability tests
Core, section, interval (cm)
Differential pressure
(kPa)
Void ratio(e)
Porosity (%)
k (mm/s)
mv (cm2/kg)
Cv(cm2/s)
Effective stress(kPa)
Sampleheight (mm)
Permeability (mm/s)
Equilibrium differential
pressure (kPa)
Mixed sediment
Bannock BAN 89-03 12.5 1.028 50.7 — — — —25 1.011 50.3 3.48E-08 0.04171 0.000834 —37.5 0.992 49.8 3.45E-08 0.04862 0.00071 —56.2 0.97 49.2 2.86E-08 0.04111 0.000696 —75 0.952 48.8 1.75E-08 0.02966 0.00059 —
112.5 0.918 47.9 2.40E-08 0.02799 0.000856 —187.5 0.874 46.6 2.52E-08 0.02016 0.00125 —337.5 0.806 44.6 1.94E-08 0.01785 0.00108 —637.5 0.721 41.9 1.37E-08 0.0115 0.00119 —337.5 0.728 42.1 — — — —187.5 0.737 42.4 — — — —75 0.756 43 — — — —37.5 0.769 43.5 — — — —75 0.766 43.4 — — — —
187.5 0.75 42.9 — — — —337.5 0.735 42.4 — — — —637.5 0.705 41.4 — — — —
1237.5 0.623 38.4 7.14E-09 0.00545 0.00131 —2437.5 0.52 34.2 4.25E-09 0.00385 0.0011 —
160-971A-4H-02, 132-150 200 89 2.93E-08 65300 84 1.77E-08 36.5500 53 2.46E-08 43.8700 52 1.31E-08 40.2
700r1 52 1.39E-08 38700r2 52 1.55E-08 68
Hemipelagic sedimentsBannock BAN 89-08 12.5 1.221 55 — — — —
25 1.194 54.4 9.40E-08 0.0775 0.00121 —37.5 1.166 53.8 8.51E-08 0.07192 0.00118 —56.2 1.14 53.3 7.38E-08 0.03788 0.00195 —75 1.121 52.9 1.51E-08 0.03729 0.000406 —
112.5 1.087 52.1 6.31E-08 0.02537 0.000249 —187.5 1.044 51.1 4.89E-08 0.01252 0.0039 —337.5 0.979 49.5 5.83E-08 0.01622 0.0036 —637.5 0.904 47.5 3.33E-08 0.00759 0.00439 —337.5 0.91 47.6 — — — —187.5 0.908 47.6 — — — —75 0.935 48.3 — — — —37.5 0.949 48.7 — — — —75 0.945 48.6 — — — —
187.5 0.93 48.2 — — — —337.5 0.916 47.8 — — — —637.5 0.889 47.1 — — — —
1237.5 0.805 44.6 2.40E-08 0.00415 0.00579 —2437.5 0.678 40.4 1.63E-08 0.00378 0.0043
,
terk2
ofM, theres-u-pre-ither
g) sam- theith-tial
ectivewithally heldr-
luidream sys-
n = 100 e / (e + 1) (%). (6)
Permeability Tests
Permeability, k, was directly determined as velocity of the migra-tion of a fluid phase through a sediment of known flow rate (i.e., vol-ume per time unit, Q; cross sectional area, A; and hydraulic gradient,i) following Darcy’s Law
K = Q / A i (cm/s). (7)
The intrinsic permeability, k, is related to the hydraulic conductivityK, by adjusting for the unit weight and viscosity (η) of the pore wa-ter:
k = Kη / γW (cm2). (8)
Before each test series, the samples were trimmed to a diame5−6 cm in order to remove all artificial drill mud along the core lineConsolidation was achieved using a hydraulically pressurized Wyham-Farrance permeability cell. Loads were applied in steps of
32
r of.e-00
(for some samples), 300, 500, and 700 kPa effective stress (σ′), eachtime waiting for full equilibration of the specimen, as a dissipationall excess pore pressure dissipated, following ASTM D5084 (AST1990). The effective stress resulted from the hydraulic pressure incell minus the backpressure supplied by a GDS dynamic pore-psure controller, which monitors both in- and outflow volume to 1 cbic mm and allows all volume changes occurring to be recorded cisely. Specimen drainage was allowed via thin porous disks at eend of the whole-round samples.
After each loading interval, consolidation (uniaxial shorteninwas measured by using a displacement transducer on top of theple. A constant rate of volumetric flow was then induced throughsample with a Harvard Apparatus syringe pump. Infusion or wdrawal rates of 0.1 to 3 µL/min were used. The induced differenpressure across the sample (in no case exceeding 10% of the effstress) was recorded by a transducer (Validyne model DP215) accuracy of 0.5 kPa. Inflow and outflow were recorded automaticthroughout the experiments by computer. The temperature wasconstant at 22 ± 1°C to minimize volume changes caused by diffeential expansion in clay, viscosity and density changes in the f(Schultheiss and Dunn, 1985), and thermal expansion in the upstend of the system. De-aired water was flushed through the entire

SEDIMENT PHYSICAL PROPERTIES AND PERMEABILITY
tem to prevent air entrapment, and was also used for the tests. The ef-fects of not having used saline pore water to protect the equipmentfrom corrosion is discussed below (see also Olson and Daniel, 1981).
EXPERIMENTAL RESULTS
Mud Breccia Composition and Grain-Size Variation
Bulk sediment XRD analyses in Emeis, Robertson, Richter, et al.(1996) and Robertson and Kopf (Chap. 45, this volume) have shownthat calcite and quartz are the most abundant minerals in most of thesamples. The clay fraction contains clay minerals; most abundant arekaolinite and smectite and fine-grained biogenic calcite. PostcruiseXRD determinations on the finest fraction of the matrix of mud-de-bris flow deposits, however, indicate the presence of considerableamounts of chlorite and smectite rather than kaolinite. Clay mineralsare more abundant in the crestal holes and in the upper part of the suc-cession of the deep holes.
The compilation of grain and clast size variation shown as stackhistograms in Fig. 3 indicate in the majority of the cases a rough fin-ing-upward sequence in each hole. The matrix of the mud-volcanodeposits is composed mainly of sand and silt, with a minor clay frac-tion ranging between 5% and 40%. None of the samples analyzedcontained particles coarser than sand size.
Physical Properties
Results from shipboard measurements and on WR samples takenduring Leg 160 are shown in Figure 4 and Tables 3, 4. The water con-tent at the sediment surface varies generally between 30% and 45%,and evidently decreases with depth in the hemipelagic sediments,which retain a higher water content than the mud-volcano sedimentsthroughout. Mud-volcano sediments instead show a rather uniformdistribution of the water content with depth. The surface porosityranges from 50% to 70%, and it is occasionally as low as 40% inmud-volcano sediment intervals that are rich in clasts (Emeis, Rob-ertson, Richter, et al., 1996). Bulk density is relatively constant whenmud-volcano deposits were homogeneous, but increased in intervalswith abundant clasts (e.g., the clast-rich, matrix-supported mud-debris flow deposits; Fig. 3, e.g., Cores 160-970A-6X through 21X).The grain density of the mud breccia ranges between 2.65 and 2.8 g/cm3, reflecting the high clay content; thus, hemipelagic deposit den-sities are found to be 2.75−3.2 g/cm3 because of their carbonate con-tent (Tables 3, 4).
Atterberg Limits
The variation of liquid limits (WL) and plastic limits (WP) is illus-trated in Figure 5. The plasticity indices vary between mud-volcanodeposits from the flank (24%−30%) to the crest (42%), whereas thetransitional and hemipelagic sediment reaches only 19%−27% and18% respectively (Table 5). Notably, the clay-rich sediment from thecrest of Napoli dome (Fig. 3) shows the broadest plasticity range(Fig. 5). The higher plasticity of the mud-volcano deposits resultsfrom higher contents of swelling clays and lower permeabilities.
The original water contents of all mud-volcano deposits tested liein between WL and WP. The transitional whole-round sample has itsnatural water content close to the plastic limit (i.e., brittle behavior).By contrast, the natural water content and the liquid limit of the nan-nofossil ooze are very similar, indicating that this material may be-have like a fluid if put under undrained stress conditions.
0 10 20 30 40 50 60 70
0
50
100
150
200
water content (%)
dept
h bs
f (m
)
A
B
C
30 40 50 60 70 80 90
0
50
100
150
200
porosity (%)
dept
h bs
f (m
)
1.6 1.8 2 2.2 2.4
0
50
100
150
200
bulk density (g/cm3)
dept
h bs
f (m
)
Figure 4. Shipboard physical properties data measured routinely during Leg160 (Emeis, Robertson, Richter, et al., 1996). A. Porosity vs. depth. B. Wetbulk density vs. depth. C. Water content vs. depth. Mud-volcano deposits arerepresented by solid triangles; hemipelagic sediments are open circles.
633

A. KOPF, M.B. CLENNELL, A. CAMERLENGHI
634
Table 3. Index properties and carbonate content of mud-volcano deposits.
Core, section,interval (cm)
Depth (mbsf)
Initial water content (wt%)
Porosity (vol%)
Bulk density (g/cm3)*
Grain density (g/cm3)*
Dry density (g/cm3)*
CaCO3 (wt%)**
Milano160-970A-
1H-1, 71-73 0.71 34.18 60.70 1.82 1.76 3.05 2.79 1.20 1.16 —1H-2, 71-73 2.21 30.50 54.17 1.82 1.81 2.76 2.72 1.26 1.26 —1H-3, 70-72 3.70 27.79 52.22 1.93 1.87 2.91 2.73 1.39 1.35 —1H-4, 75-77 5.25 27.10 51.46 1.95 1.88 2.92 2.72 1.42 1.37 —1H-5, 61-63 6.61 26.24 50.34 1.97 1.90 2.92 2.74 1.45 1.40 —2H-1, 123-125 8.83 37.08 63.24 1.75 1.68 2.99 2.71 1.10 1.06 15.52H-2, 90-92 10.00 33.81 58.90 1.78 1.74 2.87 2.72 1.18 1.15 —3X-CC, 17-19 10.37 25.13 48.05 1.96 1.91 2.82 2.70 1.47 1.43 14.24X-1, 90-92 19.10 38.42 64.69 1.72 1.67 3.01 2.77 1.06 1.03 44.66X-1, 44-46 37.84 19.97 41.02 2.10 2.05 2.86 2.74 1.68 1.64 15.67X-1, 10-12 47.20 24.39 47.71 2.00 1.93 2.90 2.69 1.52 1.46 15.310X-1, 10-12 76.10 22.20 45.18 2.09 2.00 2.96 2.75 1.62 1.56 14.111X-CC, 20-22 85.90 21.44 44.13 2.11 2.03 2.97 2.76 1.66 1.59 74.413X-1, 40-42 105.50 21.57 43.87 2.08 2.02 2.91 2.75 1.63 1.58 8.814X-1, 28-30 115.08 21.76 43.89 2.07 1.99 2.88 2.69 1.62 1.55 14.515X-1, 45-47 124.85 26.58 51.04 1.97 1.91 2.95 2.77 1.44 1.40 —15X-1, 75-77 125.15 20.26 42.39 2.14 2.04 2.97 2.72 1.71 1.62 —15X-1, 126-128 125.66 4.97 38.39 1.73 2.50 1.80 2.71 1.64 2.38 —15X-2, 12-14 125.91 21.91 44.16 2.06 2.00 2.89 2.72 1.61 1.56 16.215X-2, 62-64 126.41 20.68 42.17 2.09 2.03 2.87 2.73 1.66 1.61 16.215X-2, 102-104 126.81 15.54 31.87 2.10 2.27 2.60 2.93 1.77 1.92 16.215X-3, 8-10 127.37 20.46 42.99 2.15 2.05 3.00 2.76 1.71 1.63 —18X-1, 53-55 153.73 18.40 39.59 2.20 2.10 2.98 2.75 1.80 1.71 29.818X-1, 100-102 154.20 21.34 44.56 2.14 2.01 3.04 2.71 1.68 1.58 29.818X-2, 100-102 155.50 23.22 46.61 2.06 1.97 2.96 2.74 1.58 1.52 23.118X-3, 50-52 156.50 21.48 43.87 2.09 2.02 2.93 2.75 1.64 1.59 —18X-3, 100-102 157.00 21.68 45.11 2.13 2.04 3.04 2.81 1.67 1.60 —19X-1, 66-68 163.46 24.84 47.78 1.97 1.92 2.84 2.70 1.48 1.44 —19X-2, 40-42 164.70 22.44 44.32 2.02 2.00 2.82 2.75 1.57 1.55 17.520X-1, 70-72 173.20 22.89 46.16 2.07 1.96 2.96 2.70 1.59 1.51 —20X-2, 49-51 174.49 23.57 46.99 2.04 1.96 2.94 2.72 1.56 1.49 19.220X-2, 50-52 174.50 24.01 47.26 2.02 1.94 2.91 2.70 1.53 1.47 19.220X-2, 100-102 175.00 22.27 45.74 2.10 2.04 3.01 2.85 1.64 1.59 19.221X-1, 50-52 182.60 22.95 46.04 2.06 1.98 2.94 2.74 1.58 1.52 29.721X-1, 99-101 183.09 29.06 54.03 1.90 1.85 2.94 2.75 1.35 1.31 29.721X-2, 16-18 183.76 26.51 51.08 1.97 1.89 2.97 2.71 1.45 1.39 —21X-2, 84-86 184.44 22.68 46.09 2.08 2.02 2.99 2.82 1.61 1.56 24.2
160-970C-1H-1, 121-123 1.21 30.18 52.89 1.80 1.81 2.66 2.69 1.25 1.26 —1H-2, 124-126 2.74 30.12 55.87 1.90 1.83 3.01 2.75 1.33 1.28 20.41H-3, 125-127 4.25 27.86 52.76 1.94 1.88 2.96 2.79 1.40 1.36 —1H-4, 10-12 4.60 26.75 52.75 2.02 1.89 3.13 2.74 1.48 1.39 —2H-1, 30-32 5.50 25.34 48.72 1.97 1.90 2.87 2.68 1.47 1.42 —2H-2, 36-38 6.56 26.58 49.04 1.89 1.88 2.72 2.70 1.39 1.38 —2H-3, 28-30 7.90 26.45 50.51 1.96 1.92 2.91 2.80 1.44 1.41 17.83H-1, 132-134 9.52 25.58 49.25 1.97 1.92 2.89 2.76 1.47 1.43 —3H-2, 140-142 11.10 25.72 49.30 1.96 1.90 2.88 2.69 1.46 1.41 —3H-3, 90-92 12.10 23.08 45.53 2.02 1.95 2.85 2.68 1.55 1.50 —3H-4, 128-130 13.98 25.44 49.41 1.99 1.94 2.93 2.79 1.48 1.45 —3H-5, 91-93 15.11 24.51 47.65 1.99 1.95 2.87 2.75 1.50 1.47 —3H-6, 45-47 15.72 25.35 48.68 1.97 1.91 2.86 2.69 1.47 1.42 12.6
160-970D-1H-1, 81-83 0.81 21.53 43.13 2.05 2.03 2.83 2.77 1.61 1.59 10.11H-2, 129-131 2.79 21.77 44.03 2.07 2.02 2.90 2.76 1.62 1.58 —1H-3, 120-122 4.20 25.76 50.23 2.00 1.92 2.98 2.77 1.48 1.43 13.82H-1, 50-52 5.30 31.82 58.41 1.88 1.80 3.08 2.79 1.28 1.23 152H-2, 50-52 6.80 30.61 55.16 1.85 1.82 2.86 2.78 1.28 1.27 —2H-4, 46-48 9.76 29.83 54.54 1.87 1.82 2.89 2.73 1.31 1.28 15.52H-5, 50-52 11.30 21.66 43.79 2.07 2.00 2.89 2.71 1.62 1.57 —2H-6, 50-52 12.80 30.72 56.89 1.90 1.85 3.05 2.89 1.31 1.28 16.73H-1, 75-77 15.05 30.47 56.79 1.91 1.81 3.07 2.73 1.33 1.26 —3H-2, 75-77 16.55 29.81 56.74 1.95 1.82 3.16 2.72 1.37 1.28 243H-3, 75-77 18.05 30.58 55.27 1.85 1.82 2.87 2.78 1.29 1.27 —3H-5, 75-77 21.05 29.77 57.18 1.97 1.85 3.23 2.81 1.38 1.30 16.23H-6, 79-81 22.59 30.04 56.92 1.94 1.81 3.15 2.70 1.36 1.27 —3H-7, 43-45 23.73 59.74 52.41 3.46 1.38 -1.37 2.82 1.39 0.55 —4H-1, 50-52 24.30 32.80 57.10 1.78 1.77 2.79 2.74 1.20 1.19 —4H-2, 50-52 25.41 32.68 58.51 1.83 1.78 2.98 2.77 1.23 1.20 —4H-3, 50-52 26.91 30.54 57.73 1.94 1.83 3.18 2.80 1.35 1.27 —4H-4, 50-52 28.41 29.49 54.64 1.90 1.83 2.95 2.74 1.34 1.29 —4H-5, 48-50 29.89 31.12 56.41 1.86 1.80 2.93 2.73 1.28 1.24 —4H-6, 50-52 31.41 67.67 56.23 1.91 1.10 -2.36 1.29 0.62 0.35 —5H-1, 91-93 34.21 26.45 51.91 2.01 1.92 3.08 2.79 1.48 1.41 —5H-2, 79-81 35.52 25.55 50.40 2.02 1.95 3.03 2.82 1.50 1.45 —5H-3, 79-81 36.79 29.73 56.07 1.93 1.83 3.09 2.74 1.36 1.29 —5H-4, 78-80 38.28 30.92 59.21 1.96 1.83 3.32 2.83 1.36 1.27 —5H-5, 74-76 39.74 30.97 57.27 1.89 1.79 3.06 2.71 1.31 1.24 —5H-6, 82-84 41.32 30.04 55.70 1.90 1.87 3.00 2.90 1.33 1.31 —
Napoli160-971A-
3H-1, 68-70 17.18 27.36 51.54 1.93 1.86 2.89 2.69 1.40 1.35 20.13H-2, 68-70 18.68 24.74 48.55 2.01 1.93 2.94 2.71 1.51 1.45 —3H-3, 68-70 20.18 24.26 48.55 2.05 1.93 3.02 2.70 1.55 1.46 —3H-4, 68-70 21.68 24.93 48.14 1.98 1.94 2.86 2.76 1.49 1.46 20.84H-1, 128-130 23.78 25.33 48.38 1.96 1.92 2.83 2.73 1.46 1.43 14.84H-2, 127-129 25.27 24.44 47.97 2.01 1.95 2.92 2.75 1.52 1.47 —

SEDIMENT PHYSICAL PROPERTIES AND PERMEABILITY
Table 3 (continued).
Notes: * = two different methods used for all density measurements during Leg 160 (see Emeis, Robertson, Richter, et al., 1996); ** = sample taken from the same section. Bannocksamples are axial and transversal trims. ** = Sample taken from the same section.
Core, section,interval (cm)
Depth (mbsf)
Initial water content (wt%)
Porosity (vol%)
Bulk density (g/cm3)*
Grain density (g/cm3)*
Dry density (g/cm3)*
CaCO3 (wt%)**
4H-2, 127-129 25.27 24.44 47.97 2.01 1.95 2.92 2.75 1.52 1.47 —4H-3, 119-121 26.69 24.46 47.52 1.99 1.93 2.87 2.71 1.50 1.46 3.64H-4, 86-88 27.86 24.43 47.90 2.01 1.95 2.91 2.75 1.52 1.47 —5X-CC, 35-37 28.85 21.02 42.46 2.07 2.01 2.84 2.71 1.63 1.59 —6X-1, 19-21 38.39 24.72 47.82 1.98 1.94 2.86 2.74 1.49 1.46 —6X-CC, 25-27 39.16 21.02 44.74 2.18 2.00 3.12 2.69 1.72 1.58 38.77X-1, 20-22 48.10 23.41 46.33 2.03 1.99 2.89 2.80 1.55 1.52 —8X-1, 19-21 57.79 22.86 45.40 2.03 2.01 2.87 2.81 1.57 1.55 15.28X-CC, 13-15 58.15 23.81 46.78 2.01 1.93 2.88 2.68 1.53 1.47 —
160-971B-4H-1, 50-52 21.70 24.22 48.10 2.03 1.95 2.97 2.74 1.54 1.48 26.26X-1, 25-27 39.95 22.61 45.14 2.05 1.97 2.88 2.70 1.58 1.53 23.97X-1, 50-52 49.80 9.19 18.77 2.09 2.58 2.34 3.05 1.90 2.34 —8X-1, 53-55 59.43 22.39 45.33 2.07 2.02 2.94 2.80 1.61 1.57 23.39X-1, 27-29 68.87 30.96 54.67 1.81 1.77 2.76 2.62 1.25 1.22 1812X-1, 82-84 98.32 23.71 45.94 1.99 1.92 2.80 2.65 1.51 1.47 —13X-1, 76-78 107.86 29.11 52.6 1.85 1.80 2.77 2.62 1.31 1.28 21.713X-2, 38-40 108.98 24.76 48.22 2.00 1.94 2.90 2.74 1.50 1.46 —13X-CC, 6-8 109.38 23.48 45.59 1.99 1.96 2.80 2.73 1.52 1.50 —14X-1, 92-94 117.62 23.14 45.43 2.01 1.95 2.83 2.68 1.55 1.50 —14X-2, 54-56 118.74 20.21 40.69 2.06 2.03 2.78 2.69 1.65 1.62 23.214X-CC, 10-12 119.38 17.36 36.61 2.16 2.11 2.82 2.72 1.79 1.74 —15X-1, 42-44 126.72 24.50 49.38 2.07 1.95 3.08 2.75 1.56 1.47 21.115X-CC, 6-8 127.52 19.52 40.92 2.15 2.08 2.93 2.77 1.73 1.67 —16X-1, 50-52 136.50 18.94 40.39 2.18 2.07 2.97 2.73 1.77 1.68 3.716X-1, 115-117 137.15 12.92 28.75 2.28 2.23 2.78 2.70 1.98 1.94 3.716X-2, 58-60 138.08 21.47 43.75 2.09 2.00 2.91 2.69 1.64 1.57 12.716X-3, 50-52 139.44 19.60 41.69 2.18 2.08 3.01 2.78 1.75 1.67 11.217X-1, 60-62 146.20 20.54 42.56 2.12 2.06 2.94 2.78 1.69 1.63 1019X-1, 50-52 165.40 18.66 39.01 2.14 2.07 2.86 2.70 1.74 1.68 19.519X-3, 50-52 168.40 20.41 42.14 2.12 2.04 2.91 2.74 1.68 1.63 15.519X-5, 50-52 171.09 17.86 37.70 2.16 2.10 2.85 2.72 1.78 1.72 17.620X-1, 50-52 175.00 22.02 44.24 2.06 1.99 2.88 2.71 1.60 1.55 19.320X-2, 50-52 176.40 25.98 51.31 2.02 1.91 3.08 2.75 1.50 1.42 20.622X-1, 15-17 193.95 24.58 47.92 2.00 1.93 2.89 2.70 1.51 1.45 —22X-C, 24-26 194.30 6.87 16.88 2.52 2.42 2.82 2.70 2.34 2.26 —
160-971D-1H-2, 116-118 2.66 39.35 63.53 1.65 1.61 2.75 2.57 1.00 0.98 28.21H-3, 116-118 4.16 34.69 62.01 1.83 1.71 3.15 2.65 1.20 1.12 —1H-4, 116-118 5.66 35.23 61.03 1.77 1.69 2.95 2.60 1.15 1.09 —1H-5, 124-126 7.24 21.13 43.93 2.13 2.00 3.00 2.69 1.68 1.58 25.51H-6, 21-23 7.71 24.59 47.70 1.99 1.90 2.87 2.63 1.50 1.43 —2H-1, 126-128 9.26 29.25 54.35 1.90 1.84 2.95 2.74 1.35 1.30 —2H-2, 128-130 10.78 35.45 61.79 1.79 1.70 3.02 2.66 1.15 1.10 24.82H-3, 131-133 12.31 33.40 58.23 1.79 1.72 2.85 2.61 1.19 1.15 —2H-4, 133-135 13.83 30.01 53.78 1.84 1.78 2.78 2.60 1.29 1.25 —2H-5, 128-130 15.28 23.72 46.44 2.01 1.93 2.86 2.67 1.53 1.48 23.82H-6, 134-136 16.84 27.99 51.20 1.87 1.83 2.77 2.63 1.35 1.32 —3H-1, 117-119 18.67 29.61 55.12 1.91 1.82 2.99 2.71 1.34 1.28 —3H-2, 128-130 20.28 29.28 52.54 1.84 1.81 2.74 2.64 1.30 1.28 24.43H-3, 128-130 21.78 28.98 54.86 1.94 1.83 3.05 2.69 1.38 1.30 —3H-4, 122-124 23.22 30.70 55.09 1.84 1.79 2.84 2.67 1.27 1.24 —3H-5, 129-131 24.79 30.82 56.40 1.87 1.80 2.97 2.70 1.30 1.24 22.73H-6, 120-122 26.20 32.97 58.11 1.81 1.74 2.89 2.67 1.21 1.17 —3H-7, 63-65 27.13 31.30 57.58 1.88 1.78 3.05 2.68 1.29 1.22 —4H-1, 130-132 28.30 26.69 48.98 1.88 1.83 2.70 2.57 1.38 1.34 —4H-2, 129-131 29.79 29.81 54.70 1.88 1.80 2.91 2.65 1.32 1.26 23.74H-3, 135-137 31.35 29.96 54.19 1.85 1.78 2.83 2.61 1.30 1.25 —4H-4, 119-121 32.69 29.02 54.87 1.94 1.83 3.05 2.70 1.37 1.30 24.24H-6, 132-134 35.82 23.94 46.28 1.98 1.91 2.80 2.61 1.51 1.45 —4H-7, 71-73 36.71 26.04 49.61 1.95 1.88 2.87 2.67 1.44 1.39 —5H-1, 50-52 37.00 25.27 48.42 1.96 1.88 2.84 2.62 1.47 1.40 —5H-3, 70-72 40.20 24.49 46.99 1.97 1.90 2.80 2.63 1.48 1.43 24.25H-5, 50-52 43.00 25.50 48.60 1.95 1.88 2.83 2.63 1.45 1.40 23.55H-7, 48-50 45.98 17.73 35.58 2.06 1.98 2.63 2.48 1.69 1.63 —
160-971E-1H-1, 75-77 0.75 31.46 59.14 1.93 1.80 3.23 2.76 1.32 1.23 18.51H-3, 75-77 3.75 30.67 57.31 1.91 1.80 3.11 2.70 1.33 1.25 29.11H-5, 72-74 6.72 32.61 60.19 1.89 1.76 3.20 2.70 1.27 1.19 20.51H-7, 49-51 9.49 32.56 57.58 1.81 1.75 2.88 2.66 1.22 1.18 —2H-1, 65-67 10.15 30.82 55.84 1.86 1.77 2.91 2.63 1.28 1.23 —2H-3, 65-67 13.15 27.82 51.79 1.91 1.83 2.86 2.64 1.38 1.32 23.92H-5, 65-67 16.15 25.62 49.16 1.97 1.90 2.88 2.70 1.46 1.41 24.52H-7, 57-59 18.97 25.01 48.00 1.97 1.90 2.83 2.65 1.47 1.42 —3H-1, 73-75 19.73 27.90 52.55 1.93 1.84 2.93 2.65 1.39 1.32 26.63H-7, 30-32 21.49 25.93 48.83 1.93 1.89 2.79 2.69 1.43 1.40 25.1
BannockBAN 89-02 0.8 45 54.3 1.818 1.793 2.743 2.743 1.254 1.258 34.3BAN 89-04 1.2 43.2 50.4 1.9 1.916 2.675 2.675 1.327 1.417 24.8
MONZABannock
BAN 88-07 1.5 51.2 56.1 1.779 1.813 2.648 2.648 1.177 1.248 22.4
635

A. KOPF, M.B. CLENNELL, A. CAMERLENGHI
Table 4. Index properties and carbonate content of mixed sediment and nannofossil ooze.
Notes: * = two different methods used for all density measurements during Leg 160 (Emeis, Robertson, Richter, et al., 1996); ** = sample taken from the same section. Bannock samplesare axial and transversal trims.
Core, section, interval (cm)
Depth (mbsf)
Initial water content (wt%)
Porosity (vol%)
Bulk density (g/cm3)*
Grain density (g/cm3)*
Dry density (g/cm3)*
CaCO3
(wt%)**
Hemipelagic sediment
Milano
160-970A-16X-1, 61 63 134.61 27.68 51.41 1.90 1.86 2.83 2.70 1.38 1.34 —16X-1, 110 112 135.10 27.57 52.81 1.96 1.86 3.01 2.71 1.42 1.35 —16X-2, 40 42 135.90 25.34 49.01 1.98 1.93 2.90 2.76 1.48 1.44 49.716X-2, 80 82 136.30 30.74 57.14 1.90 1.81 3.08 2.74 1.32 1.25 49.716X-2, 110 112 136.60 30.06 54.21 1.85 1.81 2.82 2.70 1.29 1.27 49.716X-3, 45 47 137.45 28.79 54.96 1.96 1.83 3.09 2.69 1.39 1.31 47.117X-1, 50 52 144.10 29.37 54.55 1.90 1.84 2.96 2.74 1.34 1.30 52.617X-1, 100 102 144.60 29.65 54.74 1.89 1.82 2.94 2.71 1.33 1.28 52.617X-2, 50 52 145.60 30.51 55.51 1.86 1.81 2.91 2.72 1.30 1.26 45.617X-2, 100 102 146.10 26.63 50.88 1.96 1.88 2.92 2.71 1.44 1.38 45.617X-3, 50 52 147.10 38.09 62.79 1.69 1.64 2.81 2.59 1.05 1.01 49.117X-3, 110 112 147.70 29.28 54.32 1.90 1.83 2.94 2.71 1.34 1.29 49.117X-4, 50 52 148.60 28.55 54.66 1.96 1.84 3.09 2.71 1.40 1.32 —
160-970B-1H-1, 53 55 0.53 38.76 67.84 1.79 1.65 3.42 2.68 1.10 1.01 52.11H-2, 52 54 2.02 34.02 61.87 1.86 1.74 3.22 2.72 1.23 1.15 45.11H-4, 55 57 5.05 32.01 59.98 1.92 1.79 3.26 2.77 1.31 1.22 55.71H-6, 55 57 8.05 35.87 65.01 1.86 1.73 3.40 2.80 1.19 1.11 —2H-3, 123 125 11.86 30.39 54.28 1.83 1.81 2.79 2.71 1.27 1.26 68.72H-4, 46 48 12.55 32.69 56.76 1.78 1.76 2.77 2.69 1.20 1.18 562H-5, 58 60 14.05 30.71 56.96 1.90 1.80 3.06 2.72 1.32 1.25 46.62H-6, 88 90 15.80 37.75 65.53 1.78 1.67 3.21 2.68 1.11 1.04 46.72H-7, 103 105 17.35 35.03 61.95 1.81 1.72 3.09 2.71 1.18 1.12 —2H-8, 78 80 18.53 30.30 57.82 1.96 1.82 3.23 2.74 1.36 1.27 —3H-1, 52 54 19.52 34.24 60.86 1.82 1.72 3.06 2.64 1.20 1.13 —3H-3, 50 52 22.50 31.28 56.80 1.86 1.78 2.96 2.69 1.28 1.22 40.73H-5, 49 51 25.49 33.24 58.61 1.81 1.75 2.91 2.70 1.21 1.17 56.63H-7, 50 52 28.50 35.79 62.22 1.78 1.72 3.03 2.75 1.14 1.10 41.24H-1, 125 127 29.75 29.59 53.19 1.84 1.82 2.77 2.70 1.30 1.28 36.44H-2, 126 128 31.26 28.59 48.05 1.72 1.83 2.37 2.67 1.23 1.31 564H-3, 104 106 32.54 31.45 56.29 1.83 1.78 2.88 2.70 1.26 1.22 54.64H-4, 34 36 33.34 31.68 57.20 1.85 1.78 2.95 2.72 1.26 1.22 14.14H-5, 124 126 35.74 29.61 53.50 1.85 1.86 2.80 2.84 1.30 1.31 53.84H-6, 15 17 36.15 28.98 50.03 1.77 1.79 2.51 2.57 1.26 1.27 45.14H-7, 22 24 37.72 31.92 56.39 1.81 1.77 2.82 2.67 1.23 1.20 —5H-1, 108 110 39.08 29.42 51.46 1.79 1.79 2.61 2.59 1.26 1.26 14.55H-2, 141 143 40.64 30.83 55.88 1.86 1.79 2.91 2.68 1.28 1.24 49.25H-3, 100 102 41.73 27.05 51.75 1.96 1.91 2.96 2.81 1.43 1.39 49.15H-4, 128 130 43.51 27.10 50.37 1.90 1.85 2.80 2.64 1.39 1.35 30.15H-5, 124 126 44.97 22.53 44.65 2.03 1.98 2.84 2.73 1.57 1.54 43.85H-6, 66 68 45.89 26.01 48.75 1.92 1.87 2.77 2.64 1.42 1.39 —5H-7, 10 12 46.33 24.60 47.68 1.99 1.90 2.86 2.63 1.50 1.43 —
Napoli160-971A-
2H-1, 50 52 7.50 35.49 60.64 1.75 1.71 2.87 2.71 1.13 1.10 —2H-2, 50 52 9.00 47.77 83.69 1.79 1.45 5.74 2.32 0.94 0.75 32.92H-3, 50 52 10.50 35.09 60.83 1.78 1.74 2.94 2.78 1.15 1.13 —2H-4, 50 52 12.00 41.38 67.58 1.67 1.61 3.03 2.71 0.98 0.94 —
HiloBannock
BAN 89-08 2.1 50.7 55.2 1.772 1.752 2.628 2.628 1.176 1.172 65
Transition zone; mixed sediment
Milano160-970A-
18X-2, 50 52 155.00 21.84 44.16 2.07 2.01 2.90 2.74 1.62 1.57 23.122X-1, 50 52 192.20 23.84 48.06 2.07 1.96 3.03 2.75 1.57 1.49 51.1
Napoli160-971A-
2H-5, 50 52 13.50 34.63 60.85 1.80 1.74 3.01 2.76 1.18 1.14 —2H-6, 50 52 15.00 39.10 65.44 1.71 1.65 3.02 2.70 1.04 1.00 37.12H-7, 50 52 16.50 40.08 65.17 1.67 1.63 2.87 2.69 1.00 0.98 —
160-971B-3H-5, 50 52 18.20 26.88 51.80 1.97 1.92 2.99 2.82 1.44 1.40 23.3
BannockBAN 89-03 1.1 41.2 51.3 1.877 1.882 2.727 2.727 1.329 1.35 37.8
Shear Strength of SedimentsVane Shear Strength
Routine measurements during Leg 160 provided only limited datafrom Sites 970 and 971 (see Emeis, Robertson, Richter, et al., 1996).
636
For the uppermost part of the sedimentary succession (0−20 mbsf),undrained (vane) shear strength is 5−45 kPa and increases to 65−75kPa between 30 and 80 mbsf (Fig. 6). Mud breccias below 100 mbsf(found at Holes 970A and 971B) were too firm for use of the vane ap-paratus. Shear strength measurements on non-mud volcanic deposits

SEDIMENT PHYSICAL PROPERTIES AND PERMEABILITY
lneoe
s
n
dr c
nsr
o
sshwl (b ah oh
Hin osvoftroo9
oime)
range from 13 to 50 KPa at the very top to up to 120 KPa at depthsaround 120 mbsf and deeper (see Kopf et al., Chap. 49, this volume).The maximum values were dominantly obtained from sapropel lay-ers, ranging between 120 and 150 kPa, while nannofossil ooze andclay generally range from 70 to 100 kPa. In general, a trend of in-creasing strength with depth can be seen.
Results from Shear Box Tests of Leg 160 and Bannock Samples
Peak and residual shear strengths were determined from mud-vol-cano deposits, transitional sediment, and hemipelagic sediments ofthe region (see also Kopf et al., Chap. 49, this volume), and are listedin Tables 1 and 6. Drained peak strengths from Leg 160 whole-roundsamples under ~1 MPa vertical load varied from 199 to 399 kPa, giv-ing friction angles of 18°−30° ± 1° (Table 1). Drained residuastrengths of 155−338 kPa were obtained, significantly higher thathose using the vane apparatus (probably because the vane dtends to crack the sediment even when not indurated; see abShear-induced consolidation was considerable. Initial water contof the mud-volcano deposits (32.1%−42.4%) were reduced to21.4%−30.6% after shearing (see Tables 3, 4). For the nannofoooze, a peak strength of 621 kPa and a residual strength of <580were obtained under the same test conditions, giving angles of inal friction 30° ± 1° and <28° ± 1°.
The undisturbed near-surface mud-volcano sample shearelower effective stress (Table 6) shows a friction angle very similathe shallowest remolded Leg 160 samples sheared at higher effestress, with very small difference between peak and residual strethus suggesting that undisturbed samples of the mud-volcano ments behave mechanically as remolded samples. The undistutransitional sample provided a higher friction angle than the remed Leg 160 sample even with at lower effective stress.
Microfabrics observed after Leg 160 WR sample shear teshowed frequent sets of Riedel shear bands along the main zone. In addition, an enrichment of clay-grade nannofossil ooze observed in the pressure shadows of well-indurated mudstone c(0.5−3 mm across), along the main shear surface between thehalves of the shear box, or along shear bands within the sample7). Scanning electron microscope study of the shear zone and farevealed strong striations along the plane of failure. Both clastsclay minerals (chlorite and presumably smectite; see paragrapXRD results of fine-grained components above) have a preferredentation with long axes parallel to the direction of movement. Ttexture is penetrative in interval 160-971B-16X-03, 99−119 cm, butis less obvious in the transitional sediment (interval 160-971B-402, 132−150 cm). This observation, as well as the enrichment of fcarbonate mud (predominantly nannofossils) along shear bandsaround clasts might be partly explained by differences in mineraland grain size. From Tables 3 and 4 it can be seen that initial (in porosities for hemipelagic ooze and mud-volcano deposits are similar at shallow depths. Grain-size analysis of the nannofossil orecorded only the clay and silt fractions (Tables 1, 6). Thus, acompaction, particle bonding in the oozes is assumed to be less sthan in clay-rich mud-debris flow deposits. As a result, calcaremud is mobile during shearing and particulate flow occurs to regiof diminished stress (see above and Fig. 7; e.g., Borradaile, 1Knipe, 1986; Agar, 1990).
Consolidation and Permeability
Consolidation characteristics of the Bannock gravity core samplesof mud-volcano sediments are of naturally remolded soils. The csolidation curves of vertical and horizontal trims are in fact very silar to the laboratory remolded specimen, with a transition betwthe pre-compression and linear compression (on semi-log scale
viceve).nts
silkPater-
attotivegth,edi-bedld-
tsearas
aststwoFig.ricsnd onri-is
-e
andgyitu)eryze
terongusns81;
n--
enthat
0
10
20
30
40
50
0 20 40 60 80 100 120 140
970A970B
0
20
40
60
80
100
120
971A971B
Vane shear strength (kPa)
0 20 40 60 80 100 120 140
Dep
th (m
bsf)
Dep
th (m
bsf)
A
B
Vane shear strength (kPa)
Figure 6. Summary of results from vane shear strength obtained routinelyduring Leg 160 from (A) Site 970 (Milano) and (B) Site 971 (Napoli).
Natural water contents and Atterberg limits (%)
20 30 40 50 60 70 80
Mud breccia
flank
flank
base
base
base
Transition/mixed sediment
Hemipelagicsediment
crest
Figure 5. Natural water contents and Atterberg limits of samples from Leg160 and Bannock cruises (see Table 5). Closed symbols indicate Leg 160whole-round samples, open symbols are BAN specimens. Circles are mud-volcano deposits, squares are mixed sediment, and ellipses are hemipelagicooze.
637

A. KOPF, M.B. CLENNELL, A. CAMERLENGHI
638
Table 5. Water contents and Atterberg limits.
Core, section, interval (cm)Initial water content (%)
Post-shear water content (%)
Post-permeability water content (%)
Liquid limit (%)
Plastic limit (%)
Plasticity index (%)
Mud-volcano deposits:160-971B-16X-03, 99-119 42.4 51.8 24.2 53.7 29.3 24.4160-971D-3H-01, 130-150 40.3 26.4 26.4 60.2 18.2 42.1160-971B-19X-01, 130-150 35.9 30.6 — 52.7 23.1 29.5BAN-88 07-GC 46.5 — — 61 35.4 25.6BAN-89 02-GC 43.7 — — 57.6 27.4 30.2BAN-89 04-GC 38.5 — — 54.5 29.1 25.4
Transitional sediment:160-971A-4H-02, 132-150 32.1 21.4 25.8 54.6 34.7 20BAN-89 03-GC 40.0 — — 53.7 26.7 27
Hemipelagic sediment:BAN-89 08-GC 50.1 — — 51.9 34 17.9
Table 6. Results from drained shear box tests on undisturbed samples and grain-size analyses from previous cruises.
Shear test Grain size analyses
SampleDepth (mbsf)
Consolidation (kPa)
Peak strength (kPa)
φp(°)
Residual strength (kPa)
φr (°)
Clay (%)
Silt(%)
Sand (%)
Mud-volcano deposits98.1 50.8 48.8
BAN-89 2-GC < 5 27.9 26.6 58 37 5198.1 104.1 87.8
Transitional sediment98.1 59.7 59.3
BAN-89 2-GC < 5 29.1 27.8 52 38 10198.1 112.5 107.0
t a oc-tiesam-per-
eo- onanplesectag-
cannot be precisely identified (Fig. 8B). On vertical trims where aslight preconsolidation phase can be identified, the maximum pre-compression corresponds to effective stress of about 50 kPa. Slightlylarger settlement is observed in samples trimmed horizontally. Hemi-pelagic oozes, for which only vertical and horizontal trims have beenobtained, reveal a pre-consolidation phase up to effective stress of1000 kPa. In contrast to the mud-volcano sediments, the largest set-tlement is obtained on the vertically trimmed specimen. The transi-tional sediment displays a consolidation curve of intermediate char-acter between mud-volcano and hemipelagic sediments.
At 200 and 300 kPa effective stress, the hydraulic conductivity inmud-volcano sediments is higher then in transitional sediments, al-though this sample was taken more than 100 m higher up in the suc-cession (Fig. 8A; Table 2). At 500 kPa and higher effective stress,
Figure 7. Microphotograph of sheared mud-volcano Sample 160-971B-16X-03, 99−119 cm, with carbonaceous mud along the shear bands. Long axis is 2cm.
when pre-consolidation stresses were presumably exceeded, mud-volcano deposits have similar or only slightly higher hydraulic con-ductivities than the transitional sample. At 700 kPa effective stress,hydraulic conductivities of the different mud-volcano deposits dropdrastically to values between 3.26 and 7.05 × 10⁻⁹ mm/s, whereas thetransitional sediment allows only 1.31−1.55 × 10⁻⁸ mm/s flux. Thissuggests that the apparent preconsolidation stress has been increasedby the effects of “structure” (weak interparticle bonding), so thahigher stress than previously recorded is required for yielding tocur (Burland 1990; Lereouil and Vaughan, 1990). The permeabilicorrelate well with results from grain-size analyzes, where the sple without a coarse component (i.e., sand) shows the minimum meability (Sample 160-971B-16X-03, 99−119 cm).
In agreement with Olson and Daniel’s (1981) observation, thretical hydraulic conductivities calculated from oedometer teststhe Bannock specimens (Fig. 8B) are generally slightly higher ththe hydraulic conductivities measured on undisturbed core sam(Table 2). For the maximum load of 2400 kPa (not covered by dirmeasurements), hydraulic conductivities drop another order of mnitude, ranging between 7.8−9.1 × 10⁻¹⁰ mm/s. The theoretical hy-draulic conductivity of hemipelagic ooze (a crestal sample from Hilodome; Sample BAN 89-08), is more than one order of magnitudehigher than that of mud-volcano sediments. Values for the transition-al sediment (Sample BAN 89-03; Table 2) lie somewhere betweenthe hemipelagic ooze and the mud breccia. In Figure 7B, it is shownthat the theoretical hydraulic conductivity of hemipelagic oozes ishigher if calculated on the consolidation of a specimen trimmed hor-izontally, because of the preferential orientation of clay particles nor-mally settled at the seafloor. The absolute value and the trend with in-creasing effective stress of hydraulic conductivity of mud-volcanosediments is instead nearly identical in vertical and horizontal trims,as well as in remolded specimens.
Previous studies show that the permeability of clays is sensitive topore water salinities (e.g., Jose et al., 1989). Bearing in mind the ex-tremely high values of salinity measured in the crestal region of theNapoli dome (i.e., up to >300g/kg; Emeis, Robertson, Richter, et al.,

SEDIMENT PHYSICAL PROPERTIES AND PERMEABILITY
0 1 10-11 2 10-11 3 10-11 4 10 -11 5 10-11 6 10-11 7 10-11 8 10-11
Effe
ctiv
e st
ress
(kP
a)
Permeability (mm/s)
971B-16X-03
971B-19X-01971D-3H-01
971A-4H-02
A
1e-10
1e-09
1e-08
1e-07
1e-06
10 100
100
200
300
400
500
600
700
800
100001000
AXIAL TRIMS
Per
mea
bilit
y K
(mm
/s)
1e-10
1e-09
1e-08
1e-07
1e-06
TRANSVERSALTRIMS
10 100 100001000
Per
mea
bilit
y K
(mm
/s)
1e-10
1e-09
1e-08
1e-07
1e-06REMOLDED
10 100 100001000
Vertical effectivestress (kPa)
Per
mea
bilit
y K
(mm
/s)
B
Figure 8. A. Results from permeability tests on whole-round samples from Leg 160, plotted as flow rate vs. effective stress (σ′). B. Theoretical permeability, k,determined from results of oedometer tests on Bannock samples of mud breccia (filled symbols), mixed sediment (crosses), and hemipelagic ooze (circles). Notethe similarities between axial trims (top), transversal trims (middle), and remolded sediment (bottom). See text for discussion.
° ures71B ma-
1996) we may expect our values to be higher than usual. Note also thepresence of solid halite clasts in the crestal holes of Napoli dome andthat halite precipitated after we split the core onboard the JOIDESResolution as well as in the shear box (although the Leg 160 sampleswere remolded with tap de-aired, non-saline water). On the otherhand, in the constant rate of flow tests, we used distilled water toavoid damaging the delicate transducers, which may have caused theopposite effect. Tap water underestimates the permeability becausethe clay minerals swell and thereafter might partly block the pores orporous disks in the permeability cell (e.g., Olson and Daniel, 1981).However, influx of only 1−3 mL per test was necessary to reach equi-librium in samples with a pore volume exceeding 100 ml. Moreover,
the original pore fluid was partly expelled during initial consolida-tion, and remained in the tubes, and this was the first fluid to bepumped back into the samples; thereafter we alternated infusion andwithdrawal of the pump to recycle the fluids. We therefore assumethat we did not affect considerably the results of the direct permeabil-ity tests by not correctly matching permeant to the in situ pore fluid.
Temperature effects, as outlined previously (Anderson et al.,1977; Silva et al., 1989) can be ruled out for the tests, as (1) the pro-cedures were carried out in an air-conditioned laboratory at 20±0.5°C, and (2) this temperature is close to the in situ temperatwhere the samples were obtained, ~16°C at the bottom of Hole 9(Emeis, Robertson, Richter, et al., 1996). Because of the lack of
639

A. KOPF, M.B. CLENNELL, A. CAMERLENGHI
dtiche(Fs ing (
nesdrm
rs si(F.e (idute
Rging
ofsandheiontheongtonhei-silrti-tsn-udus
lson-l
nts in-playts
us aedi-or-38. to
al-ig. is
entdi-rceur-di-
and of
hem-ctedrentex-ci-d inam-as
situgashatme-
onese set-erotelytoost50c-
terial, no permeability tests were undertaken on nannofossil ooze orsapropels. However, other permeability results by previous workersrevealed that the sapropels are one hundred times more permeablethan the predominantly clay- and silt-sized hemipelagic oozes andmud breccias (Schultheiss and Gunn, 1985; Westbrook, pers. comm.,1996). This might explain the thermal alteration (i.e., high vitrinitereflectance) of sapropel beds (Emeis, pers. comm., 1996) if migrationof warm fluids can be predicted here (Westbrook et al., 1995).
DISCUSSION
Shear Strength
Regarding the results from shear tests, the dominance of mineralsother than clays is unexpected (based on the internal angle of frictiondetermined from shear tests; e.g., Kenney, 1967), whereas both XRDof the fine fraction (Robertson and Kopf, Chap. 45, this volume) andthin section study of mud-volcano deposits suggest kaolinite andsmectite as the dominant mineral phases in the matrix. However, theconcentration of calcareous mud along the shear surfaces in the de-formed (initially perfectly homogenized) sapropel, and to a lesser ex-tent in the mud breccia sample, suggest that some nannofossil ooze ispresent in all the sediments. If the amount of background sedimenta-tion is variable, high friction angles from the Bannock as well as Leg160 samples can be simply explained by variations in bulk mineralo-gy. Carbonate contents from both Bannock/Leg 160 samples are23%/21% CaCO3 for mud breccia, 38%/36% CaCO3 for transitionalsediment, and 65%/53% CaCO3 for hemipelagic ooze on average,and seem to control shear strength, plasticity and brittleness. Carbon-ate abundance is in good accordance with the friction angles deter-mined from shear tests which indicate dominance of carbonaceousmud in the matrix (Arkin and Michaeli, 1989). Only one sample(Sample 160-971B-16X-03, 99−119 cm) shows friction angles in theclay mineral range (Tables 1, 6; e.g., Skempton, 1985). The resultsdemonstrate that background sedimentation of nannofossil ooze isnot restricted to intervals of inactivity of mud volcanoes, but takesplace during phases of mud extrusion as well (see also Kopf et al.,Chap. 49, this volume).
The plasticity index, often believed to reflect the abundance ofclay and swelling mixed-layer clay minerals, mirrors the variation inclay and carbonate content. The Leg 160 sample recovered from thecrest of Napoli dome (interval 160-971D-3H-01, 132−150 cm), con-sists of gaseous “mousse-like” mud, and has a high plasticity in(Fig. 4). The remaining mud-volcano deposits show smaller plasty indices, and as carbonate contents increase (transitional and pelagic sediments), decreasing plasticity indices are obtained 5). The amount of clay with its porous, mousse-like texture allowsitu fluid venting (Limonov et al., 1994; Cita et al., 1995), but chaes dramatically if consolidated because of pore-space collapsebelow).
Permeability and Consolidation Behavior
Principally, permeabilities of hemipelagic sediments, determiboth theoretically from oedometer tests and measured directly ua back-pressured apparatus, range in the same order of magnituother marine sediments (Schultheiss and Gunn, 1985). The peability of mud-volcano deposits, however, range one to two ordemagnitude below that of clay-rich deep-sea clays from this extenstudy by Schultheiss and Gunn (1985). The permeability results 8) clearly illustrate that both differences in in situ compaction (ithe depth the sample was taken) as well as location of the holesbase, flank, crest) have no profound effects on the hydraulic contivity. Grain-size variation, too, is fairly similar for the samples tes(Tables 1, 6). However, the variable permeability of the different Wsamples may have a secondary effect on processes like plugvents or fault fissures and therefore fluid efflux (see below).
640
exi-mi-ig.n-see
dinge ase-
ofveig..,.e.,c-
d
From the consolidation test we observe that within the rangeapplied effective stresses (0−2400 kPa) the mud-volcano sedimentare more compressible than the host sediments, both in vertical horizontal direction. However, the host sediments collapse in thigher effective stress applied (>1000 kPa), where their compressindex is higher than that of the mud-volcano sediments under same load. This is because of the weak bondings developed amthe carbonate particles of the oozes and to the more rigid skeleformed by the biogenic components (Bryant et al., 1981). Also, tsettlement during consolidation of the horizontally trimmed specmen is about 60% of the vertically trimmed specimen for nannofosoozes, while the difference between the settlement of the both vecally and horizontally trimmed specimen of mud-volcano sedimenis reduced to a few percent. This is an indication of preferred orietation of the solid particles in the oozes that does not exist in the mbreccia with its nearly homogeneous microfabric. The homogeneostructure of the solid skeleton of the mud-volcano deposits is ademonstrated by the similar behavior of theoretical hydraulic coductivity found in consolidation tests on vertical trims, horizontatrims, and remolded specimen (Fig. 8B). The trend of the coefficieof consolidation of the mud-volcano sediments vs. effective stressdicates that the sediment behaves as a remolded soil. Oozes dishigher coefficient of consolidation than the mud-volcano sedimenwith a large difference between vertical and horizontal trims, thsuggesting in situ normal consolidation conditions. According tostandard geotechnical classification scheme, the mud-volcano sments are saturated or slightly over-saturated, high-plasticity inganic soils, with compression indices varying between 0.30 and 0.The sediments show strong evidence of natural reworking priorsampling.
The porosity of the mud-volcano sediments is generally lower (though highly variable) than that of the host nannofossil ooze (F4A). Consequently the wet density of the mud-volcano sedimentshigher than that of the host sediments (Fig. 4B). This is in apparcontrast with the stratigraphic position of the mud-volcano sements, which have moved upward to the sediment surface. The foof extrusion cannot be ascribed to a density difference with the srounding sediments (diapiric mode), at least near the surface. Adtional driving forces must be in the presence of gaseous phasesoverpressured fluids (e.g., Yassir and Bell, 1994). The presencegas in the mud breccia has been demonstrated on cores by geocical analyses (Emeis, Robertson, Richter, et al., 1996) and is expeto cause undersaturation in the laboratory specimen. The appasaturation and oversaturation found in our samples could be plained by the patchy distribution of the gas (e.g., derived by dissoation of gas hydrate crystals). The presence of overpressured fluithe liquid phase is supported by the observed saturation of our sples. These fluids could also contain a minor fraction of dissolved gpervasively distributed in the pore space as a result of the high in confining pressures, but then should have transformed into free after sampling and thus result in undersaturation. We conclude tpervasive gas, if present, had such low concentrations that the chanical properties of the samples were not affected.
The nearly isotropic behavior of the mud breccia to consolidatiand water flow through the pore space (Fig. 8B) suggest that thsediments hardly preserve fabrics from their ascent or subsequenttling. This observation is best explained having occurred under zeffective stress conditions and thus when the mud was compleliquefied during formation of a sedimentary diatreme according the model of Brown (1990). The mud must have generated fast, mlikely as low-viscosity debris flows. The presence of clasts up to cm across in the debris -flow deposits requires either high flow veloities or high viscosities, the matter of which can be excluded.

SEDIMENT PHYSICAL PROPERTIES AND PERMEABILITY
Implications for Mechanisms of Mud-Volcano Emplacement
Reconstruction of mud-volcano evolution provides evidence ofinterfingering of stratified mud debris flows and hemipelagites, aswell as a trend from coarse polymictic gravels to matrix-supportedmuds of variable clast contents, and subsequently mousse-like clayeysilts as the youngest mud volcano. This variation in mud-volcano de-posits must record the history of the sourcing and transport mecha-nisms (Robertson et al., 1996). The depth of origin of the mud andclasts remains in question and each must be treated separately, asthere is no clear evidence suggesting that they were derived together.It has been assumed that the mud is trapped somewhere in or beneaththe prism, resisting consolidation because of overpressuring.
The occurrence of mud domes on the accretionary prism was re-lated to backthrust faults in the inner part of the Mediterranean Ridgeaccretionary complex (Fig. 9; Camerlenghi et al., 1995). Initiation ofmud volcanism was possibly contingent on puncturing a seal ofMessinian evaporite or accreted strata, which allowed clast-bearingmuds to rise and be extruded onto the seafloor as multiple debrisflows. Propagation or reactivation of high-angle reverse faults thatintersect both the salt layers and accreted strata is postulated to breakthe seal and allow unlithified material to extrude. This mechanism re-quires pore fluid pressures in the escaping mud to be at or near litho-static values to overcome the fault-normal closure stress. This crite-
rion can be relaxed to some extent if favorably oriented wrench faultsare present (Fig. 9; Barber et al., 1986; Reed et al., 1990; Vernette etal., 1992). Alternatively, the pressure may rise to values sufficient tofracture the rock (as described for accretionary wedges; e.g., Behr-mann, 1991), so that the diapirs are actively emplaced rather thanmerely being permitted to rise under buoyancy. By studying thin sec-tions of mudstone clasts from these sediments, we found indicationsof hydrofracture (Robertson and Kopf, Chap. 45, this volume).
The overpressure in the source clay formation must be predomi-nantly primary in nature (i.e., caused by delayed consolidation) andnot acquired later, since the extruded mud is still plastic after millionsof years of burial. Realistically, this requires that the source layer isrelatively thick and of low permeability. The latter constraint, whichwe have verified experimentally, will also enhance secondary con-tributors to overpressuring that we believe to be likely in this setting:partial dehydration of the smectitic clays and thermogenic generationof gases. As with mud-volcano fields elsewhere in the world, the ex-tra pressure charge caused by methane and further gas expansion dur-ing upwards movement of the diapiric mud is probably responsiblefor the domes displaying effusive mud volcanicity at the seafloor.Variable gas and fluid supply during formation, presumably fromsome depth, is believed to be the main controlling parameter on thetiming of mud volcanic activity.
Studies of thermal maturity of organic compounds within themud-volcano deposits imply a Messinian age of the mud that has then
0 100 200 250 km
0
20
40
60
80
100
km
MohoMoho
African slope(passive margin)
Abyssalplain
Mediterranean Ridgeaccretionary complex
Hellenic trench(backstop, empty
fore-arc basin)
Crete
Aegean Sea(back-arc basin)
subduction
Northeast Southwest
50 150
NE SW
10 km
sea level
AB
incoming section
deformation frontinner escarpment
backstop
downgoing slab
backthrusts
BA
mud volcanism
Figure 9. Interpreted cross sections showing the tectonic setting of the mud volcanoes at the inner escarpment of the Mediterranean Ridge accretionary complex.The line labelled A illustrates the presumed level of the base of the Pliocene-Quaternary sediments, and the line labelled B is the interpreted base of the Messin-ian evaporites (according to Chaumillon and Mascle, 1995). For location see Figure 1.
641

A. KOPF, M.B. CLENNELL, A. CAMERLENGHI
d 9nreae
lemiw
nv
na
ox
b
o aec
f d
i
io
g
o
ural
ea
dter-
gi-ary
itsn,
for-
an
ni,.,f
.,ia-
f
undergone subduction along the décollement before it was alloweremigrate upward along backthrust faults (Schulz et al., 1997).demonstrated in the case of the Barbados (e.g., Martin et al., 1and postulated for the Nankai subduction systems, gas, predomily methane, follows the subduction trace. This implies that high-psure fluids derived deep within the subduction zone control the vation in mud-volcano activity by variable mobilization and pulsupward-migration (Yassir and Bell, 1994).
ACKNOWLEDGMENTS
The authors thank Najwa Yassir and Al Bolton for their detaisuggestions which greatly improved the manuscript. Alastair Luden is acknowledged for use of the laboratory and geotechnequipment in Earth Sciences, University of Leeds, as is Doug Stefor loan of the hydrostatic permeability cell. Graham Westbrookthanked for discussion and providing flow pumps and instrumetion for permeability tests. Funding for this research was receithrough DFG Grant Be-1041/10 and NERC Grant GST 02/835.
REFERENCES
Agar, S.M., 1990. The interaction of fluid processes and progressive defor-mation during shallow level accretion: examples from the Shimanto Beltof SW Japan. J. Geophys. Res., 95:9133−9148.
Anderson, R.N., Langseth, M.G., and Sclater, J.G., 1977. The mechanisms ofheat transfer through the floor of the Indian Ocean. J. Geophys. Res.,82:3391−3409.
Arkin, Y., and Michaeli, L., 1989. Strength and consistency of artificial clay-carbonate mixtures: simulation of natural sediments. Eng. Geol., 26:201−213.
ASTM, 1990. Standard test method for measurement of hydraulic conductiv-ity of saturated porous materials using a flexible wall permeameter. Phil-adelphia (Am. Soc. Testing and Mater.), D5084.
————, 1991. Standard test method for direct shear tests of soils uconsolidated drained conditions. Philadelphia (Am. Soc. Testing Mater.), D3080-90.
Barber, A.J., Tjokrosapoetro, S., and Charlton, T.R., 1986. Mud volcanshale diapirs, wrench faults, and melanges in accretionary compleEastern Indonesia. AAPG Bull., 70:1729−1741.
Behrmann, J.H., 1991. Conditions for hydrofracture and the fluid permeaity of accretionary wedges. Earth Planet. Sci. Lett., 107:550−558.
Bjerrum, L., 1954. Geotechnical properties of Norwegian marine clays. Geo-technique, 4:49−69.
Borradaile, G.J., 1981. Particulate flow and the formation of cleavage. Tec-tonophysics, 72:305−321.
Boyce, R.E., 1976. Definitions and laboratory techniques of compressisound velocity parameters and wet-water content, wet-bulk density,porosity parameters by gravimetric and gamma-ray attenuation tniques. In Schlanger, S.O., Jackson, E.D., et al., Init. Repts. DSDP, 33:Washington (U.S. Govt. Printing Office), 931−958.
Breen, N.A., Silver, E.A., and Hussong, D.A., 1986. Structural styles oaccretionary wedge south of the island of Sumba, Indonesia, revealeSEAMARC II side scan sonar. Geol. Soc. Am. Bull., 97:1250−1261.
Brown, K.M., 1990. The nature and hydrogeologic significance of mud dpirs and diatremes for accretionary systems. J. Geophys. Res., 95:8969−8982.
Brown, K.M., and Westbrook, G.K., 1988. Mud diapirism and subcretionthe Barbados Ridge accretionary complex: the role of fluids in accretary processes. Tectonics, 7:613−640.
Bryant, W.R., Bennett, R.H., and Katherman, C.E., 1981. Shear strenconsolidation, porosity, and permeability of oceanic sediments. In Emil-iani, C. (Ed.), The Sea (Vol. 7): The Oceanic Lithosphere: New York(Wiley), 1555−1616.
Bryant, W.R., Hottman, W., and Trabant, P., 1975. Permiability of unconsdated and consolidated marine sediments, Gulf of Mexico. Mar. Geotech-nol., 1:1−14.
642
toAs96)ant-s-ri-d
ds-calartista-ed
dernd
es,es,
il-
nalndh-
an by
a-
inn-
th,
li-
BS 1377, 1991. Methods of test for soils for civil engineering purposes. Brit.Stand. Inst.
Burland, J.B., 1990. On the compressibility and shear strength of natclays. Geotechnique, 40:329−378.
Camerlenghi, A., 1991. Il diapirismo d’argilla sulla Dorsale Mediterran[Ph.D. thesis]. Univ. of Milano.
Camerlenghi, A., Cita, M.B., Della Vedova, B., Fusi, N., Mirabile, L., anPellis, G., 1995. Geophysical evidence of mud diapirism on the Mediranean Ridge accretionary complex. Mar. Geophys. Res., 17:115−141.
Camerlenghi, A., Cita, M.B., Hieke, W., and Ricchiuto, T.S., 1992. Geolocal evidence for mud diapirism on the Mediterranean Ridge accretioncomplex. Earth Planet. Sci. Lett., 109:493−504.
Casagrane, A., 1936. The determination of preconsolidation load andpractical significance. In Casagrande, A., Rutledge, P.C., and WatsoJ.D. (Eds.), Proc. 1st Int. Conf. Soil Mech. Found. Eng., Am. Soc. Civ.Eng., 3:60−64.
Casagrande, A., 1948. Classification and identification of soils. Trans. Am.Soc. Civ. Eng., 113:901−992.
Chaumillon, E., and Mascle, J., 1995. Variation laterale des fonts de demation de la Ride mediterraneenne (Mediterranee orientale). Bull. Soc.Geol. Fr., 166:463−478.
Cita, M.B., and Camerlenghi, A., 1990. The Mediterranean Ridge asaccretionary prism in collision context. Mem. Soc. Geol. Ital., 45:463−480.
Cita, M.B., Camerlenghi, A., Erba, E., McCoy, F.W., Castradori, D., CazzaA., Guasti, G., Giambastiani, M., Lucchi, R., Nolli, V., Pezzi, GRedaelli, M., Rizzi, E., Torricelli, S., and Violanti, D., 1989. Discovery omud diapirism in the Mediterranean Ridge: a preliminary report. Boll.Soc. Geol. Ital., 108:537−543.
Cita, M.B., Woodside, J.M., Ivanov, M.K., Kidd., R.B., and Limonov, A.F1995. Fluid venting from a mud volcano in the Mediterranean Ridge dpiric belt. Terra Nova, 7:453−458.
Clennell, M.B., 1992. The mélanges of Sabah, Malaysia [Ph.D. thesis]. Univ.London.
Cronin, B.T., Ivanov, M.K., Limonov, A.F., Egorov, A., Akhmanov, G.G.,Akhmetjanov, A.M., Kozlova, E.V., and Shipboard Scientific Party TTR-3, 1997. New discoveries of mud volcanoes on the Eastern MediterraneanRidge. J. Geol. Soc. London, 154:173−182.
Demars, K.R., and Chaney, R.C. (Eds.), 1992. Geotechnical properties,behaviour and performance of calcareous soils. Am. Soc. for Testing andMater., ASTM STP 777.
Emeis, K.-C., Robertson, A.H.F., Richter, C., et al., 1996. Proc. ODP, Init.Repts., 160: College Station, TX (Ocean Drilling Program).
Flecker, R., and Kopf, A., 1996. Data report: clast and grain size analysis ofsediment recovered from the Napoli and Milano mud volcanoes, EasternMediterranean. In Emeis, K.-C., Robertson, A.H.F., Richter, C., et al.,Proc. ODP, Init. Repts., 160: College Station, TX (Ocean Drilling Pro-gram), 529−532.
Fowler, S.R., White, R.S., and Louden, K.E., 1985. Sediment dewatering inthe Makran accretionary prism. Earth Planet. Sci. Lett., 75:427−438.
Head, K.H., 1980. Manual of Soil Laboratory Testing (Vol. 1): Soil Classifi-cation and Compaction Tests (1st ed.): New York (Halsted Press/Wiley).
Henry, P., Le Pichon, X., Lallemant, S., Foucher, J.-P., Westbrook, G., andHobart, M., 1990. Mud volcano field seaward of the Barbados accretion-ary complex: a deep-towed side scan sonar survey. J. Geophys. Res.,95:8917−8929.
Jose, U.V., Bhat, S.T., and Nayak, B.U., 1989. Influence of salinity on per-meability characteristics of marine sediments. Geotechnology, 8:249−258.
Kenney, T.C., 1967. The influence of mineralogical composition on the resid-ual strength of natural soils. Proc. Geotech. Conf. Shear Properties oSoils and Rocks, Oslo, 1:123−129.
Knipe, R.J., 1986. Deformation mechanism paths for sediments undergoinglithfication. Mem.?Geol. Soc. Am., 166:151−160.
Kopf, A., Robertson, A.H.F., Clennell, M.B., and Flecker, R., in press. Mech-anisms of mud extrusion on the Mediterranean Ridge AccretionaryPrism. Geo-Mar. Lett.
Kopf, A., Sample, J.C., Bauer, P., Behrmann, J.H., and Erlenkeuser, H., 1995.Diagenetic carbonates from Cascadia Margin: textures, chemical compo-sitions, and oxygen and carbon stable isotope signatures. In Carson, B.,Westbrook, G.K., Musgrave, R.J., and Suess, E. (Eds.), Proc. ODP, Sci.

SEDIMENT PHYSICAL PROPERTIES AND PERMEABILITY
ty
at
d-
s-
es,ore
Results, 146 (Pt 1): College Station, TX (Ocean Drilling Program), 117−136.
Lambe, T.W., and Whitman, R.V., 1969. Soil Mechanics: New York (Wiley). Lee, H.J., 1985. State of the art: laboratory determination of the strength of
marine soils. In Chaney, R.C., and Demars, K.R. (Eds.), Strength Testingof Marine Sediments: Laboratory and In-Situ Measurements: ASTMSpec. Tech. Publ., 883:181−250.
Lerouiel, S., and Vaughan, P.R., 1990. The general and congruent effects ofstructure in natural soils and rocks. Geotechnique, 40:467−488.
Limonov, A.F., Woodside, J.M., and Ivanov, M.K. (Eds.), 1994. Mud Volcan-ism in the Mediterranean and Black Seas and Shallow Structure of theEratosthenes Seamount. Initial Results of the Geological and Geophysi-cal Investigations during the Third “Training-through-Research” Cruiseof the R/V Gelendzhik (June−July 1993). UNESCO Rep. Mar. Sci., 64.
Lupini, J.F., Skinner, A.E., and Vaughan, P.R., 1981. The drained residualstrength of cohesive soils. Geotechnique, 31:181−213.
Maltman, A. (Ed.), 1994. The Geological Deformation of Sediments: London(Chapman & Hall).
Martin, B.M., Kastner, M., Henry, P., Le Pichon, X., and Lallement, S., 1996.Chemical and isotopic evidence for sources of fluids in a mud volcanofield seaward of the Barbados accretionary wedge. J. Geophys. Res.,101:20325−20345.
Moore, R., 1991. The chemical and mineralogical controls upon the residualstrength of pure and natural clays. Geotechnique, 41:35−47.
Olson, R.E., and Daniel, D.E., 1981. Measurement of the hydraulic conduc-tivity of fine-grained soils. In Zimmie, T.F., and Riggs, C.O. (Eds.), Per-meability and Groundwater Contaminant Transport. ASTM Spec. Tech.Publ., 746:18−64.
Reed, D.L., Silver, E.A., Tagudin, J.E., Shipley, T.H., and Vrolijk, P., 1990.Relations between mud volcanoes, thrust deformation, slope sedimenta-tion and gas hydrates, offshore north Panama. Mar. Pet. Geol., 7:44−54.
Robertson, A., and Ocean Drilling Program Leg 160 Scientific Party, 1996.Mud volcanism on the Mediterranean Ridge: Initial results of OceanDrilling Program Leg 160. Geology, 24:239−242.
Schultheiss, P.J., and Gunn, D.E., 1985. The permeability and consolidationof deep-sea sediments. Inst. Oceanogr. Sci. Rep., 201.
Schulz, H.M., Emeis, K.C., and Volkmann, N., 1997. Organic carbon prove-nance and maturity in the mud breccia from the Napoli mud volcano:indicators of origin and burial depth. Earth Planet. Sci. Lett., 144:141−151.
Shipley, T.H., Stoffa, P.L., and Dean, D.F., 1990. Underthrust sediments,fluid migration paths, and mud volcanoes associated with the accretion-ary wedge off Costa Rica: Middle America trench. J. Geophys. Res.,95:8743−8752.
Silva, A.J., Hetherman, J.R., and Calnan, D.I., 1989. Low-gradient perme-ability testing of fine-grained marine sediments. In Zimmie, T.F., andRiggs, C.O. (Eds.), Permeability and Groundwater Contaminant Trans-port. ASTM STP, 746:121−136.
Skempton, A.W., 1964. The long term stability of clay slopes. Geotechnique,14:77.
Skempton, J.A.W., 1985. Residual strength of clays in landslides, foldedstrata and the laboratory. Geotechnique, 35:3−18.
Tavenas, F., Leblond, P., Jean, P., and Leroueil, S., 1983a. The permeabilityof natural soft clays. Part 1: Methods of labororatory measurement. Can.Geotech. J., 20:629−644.
————, 1983b. The permeability of natural soft clays. Part 2: Permeabilicharacteristics. Can. Geotech. J., 20:645−660.
Taylor, E., and Leonard, J., 1990. Sediment consolidation and permeabilitythe Barbados forearc. In Moore, J.C., Mascle, A., et al., Proc. ODP, Sci.Results, 110: College Station, TX (Ocean Drilling Program), 289−308.
Vernette, G., Mauffret, A., Bobier, C., Briceno, L., and Gayet, J., 1992. Mudiapirism, fan sedimentation and strike-slip faulting, Caribbean Colombian Margin. Tectonophysics, 202:335−349.
Westbrook, G.K., and MEDRIFF Consortium, 1995. Three brine lakes dicovered in the seafloor of the Eastern Mediterranean. Eos, 76/33:313−315.
Yassir, N., 1990. The undrained shear behavior of fine sediments. In Knipe,R.J., and Rutter, E.H. (Eds.), Deformation Mechanisms, Rheology andTectonics. Geol. Soc. Spec. Publ. London, 54:399−404.
Yassir, N.A., and Bell, J.S., 1994. Relationships between pore pressurstresses and present-day geodynamics in the Scotian Shelf, OffshEastern Canada. AAPG Bull., 78:1863−1880.
Date of initial receipt: 27 January 1997Date of acceptance: 22 June 1997Ms 160SR-049
643