49. analysis of noise on digital sonic log … on digital sonic log data - .. .. r.authors: bernard...
TRANSCRIPT

Wise, S. W., Jr., Schlich, R., et al., 1992Proceedings of the Ocean Drilling Program, Scientific Results, Vol. 120
49. ANALYSIS OF NOISE ON DIGITAL SONIC LOG DATA AT LEG 120 SITES. DERIVEDSYNTHETIC SEISMOGRAM AND CORRELATION WITH MCS DATA AT SITE 7471
Bernard Fritsch,2 Marc Munschy,2 and Fatmir Fezga2
ABSTRACT
During Leg 120, weather conditions and time constraints restricted logging operations to Sites 747 and 750; onlythe seismic-stratigraphic combination was run at these sites. For some intervals, the sonic digital tool producedextremely noisy velocity logs that made interpretation of the data very difficult, even impossible. Three types ofnoise were observed: phase skipping, oscillations caused by noncompensated heave, and discrete aberrant velocityvalues. The heave-related oscillations recorded on the velocity logs were eliminated by deriving a simple modelsimulating the tool movement. The aberrant velocity values, essentially caused by failures in recording the signalfrom one of the two transmitters, were eliminated by inspection of the individual waveforms using an interactivesoftware package. This software program was also used to pick the compressional arrival time. A composite velocitylog accounting for all these corrections and complemented for the unlogged part of the hole with the core-measuredvelocities was used to derive a synthetic seismogram at Site 747. The synthetic seismogram was correlated with amultichannel seismic reflection profile and the lithologic units, which allowed us to define four seismic sequencesthat could be identified with the K2-K3, P1-P2, PN1, and NQ1 sequences of the Raggatt Basin in the SouthernKerguelen Plateau.
INTRODUCTION
Holes 747C and 750A were logged during Ocean DrillingProgram (ODP) Leg 120. Because of bad weather conditionsand time limitations, only the seismic-stratigraphic combina-tion including the phasor induction tool (DITE), the naturalgamma-ray spectroscopy tool (NGT), the digital sonic tool(SDT), and the multi-caliper tool (CAL), was run at both sites(Schlich, Wise, et al., 1989, "Explanatory Notes" chapter).The logged interval expands from 115 to 337 m below seafloor(mbsf) at Hole 747C and from 51 to 453 mbsf at Hole 750A.Except for the first 100 m logged at Hole 750A, the wirelineheave compensator did not work. Only the SDT logs seem tohave been badly affected by this failure. The sonic logs wereunreadeable on board over the intervals from 193 to 232 mbsfand from 298 to 337 mbsf at Hole 747C (Schlich, Wise, et al.,1989, "Site 747" chapter) and over the intervals from 145 to170 mbsf and from 220 to 290 mbsf at Hole 750A (Schlich,Wise, et al., 1989, "Site 750" chapter). The resistivity and thegamma-ray logs were of good quality, which permitted theLeg 120 scientists to identify log units along the two holes. Tocorrelate the seismic reflectors observed on the multichannelseismic reflection (MCS) Profile MD 47-03 with the lithologicunits at Site 747, a synthetic seismogram, restricted to thelogged interval between 115 and 337 mbsf, was computed onboard (Schlich, Wise, et al., 1989, "Site 747" chapter). Thissynthetic seismogram was derived from very poor qualitydata; moreover, it did not account for all the characteristics ofthe seismic source.
In this paper, we present a detailed analysis of the SDTmeasurements at Holes 747C and 750A, evaluate the noiselevel affecting the logging data, and finally compute correctedvelocity logs. Using data from Hole 747C, an impedance log
1 Wise, S. W., Jr., Schlich, R., et al., 1992. Proc. ODP, Sci. Results, 120:College Station, TX (Ocean Drilling Program).
2 Institut de Physique du Globe, Université Louis Pasteur, Laboratoire deGéophysique Marine (CNRS UA 323), 5 rue Rene Descartes, 67084 StrasbourgCedex, France.
was built from the corrected velocity log, combined with andcomplementing the physical properties measurements. Thisimpedance log was used to derive a synthetic seismogram thatwas correlated with Profile MD 47-03. At Hole 750A, theimpedance log and the derived synthetic seismogram werealso calculated and are described in Fritsch et al. (thisvolume).
DESCRIPTION OF THE DIGITAL SONIC TOOLThe SDT deployed during Leg 120 contains, from bottom
to top, two transmitters (S1 and S2), spaced 0.61 m (2 ft) apartand two receivers (Rl and R2), spaced 0.61 m (2 ft) apart.Receiver Rl is located 0.91 m (3 ft) above transmitter S2. Inaddition a group of eight receivers (RL1-RL8), spaced 0.15 m(0.5 ft) apart, is located 2.43 m (8 ft) above transmitter S2 (Fig.1). All the receivers record a full waveform, 5 ms long, with asample rate of 10 µs. Only eight full waveforms were recordedduring Leg 120 because of computer failures. The centerfrequency of the sonic signal is 12 kHz.
To produce a sonic log, the SDT measures transit timesinside the formation surrounding the borehole. As the geom-etry of the SDT is precisely known, it is easy to calculate thevelocities. On board, waveforms are recorded and a specificsoftware program computes transit times. Compensation ofthe inclination of the tool along the borehole wall is achievedby memorizing the first transit time reading and averaging itwith a second reading obtained after the probe has been pulledup a given distance (Fig. 2).
Using all combinations of the eight transit times, fourslownesses were computed and named DT, DTL, DTLN, andDTLF. Each slowness, given in s/m, is based on four arrivaltime readings (Table 1). The velocity, in m/s, is directlyobtained from the slowness. In this paper, DT, DTL, DTLN,and DTLF will refer to velocity values and not to slownesses.
WAVE PROPAGATION IN BOREHOLESBiot (1952) has developed a theory of propagation of elastic
waves in boreholes. Cheng and Toksöz (1981) and Paulet andWhite (1982) have described the different modes of propaga-
907

B. FRITSCH, M. MUNSCHY, F. FEZGA
7x6"
3 1
2'
3 1
2'
RL5Ji
RLii
R2
R1 f
S2 t
S1
t t 5 t t 7
A " 6 A
t t 2
tt 1 tt3
tt2
I
i
hė*tJ^\/^
liAAtt4
t t 5
t t β
t t 7
t t β
Figure 1. Diagram illustrating the digital sonic tool (SDT) configuration. Transmitters are S1 and S2; receivers are Rl, R2, RL1, and RL5.The four shorter transit times (ttl-tt4) have different delay times than the four longer transit times (tt5-tt8).
tion in boreholes. Acoustic wave packets are emitted, propa-gate in the fluid-filled hole, and interact with the formation, theborehole, and the borehole wall. The receivers record, insome cases, a refracted compressional wave followed by arefracted shear wave and/or a direct compressional wave thatpropagates in the fluid. Normal modes and Stoneley waves arealso recorded. Compressional and shear arrival times dependon the physical properties of the rock formation. Normalmodes are sensitive to the borehole radius as well as therigidity of the rock formation. Stoneley waves are mostsensitive to the borehole radius and to the borehole wallrugosity, which may be related to the fracturing of the rockformation in hard rock such as basalt (Paulet and White,1982).
In hard formations, such as in fresh basalt or limestones,compressional, shear, and other arrival times are well defined.In soft formations, with velocities ranging from 1500 to 2000m/s, the different waves can be more difficult to identify(Winbow, 1988) and the refracted waves can be missed. Chengand Toksöz (1981) provide a more detailed description of theeffect of rock type on sonic waveforms.
DESCRIPTION OF THE NOISESonic data at Holes 747C and 750A are badly affected by
noise. At some depths, records are so noisy that the signal ofthe transmitters cannot be recognized. The two velocitiesDTLF and DTLN, determined from the longest transit time,appear to be much more affected by the noise than the twoother velocities and will not be used in this paper. Three typesof noise were identified (Fig. 3):
Type 1: signal decay or phase skipping that is easy to detectand to correct;
( Ptt1
- 1.5 ft)
t t2~( p -2.5 ft)
R 2 i
Rir
S 2 t
S1
R2t
S2
S1
tt4<P + 1.5 ft)
tt2( p +2.5 ft)
DT<p)
Figure 2. Principle of SDT slowness measurement at depth p cor-rected for the inclination of the tool. The first set of transit times(ttl—tt4) are averaged with a second set of transit times (tt2-tt4)obtained after the probe has been pulled up by 5 ft.
908

NOISE ON DIGITAL SONIC LOG DATA
Table 1. Slownesses computed from four transit time readings.
0.6096 DTp0.6096 DTLp0.6096 DTLNp0.6096 DTLFp
= (ttlp= (tt3 p
= (ttSp= (K7p
- 3 ~ tt2p - 5)- 5 - " 4 p _ 7 )
- 8 - tt(>p - lθ)- 10 ~ l t°p - 12)
+ (tt4+ (ttf[!+ (tt8pf (tl7p
+ 3 " " 2 p
+ 5 - ttlp+ 8 - tt6p+ 10 ~ l " p
+ 5)+ 7)+ io)+ 12)
Notes: ttj = transit time corresponding to the j waveform (Fig. 1). Index p +i = (p + 0 t h depth sample.
Type 11.7-
1.5-
1.3
km/s
2 . 8 -
2.6
2.4 J
100 yus
10 samples
Type 3 Type 3
Figure 3. Noise types observed on SDT velocity curves. Type 1 noise:phase skipping. Type 2 noise: variations of velocity related to the toolmovement. Type 3 noise: aberrant velocity values.
Type 2: oscillations of transit times with a periodicity ofabout 1 m that cause apparent velocity variations of 150-200m/s; and
Type 3: isolated peaks that correspond to one or threevalues with aberrant amplitude.
Type 1 Noise
Type 1 noise was encountered once in Hole 747C (at 170mbsf) and four times in Hole 750A (134, 145-170, 220-245,and 375-410 mbsf). This type of noise was removed on board(Schlich, Wise, et al., 1989, "Site 747" and "Site 750"chapters). Type 2 noise aflfects all the SDT logs, and Type 3noise was clearly observed between 210 and 240 mbsf at Hole747C and affected largely the lower part of the Hole 750A.These two last types of noise could not be removed on boardduring Leg 120.
After completing Leg 120, Schlumberger reprocessed theSDT signals. The resulting velocity log at Hole 750A isglobally of good quality, but at Hole 747C the velocity valuesin the basalt are too small compared to the core velocitydeterminations. The sediment/basalt contact is also not welldefined on this later velocity log.
Type 2 Noise
All logging curves show oscillations along the logged inter-vals, with periodicities ranging from 1 to 5 m. On SDT logs thisnoise corresponds to an amplitude of 20 µs on transit times or150-200 m/s on velocities. The tension log corresponds to thetension measured on the cable during the logging operation andshows regular variations of 500 lb with a period of 1 m at Hole
10 samples
Figure 4. Tool string movement during pull up. Top, proposed model(dashed line) compared with the tension curve (solid line). Bottom,movement of the toolstring resulting from modeling.
747C (Fig. 4). These variations have the same period as the shipmotions, and, because such periods are seen on all other logs, wehave related these variations to the ship motions.
During logging at Hole 747C, winds exceeded 50 kt andconfused swells caused the ship to have a vertical heave of3-4 m, with a period of 5-6 s; this strong heave caused thecompensator to "trip out" (Schlich, Wise, et al., 1989, "Site747" chapter). At Hole 750A the heave compensator onlyoperated for the first 100 m of logging; in this interval, thetension curve showed small oscillations that did not affect theother logging curves.
Movement of the logging probe in the borehole was ob-tained by combining the upward displacement of the loggingcable with the ship heave. The ship heave was modeled by asinusoidal function of 3-m amplitude and periods ranging from2 to 6 s. The cable velocity was assumed to be constant (7cm/s, 850 ft/hr) and the sampling rate was 0.15 m (0.5 ft) or 2s; we neglected to account for the elasticity of the cable. Theprobe movement computed with these parameters has thesame phases as the measured tension curve (Fig. 4). Theamplitudes of the signal were not modeled because we did notknow the weight of both the cable and the logging probe. Thismodel shows that there is a maximum of six samples (0.9 m)between the first and last reading at a given depth. If wesuppose that the tool is at a particular depth, its real positionis, in fact, centered somewhere on a 0.9-m interval. Conse-quently, uncompensated ship heave decreases the verticalresolution to 0.9 m. Thus, data are oversampled and must beaveraged. Type 2 noise is filtered by convolving the loggingcurves with a triangle function of seven samples (a weightedcentered running average was applied).
Type 3 Noise
Isolated velocity peaks always correspond to Type 3 noiseand never to the occurrence of a thin layer ( 0.3 m thick) withhigh velocity: all transit times would be affected by the highvelocity of the thin layer; this was not observed. Type 3 noisewas caused by an erroneous reading of one arrival time; and,from Table 1, we see that an erroneous transit time ttj at depthp causes a positive or negative jump of velocity at one or twospecific depths (Table 2), as observed in the data. Every timeType 3 noise was encountered, it affected three successivesamples of one ttj.
909

B. FRITSCH, M. MUNSCHY, F. FEZGA
Table 2. Occurrence of velocity jumps on DT andDTL caused by an erroneous transit time reading
DT
DTL
ttl
(+)p +
(-)p -
3
7
tt2
(—)p ~^~(—)p —
N o n e
55
tt3
N o n e
( + ) p +( + ) p —
55
tt4
(—)p ~^~
3
7
Notes: An error on ttl on the pth sample caused a positivejump (+) on DT at the (p + 3)th sample and a negativejump - on DTL at the (p - 7)th sample.
Type 3 noise was easily removed except in two intervals atHole 747C (188-228 and 288-337 mbsf), where too manyaberrant transit time readings occurred (Figs. 5 and 6). Inthese cases, a low-frequency with high-amplitude signal wassuperimposed on the waveforms (Fig. 7) emitted by SourceS1. The low-frequency noise looks like background noiseoveramplified during the recording of a waveform. A misfire atSource S1 is mainly responsible for Type 3 noise.
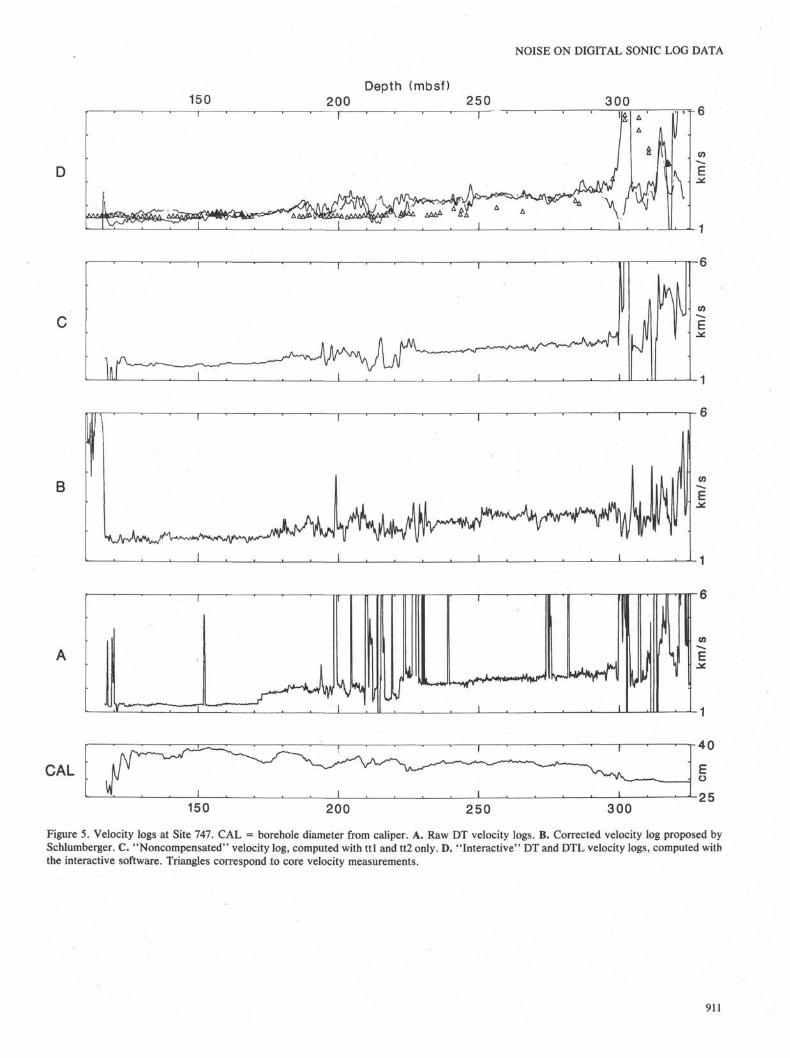
It was not possible to filter this low-frequency noisewithout losing the first arrival on the waveform; we removedtype 3 noise by using transit time readings related only toTransmitter S2 (ttl and tt2). The corresponding "noncompen-sated" velocity logs are shown in Figures 5 and 6; aberranttransit time readings are replaced by the mean of the twoneighboring values. Although these logs are not correctedfrom the tool inclination, they appear better than the raw logsand the proposed Schlumberger logs, especially at Hole 750A,from 170 to 220 mbsf, where the Schlumberger log shows a lotof velocity variations not seen on both the raw velocity logand our "noncompensated" velocity log. However, at Hole747C, the derived velocities are too low ( 1500 m/s) in someplaces of the 188-228-mbsf interval, suggesting a bad arrivaltime picking.
To study these zones of abnormal low velocity values, asoftware package that displays the waveforms on a computergraphic screen was developed to pick the compressionalarrival times manually. The "interactive" DT and DTLcurves, shown in Figure 5, are computed from four arrivaltimes. To test the validity of the velocity determination, wehave expanded the computation to the entire logged interval;the corresponding DT and DTL velocity logs fit much betterwith the physical properties measurements. With the excep-tion of four specific zones where DT is either lower or higherthan DTL, the two logs are very similar:
1. From 115 to 175 mbsf, DT velocity values are 1500m/s, whereas DTL velocity values are higher. At these depths,the borehole diameter is 37-38 cm, and the formation veloc-ity, deduced from the DTL log, is about 1600 m/s; with theseparameters the critical offset (minimal offset to have a com-pressional refracted wave) is near the first receiver (Rl). If theoffset of the receiver is slightly longer than the critical offsetthe arrival time difference between the formation compres-sional wave and the fluid compressional wave should be only40 µs (four samples) for the 3-ft (0.91 m) transit time, 60 µs(six samples) for the 5-ft (1.52 m) transit time, and 90 µs (ninesamples) for the 7-ft (2.13 m) transit time. Thus, it is obviousthat the formation compressional arrival time should be readon the long spacing measurement (DTL).
2. From 210 to 220 mbsf, the same situation is encounteredwithDT< 1500 m/s.
3. From 220 to 228 mbsf and from 297 to 305 mbsf, the DTLvelocity values are too low in comparison with the DTvelocity values. These differences are explained at both
intervals by errors on the tt3 readings that correspond to thelongest transit time (7 ft, 2.13 m). The compressional waverecognized on the full waveforms has a very low amplitudecompared with other waves, and thus cycle skipping mayaffect the readings. The compressional wave attenuation inthis part of the hole is higher, possibly because of formationfractures, inhomogeneous sections, or rough borehole wallconditions.
Velocity Log Used for the Synthetic SeismogramAs shown previously, the "interactive" DT and DTL logs
give the best estimation of the formation velocity. However,depending on the depth, we have chosen either DT or DTLlogs. From 115 to 175 mbsf and from 210 to 220 mbsf, the DTLvelocity was used; from 220 to 228 mbsf and from 297 to 305mbsf, the DT velocity was used. Outside of these intervals,the DT and DTL logs are identical. The corresponding "com-posite" velocity log agrees well with the log unit subdivisions(Schlich, Wise, et al., 1989, "Site 747" chapter). Outside ofthe 115-337 mbsf interval, we completed the velocity log withvelocity measured on cores and corrected from decompactionusing porosity values (Fritsch et al., this volume). The expo-nential variation of porosity with depth (porosity = measuredporosity • expf-K depth]) was used with a formation coeffi-cient K of 0.0004 for the upper interval (0-115 mbsf) and of 0.0for the basalts in the lower interval (337-350 mbsf). Weidentified this resulting velocity log as the "composite velocitylog," and we used the results to compute the syntheticseismogram.
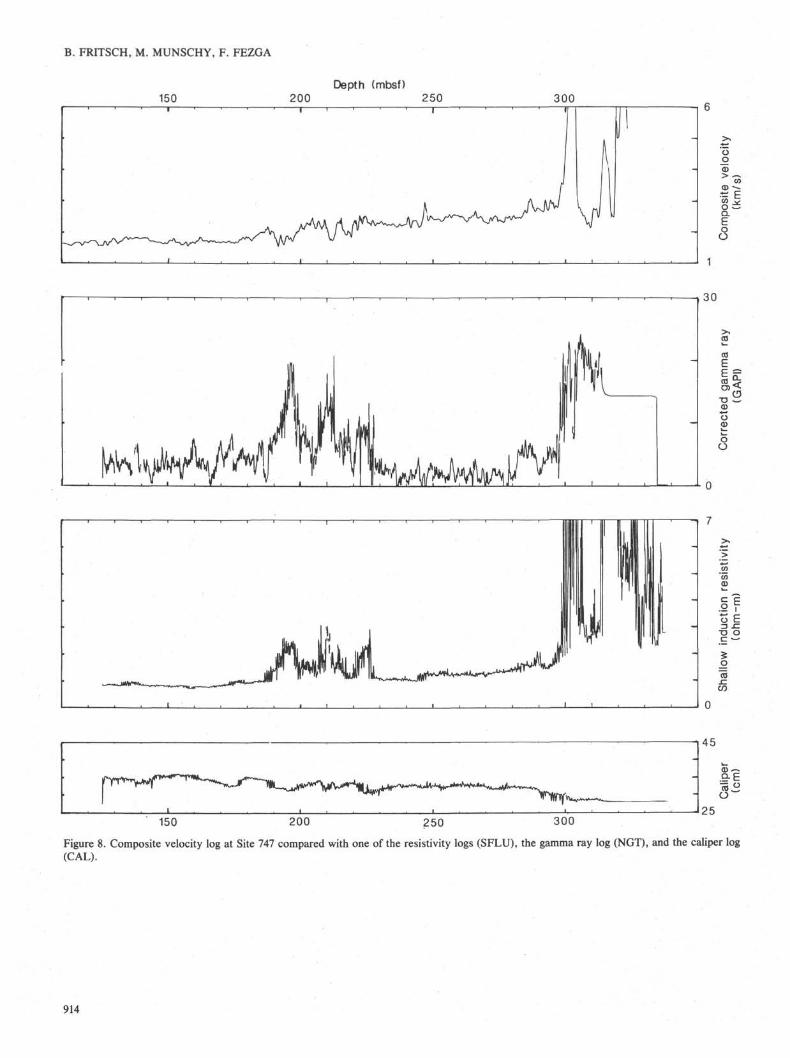
DESCRIPTION OF DT AND DTL LOGS AT SITE 747Taking into account the composite velocity log, we are able
to explain more accurately the different log units (Fig. 8)defined by the scientists on Leg 120 (Schlich, Wise, et al.,1989, "Site 747" chapter, pp. 139-143).
Log Unit 1Between 115 and 188 mbsf, velocity increases slowly and
smoothly from 1600 up to 2000 m/s. This increase in velocitymay indicate a decrease in porosity caused by the compactionof sediments.
Log Unit 2Between 188 and 228 mbsf, three low-velocity intervals
were recognized (188-198, 208-212, and 217-220 mbsf); theyare associated with anomalous values of resistivity andgamma ray. Between 220 and 228 mbsf, DTL velocities aretoo low because they are affected by Type 3 noise. Log Unit2 is divided in two subunits. The upper part, between 188 and200 mbsf, is characterized by a mean velocity of 1700-1900m/s, high resistivity, and high gamma-ray values. The lowerpart, between 200 and 228 mbsf, has a mean velocity of 2300m/s and is interbedded by two layers (208-212 and 217-220mbsf); the lower velocity was estimated at 1800-2000 m/s. Thefirst layer is associated with high gamma-ray values and aresistivity peak, the second with lower gamma-ray values andlow resistivity. The transition between Log Units 2 and 3 doesnot correspond to a major velocity change.
Log Unit 3Between 228 and 297 mbsf, velocity increases slowly with
depth, suggesting compaction of sediments. At 245 mbsf, DTand DTL velocity logs differ (Fig. 5); this difference may berelated to heterogeneities in the chalk section.
Log Unit 4The sediment/basalt contact was reached by drilling at 297
mbsf. At this depth, an abrupt change of velocity from 2800 to
910
NOISE ON DIGITAL SONIC LOG DATA
150
- . . . .
i
2001
Depth (mbsf)250 300
£l Δ Δ ** \ l
Δ
Δ A r.CO
B
CAL
150 200 2 5 0 3 0 0
Figure 5. Velocity logs at Site 747. CAL = borehole diameter from caliper. A. Raw DT velocity logs. B. Corrected velocity log proposed bySchlumberger. C. "Noncompensated" velocity log, computed with ttl and tt2 only. D. "Interactive" DT and DTL velocity logs, computed withthe interactive software. Triangles correspond to core velocity measurements.
911

B. FRITSCH, M. MUNSCHY, F. FEZGA
100
l r ^vur ^ "•
200
Jl
Depth (mbsf)300
- l
4*
Δ
^ ^ Δ Δ Δ
400
£ a
w
CAL
100 200 300 400
Figure 6. Velocity log at Site 750. CAL = borehole diameter from caliper. A. Raw DT velocity logs. B. Corrected velocity log proposed bySchlumberger. C. "Noncompensated" velocity log, computed with ttl and tt2 only. Triangles correspond to core velocity measurements.
more than 6000 m/s was observed. The velocity values ob-tained between 297 and 306 mbsf (log Subunit 4A) are indic-ative of basalt velocity values, but as they exceed 6000 m/sthey are certainly overestimated. The large discrepancy be-tween the DT and DTL logs is indicative of highly fracturedbasalts. Between 306 and 320 mbsf (log Subunits 4B and 4C),the mean velocity is about 2700-2800 m/s; this interval showsa high velocity (4000-5000 m/s) between 313 and 318 mbsf (logSubunit 4C) that corresponds to massive basalt flows (Cores120-747C-12R-1 and -13R-1) emplaced between brecciatedbasalts with clays. Between 320 and 337 mbsf (log Subunit
4D), a velocity of 4000-5000 m/s indicates that the formationis mainly composed of massive basalt flows.
SYNTHETIC SEISMOGRAM AT SITE 747
A synthetic seismogram was computed and compared withthe MCS Profile MD 47-03 crossing Site 747. The MarionDufresne Cruise 47 used a flexichoc fired every 50 m and a24-channel streamer to acquire seismic data at a 4-ms samplerate. The data were normal-move-out (NMO) corrected,stacked (24 folds), band-pass filtered (12-50 Hz), and aver-aged on a running window (AGC) before being plotted
912

NOISE ON DIGITAL SONIC LOG DATA
0.2 0.3 0.4 ms
Figure 7. Low-frequency noise superimposed on the waveform. A.Raw waveform. B. High bandpass-filtered waveform with a cutofffrequency of 7 kHz.
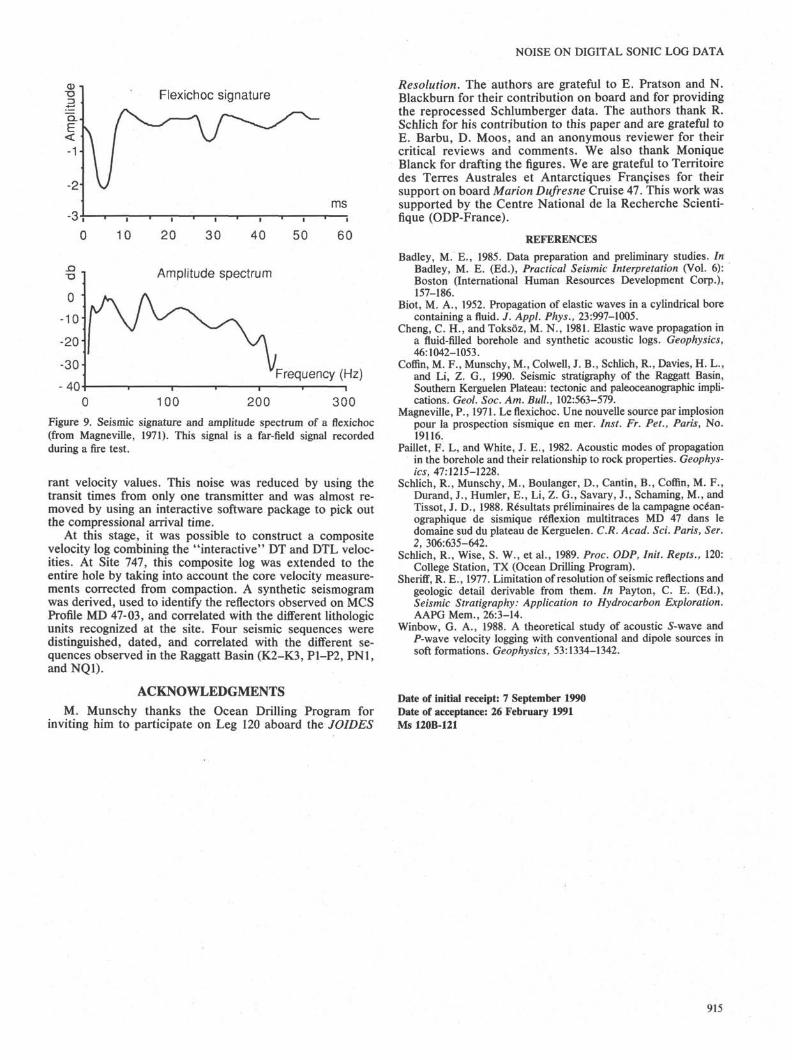
(Schlich et al., 1988). To compute the synthetic seismogram,we used a program based on the reflection coefficient method(Sheriff, 1977; Badley, 1985): a series of reflection-coefficientsare convolved with the seismic source signals. The accuracyof the synthetic seismogram is directly related to the numberand length of the depth intervals used for the convolution.Thus, to avoid the introduction of fictitious steps, we have (1)interpolated the composite velocity log, the discrete bulkdensity, the grain density and the porosity values with a cubicspline; (2) resampled the curves assuming that the physicalparameters were constant along each depth interval; and (3)corrected the bulk density from the compaction using thegrain density and the porosity measurements. The impedancelog was calculated, expressed in two-way traveltime (twt)using the velocity values, and resampled at a sample rate of 2ms. To calculate the reflection-coefficient series, the waveletused was the far-field signature of the source recorded duringa fire test (Fig. 9). The seismic signal, sampled at a time rateof 2 ms, was convolved with the reflection-coefficient series.Finally, the synthetic seismogram obtained was band-passfiltered (12-50 Hz). No amplitude gain control was done onthe synthetic seismogram.
CORRELATION WITH MULTICHANNEL SEISMICSECTIONS
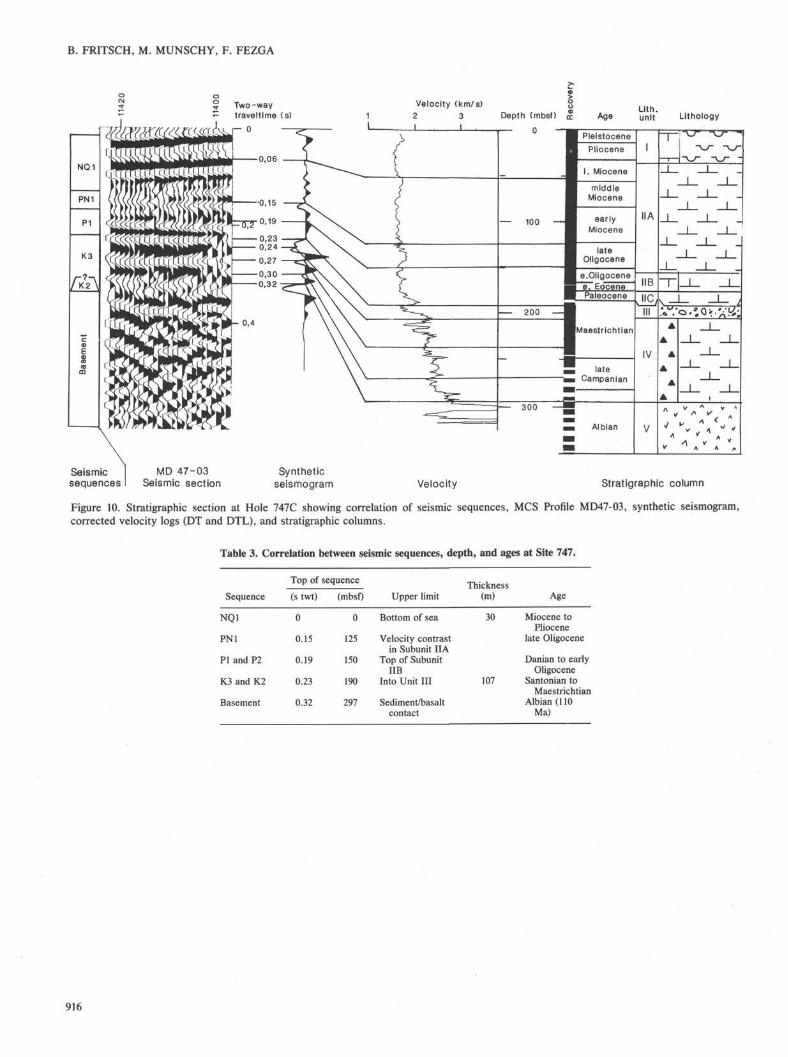
Only two distinct seismic sequences were identified at Site747 (Schlich, Wise, et al., 1989, "Site 747" chapter): theboundary between the two sequences was located at 0.22-0.24 s twt below seafloor and the basement reflector at0.33-0.37 s twt below seafloor on Profile MD 47-03. Using thesynthetic seismogram, we correlated the lithologic units rec-ognized at Site 747 with the different seismic reflectors. In thedescription given below, we shall try to use the seismicsequence nomenclature defined by Schlich, Wise, et al. (1989)and Coffin et al. (1990) in the Raggatt Basin (Fig. 10 and Table3).
The lowest high-amplitude wavelet observed on the syn-thetic seismogram at 0.32 s twt corresponds to the sediment/
basement contact at 297 mbsf. The wavelet at 0.30 s twt (270mbsf) corresponds to the top of a thin layer with a velocity of2.8 km/s at 285 mbsf, but it is not associated with a clearlydefined reflector on the seismic profile. The thickness of thislayer (about 20 m), similar to the seismic resolution, explainsthe variability observed for the basement reflector along theseismic profile.
The reflector at 0.23 s twt corresponds to a depth of 190mbsf in the volcaniclastic sediments of lithologic Unit III. Onthe synthetic seismogram, the corresponding wavelet is morecomplex; at 0.24 s twt (205 mbsf), a wavelet is superimposedand corresponds to the bottom of the volcaniclastic sedimentsat Hole 747C (Core 120-747C-5R; Schlich, Wise, et al., 1989).The reflector at 0.23 s twt cannot be associated with the top orbottom of lithologic Unit III. It corresponds to an unconfor-mity (Schlich, Wise, et al., 1989, "Site 747" chapter) dated aslate Maestrichtian to early Paleocene and, therefore, is con-temporaneous with the major tectonic event that formed the77°E Graben (Munschy et al., this volume). This event is alsorecorded at Site 748 in the Raggatt Basin and is synchronouswith the K3/P1 boundary (Fritsch et al., this volume). Thereflectors between 0.23 s twt and the basement reflector, datedas Maestrichtian to Santonian, can be associated with the K2and K3 sequences in the Raggatt Basin.
Between 0.15-0.19 and 0.23 s twt, the synthetic seismo-gram is different from the seismic profile. Nevertheless, thereare three reflectors on the seismic profile and three maximaand minima on the synthetic seismogram. The velocity distri-bution between 140 and 190 mbsf can explain these differ-ences: the observed velocity inversions probably mask thereflection at 0.2 s twt on the seismic profile. The reflector at0.19 s twt (150 mbsf) is located 9 m above the top of lithologicSubunit IIB and is dated as lower Oligocene. It corresponds toan unconformity defined by toplaps westward of Site 747(Munschy et al., this volume). The reflector at 0.2 s twt isassociated with the minima at 0.22 s twt and, thus, UHhe topof lithologic Subunit IIC at 180 mbsf, dated as Danian. It alsocorresponds to an unconformity. Thus, the sequence between0.19 and 0.23 s twt is associated with Sequences Pl and P2 inthe Raggatt Basin.
At 0.15 s twt (125 mbsf), a significant reflector is observedon the seismic profile; the corresponding wavelet results froma velocity increase at 125 mbsf. The reflector at 0.15 s twt isassociated with the PN1/NQ1 sequence boundary in theRaggatt Basin.
Between 0.03 and 0.13 s twt, the synthetic seismogram isquite different from the seismic profile. On the seismic profile,the high-amplitude reflector at 0.06 s twt does not correspondto a well-defined wavelet on the synthetic seismogram. Thehigh-amplitude reflector at 0.03 s twt (30 mbsf) is associatedwith the top of lithologic Unit II.
CONCLUSIONSBecause of severe time restrictions, logging during Leg 120
was only conducted at Sites 747 and 750 and furthermore wasrestricted to the seismic-stratigraphic combination (DITE/SDT/NGT/CAL). Bad weather conditions prevailed duringmost of the logging operations, and breakdown of the heavecompensator induced important noise that mainly affected thesonic digital tool and limited the interpretation of the velocitydata and the correlation studies with the MCS profiles and thelithologic sections.
Three types of noise were observed. Phase skipping waseasily removed by adjusting the gain control. Erratic toolmovements were modeled by a sinusoidal function and elim-inated by averaging seven consecutive samples. A malfunc-tion of one of the two transmitters introduced discrete aber-
913
B. FRITSCH, M. MUNSCHY, F. FEZGA
Depth (mbsf)200 250 300
150 200 250 300
Figure 8. Composite velocity log at Site 747 compared with one of the resistivity logs (SFLU), the gamma ray log (NGT), and the caliper log(CAL).
914
NOISE ON DIGITAL SONIC LOG DATA
E<-1
-2
-3
Flexichoc signature
ms
"D
o i-10
-20
-30H
-40
10 20 30 40 50
Amplitude spectrum
60
Frequency (Hz)
0 100 200 300
Figure 9. Seismic signature and amplitude spectrum of a flexichoc(from Magneville, 1971). This signal is a far-field signal recordedduring a fire test.
rant velocity values. This noise was reduced by using thetransit times from only one transmitter and was almost re-moved by using an interactive software package to pick outthe compressional arrival time.
At this stage, it was possible to construct a compositevelocity log combining the "interactive" DT and DTL veloc-ities. At Site 747, this composite log was extended to theentire hole by taking into account the core velocity measure-ments corrected from compaction. A synthetic seismogramwas derived, used to identify the reflectors observed on MCSProfile MD 47-03, and correlated with the different lithologicunits recognized at the site. Four seismic sequences weredistinguished, dated, and correlated with the different se-quences observed in the Raggatt Basin (K2-K3, P1-P2, PN1,and NQ1).
ACKNOWLEDGMENTSM. Munschy thanks the Ocean Drilling Program for
inviting him to participate on Leg 120 aboard the JOIDES
Resolution. The authors are grateful to E. Pratson and N.Blackburn for their contribution on board and for providingthe reprocessed Schlumberger data. The authors thank R.Schlich for his contribution to this paper and are grateful toE. Barbu, D. Moos, and an anonymous reviewer for theircritical reviews and comments. We also thank MoniqueBlanck for drafting the figures. We are grateful to Territoiredes Terres Australes et Antarctiques Francises for theirsupport on board Marion Dufresne Cruise 47. This work wassupported by the Centre National de la Recherche Scienti-fique (ODP-France).
REFERENCES
Badley, M. E., 1985. Data preparation and preliminary studies. InBadley, M. E. (Ed.), Practical Seismic Interpretation (Vol. 6):Boston (International Human Resources Development Corp.),157-186.
Biot, M. A., 1952. Propagation of elastic waves in a cylindrical borecontaining a fluid. / . Appl. Phys., 23:997-1005.
Cheng, C. H., and Toksöz, M. N., 1981. Elastic wave propagation ina fluid-filled borehole and synthetic acoustic logs. Geophysics,46:1042-1053.
Coffin, M. F., Munschy, M., Colwell, J. B., Schlich, R., Davies, H. L.,and Li, Z. G., 1990. Seismic stratigraphy of the Raggatt Basin,Southern Kerguelen Plateau: tectonic and paleoceanographic impli-cations. Geol. Soc. Am. Bull., 102:563-579.
Magneville, P., 1971. Le flexichoc. Une nouvelle source par implosionpour la prospection sismique en mer. Inst. Fr. Pet., Paris, No.19116.
Paulet, F. L, and White, J. E., 1982. Acoustic modes of propagationin the borehole and their relationship to rock properties. Geophys-ics, 47:1215-1228.
Schlich, R., Munschy, M., Boulanger, D., Cantin, B., Coffin, M. F.,Durand, J., Humler, E., Li, Z. G., Savary, J., Schaming, M., andTissot, J. D., 1988. Résultats préliminaires de la campagne océan-ographique de sismique reflexion multitraces MD 47 dans ledomaine sud du plateau de Kerguelen. C.R. Acad. Sci. Paris, Ser.2, 306:635-642.
Schlich, R., Wise, S. W., et al., 1989. Proc. ODP, Init. Repts., 120:College Station, TX (Ocean Drilling Program).
Sheriflf, R. E., 1977. Limitation of resolution of seismic reflections andgeologic detail derivable from them. In Pay ton, C. E. (Ed.),Seismic Stratigraphy: Application to Hydrocarbon Exploration.AAPG Mem., 26:3-14.
Winbow, G. A., 1988. A theoretical study of acoustic 5-wave and.P-wave velocity logging with conventional and dipole sources insoft formations. Geophysics, 53:1334-1342.
Date of initial receipt: 7 September 1990Date of acceptance: 26 February 1991Ms 120B-121
915
B. FRITSCH, M. MUNSCHY, F. FEZGA
Two-way–̂ traveltime (s)
Velocity (km/s)2 3J L
Depth (mbsf)
0
AgeLith.unit Lithology
Seismicsequences
MD 47-03Seismic section
Syntheticseismogram Velocity Stratigraphic column
Figure 10. Stratigraphic section at Hole 747C showing correlation of seismic sequences, MCS Profile MD47-03, synthetic seismogram,corrected velocity logs (DT and DTL), and stratigraphic columns.
Table 3. Correlation between seismic sequences, depth, and ages at Site 747.
Sequence
NQ1
PN1
Pl and P2
K3 and K2
Basement
Top of sequence
(s twt)
0
0.15
0.19
0.23
0.32
(mbsf)
0
125
150
190
297
Upper limit
Bottom of sea
Velocity contrastin Subunit IIA
Top of SubunitIIB
Into Unit III
Sediment/basaltcontact
Thickness(m)
30
107
Age
Miocene toPliocene
late Oligocene
Danian to earlyOligocene
Santonian toMaestrichtian
Albian (110Ma)
916