4a-3 stabilization slope failure_hossain_khan.pdf
TRANSCRIPT

5/5/2015
1
Dr. Sahadat Hossain, P.E.
Dr. Mohammad Sadik Khan, P.E.
Stabilization of Shallow Slope failure on Expansive Clay using Recycled Plastic Pin
• Recycled Plastic Pin (RPP)
• Mainly Polymeric Materials
• Fabricated from Recycled Plastics
• Advantages
• Commercially Available
• Use of RPP Reduces Waste Volume
• Resistant to Biological Exposure
• Typical Composition
• HDPE : 55-90%
• LDPE : 5-10%
• PP, PET, PS : 1% - 10%
• Misc. : 0 – 5%
A 10’ long RPP can replace 500 Soda Bottles

5/5/2015
2
Factor of Safety:Without ReinforcementFS = Mr/Md
Factor of Safety:With ReinforcementFS = (Mr+∆Mr)/Md
Legend:Red: Clay having high swelling potentialBlue: Less than 50% of clay contents having high swelling potentialOrange: Clay content having slight to moderate swelling potentialGreen: Less than 50% of clay contents having slight to moderate swelling potentialBrown: Little or no swelling clayYellow: Insufficient data

5/5/2015
3
Expansive Clay
Most Slope Failure in Texas takes place due to the Shrink Swell behavior of Expansive Clay and Formation of Perched Water Zone due to Rainfall
Interstate 30
US 287 US 67

5/5/2015
4
Site Location
0
10
20
30
40
50
60
70
80
20 40 60 80
Pla
stic
ity
Ind
ex
Liquid Limit
Plasticity Chart
BH-1BH-2BH-3
Bore Hole Location
Depth of Sample
Liquid LimitPlasticity
IndexBH-1 5 48 25BH-1 10 60 33BH-1 15 72 48BH-1 20 64 38BH-2 5 49 26BH-2 10 67 38BH-2 15 73 45BH-2 20 61 35BH-2 25 62 37BH-3 5 52 27BH-3 10 61 34BH-3 15 79 51BH-3 20 58 32BH-3 25 62 40

5/5/2015
5
RI-1
RI-2
Resistivity Profile: RI-1
Resistivity Profile: RI-1
0
1
2
3
4
5
6
7
8
9
10.00 20.00 30.00 40.00
Dep
th o
f S
amp
le (
m)
Moisture Content (%)
Moisture Variation along the borehole
US 287 BH1 US 287 BH2
0
1
2
3
4
5
6
7
8
0 5 10 15 20 25
Dep
th (
m)
Resistivity (Ohm-m)
Variation of Resistivity
BH-1 BH-2 BH-3

5/5/2015
6
Soil Type
Friction Angle
CohesionUnit
WeightElastic
Modulus
φ c ϒ E
- ◦ psf pcf psf
1 10 100 125 100000
2 23 100 125 150000
3 15 250 130 200000
4 35 3000 140 250000

5/5/2015
7
March 2011 March 2012
Reinforced Section 1
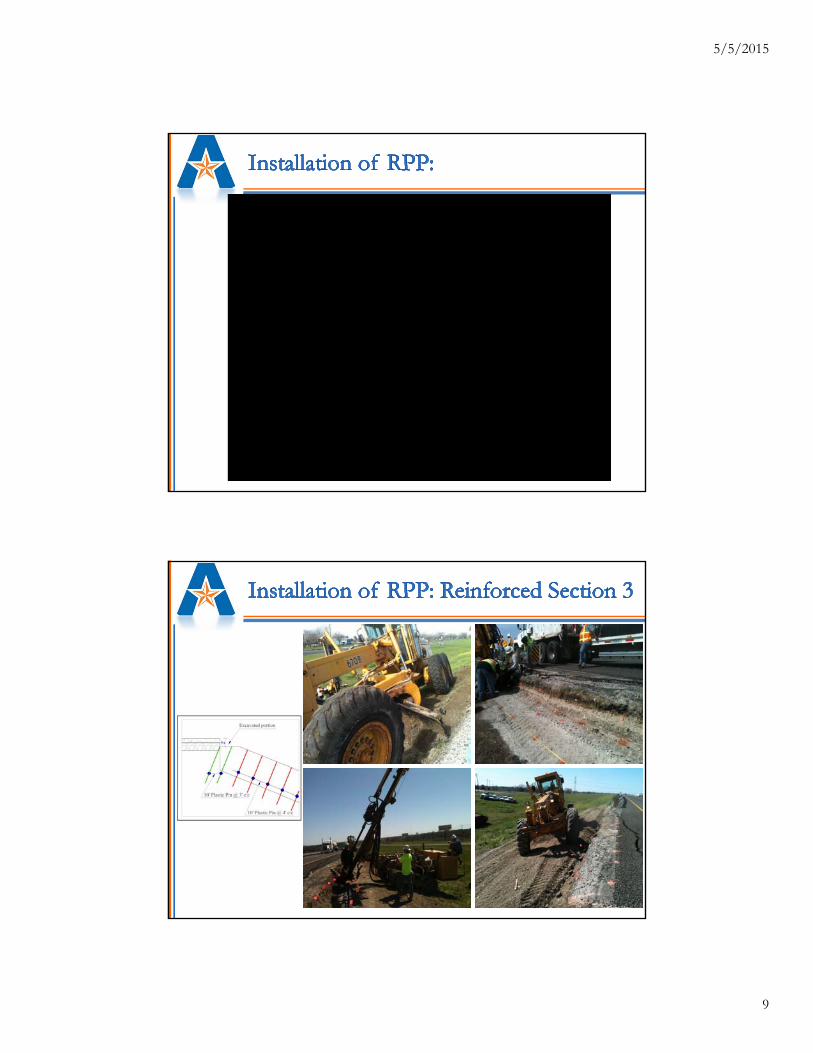
Reinforced Section 2 Reinforced Section 3

5/5/2015
8
Reinforced Section 1: FS = 1.43
Reinforced Section 2: FS = 1.48
Reinforced Section 3: FS = 1.54
Soil Type
Friction Angle
CohesionUnit
WeightElastic
Modulus
φ c ϒ E- ◦ psf pcf psf1 10 100 125 1000002 23 100 125 1500003 15 250 130 2000004 35 3000 140 250000
Back Analysis of Unreinforced Slope: FS = 1.05
Soil 4
Soil 3
Soil 2 Soil 1 Back Calculated Soil Parameters
• Equipment: Klemm 802 Drill Rig
• Hammer Type: KD 1101
5/5/2015
9

5/5/2015
10
Section No. ofRPP
Installation Time(Day)
Start Date
FinishedDate
Reinforced Section 1
192 2 March 01, 2011
March 03, 2011
Reinforced Section 2
225 2 March 04, 2011
March 05, 2011
Reinforced Section 3
238 3 Feb 29, 2012
March 6, 2012
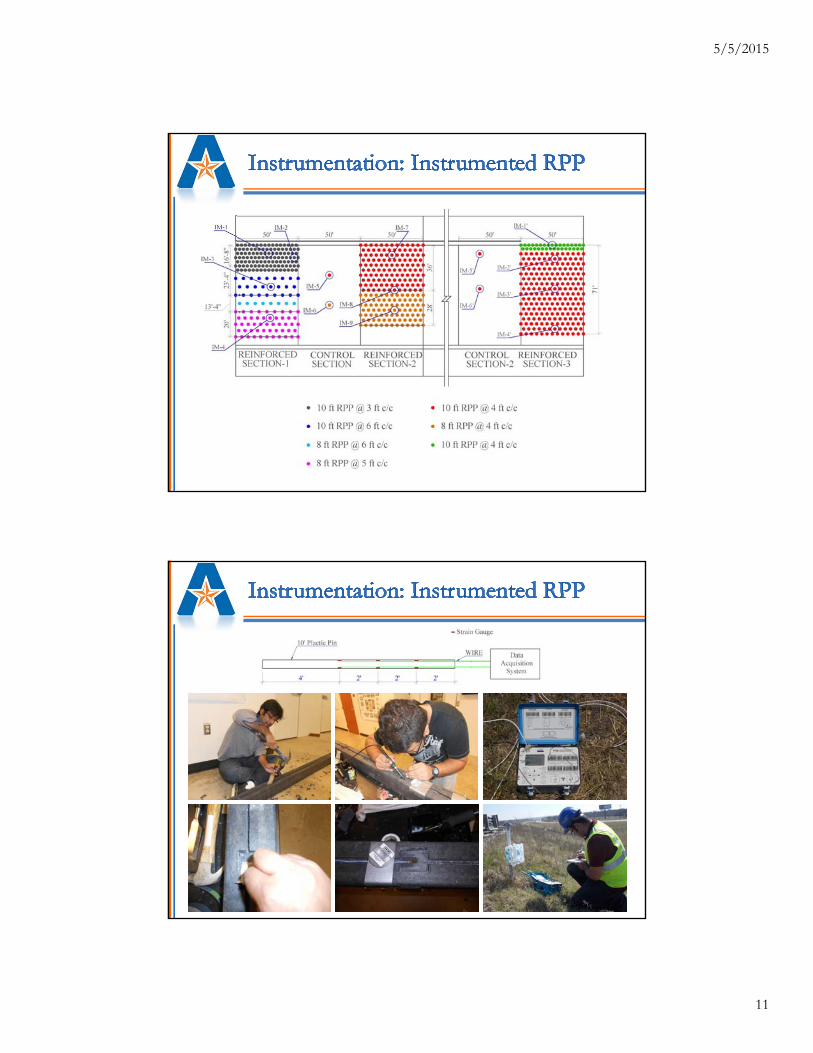
• Rain Gauge
• Instrumented RPP
• Surveying
• Inclinometer
• Moisture Sensor
• Water Potential Probe
5/5/2015
11

5/5/2015
12

5/5/2015
13
25
-0.025
-0.02
-0.015
-0.01
-0.005
0
0.0050
0.5
1
1.5
2
2.5
3
3.5
4
4.5
5
2/28
/11
3/31
/11
4/30
/11
5/31
/11
6/30
/11
7/31
/11
8/31
/11
9/30
/11
10/3
1/11
11/3
0/11
12/3
1/11
1/31
/12
2/29
/12
3/31
/12
4/30
/12
5/31
/12
6/30
/12
7/31
/12
8/31
/12
9/30
/12
10/3
1/12
11/3
0/12
12/3
1/12
1/31
/13
2/28
/13
Str
ain
(in/
in)
Rai
nfal
l (in
)
Date
Comparison of Strain: Reinforced Section 1, Control Section and Reinforced Section 2
Rainfall IM-3 @ 2ft IM-5 @ 2ft IM-8 @ 2ft
0
2
4
6
8
10
12
14
16
18
20
0 50 100 150 200 250
Set
tlem
ent
(in
)
Distance along Roadway (ft)
Total Settlement of at the crest of US 287 slope
5.6.12 5.6.12 6.6.12 7.13.12 8.3.12 9.8.12 10.6.12 11.10.12
12.13.12 1.10.13 2.9.13 3.7.13 4.5.13 5.20.13 7.1.13 8.2.13
26

5/5/2015
14
27
0
1
2
3
4
5
6
0 50 100 150 200 250
Set
tlem
ent
(in
ch)
Distance along Roadway (ft)
Incremental Settlement of at Crest of the Slope
8.3.12 1.10.13 4.5.13 5.20.13 8.2.13
28
R. Section 1
Control Section
Control Section 2
R. Section 3
Settlement: 15 in
Settlement: 9 in

5/5/2015
15
29
-1
0
1
2
3
4
0
1
2
3
4
5
7/16
/11
9/16
/11
11/1
6/11
1/16
/12
3/16
/12
5/16
/12
7/16
/12
9/16
/12
11/1
6/12
1/16
/13
3/16
/13
5/16
/13
7/16
/13
Dis
pla
cem
ent
(in
ch)
Rai
nfa
ll (i
nch
)
Date
Horizontal Displacment with time at Inclinometer 1
Rainfall 2.5 ft-Inc1 6.5 ft-Inc 1 10.5 ft-Inc 1 20.5 ft-Inc 1
30
-1
0
1
2
3
4
0
1
2
3
4
5
7/16
/11
9/16
/11
11/1
6/11
1/16
/12
3/16
/12
5/16
/12
7/16
/12
9/16
/12
11/1
6/12
1/16
/13
3/16
/13
5/16
/13
7/16
/13
Dis
pla
cem
ent
(in
ch)
Rai
nfa
ll (i
nch
)
Date
Horizontal Displacment with time at Inclinometer 3
Rainfall 2.5 ft-Inc 3 6.5 ft-Inc 3 10.5 ft-Inc 3 20.5 ft-Inc 3

5/5/2015
16
31
-1
0
1
2
3
4
0
1
2
3
4
5
7/16
/11
9/16
/11
11/1
6/11
1/16
/12
3/16
/12
5/16
/12
7/16
/12
9/16
/12
11/1
6/12
1/16
/13
3/16
/13
5/16
/13
7/16
/13
Dis
pla
cem
ent
(in
ch)
Rai
nfa
ll (i
nch
)
Date
Comparison of Horzontal Movement at US 287 Slope
Rainfall 2.5 ft-Inc1 2.5 ft-Inc 3
0
4
8
Rai
nfal
l (i
nch)
Rainfall Average Rainfall Total Rainfall
32
0
20
40
Moi
stur
e C
onte
nt (
%)
-20000
-16000
-12000
-8000
-4000
0
Mat
ric
Suct
ion
(p
sf)
-0.5
0
0.5
1
1.5
2
Jul-1
1
Aug
-11
Sep-
11
Oct
-11
Nov
-11
Dec
-11
Jan-
12
Feb-
12
Mar
-12
Apr
-12
May
-12
Jun-
12
Jul-1
2
Aug
-12
Sep-
12
Oct
-12
Nov
-12
Dec
-12
Jan-
13
Feb-
13
Mar
-13
Apr
-13
May
-13
Jun-
13
Jul-1
3
Aug
-13
Hor
izon
tal D
isp
lace
men
t (i
nch
)
Date
2.5 ft-Inc1 6.5 ft-Inc 1 10.5 ft-Inc 1 20.5 ft-Inc 1
Rainfall
M/C
Matric Suction
Displacement

5/5/2015
17
33
0
20
40
Moi
stur
e C
onte
nt (
%)
-20000
-16000
-12000
-8000
-4000
0
Mat
ric
Suct
ion
(p
sf)
-0.5
0
0.5
1
1.5
2
Jul-1
1
Aug
-11
Sep-
11
Oct
-11
Nov
-11
Dec
-11
Jan-
12
Feb-
12
Mar
-12
Apr
-12
May
-12
Jun-
12
Jul-1
2
Aug
-12
Sep-
12
Oct
-12
Nov
-12
Dec
-12
Jan-
13
Feb-
13
Mar
-13
Apr
-13
May
-13
Jun-
13
Jul-1
3
Aug
-13
Hor
izon
tal D
isp
lace
men
t (
inch
)
Date
2.5 ft-Inc 3 6.5 ft-Inc 3 10.5 ft-Inc 3 20.5 ft-Inc 3
Rainfall
M/C
Matric Suction
Displacement
0
4
8
Rai
nfal
l (i
nch)
Rainfall Average Rainfall Total Rainfall
34
-0.5
0
0.5
1
1.5
2
40
60
80
100
120
140
1/1/
122/
1/12
3/1/
124/
1/12
5/1/
126/
1/12
7/1/
128/
1/12
9/1/
1210
/1/1
211
/1/1
212
/1/1
21/
1/13
2/1/
133/
1/13
4/1/
135/
1/13
6/1/
137/
1/13
8/1/
13 Dis
pla
cem
ent
(in
ch)
Dai
ly H
igh
est
Tem
per
atu
re (
F)
Date
Comparison of Horizontal Movement with Temperature
Daily Highest Temperature 2.5 ft-Inc1 2.5 ft-Inc 3
Shrinkage Crack (Dry Period)
No Crack (Wet Period)

5/5/2015
18
Loehr et al., 2007
0
2
4
6
8
10
Rai
nfa
ll (i
nch
)
Rainfall Average Rainfall Total Rainfall
-0.5
0
0.5
1
1.5
2
Jul-1
1A
ug-1
1Se
p-11
Oct
-11
Nov
-11
Dec
-11
Jan-
12Fe
b-12
Mar
-12
Apr
-12
May
-12
Jun-
12Ju
l-12
Aug
-12
Sep-
12O
ct-1
2N
ov-1
2D
ec-1
2Ja
n-13
Feb-
13M
ar-1
3A
pr-1
3M
ay-1
3Ju
n-13
Jul-1
3A
ug-1
3
Hor
izon
tal D
isp
lace
men
t (i
nch
)
Date
2.5 ft-Inc1 6.5 ft-Inc 1 10.5 ft-Inc 1 20.5 ft-Inc 1

5/5/2015
19

5/5/2015
20
• RPP provided resistance against shallow slope failure
• A Crawler-Mounted Rig, Equipped with a Mast-Mounted Pseudo Vibratory Hammer, Worked Effectively to Install RPPs
• On Average, a RPP Can be Installed within 4 Minutes, and a Total of 100 to 120 RPPs can be Installed in a Single Day.
• Settlement at Control Section is 15 inch
• Settlement at Reinforced Section 1 is 2.5 inch.
• Closer RPP Spacing at Crest Provided Higher Resistance against Slope Deformation
• Only 15% to 16% of the Total Capacity of RPP is Currently Mobilized
• RPP can save the stabilization cost up to 60% - 80% of conventional technique, and have potential to be a effective sustainable alternative to stabilize shallow slope failure.

5/5/2015
21
Thank You