4ce final report
TRANSCRIPT

8/8/2019 4CE Final Report
http://slidepdf.com/reader/full/4ce-final-report 1/88
Disclaimer
The project “Consumer Choice and Carbon Consciousness for Electricity (4C Electricity)” is
supported by the European Commission through the Altener programme (contract no.4.1030/Z/01-088/2001).
This report represents the views of its authors. These views have not been adopted or in anyway approved by the Commission and should not be relied upon as a statement of the Commis-sion's views. Neither the European Commission, nor any person acting on behalf of the Com-mission, is responsible for the use that might be made of the information arising from thisdocument. The responsibility for the report, including possible flaws, remains with the authors.
© Environmental Change Institute, 2003
ISBN 1-8734370 360
Acknowledgements
The 4CE project team would like to thank Sarah Darby and Robert Pugh at the ECI, Reka Soosat the CEU and Åsa Gerger and Francis Johnson at SEI for their help and input and LouiseRickard for her work during the initial phases of the project. Our thanks also to ElisabethHiptmair and Alun Byles at ORC International for their hard work and advice with the tele-phone survey. We are grateful to the following people for checking the telephone questionnairetranslations under a tight deadline: Andrezj Baniak, Valentina Bastino, Martin Eibl, SilviaKawashima, Sonia Medina, Fivos Papadimitriou, Andrew Pindar, Barabara de Radigues and
Ilias Sofronis. We would also like to thank Ed Holt and Patricia D. Stanton for giving us thebenefit of their valuable experience from electricity disclosure in the US. In addition, manythanks to Jan Devries and Anne Conze-Wichmann at imug for organising and moderating theGerman focus groups, and Daniela Heininger and Doris Hutter at Sensor for organising andmoderating the focus groups in Austria.
Front cover picture: S Terry (Science Photo Library)
The 4CE project consortium:
EnvironmentalChangeInstitute
IT Power Öko-InstitutStockholm
EnvironmentInstitute
Energie-verwertungs-
agentur
CentralEuropeanUniversity
8/8/2019 4CE Final Report
http://slidepdf.com/reader/full/4ce-final-report 2/88
4CE Final Report
Prepared as part of the ALTENER project“Consumer Choice and Carbon Consciousness
for Electricity (4CE)”
Sponsored by the European Commission
September 2003
Written by
Brenda Boardman ([email protected]), Environmental Change InstituteJane Palmer ([email protected]), Environmental Change Institute
withAnders Arvidson ([email protected]), Stockholm Environment InstituteVeit Buerger ([email protected]), Oeko InstitutJohn Green ([email protected]), IT PowerKevin Lane ([email protected]), Environmental Change InstituteJudith Lipp ([email protected]), IT PowerMattias Nordstrom ([email protected]), Stockholm Environment InstituteHerbert Ritter ([email protected]), Energieverwertungsagentur
Christof Timpe ([email protected]), Oeko InstitutDiana Urge-Vorsatz ([email protected]), Central European University
4CE

8/8/2019 4CE Final Report
http://slidepdf.com/reader/full/4ce-final-report 3/88
4CE Final Report
i
The 4C Electricity Project
The project “Consumer Choice and Carbon Consciousness for Electricity (4C Electric-ity)” has been carried out under the framework of the EU Altener programme and in the
context of the European Directive 2003/54/EC on liberalisation of the Europeanelectricity market, adopted in June 2003. The aim of this project is to promote electricitydisclosure, i.e. consumer information about the source of the electricity product they arecurrently buying and the implications of its generation.
To assist consumers in making an informed choice in the liberalised electricity marketplace, this project has developed some options for label design (and the informationsystem behind it) that will provide consumers with details of the content of their supplymix and its resulting environmental implications.
By designing an information system which displays details about the primary energysources used to generate a certain product, these labels provide a tool which can aid con-
sumers and policy makers in greening Europe’s electricity supply.The electricity disclosure scheme has been explored within the context of liberalisation,in order to ensure that a functional and practical scheme is proposed. An assessment of the opportunities and barriers to labelling, and especially for tracking electricity, fromthe changes to the European liberalised markets was undertaken.
This was achieved through the following activities:
• Phase 1: A study of the ability of suppliers to access and provide the informationneeded for an electricity label within the context of liberalisation.
• Phase 2: A study of what the label will mean for consumers and what consumers
want by consulting with them through focus groups, a telephone survey and one-on-one interviews.
• Phase 3: Interaction with existing policies and development of new policies to maxi-mise the impact of the label, as well as investigating the need for associated policiesto ensure effectiveness. This final phase estimates the cost of implementing adisclosure scheme, assesses the label in the context of a policy framework towards alower carbon future and suggests a policy toolbox that can be employed to build onthe label.
In the course of the project, two workshops were held, forming key deliverables of the4C Electricity project. The project ran from January 2002 to September 2003.
Further information on the 4C Electricity project is available on the project website:http://www.electricitylabels.com
8/8/2019 4CE Final Report
http://slidepdf.com/reader/full/4ce-final-report 4/88
4CE Final Report
ii
Contents
The 4C Electricity Project................................................................................................i
Executive Summary.........................................................................................................1 1 Introduction – context setting..................................................................................5
2 The European electricity market ............................................................................8 2.1 Status of liberalisation ....................................................................................82.2 Fuel mix of electricity generation...................................................................92.3 Environmental impact of electricity generation............................................102.4 Electricity trading between Member States ..................................................122.5 Structure and institutional arrangements of the wholesale market ...............142.6 Retail market and consumer activity ............................................................142.7 Policies of relevance to electricity disclosure...............................................16
2.8 Conclusion....................................................................................................17
3 Consumer Choice and Carbon Consciousness ....................................................18 3.1 Who are the consumers?...............................................................................183.2 Consumer research........................................................................................183.3 What consumers know..................................................................................193.4 What consumers want...................................................................................213.5 Consumer support for electricity disclosure .................................................233.6 Conclusions ..................................................................................................24
4 Presentation of information...................................................................................25 4.1 Minimal compliance.....................................................................................25
4.1.1 Fuel mix information ............................................... ..................................... 25 4.1.2 Environmental impact information .............................................................. 26 4.1.3 Impact of minimal compliance ................................................ ..................... 27
4.2 Existing label designs ...................................................................................274.3 Consumer research........................................................................................28
4.3.1 Fuel source display ......................................... ............................................. 28 4.3.2 Environmental indicator display..................................................... ............. 29 4.3.3 Location of information................. .................................................. ............. 30 4.3.4 Comparability and reliability........ .................................................. ............. 30
4.4 Recommendations ........................................................................................32
4.4.1 Fuel source display ......................................... ............................................. 32 4.4.2 Environmental indicator display..................................................... ............. 34 4.4.3 Location of information................. .................................................. ............. 36 4.4.4 Product versus portfolio.................................................. ............................. 37
4.5 Conclusions ..................................................................................................38
5 Provision of reliable information ..........................................................................39 5.1 Introduction...................................................................................................39
8/8/2019 4CE Final Report
http://slidepdf.com/reader/full/4ce-final-report 5/88
4CE Final Report
iii
5.2 Framework conditions in the electricity markets..........................................395.3 Requirements for the information provided .................................................415.4 Options for tracking electricity.....................................................................42
5.4.1 Statistical data............... .................................................. ............................. 42
5.4.2 Contract based tracking .................................................. ............................. 43 5.4.3 Tracking based on tradable certificates....................................................... 45
5.5 Mandatory vs optional use of the tracking mechanism ................................465.6 Imported electricity.......................................................................................475.7 Minimal compliance.....................................................................................48
5.7.1 Description of the minimal compliance approach....................................... 48 5.7.2 Evaluation ............................................. .................................................. ..... 49
5.8 Recommendations ........................................................................................495.8.1 Description of the recommended approach ............................................ ..... 50 5.8.2 Evaluation ............................................. .................................................. ..... 51
5.9 Conclusions ..................................................................................................51
6 Costs and impacts ...................................................................................................53 6.1 The cost of implementing disclosure............................................................536.2 Benefits of implementing disclosure ............................................................576.3 Supporting and interacting policies ..............................................................58
6.3.1 Making disclosure effective............................................. ............................. 58 6.3.2 Building on disclosure................................... ............................................... 58 6.3.3 Interaction with other policies ................................................ ..................... 59
6.4 Conclusions ..................................................................................................61
7 Conclusions and recommendations.......................................................................63 7.1 Consumer Choice and Carbon Consciousness .............................................637.2 Minimal compliance.....................................................................................647.3 A European Disclosure System ....................................................................657.4 Helping disclosure to work...........................................................................667.5 Policy interactions ........................................................................................677.6 Taking disclosure further..............................................................................687.7 Outcomes of disclosure.................................................................................687.8 Monitoring and evaluation............................................................................697.9 Conclusions ..................................................................................................69
8 References ...............................................................................................................71
Appendix A – Glossary .................................................................................................73
Appendix B – Example of disclosure information leaflet ..........................................76
Appendix C – Example of disclosure information insert (portfolio only)................78
Appendix D – Example of disclosure information insert (portfolio & product) .....79
Appendix E – 4CE Programme of work......................................................................80

8/8/2019 4CE Final Report
http://slidepdf.com/reader/full/4ce-final-report 6/88

8/8/2019 4CE Final Report
http://slidepdf.com/reader/full/4ce-final-report 7/88
4CE Final Report
1
Executive Summary
Electricity disclosure will be introduced into Europe as part of the European Directive2003/54/EC on liberalisation of the European electricity market, adopted in June 2003
and due to be implemented into Member State legislation by July 2004.Disclosure has the potential to be a powerful policy tool and is an essential part of theliberalisation of the electricity market, providing consumers with reliable and usefulinformation and thus allowing them to make an informed choice of electricity supplierand electricity supply.
Essence of electricity disclosure
• In essence, electricity disclosure is an educational tool – improving the availabilityand reliability of information about electricity and its associated environmentalimpacts to consumers.
• Electricity disclosure is going to happen, therefore it is crucial to ensure that ithappens in the most effective way possible, particularly from the consumer per-spective.
• Electricity disclosure is a key part of liberalisation – ensuring free flow of informa-tion to all market players, including the final consumer, enabling consumers to in-fluence the generation mix through their purchasing decisions.
• Electricity disclosure is possible at a relatively low cost: a fully-functioning elec-tricity disclosure scheme will cost less than 0.01 cent/kWh.
• It is likely to take around 4 years before a fully functioning disclosure scheme is in
place, allowing for time to set up the tracking mechanism, collect data for the firstyear, verify the information and then incorporate the information with customers’electricity bills and promotional materials.
Requirements of the Directive
• Fuel source information is provided in or with the bills and promotional materials.
• Environmental information, at least in terms of CO2 emissions and radioactivewaste, is provided on an existing reference source at a minimum.
• Disclosure information relates to the supplier portfolio (not individual products)
for the preceding year.
• Member States must ensure that information provided to consumers by suppliers isreliable. This implies that Member States must introduce some form of trackingmechanism to trace electricity from generator to supplier – the use of statistical av-erages would not be sufficient. Verification of the disclosure information is alsoessential.

8/8/2019 4CE Final Report
http://slidepdf.com/reader/full/4ce-final-report 8/88

8/8/2019 4CE Final Report
http://slidepdf.com/reader/full/4ce-final-report 9/88
4CE Final Report
3
• Environmental information should be displayed as a ranked (e.g. on a scale of A-G) or indexed label, including absolute figures for CO2 emissions and radioactivewaste. Further research is required to find the most effective format for the displayof the environmental information from a consumer perspective.
• The environmental indicators for CO2 emissions and radioactive waste should al-ways be displayed together and not in separate locations.
• Promotional materials should display the disclosure information based on the samedisplay formats as used in the separate leaflet or insert.
Tracking the electricity
• European harmonisation of the tracking mechanism is essential for proper func-tioning of the European electricity market.
• Reliability of data can be ensured through the use of an appropriate trackingmechanism and verification systems.
• The tracking mechanism should be based on a central registry approach. MemberStates should specify whether market participants trade electricity on the basis of tags or certificates or both.
• The central registry provides the suppliers with the data to be disclosed to consum-ers, including data on differentiated electricity products if required.
• Member States agree on joint definitions of the information to be provided, proce-dures for data calculations and interfaces for communication across borders.
• CO2 emissions and radioactive waste are tracked on the basis of plant-specific fac-
tors which reflect the benefits of increased plant efficiency, higher fuel quality andcogeneration.
Supporting disclosure
• A national or European educational campaign before and after the introduction of the disclosure scheme would help ensure effectiveness.
• An independent catalogue listing what is offered by all suppliers on the basis of thedisclosure information should be compiled at a national level to enable consumersto compare suppliers and thus make a properly informed choice.
• Existing schemes, such as the EU Emissions Trading Scheme, can support disclo-sure through the provision of plant-specific reporting data for disclosure purposes,thus limiting costs.
• Member State systems for Guarantees of Origin developed under the RenewablesDirective 2001/77/EC and the draft Cogeneration Directive and systems under thevoluntary Renewable Energy Certificates Scheme (RECS) should be merged withthe disclosure tracking mechanism into one single scheme.

8/8/2019 4CE Final Report
http://slidepdf.com/reader/full/4ce-final-report 10/88
4CE Final Report
4
Building on disclosure
• Differentiated tax rates on electricity consumption according to the carbon emis-sions and/or radioactive waste content resulting from its generation could be im-
plemented at a Member State level.• Carbon caps could be placed on suppliers and minimum standards on products to
limit carbon emissions or nuclear content of electricity sales.
• Disclosure could form the cornerstone of a downstream emissions trading scheme.
• Environmental impacts of electricity could be incorporated into procurement speci-fications for goods and services.
• Mandatory disclosure of fuel mix information and associated environmental im-pacts of energy purchases in company reports would strengthen the demand for re-liable and precise disclosure information.
Interacting with disclosure
• Disclosure does not aim to promote specific fuel sources. Award labels (e.g. forgreen electricity) will still have a role to play in identifying electricity from renew-able sources which is truly additional i.e. new generation that is not fully supportedor subsidised through other schemes, such as feed-in tariffs or renewable obliga-tion targets.
• In order to avoid double-counting of the electricity attributes through disclosureand other existing renewable support schemes, clear rules should be established re-garding the role of each. If there are a number of different certification schemes,
these could be combined so that only one type of certificate or tag is in use.
Benefits of disclosure
• Increased availability of reliable information on electricity and its environmentalimpacts and hence better informed consumers.
• Increased demand for electricity generated from renewable sources in the order of up to 25 TWh/year in the EU resulting in a reduction in the level of CO 2 emis-sions, in the order of 10.4 million tonnes of CO2 per year in the EU, and radioac-tive waste through the replacement of electricity generation from fossil and nu-
clear fuels.• A higher contribution of renewables to the electricity sector will result in an in-
creased level of employment in the renewables industry, improved security of supply, increased fuel diversity and less concentrated generation patterns.
• In order to determine the extent of the benefits resulting from disclosure and theeffectiveness of the scheme, it is recommended that Member States undertakemonitoring and evaluation of the disclosure scheme.

8/8/2019 4CE Final Report
http://slidepdf.com/reader/full/4ce-final-report 11/88
8/8/2019 4CE Final Report
http://slidepdf.com/reader/full/4ce-final-report 12/88
4CE Final Report
6
It is clear that more needs to be done. The electricity industry in many EU countries isvery carbon intensive. The use of nuclear power is often put forward as a way of reduc-ing CO2 emissions from electricity generation. However, the problems of dealing withthe resultant radioactive waste is still a major issue of concern for countries within the
EU (and beyond) and evokes a strong reaction amongst many consumers. In addition tothe waste issue, there is wide-spread concern about the risk of nuclear accidents.
Electricity disclosure could play a crucial role in achieving reductions in CO2 emissionsand radioactive waste levels by providing a tool to allow consumers to choose electricityon the basis of their values. Disclosure could also act as a foundation for future policiesworking towards similar environmental targets. Consumer research shows that concernabout climate change and the environment is high. For the electricity sector, disclosurecould provide people with the means by which they can express this concern and takeaction through the choice of the electricity they buy. Within a proper functioning mar-ket, this could ultimately contribute towards transforming the electricity market towardsrenewables, in line with consumer preferences expressed in the 4CE focus groups andtelephone survey.
This report looks at how an electricity disclosure scheme needs to be designed in orderto meet consumers’ information needs and so allow them to exercise free choice in theelectricity market. Article 3 of the Directive relates to electricity disclosure (the ‘label-ling provision’) and states the following:
6) Member States shall ensure that electricity suppliers specify in or with the bills and
in promotional materials made available to final customers:
a) the contribution of each energy source to the overall fuel mix of the supplier
over the preceding year;
b) at least the reference to existing reference sources, such as web-pages, where in-
formation on the environmental impact, in terms of at least emissions of CO2
and the radioactive waste resulting from the electricity produced by the overall
fuel mix of the supplier over the preceding year is publicly available.
With respect to electricity obtained via an electricity exchange or imported from an un-
dertaking situated outside the European Union, aggregate figures provided by the ex-
change or the undertaking in question over the preceding year may be used.
Member States shall take the necessary steps to ensure that the information provided by
suppliers to their customers pursuant to this Article is reliable.
This outlines only the minimum requirements for a electricity disclosure scheme andprovides no guidance on the more detailed aspects of the system, e.g. the display formatfor the disclosure information or how the electricity is tracked from generator to con-sumer. Member States are free to go beyond these minimum requirements if they wish,although there are no requirements for harmonisation between countries.
Based on the extensive research carried out in the 4CE project, the following sectionsdiscuss the views and needs of consumers in relation to electricity disclosure and how

8/8/2019 4CE Final Report
http://slidepdf.com/reader/full/4ce-final-report 13/88
4CE Final Report
7
these needs can be met through the appropriate design of a disclosure scheme. This cov-ers both the label design and the mechanism for tracking the electricity. The likely costsand impacts of electricity disclosure are then outlined before the final recommendationsof the 4CE project are presented.
This report represents an overview and summary of the work done over the duration of the 4CE project. A more detailed discussion and analysis relating to the various phasesof this project, referred to as the phase reports within this report, are available on theproject website: www.electricitylabels.com

8/8/2019 4CE Final Report
http://slidepdf.com/reader/full/4ce-final-report 14/88
4CE Final Report
8
2 The European electricity market
2.1 Status of liberalisation
The first Electricity Market Directive (96/92/EC), adopted in 1996, required EU Mem-ber States to gradually liberalise their national electricity markets. To date, most EUMember States have adopted the appropriate legislation to implement this Directive. Asof January 2003, the average level of declared market opening of the European electric-ity market was approximately 79% (EU COM 2003). Many Member States have openedtheir national electricity markets far beyond the minimum requirements of the Directive,with nearly half having completely opened their electricity markets (Table 1), giving allcustomers the right to choose between different electricity suppliers, although obstaclesto switching still exist. Other Member States have only opened their markets in accor-dance with the minimum required by Directive 96/92/EC. In these countries large con-
sumers are eligible to switch between suppliers but domestic consumers are not.
Table 1 Declared market opening of national electricity markets in Europe
declared market opening 2001 expected full opening dateAustria (A) 100% --Belgium (B) 52% 2007Denmark (DK) 100% --Finland (SF) 100% --France (F) 34% 2007Germany (D) 100% --Greece (GR) 34% 2007
Ireland (IRL) 56% 2005Italy (I) 70% 2007Luxembourg (LUX) 57% 2007Portugal (P) 45% 2004Spain (E) 100% --Sweden (SW) 100% --The Netherlands (NL) 63%2 2003UK 100% --Norway (NOR) 100% --Switzerland (CH) 0% unknownSource: EU COM 2003
In accordance with the revised Electricity Market Directive 2003/54/EC, by 1 July 2004all non-household customers will be eligible to choose their supplier, extending to allcustomers by 1 July 2007. In addition to market opening, the Directive envisages legalunbundling for Transmission System Operators (TSO) by 2004 and for Distribution Sys-tem Operators (DSO), serving more than 100 000 connected customers, by 2007. Mem-
2 As of July 2001 the market for green electricity has been fully liberalised.

8/8/2019 4CE Final Report
http://slidepdf.com/reader/full/4ce-final-report 15/88
4CE Final Report
9
ber States will be required to ensure grid access on the basis of published tariffs. Themethodology for the determination of grid tariffs has to be approved in advance by anominated regulatory body. Furthermore, the Directive also requires Member States toimplement electricity disclosure as outlined in Section 1.
The Directive will apply to the current 15 Member States and, from when they join inMay 2004, the 10 Accession Countries3. The degree of market opening in the AccessionCountries is currently in the range of 10-65%. Several Accession Countries have alreadyimplemented regulations which go beyond the current minimum requirements. For ex-ample most Accession Countries have adopted legal unbundling for TSOs.
Implementation of electricity disclosure in Europe should also consider countries out-side the EU, such as Norway and Switzerland, which are involved with the Europeanelectricity market through imports and exports of electricity but are not required to im-plement the Directive. Norway is an integral part of the Nordic and European electricitymarkets. Due to its central geographical location, Switzerland is an important electricity
hub for trans-European electricity trading and is strongly linked to the Europeanelectricity market. The Swiss government has been pushing for liberalisation of theSwiss electricity market in order to join the European development. However, thereferendum on liberalisation, which included electricity disclosure, was rejected inSeptember 2002 and so liberalisation of the Swiss market has been postponed for thetime being.
2.2 Fuel mix of electricity generation
In 1999, the EU-15 average fuel mix of gross electricity generation4 was approximately35% nuclear, 26% coal5, 17% gas, 14% renewables6 (of which 12% was from hydro),7% oil, and 1% waste (municipal and industrial). The generation fuel mix varies signifi-
cantly across the EU Member States. Differences arise due to dissimilarities in the coun-tries’ geographical conditions, the availability of national fuel sources (e.g. fossil fuelsources, potential for renewable sources), historical structural developments in the elec-tricity sector, and national energy policy (Figure 1).
The overall fossil share (coal, gas, oil) in the EU-15 is largest in Ireland (95%), theNetherlands (90%), and Greece (90%). In Sweden fossil fuels contribute only 2% togross electricity generation.7 In Greece, Germany and Denmark coal contributes more
3 Cyprus, Czech Republic, Estonia, Hungary, Latvia, Lithuania, Malta, Poland, Slovakia, Slovenia.4 Gross electricity generation is the total amount of electricity produced by a power plant as measured at
the terminals of all alternator sets in a station; it therefore includes the energy taken by station auxilia-ries and losses in transformers that are considered integral parts of the station.5 Including all types of coal and by-products extracted from coal combustion e.g. hard coal, patent fuel,
sub-bituminous coal, lignite, peat, coke-oven gas, blast furnace gas.6 Including hydro power (excluding pumped storage), wind energy, biomass, solar energy, geothermal
energy and ocean energy (tides, waves).7 Phase 1 of the 4CE project includes an analysis on the electricity sectors of all EU Member States and
a couple of Accession Countries, with the five partner countries (Austria, Germany, Sweden, UK, andHungary) and Poland analysed in more depth.

8/8/2019 4CE Final Report
http://slidepdf.com/reader/full/4ce-final-report 16/88
4CE Final Report
10
than 50% to electricity production. In some Accession Countries the share of coal iseven higher: 96% in Poland and 70% in the Czech Republic.
0% 10% 20% 30% 40% 50% 60% 70% 80% 90% 100%
EU 15GR
D
DK
E
P
IRL
UK
NL
SF
B
I
A
F
SW
LUX
NOR
CH
HUN
PL
coal gas oil nuclear waste RES
Source: IEA 2001
Figure 1 Fuel mix of gross electricity generation in 1999
(EU-15, Norway, Switzerland, Hungary and Poland)
Eight Member States operate nuclear power plants, with about 60 nuclear reactors con-tributing 35% to EU electricity production. France has the largest nuclear share in theEU.
The share of renewables depends mainly on the potential for hydro power. Potential ishigh in countries such as Austria and Sweden where a large proportion of electricity isgenerated from renewable sources. In Norway nearly 100% of gross electricity produc-tion is generated from hydro power.
This wide variety in national fuel mixes has an impact when deciding the most appro-
priate reference figures (EU, national, regional) if Member States choose to displaycomparative figures as part of disclosure of the fuel mix (Section 4.4.1).
2.3 Environmental impact of electricity generation
The environmental impacts of electricity generation are wide ranging. Electricitygeneration from fossil fuels results in greenhouse gas (GHG) emissions, air pollutantssuch as acidifying emissions (e.g. NOx and SO2), emissions of organic compounds and

8/8/2019 4CE Final Report
http://slidepdf.com/reader/full/4ce-final-report 17/88
4CE Final Report
11
as acidifying emissions (e.g. NOx and SO2), emissions of organic compounds and par-ticulate emissions (e.g. dust). Nuclear power plants produce different categories of solid,liquid and gaseous radioactive waste containing long lasting nuclides with half-lives of several thousand years. Electricity generation from nuclear power is also linked to the
risk of accident and the unresolved question of radioactive waste disposal. Other im-pacts of conventional electricity generation include negative impacts on water quality(cooling water) and the destruction of wildlife habitats (e.g. large hydro plants).
Since the beginning of the eighties, EU legislation (e.g. the Large Combustion PlantsDirective 88/609/EC) has led to substantial reductions of many air pollutants, mainlyacidifying emissions. Although these emissions are still a major problem in some Ac-cession Countries, these countries will – in the course of implementing EU legislation –be obliged to gradually reduce these emissions. Thus these emissions can be consideredless relevant with respect to environmental information presented on a disclosure label(Section 5.3).
The wide variation in the proportion of fossil fuels in the national fuel mixes for elec-tricity generation results in a corresponding variation in average CO2 emission factorsbetween Member States (Figure 2). The average emission factors for each Member Statewere determined by allocating the total CO2 emissions from the national electricity gen-eration to its annual electricity generation, showing a range of more than one order of magnitude. The inclusion of Switzerland and Norway, as well as the Accession Coun-tries Hungary and Poland, in this comparison means that CO2 emissions factors vary bythree orders of magnitude.
0
200
400
600
800
1.000
E u 1
5 G R I R L D K N L D P I
U K E
L U X S F B A F
S W C H
N O R P L
H U N
g ( C O 2 ) / k W h
Source: IEA 2001, IPCC 1996
Figure 2 Specific CO2 emissions from electricity generation
(EU-15, Norway, Switzerland, Hungary and Poland)

8/8/2019 4CE Final Report
http://slidepdf.com/reader/full/4ce-final-report 18/88
4CE Final Report
12
Each year about 30 tonnes of high-level spent nuclear fuel is produced by each largenuclear power plant in Western Europe. Lacking safe and reliable final storage facilitiesfor spent nuclear fuel, radioactive waste can be – in addition to GHG emissions – identi-fied as another important environmental impact of the EU electricity sector.
2.4 Electricity trading between Member States
A key objective of the EU is to create a European-wide internal electricity market whichwill enable trading of electricity between Member States. Electricity cross-border tradecan represent a challenge to electricity disclosure, if the two countries involved do nothave a harmonised disclosure scheme in place. Electricity imported into a disclosureregion has to be assigned the attributes required by the disclosure scheme of the import-ing country if it is to be sold. It is important to have clear rules on how to handle importsfor the effective operation of a disclosure scheme – these are discussed further in Sec-tion 5.6.
The relevance of cross-border trade to the accuracy of electricity disclosure depends ontwo key aspects. Firstly, the amount of electricity traded across the borders betweenMember States and with their non-EU neighbours in the future. Secondly, the extent of harmonisation of the electricity disclosure scheme between Member States.
The development of cross-border trade between Member States and with neighbouringnon-EU countries is primarily dependent on three factors:
• The availability and the development of interconnector capacity between coun-tries;
• The regulative framework for cross-border transactions (including tariff setting,
congestion management, capacity allocation); and• The availability and cost of electricity generation capacity in different countries.
The extension of interconnector capacity is a key objective of EU policy. In June 2003the Energy Council and the European Parliament adopted a Decision8 emphasising theneed to strengthen the trans-European electricity network. This covers the reinforcementof interconnector capacities, the development of new interconnector lines betweenMember States and connecting to the transmission networks of neighbouring countries.
With regard to the regulative framework shaping the development of cross-border trade,considerable progress was reached in the first half of 2003. In June 2003, the EnergyCouncil and European Parliament adopted a Regulation9 which aims to set fair rules for
the cross-border exchange of electricity, such as harmonisation of cross-border trans-mission charges and the allocation of interconnector capacity between national trans-
8 Decision laying down a series of guidelines for trans-European energy networks (No 1229/2003/EC),
26 June 2003.9 Regulation on conditions for access to the network for cross-border exchanges in electricity (No
1228/2003), 26 June 2003.

8/8/2019 4CE Final Report
http://slidepdf.com/reader/full/4ce-final-report 19/88
4CE Final Report
13
mission systems. In addition to this, at its 10th meeting in July 2003, the Florence Fo-rum10 agreed to remove the additional network charges formerly applied to cross-bordertransactions, so that from 1 January 2004, these transactions will be treated and chargedin the same way as national transactions.
To illustrate the magnitude of this issue, Figure 3 shows the share of physical annualelectricity imports relative to the annual electricity consumption for each Member State.In seven countries the imported electricity exceeds 15% of national annual electricityconsumption. In Luxembourg, the extremely high level of imports at 95% arises fromthe small national production capacity currently available as of 2001. The actual volumeof electricity traded across borders may be much higher than the volumes of importsshown since these only reflect the balance of all relevant trading arrangements. Figure 3also shows the share of imports from outside the EU15+.11 At present, the share of im-ports from outside the EU15+ is only greater than 5% of total national annual electricityconsumption in two countries: Austria and Finland. Austria imports significant volumesof physical electricity from the Czech Republic, Finland from Russia.
0%
20%
40%
60%
80%
100%
L U X N L A D K
I S F B P D
S WE U K G R I R L F
N O R C H
share of total imports
share of imports outside EU15+
Source: IEA 2001
Figure 3 Electricity imports to EU15+ Countries in 1999
10 The Florence Forum consists of national regulatory authorities, Member States, European Commis-sion, Transmission System Operators, electricity traders, consumers, network users and power ex-changes. The Forum was set up to discuss issues regarding the creation of a true internal electricitymarket that are not addressed in the former Electricity Directive. One of the main foci of the Forum'sagenda has been tariff-setting for and management of cross border electricity transactions.
11 EU15+ includes all current EU Member States (EU-15) plus Switzerland and Norway. For analysingimports EU15+ was used as the reference as it was assumed that both countries, Switzerland and Nor-way, will implement disclosure following the EU legislative framework, at least in the medium term.

8/8/2019 4CE Final Report
http://slidepdf.com/reader/full/4ce-final-report 20/88
4CE Final Report
14
2.5 Structure and institutional arrangements of the wholesale market
Within the European wholesale electricity market, the majority of electricity is tradedvia bilateral arrangements (contracts) between the generator and supplier. Bilateral trad-
ing transactions cover a wide range of different contract periods from one day ahead toup to several years. Regardless of any further integration of the European electricitymarket, it is expected that bilateral non-standardised contracts between suppliers andgenerators will have a significant role on the wholesale market, even in the longer term.
In addition to bilateral trading markets most Member States (and several AccessionCountries) have established power exchanges. Power exchanges play an important rolein setting a transparent market price for electricity, provided there is sufficient liquiditywithin the exchange. Typical products traded at the spot markets of power exchanges arestandardised hour or block contracts (e.g. baseload or peakload blocks) for the followingday. As risk hedging increases in significance in the liberalised electricity market, ex-changes start to establish more markets for electricity derivatives alongside the physicalelectricity market.
Electricity volumes traded via power exchanges are still lower than expected in mostMember States. Nordpool, the power exchange of the well integrated Scandinavian elec-tricity market, covers around 30% of the electricity market.
Regarding the institutional set-up of the wholesale markets, there is still a significantdegree of concentration in generation despite liberalisation, although this varies widelybetween Member States. In most Member States a small number of dominant generationcompanies control more than 60% of national generation capacity (EU-COM 2003). Inmarkets which are characterized by former centralised state monopolies, concentrationwithin the market either remains very high or has even been increasing. This is also trueof the German electricity market, historically characterised by a diversity of power gen-eration and power supply, where recent mergers have increased concentration on themarket to much higher levels than existed before market opening in 1998 (Mat-thes/Poetsch, 2002).
2.6 Retail market and consumer activity
Consumer activity on retail markets is influenced by the following aspects, amongstothers:
• The degree of retail market opening (Section 2.1);
• The number of supply companies and their market shares;
• The number of different products/tariffs supply companies offer to final custom-ers; and
• The awareness amongst consumers of the choices and opportunities available tothem.

8/8/2019 4CE Final Report
http://slidepdf.com/reader/full/4ce-final-report 21/88
4CE Final Report
15
The number of licensed electricity suppliers varies significantly between MemberStates, covering nearly three orders of magnitude. For example, in 2002 there were 160suppliers to choose from in Sweden (Swedenergy 2002) but only around 22 in the UK(Electricity Association 2002). In many Member States, concentration on the retail mar-
ket is quite high. In 2000, the largest three suppliers controlled more than 50% of thesupply markets in 10 out of the 15 Member States (EU-COM 2003).
A large number of supply companies does not necessarily mean a high degree of compe-tition. For instance, in Germany, there are between 1100 and 1200 companies sellingelectricity to final consumers. This large number of retailers reflects the retail marketstructure before liberalisation and roughly corresponds to the organisation of the distri-bution networks. However, only a few companies actively offer their electricity for salenationwide, so competition is low.
By opening the retail market to households, domestic consumers become eligible toswitch between electricity suppliers or products or to negotiate new tariffs. Although
several Member States have opened their retail markets fully, so far there has only beena significant level of switching suppliers amongst customers in Sweden and the UK. InSweden more than 40% of domestic and small commercial consumers have eitherchanged to a new supplier or renegotiated the contract with their default company. In theUK, 30-50% of domestic and small commercial consumers have switched suppliers(EU-COM 2003). In other countries with a high degree of market opening, e.g. Germanyand Austria, only few eligible consumers have actively switched.
Low switching rates indicate that there are still obstacles or market barriers preventingconsumers from exercising their right to choose and change supplier. In relation to elec-tricity disclosure, two observed barriers should be mentioned: firstly, the relatively hightransaction costs associated with obtaining the correct information and making compari-sons.12 This is due to the lack of standardised formats for publishing product informa-tion, such as tariffs, or additional information such as the fuel mix or environmentalattributes of the electricity. Secondly, most consumers consider electricity a ‘low inter-est’ product.
Expected cost savings are a major driver for consumers to switch suppliers or to renego-tiate electricity contracts with their default suppliers. This is partly because they cur-rently have few other factors on which to base their decision, although a market forgreen electricity has been established in many Member States in the recent years, ena-bling customers to switch supplier for environmental reasons. In Sweden, electricitylabelled as ‘green’ by the Swedish Nature Conservation Association has become well
established on the market and represents almost 15% of all electricity sold. However,cost differences between green and normal electricity pose a barrier to switching in
12 A Swedish survey showed that 25% of consumers were unaware of their approximate level of annualelectricity consumption and more than 80% were unaware of the approximate savings that might beachieved. About 40% found it difficult to understand and check their electricity bills. Many consumershave either not tried to compare different suppliers, or found the comparison to be difficult (SwedishNational Audit Office 2000).

8/8/2019 4CE Final Report
http://slidepdf.com/reader/full/4ce-final-report 22/88
4CE Final Report
16
many countries. In Germany, less than 10% of consumers say they would accept morethan a 10% increase in price in order to obtain green electricity (Stern 2002). By con-trast, in the Netherlands, the price of green electricity is similar to the average retailmarket price due to tax exemptions for renewable electricity. The Dutch market for
green electricity was fully opened from 2001 and this similarity in price has resulted in ahigh demand for green electricity. The latest figures indicate that approximately 1.8 mil-lion households have switched to green electricity.
For domestic customers the most common billing system is a monthly or quarterly pay-ment based on estimated consumption, balanced by annual meter readings. There is ageneral trend towards internet billing and payment and growing interest in smart meter-ing techniques13.
The type of information currently provided on electricity bills varies between countriesand suppliers, the simplest showing only price aggregated by consumption, transmissionfees and taxes. More complex bills include details on the various tariffs used (peak/off-
peak tariff, spot market/fixed contract based price) for each kWh consumed and person-alised information relating to the customers’ electricity consumption over the previousmonths or quarters.
Supply contracts with larger customers commonly require more frequent meter readings,often including real-time metering. Billing is often streamlined so that one bill includesmeter readings from several different locations.
2.7 Policies of relevance to electricity disclosure
At the EU and Member State level, there are several policies which will potentially in-teract with electricity disclosure. In order to guarantee the proper functioning of a dis-closure scheme it is necessary to identify these interactions and develop sound interfacesbetween the different policies.
At the EU level, disclosure will interact with the Guarantee of Origin (GO) for renew-able electricity, as specified under the Renewables Directive 2001/77/EC14. The aim of the GO is to enable producers and traders of electricity from renewable energy sourcesto demonstrate that the electricity they sell has been produced from an acknowledgedrenewable energy source. The rationale behind this is to enable progress towards theindicative consumption targets for renewable energy set by the Directive to be trackedrather than to provide consumer information. The Directive does not specify the mecha-nism on which the verification system should be based, but this must be considered in
relation to a disclosure verification system in order to avoid any inconsistencies whichmight result in e.g. double counting of renewable electricity (Section 5.4).
13 Smart meters allow automated meter readings providing up-to-date and accurate billing information andcan also incorporate other services, such as feedback on consumption and payment of bills.
14 Concerning the promotion of electricity produced from renewable energy sources in the internal elec-tricity market, adopted on 27 September 2001.

8/8/2019 4CE Final Report
http://slidepdf.com/reader/full/4ce-final-report 23/88
4CE Final Report
17
Similar to the Renewables Directive, the draft Directive on cogeneration15 foresees theintroduction of a GO for electricity from cogeneration. A cogeneration GO would spec-ify the fuel source from which the electricity was produced, the quantity of electricityand heat from cogeneration, as well as the date and place of production. In the draft Di-
rective, the Commission directly links this GO to the rules for electricity disclosure asadopted in the Electricity Market Directive 2003/54/EC.
The interaction of emissions trading with disclosure is outlined in Section 6.3.3.
At the Member State level, the national policies which could interact with an electricitydisclosure scheme are primarily existing support schemes for renewables and cogenera-tion. Major support instruments include feed-in or bonus systems, obligation schemesand tax exemptions.
In addition to the legislative framework, there are some market based instruments whichmight also interact with electricity disclosure. These include existing power certificationschemes, such as quality labels for green electricity tariffs, and voluntary green certifi-cate systems, such as the European RECS system. 16
2.8 Conclusion
From 1 July 2007, all European consumers will be eligible to participate in the Euro-pean electricity market. Consumers will be able to choose an electricity supplier basedon their values provided electricity disclosure provides a sufficient level of markettransparency.
When implementing electricity disclosure, two key aspects need to be considered:firstly, due to large geographical, historical, political and social differences, the electric-
ity markets of EU Member States vary widely with respect to the degree of market open-ing, market structure, generation portfolio and environmental impacts. Secondly, eachMember State has its own legal framework which will interact with electricity disclo-sure in a particular way. In order to guarantee the proper functioning of a disclosurescheme these aspects must be taken into account in the design of the scheme.
15 Draft Directive of the European Parliament and of the Council on the promotion of cogeneration basedon a useful heat demand in the internal energy market; COM(2002) 415 final, July 2002.
16 See the RECS website for details: www.recs.org.

8/8/2019 4CE Final Report
http://slidepdf.com/reader/full/4ce-final-report 24/88
4CE Final Report
18
3 Consumer Choice and Carbon Consciousness
3.1 Who are the consumers?
There are two main categories of electricity consumer: domestic and non-domestic.Domestic refers to private households and non-domestic covers commercial businesses,industry, public administration, agriculture and transport.
In the 4CE project the main focus has been on domestic consumers and small and me-dium-sized enterprises (SMEs)17, with some additional research carried out on electric-ity consumers in the large industry sector. SMEs represent 99% of all enterprises in theEU18 and, in terms of the electricity market, represent the majority of business custom-ers. Due to their small size, both in terms of manpower and turnover, SMEs are morelikely to share characteristics with domestic customers than with large industry.
The supplier-consumer interface is markedly different for domestic consumers and non-domestic consumers. For many large private and public consumers, electricity supplyprocurement has become standard procedure following electricity market deregulation,with companies having well developed methods for tendering for and evaluating elec-tricity supply contracts. Domestic consumers tend to be less informed about the charac-teristics of their electricity supply and less systematic in selecting a specific electricitysupplier, with a narrower range of options to choose from.
3.2 Consumer research
The three main strands of consumer research under the 4CE project were 20 focus
groups
19
and 26 interviews with large industry representatives in each of the five partnercountries (Austria, Germany, Hungary, Sweden and the UK) and a pan-European tele-phone survey of 3000 respondents in 10 European countries.
The focus groups were held between September and December 2002, fourteen with do-mestic consumers and six with SMEs. The objective of the focus groups was to establishthe type of information consumers want to help them in choosing their electricity sup-ply. A number of possible display formats for the disclosure information were tested inthe focus groups.
The large industry interviews were conducted between December 2002 and February2003, with the aim of understanding the process by which these consumers choose their
electricity supply and the impact that electricity disclosure could have on them.
17 Under EC Recommendation 2003/361/EC, small and medium-sized enterprises are defined as busi-nesses with less than 250 employees and a turnover of less than or equal to 50 million
18 http://europa.eu.int/comm/enterprise/enterprise_policy/sme_definition/index_en.htm19 A focus group is a usually a randomly selected group of 6 - 12 people from the general public used to
test and evaluate a concept or product.

8/8/2019 4CE Final Report
http://slidepdf.com/reader/full/4ce-final-report 25/88
4CE Final Report
19
The telephone survey was carried out in January 2003 and gathered responses from 200households and 100 SMEs in each of 10 countries: Austria, France, Germany, Greece,Hungary, Italy, Poland, Spain, Sweden and the UK. The aim of the telephone surveywas to provide statistically representative data on views and attitudes towards electricity
generation and electricity disclosure.The following sections are based on the findings from these three investigations. Thedetailed results are presented in the Phase 2 summary report and the individual task re-ports.
3.3 What consumers know
Carbon consciousness amongst domestic consumers and SMEs does not appear to behigh. Results from the telephone survey indicate that whilst there appears to be aware-ness amongst consumers that the use of fossil fuels contributes to climate change (79%
of households and 81% of SMEs supported this statement), they do not necessarily re-late this to carbon dioxide emissions: 70% of households and 59% of SMES incorrectlybelieve that climate change is caused by a hole in the earth’s atmosphere.
In the focus groups, fossil fuels were perceived as ‘dirty’ and bad for the environmentand the impact of fossil fuels on climate change was discussed.
“I think coal is one of the most damaging, if not the most damaging fossil fuel…it’s
damaged far away places, so I’d be very reluctant to see that continue as long as we’ve
got coal…there’s got to be other ways, I think” – domestic participant in the UK
There appears to be some confusion about which fuel sources produce carbon dioxide:39% of households and 28% of SMEs believe that electricity generation from nuclear
power stations is polluting because it emits carbon dioxide and 28% of households and23% of SMEs believe the same is true of electricity generation from renewable sources.In theory, this could be due to respondents taking into account the fact that under a lifecycle analysis the use of nuclear and renewable sources does result in carbon dioxideemissions to a certain extent, but most respondents are unlikely to have been aware of this fact. In terms of direct emissions, it is only the burning of fossil fuels that producesCO2.
Many of the focus group participants were aware of the main fuels used to generate elec-tricity although some felt they needed more guidance in understanding the pros and consof different fuels. Although most participants in countries with a liberalised electricitymarket knew they could choose their electricity supplier, awareness of the availability of green electricity was low, even amongst those who felt that they were environmentallyaware.

8/8/2019 4CE Final Report
http://slidepdf.com/reader/full/4ce-final-report 26/88
4CE Final Report
20
People are concerned about the environmental impacts of electricity generation, includ-ing climate change and the production of CO2
20.
“Fossil fuels destroy the atmosphere…one does not know how the balance of the gas in
the atmosphere are maintained…it may be destroyed…maybe a completely new equilib-
rium…after which we many not be able to breath” – domestic participant in Sweden
However, consumers expressed the strongest concern about radioactive waste, with 41%of householders giving this impact a score of 10 (on a scale of 1 (low) to 10 (high)).Concern about radioactive waste was also high amongst focus group participants, al-though many saw nuclear power as a ‘necessary evil’ based on the belief that it is theonly realistic alternative to fossil fuels.
Therefore, at a general level, domestic consumer and SME respondents in the telephonesurvey seem to be aware that the generation of electricity has consequences for the envi-ronment and that there is a link to climate change. Some of the discussion in the focusgroups also centred on the wider environmental impacts of renewable energy sources,such as visual impact and the effect on wildlife and their habitats.
Large non-domestic consumers appear to have greater awareness of the relationship be-tween energy use and the environment. It is becoming more common for commercialconsumers to specify certain environmental criteria in the electricity procurement proc-ess, although this generally relates to gaseous emissions rather than radioactive waste(information on which does not appear to be readily available at present). In some casesthey are provided with such information without even requesting it, thus raising aware-ness of the issues. At present, there is no independent verification of the environmentalinformation provided by suppliers.
Increasingly, large companies are disclosing information about the environmental im-
pact of their activities. This is mainly due to a combination of legislative requirementsto disclose environmental information, individual companies creating a ‘green profile’for their consumer goods (often as a result of consumer demand) and public demand forinformation on the environmental standing of companies. In 1999, 47% of the top 100companies in 11 countries21 reported on environmental issues related to their operations(KPMG 1999), which often included data on emissions resulting from energy use. Pub-lic disclosure of non-financial information to satisfy the needs of shareholders, custom-ers, communities and other stakeholders is a trend that has steadily increased over thepast decade. Capability to deal with reporting such issues is growing with the develop-ment of tools and guidelines such as the Global Reporting Initiative and the OECDGuidelines for Multinational Enterprises.
20 On a scale of 1(low) to 10 (high), the average level of concern about the consequences of electricitygeneration amongst householders was 7.0 for carbon dioxide emissions, 7.1 for climate change and 7.5for radioactive waste. The level of concern amongst SMEs was 6.0, 6.3 and 6.4 respectively.
21 Australia, Belgium, Denmark, Finland, France, Germany, Netherlands, Norway, Sweden, UK andUSA.

8/8/2019 4CE Final Report
http://slidepdf.com/reader/full/4ce-final-report 27/88

8/8/2019 4CE Final Report
http://slidepdf.com/reader/full/4ce-final-report 28/88
4CE Final Report
22
Therefore, given the choice, domestic consumers and SMEs would prefer to buy elec-tricity with a low impact on the environment in terms of both climate change and radio-active waste and may be willing to pay a slight premium for it.
The country of origin of the electricity was an important issue, particularly amongst do-mestic consumers. In the focus groups and telephone survey, respondents expressed apreference for electricity that was generated in their own country. The reasons behindthis were explored in the focus groups and included support for national companies andemployment opportunities, perceived higher environmental risks associated with elec-tricity generated in other countries and lack of security of supply and accessibility of imported electricity. These concerns were expressed particularly in relation to importedelectricity from coal and nuclear power.
Another issue raised in the focus groups was dissatisfaction with the way in which in-formation is currently presented in their electricity bills. Pricing information was oftendifficult to understand and compare between suppliers.
“Today I took a looked at our electricity bill and I was frustrated at how complicated it
is” – SME participant in Austria
Other details, such as contract terms and contact information were not always clear.Some focus group participants expressed a strong concern about the ethical and envi-ronmental behaviour of their electricity supplier.
“I want it [the electricity disclosure information] to provide a clearer image of the elec-
tricity suppliers, which goals they are striving for…where they buy their electric-
ity…and what the producers ambitions are…so that consumers can feel extra satis-
fied…one does not want to have to deal with coal power plants in Poland” – domestic
participant in Sweden
With regards to large industry consumers, many of these select their electricity supplierthrough a dedicated purchase unit or through a company which specialises in electricityprocurement. The four main criteria used for evaluating tenders for electricity supplyare: price, administrative streamlining and optimisation (billing and detailed consump-tion statistics), security of supply (reliable supplier with a proven track record i.e. nofinancial difficulties) and, in a growing number of cases, primary energy and environ-mental information.
Companies with a green profile often specify environmental criteria as part of the tenderrequirements, with the aim of purchasing electricity with lower environmental impact(generally non-fossil fuel and non-nuclear). Even those companies without such a de-
clared policy may be offered environmentally declared or environmentally labelled elec-tricity through the tendering process.
Companies (including SMEs) are also interested in being provided with information onthe environmental impact of their electricity to help them in the preparation of their en-vironmental reports. It is also becoming more common for such detail to be requested as
8/8/2019 4CE Final Report
http://slidepdf.com/reader/full/4ce-final-report 29/88
4CE Final Report
23
part of the environmental overview of companies within the regular tendering or biddingprocess in a number of areas.
“We are not environmentally certified, but we have a policy to work for a sustainable
society and energy use…partly to keep the consumption down but also regarding choice
of fuels…each year when we hand in the environmental audit we ask our suppliers
about their energy consumption and emissions…even on stationary…everything we buy
we know how much energy has been consumed…we try to choose materials with low
energy use and that are recyclable” – SME participant from Sweden
3.5 Consumer support for electricity disclosure
So, consumers appreciate that the use of electricity has an environmental impact andthey say that they want to buy electricity with a low environmental impact. Do they alsowant to be given information on the electricity they buy? In other words, do they support
the concept of electricity disclosure?Participants in both the focus groups and telephone survey expressed support for receiv-ing more information related to their electricity supply. This included a range of aspectssuch as clear and comparable price information, information about the fuels used togenerate electricity, the environmental impacts of these fuels, the country of origin,company policy on environmental issues and transparency of the contract details.
In the telephone survey, 80% of households and 68% of SMEs stated that they wouldfind it useful to have their electricity mix and environmental impact of their electricityshown on a label and identified for them. The focus group participants expressed astrong interest in being provided with details of their fuel mix, although attached lessimportance to the environmental impact information, partly because they found the wayin which the information was presented to them difficult to understand.
“The more information I have, the easier my decision might be. It is important to know
where the electricity comes from and what it offers etc. At the moment I don’t have that
information. I would have to get it somehow. It is still very difficult to compare the of-
fers” - domestic participant in Germany
A greater proportion of consumers in the telephone survey would prefer to receive suchinformation annually (47% of householders and 55% of SMEs) rather than with eachelectricity bill (37% of householders and 26% of SMEs). Participants in the focusgroups expressed concern about being sent even more information since many felt theyalready suffered from information overload in their everyday lives.
When it comes to choosing an electricity supplier, there was wide support for an inde-pendent catalogue (in the form of a printed booklet rather than on a website) comparingwhat is offered by all suppliers (82% of householders and 77% of SMEs). Respondentsindicated they would be less likely to use electricity company promotional material orindependent websites comparing all tariffs in making their decision.
8/8/2019 4CE Final Report
http://slidepdf.com/reader/full/4ce-final-report 30/88
4CE Final Report
24
The majority of large industry representatives interviewed were also in favour of a stan-dardised display for the disclosure information which would make evaluation of tendersmore straightforward and allow them to use environmental criteria in the evaluationprocess. A system for quick and simple comparisons between tenders was supported by
those involved in electricity procurement.
3.6 Conclusions
There is awareness amongst consumers that climate change is an issue and that it islinked to the use of fossil fuels. Consumers are concerned about the environmental im-pacts resulting from electricity generation, especially carbon dioxide emissions and ra-dioactive waste. However, at present, consumers do not have easy access to informationabout the relationship between their electricity supply and its environmental impacts northe tools with which to put this information to use in selecting their electricity supplier.There is strong support for receiving information on both the fuel sources and environ-
mental impact of electricity in a standard format with the electricity bills. Not onlywould this mean that people would be better informed about what they are currentlybuying, it could also assist consumers in choosing their electricity supplier, providedthat there is some way of being able to compare what is being offered by all suppliers(e.g. through an independent catalogue). In addition to this, electricity disclosure couldact as a broader educational tool in helping people make the links between electricityconsumption and environmental impacts such as carbon dioxide emissions – improvingcarbon consciousness.
Electricity disclosure is the process by which this can be achieved. Through the provi-sion of reliable and accurate data and the clear presentation of the information, electric-
ity disclosure can provide consumers with what they want and enable them to choosetheir electricity on the basis of their personal values.
8/8/2019 4CE Final Report
http://slidepdf.com/reader/full/4ce-final-report 31/88
4CE Final Report
25
4 Presentation of information
One of the key elements of an electricity disclosure scheme is the way in which the in-formation is presented to the consumer. This includes both the format of the display and
the media through which the information is conveyed as well as the actual informationthat is included in the display. Details on the mechanism by which this information isgenerated and collected are provided in Chapter 5.
For disclosure information to be useful to a consumer, it must provide them with theappropriate information and level of detail, be clearly displayed and simple to under-stand, and available at a suitable time and place. It is also important that the informationis eye-catching in order to draw peoples’ attention to it – this could be achieved throughthe use of colour and graphics.
A detailed consideration of the various options for the display of the disclosure informa-tion is included in the 4CE Phase 3 report. The discussion here focuses on the key find-
ings from this report. The options for display of the information are first consideredfrom the point of view of what is required under the Directive and then from the per-spective of the consumer and what they want. Finally, recommendations for the displayof the disclosure information and for areas requiring further research are given.
4.1 Minimal compliance
Taking the wording of the Directive as the starting point, this section outlines how thedisclosure information could be displayed to achieve minimal compliance with the Di-rective. Although this represents potentially the quickest and cheapest option, there are anumber of disadvantages with this approach, which are discussed below.
4.1.1 Fuel mix information
The Directive requires that information on the fuel mix of the suppliers’ portfolio isprovided on an ex-post basis (‘over the preceding year ’) in or with the electricity billsand promotional materials. There is no further guidance on what format this informationshould take. Therefore, at a minimum, this could be interpreted as displaying the infor-mation as a single line of text somewhere on the bill (e.g. on the front page of the bill oron an additional sheet) and promotional materials. For example:
‘Sources of electricity: coal (40%), gas (33%), nuclear (25%), oil (1%), renewables
(1%), other (0%)’
This type of display has the advantage that it would be relatively straightforward to in-clude on the current electricity bills, requiring minimal bill redesign, and promotionalmaterials and therefore could be produced at a fairly low cost to suppliers.
However, there are a number of major drawbacks to using this display format, particu-larly from the consumer’s perspective. Only minimal information is provided, with noadditional explanation of what the data mean and no reference figures are given to set
8/8/2019 4CE Final Report
http://slidepdf.com/reader/full/4ce-final-report 32/88
4CE Final Report
26
the information into context. A simple line of text has no visual appeal and will notstand out amongst the other information given in the bill or promotional materials.Therefore this information is unlikely to be noticed by many consumers.
4.1.2 Environmental impact information
In terms of the environmental impact information, the Directive requires that there hasto be a reference in or with the electricity bill and promotional materials to an existingreference source such as a website, where information on at least CO2 emissions andradioactive waste associated with the supplier’s portfolio is displayed. For example:
‘For details on the environmental impact of the electricity sold by Supplier X, please see
www.supplierx.com or telephone 0800 111 222 to request a copy of this information’
As with the fuel mix information, there is no further guidance as to how this informationshould be presented. At a minimum, a website could contain basic information on thesetwo environmental indicators as absolute figures per kWh. For example:
‘Over the past year, the electricity sold by Supplier X has resulted in the generation of x
kilograms of CO2 & x micrograms of radioactive waste per kWh of electricity produced’
This information would be simple to display on the website at low cost. Presenting theinformation per kWh also aids comparability between suppliers, provided consumershave some way of finding out what other suppliers are offering.
However, absolute figures by themselves are not easy for people to comprehend – re-search in the US has demonstrated that the effectiveness of information presented in thisway is greatly reduced (Moskovitz et al, 1998). Therefore, such minimal informationwould again have the disadvantage that it is difficult for the consumer to understand and
put into context.In addition, the location of the information is important. Whilst the internet is an easyand low-cost medium in which to display information, the major drawback is equality of access – currently 62% of households in the EU do not have access to the internet(Eurobarometer 2001). Even those households with internet access might not necessarilylook up this information – in the telephone survey, only 51% of households with inter-net access and 48% of SMEs stated that they would visit such a website. In reality thesefigures are likely to be even lower since people generally over-estimate what they mightdo in practice when responding to this type of question. Therefore the impact of anyinformation displayed solely on the internet will be limited.
In terms of achieving equality of access, a phone number or reply-paid postcard for peo-ple to order a paper version of the website information could be included in or with thebill and promotional materials along with the website address. However, there is still noguarantee that people would do this and these restrictions represent a barrier to the freeflow of information to consumers and increases the associated transaction costs.

8/8/2019 4CE Final Report
http://slidepdf.com/reader/full/4ce-final-report 33/88
4CE Final Report
27
4.1.3 Impact of minimal compliance
Minimal compliance with the Directive in the manner outlined above would certainlyensure that there is more information available to consumers on their electricity than at
present. However, the issue is the extent to which people will even notice the informa-tion on the bill and promotional materials or access the information on the website.Given the basic text display lacking in visual appeal and low access to the website, it islikely that the information will not reach the majority of consumers.
Evidence from the telephone survey indicates that there is a high level of concern aboutradioactive waste and climate change amongst consumers, but poor understanding of thelinks between electricity generation and carbon dioxide emissions (Section 3.3). Underminimal compliance, there is no environmental information on the bill nor any explana-tion provided on the various fuel sources. Therefore, for those consumers who do takenote of the fuel mix information on the bill, they are more likely to react against electric-ity generated from nuclear power than fossil fuels. Given the strong support for renew-able sources (Section 3.4), these consumers would probably favour renewable energyinstead.
Since the environmental information is not included with the bill, the opportunities foreducating people about the links between their electricity consumption and carbon diox-ide emissions are limited.
4.2 Existing label designs
There is a wide variety of label designs in use in the twenty or so full disclosureschemes in operation in the USA, both in terms of the information provided and the way
in which it is displayed. A full review of the different labels and practices of theseschemes is contained in the Electric Product Disclosure Status Report (Sedano, 2002).However, there is no assessment of how well any of the various designs have workedfrom a consumer or industry perspective. Standardisation is minimal across the states,although this had been recommended at the outset by the National Council on Competi-tion and the Electricity Industry.
In the Austrian disclosure scheme, the only European scheme to date, there was no har-monisation of the information display when the scheme was first introduced, resulting ina wide variety in the display format used by each supplier. Some suppliers presented theinformation in tables and others used simple text. However, this situation was felt to beunsatisfactory, both for consumers and suppliers, and the scheme is now fully harmo-nised in terms of the type of information that must be provided (fuel sources). However,there is no standardised display format – suppliers are only required to ensure that theinformation is ‘readable’ and no other information should be given which may confuseconsumers.
Given the lack of evidence from evaluations of existing schemes, it is difficult to drawany firm conclusions as to the successful aspects of the display formats in use.

8/8/2019 4CE Final Report
http://slidepdf.com/reader/full/4ce-final-report 34/88
4CE Final Report
28
4.3 Consumer research
In order to establish what type of display format would be best for consumers, a numberof options for both fuel source and environmental impact information display were
tested in the focus groups (Section 3.2). Some of these options were based on formatsalready in use in existing schemes.
At a general level, the focus group participants expressed a wish to be provided withfurther explanation of the information since they felt that numbers and percentagesalone were not enough. The preferred options for the disclosure information display arediscussed below.
4.3.1 Fuel source display
The focus group participants were given several display formats to choose from: simpletext, table listing percentages of the fuel sources (with no breakdown for renewables),
table listing percentages of the fuel sources including a detailed breakdown of the re-newable sources and pie charts (without percentages).
Many of the focus group participants felt that it was important to use a combination of display options since different people respond to display formats in different ways, find-ing some easier to understand than others. The majority of respondents preferred agraphical display (pie chart) with the percentages of each fuel displayed, but also wanteda detailed breakdown of renewable sources which would be difficult to display in a piechart due to the small percentages involved. Hence, the favoured option for the displayof the fuel source information was the combination of a pie chart with percentages and atable with a detailed breakdown of the renewable sources. The pie chart represents aneye-catching and visually appealing graphic, particularly if in colour, whereas the tableis a suitable format for providing more detailed and comparative figures. There was alsostrong support for a more detailed explanation of the figures in order to help people putthem into context.
The focus group participants were also in favour of being provided with comparativefigures, such as the national average fuel mix, as a reference to compare their supplierwith. The inclusion of comparative figures also received strong support amongst thetelephone survey participants, with over 60% of householders and 50% of SMEs indi-cating that some kind of comparison would be useful.
There was also support from both the focus groups and the telephone survey for infor-mation on the proportion and country of origin of any imported electricity. Figure 5shows that 74% of householders and 64% said that they would want to know the propor-tion of imported electricity, whilst 79% of householders and 58% of SMEs stated thatthey would want to know the country of origin of the electricity). This is not somethingthat is required to be disclosed under the Directive.

8/8/2019 4CE Final Report
http://slidepdf.com/reader/full/4ce-final-report 35/88
4CE Final Report
29
0%
20%
40%
60%
80%
100%
Would only buy
locally generated
Want to know %
imported
Happy to buy
imported
Want to know country
of origin
Households
SMEs
Figure 5 Attitudes towards imported electricity – domestic customers and
SMEs23
4.3.2 Environmental indicator display
Again the focus group participants were provided with a number of different displayformats to discuss: a ranked label on a scale of A-G (using colour bars similar to the EUenergy label for domestic appliances), an indexed bar chart and ranked information on a
scale of A-G presented in a table format.Although the focus group participants were interested in this information, they found itdifficult to understand the display formats presented to them – all need some furtherexplanation of what the labels were trying to convey. Of the three, the ranked ‘Energy’label received the strongest support, mainly because people recognised this format fromthe appliance energy label. The indexed bar chart was the second most popular option,although people had difficulties in interpreting and understanding the indexed scale,particularly the concept of something being greater than a national average of 100.
Despite the problems associated with the display formats tested in the focus groups, thereaction to this information was positive – the participants were interested to know more
about the environmental impact of their electricity. Further research is needed in order toidentify the most appropriate format to use to convey this information.
The possibility of including other environmental indicator in the display was discussedin the focus groups. This mainly focused on other gaseous emissions such as NOx and
23 This was a multiple response question – the graph shows ‘strongly agree’ and ‘agree’ responses out of 100% for each issue.
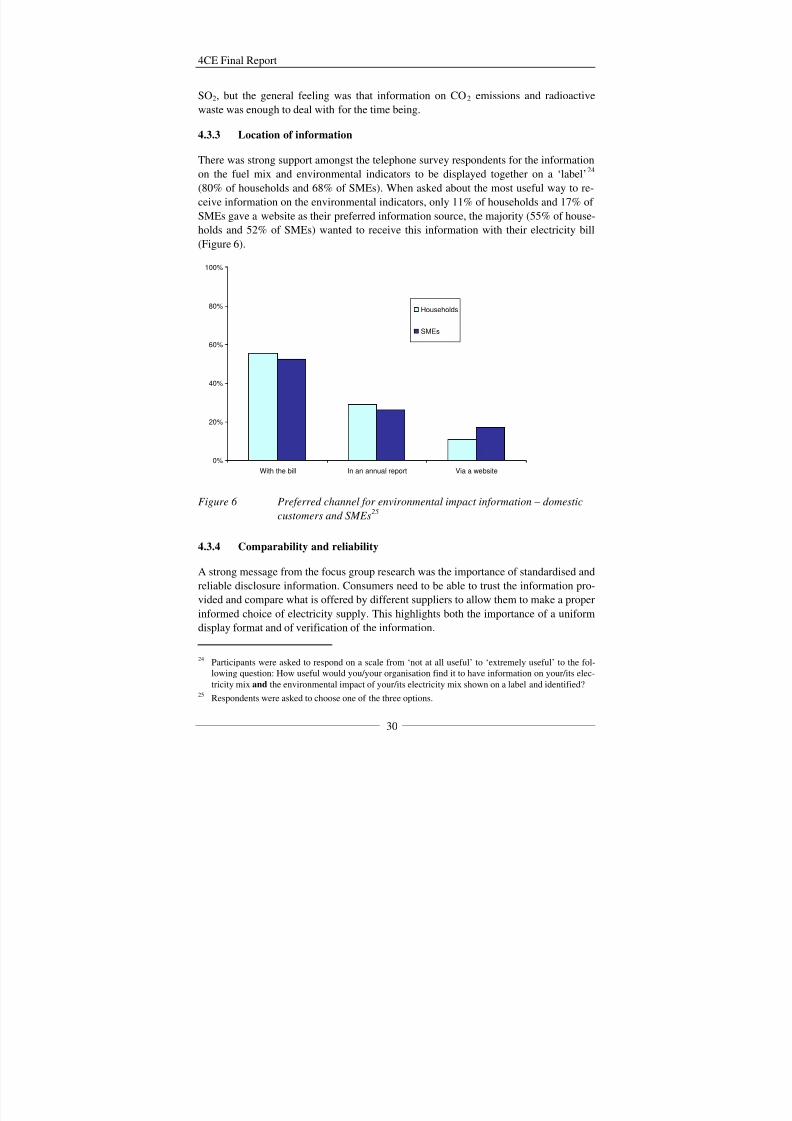
8/8/2019 4CE Final Report
http://slidepdf.com/reader/full/4ce-final-report 36/88
4CE Final Report
30
SO2, but the general feeling was that information on CO2 emissions and radioactivewaste was enough to deal with for the time being.
4.3.3 Location of information
There was strong support amongst the telephone survey respondents for the informationon the fuel mix and environmental indicators to be displayed together on a ‘label’24 (80% of households and 68% of SMEs). When asked about the most useful way to re-ceive information on the environmental indicators, only 11% of households and 17% of SMEs gave a website as their preferred information source, the majority (55% of house-holds and 52% of SMEs) wanted to receive this information with their electricity bill(Figure 6).
Figure 6 Preferred channel for environmental impact information – domestic
customers and SMEs25
4.3.4 Comparability and reliability
A strong message from the focus group research was the importance of standardised andreliable disclosure information. Consumers need to be able to trust the information pro-vided and compare what is offered by different suppliers to allow them to make a properinformed choice of electricity supply. This highlights both the importance of a uniformdisplay format and of verification of the information.
24 Participants were asked to respond on a scale from ‘not at all useful’ to ‘extremely useful’ to the fol-lowing question: How useful would you/your organisation find it to have information on your/its elec-tricity mix and the environmental impact of your/its electricity mix shown on a label and identified?
25 Respondents were asked to choose one of the three options.
0%
20%
40%
60%
80%
100%
With the bill In an annual report Via a website
Households
SMEs

8/8/2019 4CE Final Report
http://slidepdf.com/reader/full/4ce-final-report 37/88
4CE Final Report
31
Harmonisation of the display format is most crucial at a Member State, rather than EU,level, since the majority of consumers will only ever buy electricity within their owncountry. Such standardisation would mean that a supplier from one country wishing tosell electricity in another country would be required to use the display format of the
country in which they are selling (i.e. not of the country where the electricity is gener-ated).
Harmonisation at an EU level is unlikely to have any major benefits for domestic con-sumers, although it could benefit non-domestic consumers who operate multi-nationally.It may also be of benefit to the electricity industry through reduced cost, in terms of con-sumer research and design (which could be done at the EU level rather than in each in-dividual country), and through ease of selling electricity in other countries (since thedisplay format would not have to be changed).
Harmonisation at the EU level is more important in terms of the content of the disclo-sure information and deciding on common definitions and calculations. This would be
of particular benefit to the electricity industry in terms of cross-border trade and wouldensure that the information is directly comparable between countries, avoiding any con-fusion. It would be sensible to base fuel source definitions on those used in other Direc-tives (e.g. Renewables Directive 2001/77/EC). In terms of the environmental indicators,there should be agreement on the units used and the basis on which the carbon dioxideemissions and radioactive waste figures are calculated. This is dealt with in more detailin Section 5.3.
Electricity disclosure provides consumers with information that is relevant for themwhen choosing their electricity supplier. However, the Directive only requires informa-tion be provided to consumers in relation to their current supplier, i.e. on what they areactually buying, rather than information on what is available on the market. Althoughthe disclosure information must also be displayed on ‘promotional materials madeavailable to final customers’26, it is unlikely that every single supplier will send mailingsto all potential customers. And this also means that customers would then have to col-lect and compare all these promotional materials in order to make a proper comparison.
A far simpler option would be to compile an independent catalogue comparing what isbeing offered by other suppliers, as supported by respondents in the telephone survey(Section 3.4). This is important if consumers are to have access to the necessary infor-mation for the proper functioning of a liberalised market. Such a catalogue could becompiled by the industry regulator on the basis of the disclosure information displayedby suppliers and could also include price information. Obviously, standardisation of the
disclosure information (e.g. definitions, calculations, units used) would assist in compi-lation of the catalogue. The catalogue could be provided to consumers annually or onrequest and the information could also be displayed on a website, for those with internetaccess.
26 This is assumed to cover any promotional materials sent directly to the customer. It does not includenewspaper or TV advertisements (Katrien Prins, pers. comm.).

8/8/2019 4CE Final Report
http://slidepdf.com/reader/full/4ce-final-report 38/88
4CE Final Report
32
Such a catalogue is already provided in Sweden by the Swedish Consumer Agency. 27 This guide is intended for private households that want to compare offers from electric-ity suppliers on the Swedish market, in terms of price as well as other relevant informa-tion such as environmental labels, billing procedures and additional services. In Austria,
the regulator E-control provides the ‘Tarifkalkulator’ catalogue which gives tariff andfuel mix information for electricity available from all Austrian suppliers.28
Verification of the information is vital if consumers are to have confidence in the disclo-sure scheme. The Directive also requires Member States to ensure that the disclosureinformation provided to consumers is ‘reliable’. Much of the verification of data wouldbe incorporated into the mechanism for tracking the electricity (Section 5.4), however, itwould still be necessary to check that the information that suppliers provide to consum-ers is correct and matches the data from the tracking mechanism. This would be the re-sponsibility of the industry regulator or consumer watchdog and should be mandatory,carried out by an independent body. This could be combined with the process of compil-ing the independent catalogue mentioned above. For instance, the supplier’s disclosureinformation is only included in the catalogue once it has been checked and verified,thereby providing the consumer with a source of guaranteed reliable information onwhich they can base their decisions on.
4.4 Recommendations
Given the evidence from the consumer research conducted under this project (outlinedabove and in the preceding chapter) and the disadvantages associated with a minimalinterpretation of the Directive, it is apparent that the ideal format for displaying the dis-closure information goes beyond minimal compliance. This section presents recommen-
dations for the optimal display format from a consumer perspective, along with theiradvantages and disadvantages.
4.4.1 Fuel source display
The recommended option for fuel mix display is a combination of a pie chart and table(Figure 7), as used in the disclosure schemes of Illinois, Michigan and Minnesota in theUS. The fuel mix of the supplier’s portfolio is displayed in a pie chart and the same fig-ures are also displayed in the accompanying table, along with the national average con-sumption figures and a detailed breakdown of the renewable sources.
The national average is given in terms of consumption rather than generation so that any
transmission losses, imports and exports are accounted for.
27 http://www.elpriser.konsumentverket.se/ 28 http://www.e-control.at/

8/8/2019 4CE Final Report
http://slidepdf.com/reader/full/4ce-final-report 39/88
4CE Final Report
33
Electricity supplied by Supplier X, 2002Electricity supplied by Supplier X, 2002
Electricity supplied by Supplier X wasgenerated from the following fuel sources
Norm EN - Electricity Directive 2003/54/EC
Gas5%
Other energysources
1%
Coal61%
Nuclear25%
Renewables8%
15% of electricity sold by Supplier X was imported
0,0%0,0%Other renewables
0,0%0,0%Solar
0,8%0,3%Biomass
3,2%3,2%Wind
3,5%4,5%Hydro electric
7,5%8,0%Renewables (total)
3,5%1,0%Other conventionalenergy sources
7%5%Gas
31%25%Nuclear
51%61%Coal
for comparison
averageconsumption
Country Z
Supplier
X
Fuel source
Figure 7 Recommended display format for fuel mix information
It is important that the fuel list and display format should be standardised within any onecountry. It is recommended that there is a fixed list of fuels for all Member States, e.g.coal, nuclear, gas, other and renewables. Renewables are always listed last so as to allowthe inclusion of a detailed breakdown of these sources e.g. hydropower, wind, biomass,
solar and other. A supplier must always display the full list of fuels, including the de-tailed breakdown of renewables, even if a source is not represented in their portfolio. Afixed list ensures comparability between suppliers within each country and it will re-main relatively constant over time (i.e. it is unlikely that it will need to be altered if thereis a change in fuels used nationally). It also alerts consumers to the fuel sources they arenot buying from. Common definitions and terms for the various fuel sources should beagreed between the Member States to ensure consistency and comparability. The overallproportion of imported electricity is provided.
Member States should define the colours or black and white shading to be used by sup-pliers for each fuel source in the pie charts.
The advantages of this display format is that it is line with consumer preferences ex-pressed in the focus groups discussions and it is eye-catching and visually appealing.
The disadvantages are that it requires more space than a simple line of text and is likelyto be more expensive to produce since the printing processes to generate graphics (pos-sibly including colour) are more complex. However, if the information is displayed noton the bill itself but on a separate insert or leaflet, these disadvantages are less relevant.

8/8/2019 4CE Final Report
http://slidepdf.com/reader/full/4ce-final-report 40/88
4CE Final Report
34
4.4.2 Environmental indicator display
Based on the consumer research under this project, although it is clear that consumerswant to provided with environmental indicator information in some format, it is not pos-
sible to come to any firm conclusions regarding the best display format to use. The twomost popular options amongst the focus group participants are discussed here andshown in Figure 8 and Figure 9, but it is recommended that further research is under-taken in this area to determine the most useful and informative display format for con-sumers.
It is recommended that absolute figures are provided within the environmental indicatordisplay as a reference to set the information into context. These figures can also helpraise awareness of the issues and allow consumers to calculate their own individualemissions if they wish. In terms of CO2 emissions, absolute figures could be expressedas kilograms per kWh (kg/kWh). In terms of radioactive waste, the Directive does notspecify whether this refers to high, medium or low level waste. Calculation of theamount of high-level waste produced is reasonably straightforward, whereas there iswide variation in the amount of medium and low-level waste produced depending on thedifferent options for handling nuclear waste (e.g. reprocessing, interim storage). There-fore it is recommended that the disclosure information is based on high-level wasteonly, in terms of micrograms per kWh. Although it is unlikely that many people wouldknow what a microgram is, other units used to express the level of radioactivity, such asBequerels or Sieverts, are likely to be even less familiar to the average consumer.
If Member States decide to go beyond the requirements of the Directive and includeother environmental indicators in the disclosure information, the display format shouldbe the same as that used for CO2 emissions and radioactive waste. The principles under-
lying the calculation of the environmental indicators are covered in Section 5.3.
Figure 8 Ranked environmental indicator display

8/8/2019 4CE Final Report
http://slidepdf.com/reader/full/4ce-final-report 41/88
8/8/2019 4CE Final Report
http://slidepdf.com/reader/full/4ce-final-report 42/88
4CE Final Report
36
The main drawback to an indexed scale is that people may have difficulties in under-standing the index – as was the case in the focus groups where the participants had diffi-culties in understanding the indexed scale.
4.4.3 Location of information
As discussed in Sections 3.5 and 4.3.3, consumers would prefer to be provided withboth the fuel source and environmental indicator information together with their elec-tricity bill. They also wanted to be given more details on the information to explain whatit means and set it into context.
It is strongly recommended that if the environmental indicator information is providedwith the bill then both CO2 and radioactive waste must be displayed together – bothindicators should be treated equally. This is to avoid one indicator being displayed withthe bill and the other on a website, giving prominence to one indicator over the other.
The display formats outlined above require a substantial amount of space. Therefore it isrecommended that the disclosure information is not displayed on the bill, but shown ona separate leaflet, which is sent out with the bill. A leaflet means there is more space todisplay the information and provide additional explanation of the data. In addition tothis, it has more flexibility in terms of printing, since it does not have to be incorporatedinto the existing bill printing process and could therefore be cheaper than incorporatingthe information in the bill. A separate leaflet may also be more useful as a form part of the promotional material for the supplier. The text included in the leaflet should be stan-dardised within each Member State to a certain extent, at least in terms of what informa-tion should (and should not) be included. An example of what the leaflet could look likeis given in Appendix B.
Alternatively, the information could be brought together on a separate insert, also sentout with the bill, but without any additional explanatory information (as is the case inmany of the US disclosure schemes). This would be more in keeping with the concept of a stand-alone label which could easily be incorporated into promotional materials. Anexample of this insert is provided in Appendix C.
The main drawback with this is that consumers may not notice the leaflet or insert and just throw it away without having read it. Therefore, it is recommended that there is aclear link between the leaflet and the bill, to draw peoples’ attention to the leaflet. Forexample:
‘The electricity sold by Supplier X in 2002 resulted in x kilograms of CO2 emissions &
x micrograms of radioactive waste per kWh. See accompanying leaflet for more detail’.This information could also be personalised, for example:
‘Your electricity usage in 2002 resulted in x kilograms of CO2 emissions & x micro-
grams of radioactive waste. See accompanying leaflet for more detail’
Such personalised information is likely to be particularly relevant to non-domestic con-sumers, who may require this detail as part of their environmental reporting or tendering

8/8/2019 4CE Final Report
http://slidepdf.com/reader/full/4ce-final-report 43/88
4CE Final Report
37
processes. However, providing personalised information depends on the current meter-ing and billing practices in each country and may not be straightforward for all coun-tries. An alternative option would be to incorporate a standardised emissions calculatoron the suppliers’ websites to enable consumers to input their electricity consumption
data from their bill and identify their own personal emissions in absolute figures.Although the leaflet may be less expensive in terms of printing costs compared to a re-design of the bill, postage costs could be higher since the leaflet represents an additionalsheet added in with the bill. In order to minimise this extra cost, it is recommended thatthe leaflet is sent out with the bill, rather than as a separate mailing, although where cus-tomers are not sent a paper copy of the bill, e.g. if they pay their bills electronically, or if customers request the information, a separate mailing may be necessary. Initially it maybe preferable to send the information at least twice a year (at least in countries wherebills are sent out more frequently than once a year) to reinforce the message to consum-ers. In some countries this may incur additional postage costs.
The Directive requires the disclosure information to be displayed in promotional materi-als made available to final customers. It is recommended that the promotional materialsshould display both the fuel mix and environmental indicator information in the formatsoutlined above i.e. the same presentation as provided in the leaflet with the bill. Thepromotional materials do not necessarily have to contain any additional explanation, asis recommended for the leaflet, but it would be helpful and less confusing for the con-sumer if the same graphics were used, as in the separate insert outlined in Appendix C.This would also be more straightforward from the point of view of the supplier. Anotheroption would be to just send out the leaflet with the promotional materials, in whichcase the promotional materials should contain a reference to the leaflet, similar to thosedescribed above.
4.4.4 Product versus portfolio
The Directive requires information on the suppliers’ portfolio. It is assumed that portfo-lio refers to all the electricity sold to final consumers, both domestic and non-domestic,by the company that is named on the bill (rather than the parent company). This does notnecessarily exclude product information, but this would have to be provided in additionto the detail on the portfolio. In many Member States, suppliers have started to marketelectricity based on different electricity products, such as green products which relymostly on renewable energy sources. In some cases the product is equivalent to the sup-plier’s portfolio and in other cases the green product represents a subset of the portfolio.
In order to avoid mis-leading consumers, it is strongly recommended that if a supplierprovides product information to one group of customers, the supplier is then obliged toprovide product information to all customers, so that no-one is under the impression thatthey are buying the full portfolio, avoiding the problem of double-counting that wouldoccur if product information was kept optional. For example, if a supplier created agreen product and only provided product and portfolio information to those customersbuying this product, the remaining customers would be given portfolio information

8/8/2019 4CE Final Report
http://slidepdf.com/reader/full/4ce-final-report 44/88
4CE Final Report
38
which includes the green electricity being sold separately as a green product. Therefore,it would appear to these customers that they were buying a proportion of green electric-ity in the portfolio mix, whereas in actual fact, some or all of this electricity has alreadybeen sold exclusively to the green product customers.
Displaying both product and portfolio information of course has implications in terms of space and possible confusion amongst customers. It is recommended that, assumingstandardisation of the display format, the portfolio information is always provided in theformat outlined above. If suppliers wish to provide product information it could be in-cluded as an additional column in the fuel mix table and environmental indicator displayoutlined above, although this would detract from the standardised portfolio format. Itshould be made clear what the product information relates to. An example of a com-bined portfolio and product insert is shown in Appendix D.
4.5 Conclusions
Provision of the disclosure information based on minimal compliance with the Directiveis likely to be limited in impact and does not provide consumers with easy access to allthe information they require in order for them to make an informed choice of electricitysupply. It is likely that such minimal display, with the environmental indicator informa-tion not shown in or with the bill, will result in consumers being more likely to expressan anti-nuclear rather than an anti-fossil fuel vote.
For maximum consumer information and benefit, it is recommended that the disclosureinformation content and display format is harmonised at least at a Member State level,with definitions and calculation methods agreed at a European level. The disclosureinformation should be provided with each bill on a separate insert or leaflet, preferably
with a direct link to the leaflet or insert on the bill. The fuel mix information should bedisplayed as a pie chart and table. Environmental indicator information could be dis-played in the form of a ranked or indexed label, but further research is required to estab-lish which is the most suitable display format. Providing information on individualproducts in addition to the portfolio information is optional, but it is recommended thatif a supplier provides product information to one group of customers, the supplier isthen obliged to provide product information to all customers. Verification of the infor-mation provided to consumers is essential and should be carried out by an independentbody.
Whatever display format is chosen, there needs to be a procedure in place for gathering
the appropriate data to be displayed. This process is discussed in the next chapter.

8/8/2019 4CE Final Report
http://slidepdf.com/reader/full/4ce-final-report 45/88

8/8/2019 4CE Final Report
http://slidepdf.com/reader/full/4ce-final-report 46/88
4CE Final Report
40
panies and therefore could buy power from them through bilateral contracts, al-though this is not always the case.
• Power exchanges allow electricity to be traded on the open market and are impor-tant in setting a transparent market price for electricity. Within these exchanges, it iscommon for electricity traders to trade electricity many times to optimise their port-folio. This increases the complexity of the market and it is not easy to identify anunambiguous relation between the buyer and seller of the electricity.
The physical electricity market is supplemented by diverse financial derivatives, such asfutures and options. However, the tracking mechanism only has to deal with these if they are fulfilled by physical delivery (as opposed to financial payments).
In addition to the trading arrangements, there is also balancing power in the market.This is required because it is never possible to forecast the demand of consumers ex-actly, nor to avoid unplanned outages of power plants. Surpluses and deficits of kilo-watt-hours in the system account for around 5 % of the total market and are usually bal-anced out by the transmission system operators.
Every electricity flow along a line incurs losses, which must be balanced out as well.The percentage of losses varies between approximately 0.5 % for high voltage to morethan 5 % for low voltage systems.
Organisation of the electricity markets is not yet fully harmonised at the European level.With the exception of the Scandinavian region, most electricity markets operate on anational basis. However, in mainland Europe, the UCTE30 system and the Florenceprocess are working towards harmonisation of the wholesale markets (Chapter 2). Atracking mechanism must reflect possible differences in the regional electricity marketsand restricted capacities of interconnecting lines for imports and exports.
Most Member States have already implemented procedures for monitoring emissionsfrom power plants. With regard to CO2 emissions, a European standard for monitoringwill be introduced in the course of the intended EU Emissions Trading Scheme. Thisscheme will require fossil fuel power plants above a rated thermal input of 20 MW tomonitor and report their fuel input and emissions. This data could be used by the elec-tricity disclosure scheme.
Following from the Renewables Directive (2001/77/EC), Member States are required toset up a system of Guarantees of Origin (GO) for electricity from renewable sources.31 This interfaces closely with the tracking mechanism required for electricity disclosure. Itis strongly recommended that Member States consider to merge the GO and the tracking
mechanism into one single scheme.
30 Union for the Co-ordination of Transmission of Electricity, www.ucte.org 31 A similar system of GO is envisaged for electricity from cogeneration in the draft Directive on the
promotion of cogeneration, COM(2002) 415.

8/8/2019 4CE Final Report
http://slidepdf.com/reader/full/4ce-final-report 47/88
4CE Final Report
41
5.3 Requirements for the information provided
The Directive requires suppliers to disclose the fuel sources used for electricity genera-tion and information on the environmental impact, at least in terms of CO2 emissions
and radioactive waste. This refers to the electricity actually sold by suppliers, whetherimported or not. As discussed in Chapter 4, it is recommended that information on theshare of imports is also disclosed to consumers, i.e. the country of origin must betracked as well. This information must be aggregated at the level of the supplier portfo-lio. Member States are free to specify the provision of additional information if theychoose, e.g. other environmental indicators or data on differentiated products offered bysuppliers, such as green products (see Chapter 4 for details). It should be noted that theinclusion of additional environmental indicators might increase the complexity and costof the tracking mechanism.
Most power plants operate on the basis of a single fuel and information on fuel source iseasily available. There are also multi-fuel plants, e.g. using biomass and non-renewablefuels, for which regular verification of the fuel input would be required.32
There are two basic alternatives for the determination of environmental indicators:
• A simple solution would be to track only the fuel sources from generator to supplierand then to apply generic emission factors for each fuel at the level of the supplierportfolio. These emission factors could be based on national averages.
• As a second option, plant-specific emission factors could be used which would haveto be tracked together with the fuel source information.
The first option would be easier to operate but it would not reflect the significant differ-ences in emission factors between different plants operating on the same fuel. 33 This is
of specific relevance to cogeneration plants, which use the heat generated in the processof power production. If the efficiency benefit of these plants is not reflected throughplant-specific emission factors, then the share of high-efficiency cogeneration plants asdefined by the draft cogeneration Directive34 could be displayed as part of the disclosureinformation.
In both cases, emission factors can be based on the direct emissions from a power plantor on total life cycle emissions. However, there is no agreement as yet across the EU onthe basis on which indirect emissions (as part of the life cycle emissions) are definedand calculated.
The Directive does not state which power plants must be included in the disclosure
scheme. The terms ‘suppliers’ and ‘customers’ used in the Directive imply that disclo-
32 In many Member States such verification is already performed, e.g. for fuel taxation purposes.33 For instance, there is a 25% variation on specific CO2 emissions between the best and worst coal-fired
power stations in the UK (National Power, 1998). The variation can be even higher if cogenerationplants are taken into account.
34 See footnote 31.

8/8/2019 4CE Final Report
http://slidepdf.com/reader/full/4ce-final-report 48/88
4CE Final Report
42
sure applies to the public supply system and so autoproducers can be disregarded. Inorder to reduce cost and complexity, it would be sensible to exclude power plants belowa certain capacity limit from the tracking mechanism e.g. power plants below 5 MW.Smaller plants could be integrated into virtual large plants using standardised emissions
data for the purposes of tracking.Another way to limit costs would be to base the disclosure scheme as far as possible ondata which is already verified for other purposes, such as data collected for the EUEmissions Trading Scheme or fuel taxation. For example, tracking could include allfossil fuel power plants above a rated thermal input of 20 MW, which corresponds tothe intended EU Emissions Trading Scheme. Again, standardised emission factors couldbe used for small plants.
Common definitions of fuel sources, emission factors and rules for the coverage of plants across Member States would enable the tracking systems to facilitate cross-bordertrade of electricity and international comparability of disclosure information.
It is essential that the information used for electricity disclosure is subject to verifica-tion. Such verification must, besides other things, ensure that all generation is trackedand that there is no double counting of electricity from certain fuel sources. A compara-ble level of verification in all countries connected to European transmission systemswould enhance consumer confidence in the disclosure information.
5.4 Options for tracking electricity
There are several options for the method of assigning attributes from power plants, suchas fuel source and emissions data, to the portfolios of suppliers (or products). Each isdiscussed in turn.
5.4.1 Statistical data
It would be possible to use the attributes of certain mixes of power plants, such as na-tional generation averages, the mixes of multi-national transmission systems (e.g. theUCTE mix) or the mix of power plants owned by the respective supplier. If national orEU averages are used, it would not be necessary to collect data from individual plants orto track attributes through the trading procedures, because such averages are alreadyknown from energy and emissions statistics. This approach would be unaffected by theproportion of power exchanges in the market as well as balancing power and line losses.
However, this option significantly reduces the meaningfulness of the disclosed informa-tion. If all suppliers were assigned the national average data, there would be no con-sumer choice since each supplier in any one country would have the same portfolio.Electricity disclosure would be reduced to a very general information instrument aboutthe average characteristics of the national electricity systems.
Alternatively, average attributes of power plants owned by a generation company affili-ated to the supplier could be used. This would establish a certain level of differentiation

8/8/2019 4CE Final Report
http://slidepdf.com/reader/full/4ce-final-report 49/88
4CE Final Report
43
and consumer choice. Such an approach would only cover part of the market, since mostsuppliers acquire a significant share of their portfolio through trading and there aremany suppliers that do not own any generation. Therefore, rules for dealing with tradedelectricity would also need to be defined. In order to avoid tracking of individual market
transactions, average attributes of generation in certain transmission systems (e.g. UCTEor NORDEL) could be applied to traded electricity. However, this would lead to signifi-cant double-counting of attributes, because a considerable part of the transmission sys-tem mix would consist of supplier-owned generation which has already been assigned totheir respective customers.
Therefore, tracking based on statistical data alone does not provide a sufficient level of precision and would not enable consumer choice. However, it may be acceptable to usestatistical data to a limited extent if no other source of information is available.
5.4.2 Contract based tracking
Under this approach, the electricity attributes follow the contracts which are made be-tween generators, traders and suppliers of electricity (Figure 10). Most of the US stateswhere electricity disclosure has been introduced have started with this approach to track-ing, following the money flow instead of the physical electricity.35 Attributes of powergeneration must be accounted for at every step of trading. This can be facilitated in twoways:
• Each participant in the electricity market could set up an accounting system for theattributes of their electricity portfolio on an individual basis. Attributes would beprovided in every electricity transaction. For example, if a supplier concludes a bi-lateral contract with a generator, the generator would provide the attributes of its
power plant to be entered in the supplier’s accounting system. Similarly the genera-tor has to keep track of the volume and attributes of the electricity it sells. Therewould be no standardised format for the data held in the accounting systems. How-ever, it would be sensible to maintain the integrity of attributes, e.g. it should not bepossible to detach the CO2 emissions from electricity generated from coal. The dis-closure scheme in Austria follows this principle.
• The second option would be to introduce a system of ‘tags’ which are kept as entriesin a central registry database and contain information on the attributes of a certainvolume of electricity, e.g. 1 MWh, in a standardised format. These tags would be is-sued for all electricity generation and transferred from generators to traders and sup-pliers attached to the electricity contracts. For example, in the case of the bilateral
contract mentioned above, the generator would transfer the corresponding number of tags from its registry account to the registry account of the supplier to match thevolume of electricity traded. There would be one central registry in each country or
35 Ed Holt, personal communication.

8/8/2019 4CE Final Report
http://slidepdf.com/reader/full/4ce-final-report 50/88
4CE Final Report
44
several countries could share a registry. Registries must be operated by independentactors and confidentiality of the information maintained at all times.
Electricitysupplier
Electricitytrader
(contractual) flow of electricity
flow of electricity attributes
Electricitysupplier
Electricitytrader
(contractual) flow of electricity
flow of electricity attributes
Electricitysupplier
Electricitytrader
(contractual) flow of electricity
flow of electricity attributes
(contractual) flow of electricity
flow of electricity attributes
Figure 10 Contract based tracking
The first option would be easier to implement, because each market participant is able tochoose the accounting system best suited to them, whereas under the tag system theywould have to subscribe to a standardised central registry system for handling tags. Themajor shortfall of the first option is that it is very difficult to monitor and verify. In orderto achieve an acceptable level of reliability, independent audits of each accounting sys-tem would be required which could be very costly. The central registry in the tag ap-proach would facilitate relatively easy verification and could ensure that attributes are
not double-counted. However, a central registry for tags may raise significant confiden-tiality concerns, because it reflects all activities on the electricity market. Further re-search would be required on how the mandatory transfer of tags together with electricitycontracts could be enforced. It is likely that the overall cost of the tag system would belower because transfers of attributes are performed on a uniform basis and verification issimplified through the central registry.
Neither alternative for contract based tracking would work easily with power exchangesdue to the large number of trades involved and the lack of a direct relationship betweenbuyer and seller within the exchange. One option would be to collect the attributes of electricity sold into the exchange over a certain period in time, e.g. a week or a month,and assign the average of these attributes to the electricity which has been purchasedfrom the exchange during this period. Another option would be to use statistical aver-ages, such as the UCTE mix, for the electricity traded through the exchange. However,as stated above, this leads to double-counting of attributes and should only be used if themarket share of the exchange is low.
For consumers the main advantage of a tracking system based on electricity contractscompared with tradable certificates (see below) is that it reflects the actual trading of

8/8/2019 4CE Final Report
http://slidepdf.com/reader/full/4ce-final-report 51/88
4CE Final Report
45
electricity and so is conceptually straightforward. The disclosure information wouldshow consumers which power plants their supplier bought electricity from and thereforeto which generators their money is going, at least for the proportion of the market cov-ered by bilateral contracts.
For the electricity industry, contract tracking requires the electricity attributes to be in-corporated into each and every electricity contract. This could incur high transactioncost for traders. In addition, there could be a risk that competitors get a better insightinto the market positions of other participants in the electricity market through the dis-closure information.
5.4.3 Tracking based on tradable certificates
Tradable certificates are already used in renewable electricity support schemes withminimum quota obligations in several EU Member States and are also the basis of theRenewable Energy Certificate System (RECS), which is operated by more than 80 com-
panies and organisations from the European electricity sector.In the context of electricity disclosure, certificates could be issued for each kilowatt-hour delivered to the public grid. The certificates would detach the attributes of powergeneration from the electricity contracts and make them tradable on a separate market,thus avoiding some of the disadvantages of a contract-based mechanism. The ‘grey’electricity (i.e. without attributes) is traded in the same way it is at present and a separatemarket would emerge for trading the attributes of the electricity (Figure 11). All suppli-ers would be required to acquire and redeem a sufficient number of certificates to covertheir sales to final customers. The attributes of a supplier’s portfolio would be deter-mined from the certificates that it redeems.
Electricitysupplier
Attributestrader
(contractual) flow of electricity
flow of electricity attributes
Electricitytrader
Electricitysupplier
Attributestrader
(contractual) flow of electricity
flow of electricity attributes
Electricitytrader
Electricitysupplier
Attributestrader
(contractual) flow of electricity
flow of electricity attributes
(contractual) flow of electricity
flow of electricity attributes
Electricitytrader
Figure 11 Tracking based on tradable certificates

8/8/2019 4CE Final Report
http://slidepdf.com/reader/full/4ce-final-report 52/88

8/8/2019 4CE Final Report
http://slidepdf.com/reader/full/4ce-final-report 53/88
4CE Final Report
47
tricity sales from suppliers to final consumers not covered by the redemption of tags orcertificates are assigned an average mix of attributes.
For example, if the settlement period of electricity disclosure is the calendar year, atsome point after the end of each year, all tags or certificates relating to power generationin the previous calendar year which have not been redeemed by a supplier would be col-lected from the registry. These tags or certificates represent the balance between theattributes which have been redeemed and the attributes of the total electricity sold in thatyear. These are then used to form the attributes of the residual mix, thus ensuring thatthe tracking system is comprehensive, i.e. all generation attributes are used for disclo-sure.
A residual mix can be used with either a tags or certificates based system, but requires acentral registry which is able to determine all tags or certificates which have not yetbeen redeemed. The GIS system in New England, USA uses this approach in combina-tion with tradable certificates.
The main advantage of using a residual mix is that only those market participants whowant to actively steer the attributes of their portfolio (e.g. because a supplier offers spe-cific products such as green electricity or because suppliers have set up company poli-cies to meet certain fuel mix and/or emissions targets) have to deal with tracking, Thiscan help to reduce the overall operating cost for the tracking system. On the other hand,the residual mix reduces the precision of the disclosed information. It may result in largeparts of the market relying on the residual mix and only dedicated ‘green’ consumersreceive differentiated products. This would limit consumer choice and represents noimprovement in market transparency compared to the situation today. In order to mini-mise such risks, the use of the residual mix could be restricted to a certain share of eachsupplier’s portfolio.
5.6 Imported electricity
The tracking mechanisms outlined above can easily handle cross-border transactions of electricity provided that the mechanisms used in both the importing and exporting coun-tries are compatible. However, it is necessary to define rules for the situation where theexporting country has no tracking mechanism or where the schemes involved are notcompatible. The Directive states that aggregate figures provided by the exporting under-taking for the previous year may be used. However, this may lead to double-counting of attributes if the exporting country has no system of Guarantees of Origin in place for the
energy being exported. In this case, the average generation mix of the exporting countryfor the previous year could be used. This data is available from statistical sources.37
37 More details on how to deal with imports and exports can be found in the Phase 1 report of the 4CEproject.
8/8/2019 4CE Final Report
http://slidepdf.com/reader/full/4ce-final-report 54/88
4CE Final Report
48
5.7 Minimal compliance
This section outlines a minimal compliance approach to tracking of electricity based onthe text of the Directive. The benefits and shortfalls of such an approach are also dis-
cussed.
5.7.1 Description of the minimal compliance approach
As stated in Section 5.4.1, the use of statistical data for determining the attributes of suppliers’ portfolios is not sufficient in terms of providing precise information. There-fore, since the Directive requires reliability, tracking must either use a contract-based orcertificate system. A minimal compliance approach could be based on electricity con-tracts, with attributes being accounted for by systems set up by market participants on anindividual basis (Section 5.4.2).
In order to facilitate the European internal market for electricity, Member States would
have to agree on general principles for these accounting systems, including interfaces forthe transfer of attributes across borders. Reliability of the disclosed information must beensured by verification of the accounting systems and their data, performed by inde-pendent auditors, e.g. on an annual basis.
However, due to the complexity of the electricity market, it is not possible for a con-tract-based tracking scheme to achieve 100% market coverage38 and so it would be nec-essary to allow market participants to handle certain volumes of electricity as ‘grey’, i.e.without assigning any attributes. This ‘grey’ electricity should be disclosed to consum-ers as ‘electricity with unknown origin’. An alternative would be to assign attributesbased on statistical averages to the ‘grey’ electricity. However, this would result in dou-ble-counting of attributes and would suggest a higher degree of precision to the con-sumer than is actually achieved by the tracking mechanism. The introduction of thiscategory would limit the accuracy of the disclosure system, e.g. if significant shares of electricity are traded via power exchanges. Therefore the total share of ‘grey’ electricityshould be restricted to a reasonable level, e.g. around 10 % of the total (national, re-gional or European) market. If this share is exceeded, Member States would have toconsider introducing a comprehensive, mandatory tracking system based on tags or cer-tificates.
With regard to environmental indicators, either generic emission factors for each fuelsource or plant-specific emission factors could be used. In both cases, only direct emis-sions from the plants would be accounted for, until agreement has been reached about
how the life-cycle emissions should be calculated. Member States would need to chooseone or other of these two options since co-existence of both is likely to lead to double-counting of those plants with low emissions. ‘Grey’ electricity should be excluded from
38 For example, average attributes will usually be used under this approach for electricity which has beentraded through power exchanges or which is used for balancing.

8/8/2019 4CE Final Report
http://slidepdf.com/reader/full/4ce-final-report 55/88
4CE Final Report
49
the calculation of environmental indicators because this could only be based on statisti-cal averages, which would not be accurate or helpful to consumers.
Following the implementation of disclosure into Member State legislation, required byJuly 2004, market participants would need at least one year to set up and test their ac-counting systems. Hence the system is unlikely to begin operating any earlier than Janu-ary 2006 and the earliest disclosure information could be made available to consumerswould be mid 2007, based on data from the year 2006.
5.7.2 Evaluation
The minimal compliance approach requires a low level of regulation of the tracking sys-tem by Member States and allows high flexibility for market participants. Therefore thisapproach might be favoured by some Member States and parts of the electricity indus-try. However, it is still necessary for Member States (or the electricity industry) to agreeon common standards for communication between the attribute accounting systems. The
limited harmonisation of the tracking mechanism would be likely to result in barriers tocross-border trades, additional cost and loss of information.
In general, the reliability of the minimal compliance approach is heavily dependent onthe level of verification. There is a high risk of error and fraud due to the lack of stan-dardised procedures for data acquisition and data handling and there is no central regis-try to prevent double counting. Therefore, an acceptable level of reliability would re-quire mandatory annual audits of all accounting systems in the market, performed byaccredited technical auditors. This would incur significant additional costs.
The need to allow for ‘grey’ electricity in the market reduces the accuracy of the disclo-sure information. If Member States cannot agree to limit the market share of ‘grey’ elec-
tricity, this would undermine the reliability of the information provided to consumers.A major drawback to the minimal compliance approach is that it requires electricity at-tributes to be tracked at every stage of trading. This could incur high transaction costsfor electricity traders and can reduce liquidity in some parts of the market. It is likelythat electricity traders would lobby Member States to increase the share of ‘grey’ elec-tricity allowed in the system, further reducing the accuracy of disclosure information.
It is strongly recommended that Member States merge the Guarantees of Origin (GO)for electricity from renewable sources and the tracking mechanism into one singlescheme. This means that the minimum compliance approach as set out in this sectionshould not be used by Member States which have decided to base the GO on a system of
tags or tradable certificates held in central registries.
5.8 Recommendations
The recommended approach to tracking requires to go beyond the minimum require-ments of the Directive in order to facilitate reliable disclosure information.
8/8/2019 4CE Final Report
http://slidepdf.com/reader/full/4ce-final-report 56/88

8/8/2019 4CE Final Report
http://slidepdf.com/reader/full/4ce-final-report 57/88
4CE Final Report
51
close to their customers. As stated in the previous section, it is strongly recommendedthat Member States merge their systems of Guarantees of Origin for electricity fromrenewable energy sources and cogeneration and the tracking mechanism into one singlescheme.
The timescale for implementation is similar to the minimal compliance approach. Thedevelopment of the central registries could start in mid 2004 and would take at least oneyear.41 The collection of data, issuing of tags and certificates and their transfer would beunlikely to begin earlier than January 2006 and the earliest disclosure information couldbe issued to consumers in mid 2007.
5.8.2 Evaluation
The implementation of common rules for data acquisition and central registries ensuresa high level of reliability of the disclosure information and at the same time reduces theoverall cost of verification. Participants in the electricity market have a high degree of
flexibility being able to transfer attributes together with electricity contracts, use sepa-rate markets for certificates or rely on the residual mix. This minimises the impact of tracking on the wholesale market for electricity. Provided the residual mix is only usedto a limited extend, this approach has the potential to provide a high degree of accuracyof disclosure information. Given these features, it is expected that this recommendedapproach would not incur a higher overall cost compared to the minimum complianceapproach.
It will be necessary for Member States and the Commission to closely monitor the ef-fects of the free flow of certificates and the use of the residual mix. If market partici-pants use either of these options extensively, this could undermine the accuracy and
credibility of the information provided to consumers. To minimise this risk, MemberStates could restrict the use of the residual mix, e.g. to a maximum share of 20 % of theportfolio of each supplier. Similarly, the use of certificates could be restricted by settinga minimum share of tags in each supplier’s portfolio (which would be linked to electric-ity contracts). Alternatively, the free flow of certificates could be restricted to certainareas, e.g. the service areas of transmission system operators (Section 5.4.3). Such re-strictions should only be implemented if they are necessary to ensure the reliability andcredibility of the disclosure information.
5.9 Conclusions
It is possible to provide consumers with reliable electricity information by introducing atracking mechanism. However, in order for such a system to be effective, it is necessarythat Member States agree on principles of these mechanisms, joint definitions of the
41 It might be possible to base the development of the registries on the experiences gained in the RECSinitiative for a certificate system for electricity from renewable energy sources, which has been sup-ported by the European Commission.

8/8/2019 4CE Final Report
http://slidepdf.com/reader/full/4ce-final-report 58/88
4CE Final Report
52
information to be provided, procedures for data calculations and interfaces for commu-nication across borders. It is also essential that any mechanism which provides disclo-sure information must be verified independently and effectively to avoid errors andfraud.
The discussion of options has shown that any disclosure scheme based on statistical datadoes not generate sufficient precision and does not enable consumer choice. Because of the relevance of electricity trading, it is necessary to track market transactions properly.The minimal approach discussed above, based on individual accounting systems oper-ated by market participants, could serve this purpose. However, its reliability is stronglydependent on the intensity and effectiveness of third-party verification and this is likelyto incur relatively high cost.
The recommended approach, which features a central registry for electricity generationattributes, would enable market participants to track electricity in a reliable and rela-tively low-cost way. It offers considerable flexibility to market participants. However,
extensive use of the residual mix would undermine the accuracy of disclosure informa-tion and therefore market participants should use this option with care.
The operation of the tracking mechanism should be monitored closely by Member Statesgovernments and the Commission. If necessary, the system should be adapted accordingto experiences made.
8/8/2019 4CE Final Report
http://slidepdf.com/reader/full/4ce-final-report 59/88
4CE Final Report
53
6 Costs and impacts
6.1 The cost of implementing disclosure
The cost of implementing a disclosure system will depend upon the chosen method of tracking information from generators to suppliers, the requirements set out for verifyingdata and the way in which the information is presented to consumers. Whilst the costswill be borne by generators, suppliers, traders and government appointed bodies, themajority of these costs will ultimately be passed on to electricity consumers.
The main supplier-related costs include:
• purchasing certificates (if appropriate);
• estimating portfolio qualities of total purchases;
• verification of purchases and sales;
• bill redesign and/or printing;
• any additional postage.
Generators will have costs associated with:
• registering and auditing plants;
• verification of plant data.
The regulator or appointed body will bear the cost of :
• the central register;
•
verification of the system.Within a certificates-based disclosure system, both generators and suppliers will incursome costs in gaining accreditation and obtaining certificates. Also, as described inChapter 5, a common central register will need to be set up and run by a regulator (orsimilar appointed body). Costs borne by a regulator (or appointed body) can be passedonto the actors involved.
Within a contracts-based disclosure system costs associated with transferring data fromgenerator to supplier will be incurred by generators, suppliers and traders. Use of acommon central register, whilst not being required for a contracts-based system, wouldallow for simpler auditing, thereby reducing regulatory costs.
In addition to the costs suppliers will incur in acquiring the information on the attributesof their electricity (whether contracts or certificates), they are likely to incur some addi-tional costs through changes to their billing procedures and any additional postage (if more pages are sent out) in order to incorporate the disclosure information in or with thebill (see Chapter 4 for a discussion of the various options).
Estimates for the cost of implementing disclosure in Germany, Hungary and the UKhave been made. These three countries differ on a number of levels such as electricity

8/8/2019 4CE Final Report
http://slidepdf.com/reader/full/4ce-final-report 60/88
4CE Final Report
54
industry infrastructure, status of liberalisation and population, thus giving an indicationof the range of potential costs throughout Europe. The costs for Hungary, as an Acces-sion Country without a liberalised market, are most likely to change in the future. Esti-mates for Germany and the UK are more robust.
Estimates have been made for the front-side (changes to billing format and proceduresand postage costs) and the back-side (the tracking mechanism)42. The cost estimates forthe front-side focus on the electricity bill and do not include the cost of incorporating thedisclosure information into the promotional materials. Under the costs for the back-side,three different options for the tracking mechanism (Section 5.4) have been considered: acontracts-based system which does not use a central registry, a contracts-based (tags)approach with a central registry, and a certificates-based approach using a central regis-try. Two different options for the front-side (Chapter 4) were considered:
1. Disclosure information displayed on the bill using some type of graphic e.g. piechart or table, thus requiring bill redesign but using the suppliers’ existing equip-
ment;2. Disclosure information displayed on a separate leaflet or insert, which is printed
separately and sent out with the bill.
It is estimated that the total cost of implementing disclosure will be up to 0.01 cent/kWh, based on cost estimates for Germany, Hungary and the UK. A certificates-based tracking approach is the lowest cost option in all three countries. Displaying dis-closure information on the bill was the lower cost option in Germany and the UKwhereas in Hungary, a separate leaflet is the cheaper solution.
Table 2 shows the costs of disclosure in Germany for three different approaches totracking and two different options for presenting the information to consumers. The
costs include both the initial cost of establishing the systems (one-off costs have beenannualised over 5 years, using a zero interest rate) and running costs for all the playersinvolved. As can be seen, it is anticipated that the cheapest system that could be devel-oped in Germany would use a certificates-based approach with information being in-cluded on consumers’ bills. The costs of providing information to consumers is a sig-nificant proportion of the overall cost (40%-60%).
42 For full details see the 4CE Phase 3 Cost-benefit analysis report

8/8/2019 4CE Final Report
http://slidepdf.com/reader/full/4ce-final-report 61/88
4CE Final Report
55
Table 2 Estimates of the cost of disclosure in Germany
Total costs of con-tracts (no central
register)
Total costs of con-tracts (with central
register)
Total costs of cer-tificates (with cen-
tral register)43
millionEuros
cent /MWh
millionEuros
cent /MWh
millionEuros
cent /MWh
Back-side 31.1 6.2 21.9 4.4 15.9 3.2
Front-side option 1 18.9 3.8 18.9 3.8 18.9 3.8
Front-side option 2 25.1 5.0 25.1 5.0 25.1 5.0
TOTAL (option 1)
TOTAL (option 2)
50. 0
56.2
10.0
11.2
40.8
47.0
8.1
9.4
34.8
41.0
7.0
8.2
In the UK and Hungary, however, the front-side costs are significantly lower than thecost of tracking (3%-14% and 13%-23% of total costs respectively), as can be seen inTable 3 and Table 4 which show estimates of the costs involved in establishing and run-ning a disclosure system in these countries.
Table 3 Estimates of the cost of disclosure in the UK
Total costs of con-tracts (no central
register)
Total costs of con-tracts (with central
register)
Total costs of cer-tificates (with cen-
tral register)millionEuros
cent /MWh
millionEuros
cent /MWh
millionEuros
cent /MWh
Back-side 7.7 2.3 9.3 2.8 6.0 1.8
Front-side option 1 0.3 0.1 0.3 0.1 0.3 0.1
Front-side option 2 1.0 0.3 1.0 0.3 1.0 0.3
TOTAL (option 1)
TOTAL (option 2)
8.0
8.7
2.4
2.6
9.6
10.3
2.9
3.1
6.3
7.0
1.9
2.1
43 It should also be noted that this estimate does not take into account the cost reduction that may resultfor market players through the synergies with the Guarantee of Origin for electricity from renewableenergy sources and similar requirement for cogeneration, both of which could be facilitated by thetracking system as well.

8/8/2019 4CE Final Report
http://slidepdf.com/reader/full/4ce-final-report 62/88
4CE Final Report
56
The cost estimate for the UK is lower than that for Germany mainly because of the largenumber of suppliers (and therefore fewer customers per supplier) in Germany – 750suppliers compared to around 22 in the UK. The high front-side costs in Germany are aconsequence of higher postage rates compared to the UK and Hungary.
Table 4 Estimates of the cost of disclosure in Hungary
Total costs of con-tracts (no central
register)
Total costs of con-tracts (with central
register)
Total costs of cer-tificates (with cen-
tral register)
millionEuros
cent /MWh
millionEuros
cent /MWh
millionEuros
cent /MWh
Back-side 1.1 2.8 1.1 2.8 0.9 2.4
Front-side option 1 0.3 0.7 0.3 0.7 0.3 0.7Front-side option 2 0.2 0.4 0.2 0.4 0.2 0.4
TOTAL (option 1)
TOTAL (option 2)
1.4
1.3
3.5
3.2
1.4
1.3
3.5
3.2
1.2
1.1
3.1
2.8
Costs in Hungary are much lower than those in the UK and Germany, representing thelower range of the likely costs of disclosure within Europe. This is due to lower staff costs, a low number of generators and a non-liberalised market – all of which are likelyto change once Hungary joins the EU in 2004.
Table 5 Summary of total costs of disclosure in Germany, UK and Hungary
Front-side Back-side Germany UK Hungary
cent /MWh
cent /MWh
cent /MWh
Bill redesign Contracts (no central register) 10.0 2.4 3.5
Contracts (with central register) 8.1 2.9 3.5
Certificates (with central register) 7.0 1.9 3.1
Separate leaflet Contracts (no central register) 11.2 2.6 3.2
Contracts (with central register) 9.4 3.1 3.2
Certificates (with central register) 8.2 2.1 2.8
8/8/2019 4CE Final Report
http://slidepdf.com/reader/full/4ce-final-report 63/88
4CE Final Report
57
Table 5 summarises and compares the total cost of each option for the disclosure systemin the three countries. It is clear that, for all options, the cost of disclosure representsonly a small percentage of the final price of electricity (average of the domestic and non-domestic selling price): between 0.1%-0.2% in Germany (assuming an average price of
6.5 cent/kWh), between 0.03%-0.04% for the UK (assuming an average price of 7.5 cent/kWh) and between 0.04%-0.05% for Hungary (assuming an average price of 7.4 cent/kWh).
6.2 Benefits of implementing disclosure
The principal reason for implementing a system of disclosure is to support the function-ing of the liberalised electricity market by providing consumers with information to helpthem to make informed choices in selecting their electricity supply. There are also addi-tional benefits, including increased consumer awareness of the link between electricityconsumption and emissions of environmental pollutants, and an increase in the demand
for electricity generated from renewable energy sources.Based on the 4CE consumer research, it appears likely that consumers, once given achoice, will choose electricity products that are generated from sources which result inlow carbon emissions and low levels of nuclear waste. In the medium to long term thiscould lead to an increase in the quantity of electricity generated from renewable energysources within the EU. This would result in consequential environmental benefits, in-creases in employment in the electricity sector and an improvement in security of sup-ply, all of which are key EU objectives. Based on the outcome of the scenarios devel-oped as part of the 4CE project44, consumer demand could lead to up to an additional 25TWh per annum being generated from renewable energy sources within the EU in the
medium to long term45
. Assuming this additional generation from renewables leads toless generation from gas-fired power plant (which has a high marginal cost of genera-tion, and provides a conservative assumption for CO2 emission reductions), this increasein renewables in the EU will avoid in the region of 10.4 million tonnes of CO2 per year.Renewables also provide improved security of supply and an increase in employment inthe electricity generation industry.
The actual increase in capacity due to disclosure will be affected by the range of policieschosen by governments to support renewable energy technologies, many of which willbe complemented by disclosure and may account for some of the increase that wouldotherwise result from consumers voluntarily choosing renewables.
In the longer term, increased consumer awareness of the fuel mix and emissions result-ing from electricity consumption could help to create political pressure for the introduc-tion of further policy measures which support low carbon and low nuclear waste genera- 44 For full details see the 4CE Phase 3 Scenarios report45 This figure is based on customers’ willingness to pay (WTP) in each country and the cost curves for
developing new capacity within these countries, taking into account that the actual WTP is likely to beonly in the region of 20% of the stated WTP.
8/8/2019 4CE Final Report
http://slidepdf.com/reader/full/4ce-final-report 64/88
4CE Final Report
58
tion, which would have an additional positive environmental impact. These are dis-cussed in more detail in Section 6.3.2.
6.3 Supporting and interacting policies
6.3.1 Making disclosure effective
A number of additional activities could be developed in order to ensure that disclosureis effective, both in terms of raising people’s awareness of the impacts that their electric-ity consumption is having upon the environment and enabling consumers to make aproperly informed choice of electricity supplier based upon their personal values.
An awareness raising campaign preparing people for disclosure, aimed at helping themto interpret and use the information presented to them with their electricity bills, wouldenhance the impact and effectiveness of the disclosure information. Campaigns both
before and after the introduction of disclosure would provide a vital introduction andsupport for consumers. Other energy and environment related education campaignscould then build on this increased knowledge – the disclosure information could be acost-effective way of communicating a message to all households and businesses.
Some suppliers will no doubt use the disclosed information as a marketing tool to pro-mote themselves and their products. Therefore, in order for consumers to be able tomake an informed choice, it is important that they are able to compare information fromdifferent suppliers. Disclosure information could be provided in an independent nationalcatalogue, which is also displayed on a website, distributed in each Member State.
6.3.2 Building on disclosure
Disclosure can also be used as a foundation for developing policy instruments whichhelp to achieve EU objectives that are over and above those for which disclosure isoriginally being implemented. There are a variety of policies that could be introduced toenhance the impact of disclosure, including:
• Fiscal measures;
• Carbon caps placed on suppliers and consumers (tradable domestic quotas);
• Minimum standards set on products (if applicable);
• Procurement specification;
• Mandatory disclosure in company reports.Electricity disclosure would enable differentiated tax rates to be imposed on electricityconsumption according to the carbon emissions and/or nuclear waste content resultingfrom its generation. Such an approach would be a step towards internalising the externalcosts of electricity production, with electricity which has been produced from RES be-ing subject to a lower tax rate. This would provide an additional market based incentivefor consumers to buy electricity which had a low environmental impact.

8/8/2019 4CE Final Report
http://slidepdf.com/reader/full/4ce-final-report 65/88
4CE Final Report
59
Carbon caps could be placed on each suppliers’ portfolio, with, for example, each com-pany having a limit set (per consumer) on the amount of carbon that it can sell. Thislimit could be reduced over time. Such an approach could be the cornerstone for adownstream emissions trading scheme46. Alternatively, if a market for individual elec-
tricity products is developed, minimum standards could be placed on electricity prod-ucts. For example, suppliers could be required to limit the per kilowatt-hour carbonemissions or nuclear content of electricity sales. Again, these limits could then be re-duced over time.
It is anticipated that the disclosure information on the environmental impacts of electric-ity could be incorporated into procurement specifications for goods and services by or-ganisations in both the public and private sectors. Disclosed information could also sim-plify the procedures used by public authorities and private companies to obtain envi-ronmental indicators such as CO2 emissions relating to their operations and energy pur-chases. An increasing number of organisations are publicly disclosing such non-financial information to highlight improvements in their environmental record (e.g. viaEMAS, the voluntary Eco-Management and Audit Scheme, designed to highlight com-panies’ environmental performance). Company reports could be required to include fuelmix information and associated environmental impacts of energy purchases, thus ensur-ing consumer demand for accurate and reliable disclosure information.
Increased consumer awareness of the link between electricity usage and sources of envi-ronmental impacts could encourage consumers to take actions to reduce energy con-sumption and also pave the way to the introduction of policies which support wider EUobjectives. The effectiveness of such initiatives would in part be dependent upon theinformation that is provided to consumers via disclosure and the effectiveness of infor-mation campaigns which focus on the information being disclosed.
6.3.3 Interaction with other policies
It will be important to ensure that the disclosure scheme complements existing andplanned policies and market-based instruments. Synergies or conflicts could arise withthe systems established for Guarantees of Origin for renewable electricity (GO), pro-posed cogeneration guarantees of origin, the Renewable Energy Certificate Scheme(RECS), emissions trading schemes and renewable energy support mechanisms, such asfeed-in laws and renewable energy obligations. In some cases, the way in which disclo-sure will interact with these other instruments will be dependent upon whether a con-tract-based (without a central registry) or a certificate-based (with a central registry us-ing tags or certificates) approach is used for tracking.
The interaction of disclosure with GO (both for renewables and cogeneration) andRECS is of crucial importance. The EU Renewables Directive on the promotion of elec-tricity from renewable energy sources in the internal electricity market (2001/77/CE)
46 It would be difficult to avoid double counting if such an approach was used in conjunction with theforthcoming upstream EU Emissions Trading Scheme. However, in the long term a downstream emis-sions trading scheme may be considered to be more appropriate.

8/8/2019 4CE Final Report
http://slidepdf.com/reader/full/4ce-final-report 66/88
4CE Final Report
60
requires Member States to put a system in place for issuing a Guarantee of Origin forrenewable electricity by October 2003. The revised draft of the EU Directive on cogene-ration47 contains a similar provision for a Guarantee of Origin for electricity from co-generation. RECS is a voluntary trading system which aims to provide a cost effective
and reliable certificate system for renewable energy in Europe and is now in operationafter a two year test period in Europe. The RECs system can provide valuable informa-tion regarding the issue and administration of certificates, the operation of central regis-tries and trading mechanisms.
The RECS management body is very keen to see the integration of Guarantees of Originand RECS certificates so that the certificates are compatible. Whilst Guarantees of Ori-gin have to be implemented in each Member State, it is not clear the extent to which theGO will be harmonised between Member States. On the other hand, although RECS isvoluntary, where RECS systems are in use, these are harmonised. A single registry forall certificates could help to ensure that there is no double-counting. The RECS systemcould be easily adapted to a system of Guarantees of Origin and vice versa and thesesystems could also be extended to cover all forms of electricity generation for the pur-poses of a certificate-based disclosure scheme using a central registry. A contracts-baseddisclosure scheme without a central registry would be incompatible with GO and RECSand would lead to double counting of the electricity attributes. It is strongly recom-mended that Member States merge their systems for GO (and RECs where applicable)with the disclosure tracking mechanism.
In addition to certificates issued under GO or RECS, there may also be other certificatesor tags used to represent the environmental benefits accruing from the same electricityproduced under various different schemes e.g. Renewable Obligation Certificates andClimate Change Levy Certificates in the UK. This can result in duplication of informa-
tion, infrastructure and costs and there is a considerable risk of double-counting theelectricity attributes. Some rationalisation will be required to ensure consistent, fair andefficient policy, either through integrating all schemes into one certification system (asrecommended for GO and RECS) or by viewing the different certificates as separatesupport mechanisms with clear rules regarding the role of each.
Feed-in tariffs, which provide a ‘market push’ for electricity generated by renewableenergy sources, are another common policy at the national level, currently being used inGermany, Austria, Spain and France. This tariff usually covers the additional productioncost for electricity generated by renewable energy sources compared to the market pricesfor electricity. In principle there is a distinction between renewable electricity sourceswhich are covered by a feed in tariff scheme (financially supported sources) and thosewhich are not (market mature sources). However, given that subsidies for other fuelsources are not likely to be covered under disclosure and that Guarantees of Origin donot make such distinction, it is suggested that there is no need to separately identify re-
47 Amended proposal for a Directive of the European Parliament and of the Council on the promotion of
cogeneration based on a useful heat demand in the internal energy market, COM(2003) 416 final.

8/8/2019 4CE Final Report
http://slidepdf.com/reader/full/4ce-final-report 67/88
4CE Final Report
61
newable sources supported by a feed-in tariff in the disclosure information. Such a dis-tinction is more suited to the role of green ‘quality’ labels.
With regard to emissions trading, the European Commission is proposing to introduce ascheme for greenhouse gas emission trading from 2005.48 This is an upstream systembased on the use of primary energy i.e. it is the generators of electricity who are obligedto reduce emissions, not the consumers. As electricity disclosure refers to the informa-tion provided by electricity suppliers to consumers and the tracking of electricity in thewholesale market (i.e. downstream), there is no direct link between emissions tradingand disclosure. However, much of the plant-specific data required for monitoring andreporting under the emissions trading scheme (e.g. on fuel input and emissions) overlapswith the information required for disclosure, therefore it would be sensible and cost-effective to use such reported data for the purposes of disclosure.
In the longer term, the introduction of electricity disclosure could even have an effect onthe general design of the European Emissions Trading Scheme. One of the reasons for
selecting an upstream approach for Emissions Trading in the electricity sector was that itwas not clear how electricity consumers could prove the CO2 intensity of the electricitythey purchase. Following the introduction of a reliable system for electricity disclosure,including a tracking system for the fuels used and the associated greenhouse gas emis-sions, it could then be possible to change the Emissions Trading scheme from an up-stream to a downstream system. In this case it would be the final electricity consumerswho are responsible for the emission reductions. The tracking system would be used toassign power plants and their emissions to electricity consumers and to account for theemissions for each consumer.
6.4 Conclusions
Implementing disclosure will lead to some additional costs being incurred by generators,suppliers, traders, governments, which ultimately, in most cases, will be passed onto theelectricity consumers. The extent of these costs depends upon the chosen disclosure sys-tem and its reliability, but are estimated to be up to a maximum of 0.01 cent/kWh, rep-resenting not more than 0.2% of the average cost of electricity to consumers.
In addition to providing transparency for market actors, there are further benefits to dis-closing the source of electricity to consumers. Perhaps the largest benefit will arise froman increased demand for electricity generated from renewable energy sources, resultingin an increase in electricity generation from renewable energy source in the order of up
to 25 TWh/year within the EU. This increase in renewables would lead to a reduction ingreenhouse gas emissions and an increase in employment and security of supply.
48 Amended proposal for a Directive of the European Parliament and of the Council establishing ascheme for greenhouse gas emission allowance trading within the Community and amending CouncilDirective 96/61/EC, 27.11.2002, COM(2002) 680 final.
8/8/2019 4CE Final Report
http://slidepdf.com/reader/full/4ce-final-report 68/88
4CE Final Report
62
Disclosure could also support the introduction of a variety of other policies, includingfiscal measures, carbon caps and minimum standards for electricity products. In addi-tion, increased consumer awareness of the link between electricity usage and sources of environmental impacts could encourage consumers to take actions to reduce energy con-
sumption and also pave the way to the introduction of policies which support wider EUobjectives. The effectiveness of such initiatives would in part be dependent upon theinformation that is provided to consumers via disclosure and the effectiveness of infor-mation campaigns which focus on the information being disclosed.
There are a number of interactions and potential conflicts between disclosure and exist-ing or planned policies and market-based instruments, both at a EU and Member Statelevel. It is advisable to consider such interactions carefully in order to maximise anysynergies that exist and minimise conflicts. Appropriate rationalisation would bring sig-nificant benefits in terms of time, cost and infrastructure savings and would avoid dupli-cation of information and double-counting of electricity attributes.

8/8/2019 4CE Final Report
http://slidepdf.com/reader/full/4ce-final-report 69/88
4CE Final Report
63
7 Conclusions and recommendations
With the adoption of the Electricity Directive 2003/54/EC, there is a clear move towardsa liberalised and harmonised European electricity market with increased cross-border
trade and a stronger trans-European network. Electricity disclosure is an essential ele-ment in this liberalised market and it is vital that the disclosure scheme can deliver reli-able and useful information to all consumers.
At present, electricity markets in the different Member States vary widely in terms of themarket structures, extent of liberalisation, the fuel mix for generation and associatedenvironmental impacts. These differences will increase when the Accession Countries
join the EU in 2004.
This is the context into which electricity disclosure will be introduced when the Direc-tive is implemented by Member States in July 2004. It is therefore a major challenge tointroduce a disclosure system that is suitable and compatible for all countries. However,
the research undertaken in the 4CE project demonstrates that it is possible and at rela-tively low cost.
Although electricity may be considered a ‘low-interest’ product, the purchase and use of electricity is something that is common to practically all households and businessesthroughout Europe. It therefore represents an area of huge potential, with considerablesavings to be made in terms of both fuel usage and environmental impacts.
7.1 Consumer Choice and Carbon Consciousness
Currently consumer choice and carbon consciousness regarding electricity is low. Con-sumer choice is, of course, limited in those markets which are not yet liberalised. How-ever, even in those markets which are fully liberalised, price is almost the only factoravailable for people to base their choice of electricity supplier on. Within the liberalisedmarkets, the percentage of consumers who have switched suppliers is still relatively lowin many countries, indicating that market barriers still exist and price may not be a bigenough incentive for people to move to a different supplier. In terms of carbon con-sciousness, whilst many consumers appear to understand that the generation of electric-ity has some impact on the environment, they do not necessarily understand the underly-ing mechanism or processes that result in the associated environmental impacts such asCO2 emissions and radioactive waste.
In a liberalised market, consumers should be provided with comprehensive information
on which to make their decisions. The 4CE consumer research has demonstrated thatconsumers want to be given information on the fuel mix of the electricity they buy andthe associated environmental impacts with their electricity bills. Environmental concernand support for electricity generated from renewable sources amongst consumers is high– they want to buy, and therefore be able to choose, electricity with a low impact on theenvironment: 82% of householders and 85% of SMEs stated that they would prefer tobuy electricity associated with a low impact on climate change and no nuclear waste.

8/8/2019 4CE Final Report
http://slidepdf.com/reader/full/4ce-final-report 70/88
4CE Final Report
64
Consumers want to be given this information in a standardised format, to allow easycomparison between suppliers, and to know that they can trust the information – henceindependent verification is crucial.
Electricity disclosure can provide this information to consumers and therefore allowthem a greater variety of choice. In addition to giving consumers the information thatthey want and need, electricity disclosure can raise general awareness amongst consum-ers about the sources of electricity and the impact of these on the environment. Since theinformation will be sent to practically every household and business in Europe, disclo-sure could be seen as a cheaper and potentially more effective way of raising awarenesscompared to a major educational campaign.
However, for a disclosure scheme to achieve such aims, it is important that it is de-signed appropriately.
7.2 Minimal compliance
The Directive specifies the minimum that a disclosure scheme must provide. The mini-mal compliance approach (as described in the previous chapters) uses a tracking mecha-nism based on electricity contracts with the electricity attributes accounted for by sys-tems set up by market participants on an individual basis. Fuel mix information wouldbe provided as a simple line of text somewhere on the bill and promotional materials.Environmental information would only be displayed as absolute figures on the sup-plier’s website (or provided on request). Such a minimal compliance approach is notrecommended for several reasons:
• It does not provide consumers with what they want – i.e. fuel mix and environ-mental information with their electricity bill. Minimal compliance does not requirethe environmental information to be included in or with the bill or promotionalmaterials.
• Consumers also want to be given additional explanation of the disclosure informa-tion and reference values for comparison to help them understand it and put it intocontext. This would not be provided under minimal compliance.
• The fuel mix information would not necessarily be displayed in a format or loca-tion that would be noticed by the consumer, limiting the impact of this informa-tion.
• Displaying the environmental information on an existing reference source, such as
a website, rather than in or with the bill (or promotional material) will limit theimpact of this information and will be much less effective in raising awarenesssince the information will only reach a minority of the population.
• There would be little or no standardisation and harmonisation of the disclosurescheme, both in terms of the display format and tracking mechanism, at a countryor EU level. This would cause problems for consumers in comparing between sup-pliers and for the electricity industry in terms of limiting cross-border trade.

8/8/2019 4CE Final Report
http://slidepdf.com/reader/full/4ce-final-report 71/88
4CE Final Report
65
• The cost and complexity of verification of the tracking system would be high dueto the lack of harmonisation – there would be many different individual accountingsystems to monitor and audit.
• If a minimal compliance approach is taken it will be difficult to then progress to amore advance system since this would require a major alteration to the accountingsystems for tracking the electricity.
7.3 A European Disclosure System
The disclosure provision of the Directive is open to interpretation by the individualMember States who are free to go beyond the specified requirements. The followingrecommendations relate to the proposed approach for a European disclosure systembased on the research conducted in the 4CE project:
• Member States agree on joint definitions of the information to be provided, proce-
dures for data calculations and interfaces for communication across borders.• The tracking mechanism is harmonised across Europe to facilitate cross-border
trade and ensure efficiency.
• The tracking mechanism is based on a central registry approach. Member Statesshould specify whether market participants trade the electricity on the basis of tagsor certificates or both.
• Each Member State appoints an independent body to operate the registry.
• Additional flexibility is achieved by allowing suppliers the option to use a residualmix (to a limited extent e.g. 20% of a supplier’s portfolio) instead of active track-
ing their electricity purchases.• The collection of data on electricity production and environmental indicators of
plants for disclosure is based, as far as possible, on data already collected for otherpurposes, such as the EU Emissions Trading Scheme.
• CO2 emissions and radioactive waste are tracked using plant-specific emissionfactors which reflect the benefits of increased plant efficiency, higher fuel qualityand cogeneration.
• The central registry provides the suppliers with the data to be disclosed to con-sumers, including data on differentiated electricity products, if applicable.
• The display of the disclosure information should be harmonised at least at theMember State level.
• The disclosure information display should be as eye-catching and informative aspossible.
• The fuel mix and environmental information (both CO2 emissions and radioactivewaste) are provided together in a separate leaflet with the bill which is sent out at
8/8/2019 4CE Final Report
http://slidepdf.com/reader/full/4ce-final-report 72/88
4CE Final Report
66
least once a year but preferably twice a year provided this does not incur excessiveadditional costs.
• The disclosure information provided in the promotional material should be basedon the display formats used in the separate leaflet, possibly integrated together as astand-alone ‘label’.
• The fuel mix information is displayed as a pie chart and table, which includes na-tional reference figures and a detailed breakdown of renewable sources.
• The environmental information should be displayed as an indexed or ranked label– further research is required to determine the most appropriate display format.
• Absolute figures on CO2 emissions and radioactive waste per kWh should be in-cluded as part of the environmental information display.
• All suppliers have to provide disclosure information on their portfolio but if theychoose to also provide product information they must do so for all their customers.
• Independent verification of all aspects of the disclosure scheme is essential.
• It is likely to take around 4 years before a fully functioning disclosure scheme is inplace, allowing for time to set up the tracking mechanism, collect data for the firstyear, verify the information and then incorporate the information with customers’electricity bills and promotional materials. The first disclosure information wouldbe presented to consumers in July 2007.
Electricity disclosure is not expensive. A disclosure scheme based on the recommendedapproach is likely to cost at most 0.01 cent/kWh, which represents around 0.2% of thefinal electricity price to consumers and is therefore negligible. This does not take intoaccount any cost reduction for market players through synergies with the certificationsystems for Guarantee of Origin for electricity from renewable energy sources and co-generation and RECS.
7.4 Helping disclosure to work
There are a number of additional policies that could be put in place to help ensure theeffectiveness of a disclosure scheme:
• National education campaigns would be necessary to raise awareness of the disclo-sure scheme and draw this to people’s attention. This could take place in twostages: one campaign prior to the inclusion of disclosure information with electric-
ity bills to prepare people so that they know what to look for and another campaignafter people have started to receive the disclosure information to help them under-stand and use it.
• Compilation of an independent catalogue in each Member State based on the dis-closure information provided by all suppliers to enable consumers to compare whatis offered by different suppliers and therefore make a properly informed choice.

8/8/2019 4CE Final Report
http://slidepdf.com/reader/full/4ce-final-report 73/88
4CE Final Report
67
This would be available in hard copy as well as on the internet. Price informationcould also be included.
7.5 Policy interactions
Electricity disclosure is not taking place in a policy vacuum. There are other policiesalready in place which will interact and possibly conflict with a disclosure scheme.
In terms of EU policy, the most important interaction is with the Guarantees of Origin(GO) under the Renewables Directive 2001/77/EC and the draft Cogeneration Directivesince both interface closely with the disclosure tracking mechanism if based on a centralregistry. It is strongly recommended that Member States merge their systems for GO forelectricity from renewable energy sources and cogeneration and the tracking mechanisminto one single scheme. As well as being cost-effective this minimises the risk of confu-sion and double-counting.
There is no direct link between electricity disclosure (downstream) and the EU Emis-sions Trading Scheme (upstream). However, the Emissions Trading Scheme could be of benefit to disclosure since information collected for the Emissions Trading Schemecould be used for the disclosure tracking mechanism, thus limiting costs. Disclosurecould also support the Emissions Trading Scheme by providing the mechanism bywhich differences in generation cost resulting from Emissions Trading are passed on toelectricity consumers. Ultimately, disclosure could allow a change from an upstream toa downstream Emissions Trading Scheme, more in line with carbon caps and tradabledomestic quotas.
In terms of national policies, the main area of conflict is likely to be with existing re-newable support schemes, many of which are based on certificates or tags (i.e. eithertraded with the electricity or separately). These interactions will vary between countriesdepending upon the nature of the various schemes in each country. However, for allMember States, the most crucial issue is to avoid double-counting of the electricity at-tributes through these schemes and establish clear rules regarding the role of each. If there are a number of different certification schemes, these should be combined so thatonly one type of certificate or tag is in use.
There are no direct synergies between feed-in tariffs and electricity disclosure, althoughboth instruments may encourage the use of renewable electricity sources. It is not con-sidered necessary to separately identify renewable sources supported by a feed-in tariff in the disclosure information.
Although disclosure requires information on the source of electricity is provided to con-sumers, award labels (e.g. for green electricity) will still have a role to play in identify-ing electricity from renewable sources which is truly additional i.e. new generation thatis not supported or subsidised through other schemes, such as feed-in tariffs or renew-able obligations.

8/8/2019 4CE Final Report
http://slidepdf.com/reader/full/4ce-final-report 74/88

8/8/2019 4CE Final Report
http://slidepdf.com/reader/full/4ce-final-report 75/88
4CE Final Report
69
sponding increase in employment within the renewables industry and increased securityof supply with greater fuel diversity and less concentrated generation patterns.
Disclosure is an essential part of the liberalisation of the electricity market, allowingconsumers to make an informed choice of electricity supplier. It will improve the func-tioning of the electricity markets, both at a national and European level and is likely toresult in an increase in switching rates between suppliers. Such decisions will no longerbe based on price alone – competition between suppliers based on the attributes of elec-tricity will develop, thus ensuring a wider choice for the consumer.
7.8 Monitoring and evaluation
In order to determine the extent of the benefits resulting from disclosure and the level of understanding which disclosure brings, it is recommended that once disclosure is im-plemented Member States undertake a review to determine:
• The extent of consumer awareness of disclosure;• Consumer understanding of the disclosure information they receive;
• The level of consumer confidence in the information;
• The effect of disclosure on consumers in choosing their supplier (and electricityproduct, if applicable);
• Changes in supplier offerings and sales.
There should also be continual monitoring and evaluation of the disclosure scheme itself to ensure that it is providing the required level of reliable information to consumers andis functioning in the most effective way possible.
7.9 Conclusions
Electricity disclosure has the potential to be an effective tool within a liberalised Euro-pean electricity market in terms of providing consumers with reliable and useful infor-mation. It is expected that disclosure will also increase demand for electricity from re-newable sources. This can be achieved for negligible cost in comparison to the currentselling price of electricity. However, if a disclosure scheme is to be truly effective, thenMember States need to go beyond the minimal requirements of the Directive to intro-duce a scheme that is harmonised and compatible within and between each MemberState.
Disclosure is part of a wider trend within the energy world towards a greater devolutionof responsibility and choice to consumers: sunshine can be used to heat water or createelectricity in households; the ambient temperature of soil in peoples’ gardens can beused as the source of heat for their homes. In these and other similar ways, people arebecoming part of the national energy system. Enabling consumers to choose the way inwhich their electricity is generated, through disclosure, is another part of the same trend,

8/8/2019 4CE Final Report
http://slidepdf.com/reader/full/4ce-final-report 76/88
4CE Final Report
70
that is, crucially, going to be available to everyone. The ramifications of this devolution-ary movement for the energy industry will be considerable, but it is accepted that con-sumers have the right to know, choose and influence.
With liberalisation so far, consumers have generally been limited to choosing an elec-tricity supplier on the basis of price alone. Other factors, such as the environmental im-pacts, have been of minor importance or hidden. The European Directive on liberalisa-tion of the European electricity markets beings the environment to the fore so that indi-vidual householders will be able to exercise their own priorities. The extent to whichconsumers use this additional information will become clearer with time, as liberalisa-tion spreads across Europe and beings with it the opportunity to switch suppliers. Theimpact of disclosure also depends strongly on the way in which this enabling legislationis used: governments, generators, suppliers, consumer and environmental groups can allbuild on and enhance it, so that it becomes a truly powerful policy initiative. Disclosurecan be an important educational tool, confirming for people the link between CO2 emis-sions, radioactive waste and electricity consumption. Disclosure will provide consumerswith information which will enable them to shape the generation mix of their own coun-try and of Europe through their purchasing patterns. Bringing consumer choice and car-bon consciousness together will be of potential benefit to the world through lesseningthe threat of climate change.

8/8/2019 4CE Final Report
http://slidepdf.com/reader/full/4ce-final-report 77/88
4CE Final Report
71
8 References
Arvidson, A., 2003: Domestic and Small and Medium Enterprise Consumer Views onElectricity Disclosure – summary of Focus Group research in Europe. 4CE Project,
Phase 2. Stockholm Environment Institute.
EEA, 2002: Annual European Greenhouse Gas Inventory 1990-2000 and Inventory Re-port 2002, submission to the UNFCCC Secretariat. Copenhagen, April 2002.
EU-COM, 2003: Second benchmarking report on the implementation of the internalelectricity and gas market (updated report incorporating Candidate Countries), April2003, Brussels
Eurobarometer, 2001: Internet and the public at large, Flash Eurobarometer 112, pre-pared by EOS Gallup Europe for the Directorate-General Information Society, EuropeanCommission, November 2001
IEA, 2001: Electricity Information 2001, ParisIPCC, 1996: IPCC Guidelines for National Greenhouse Gas Inventories and Good Prac-tice Guidance and Uncertainty Management in National Greenhouse Gas Inventories
IPCC, 2001: Climate Change 2001: The Scientific Basis, Working Group 1 contributionto the IPCC Third Assessment Report, available at: www.ipcc.ch/
KPMG, 1999: International Survey of Environmental Reporting, Institute of Environ-mental Management (WIMM), University of Amsterdam, in collaboration with KPMGInternatinal Environment Network, ISBN 90-69190-131-5
Lane, K., 2003: Electricity Disclosure in Europe: Scenarios: impact on renewables. 4CE
Project, Phase 3. Environmental Change Institute, University of Oxford.Lane, K. and Palmer, J., 2003: Electricity Disclosure in Europe: Policy consideration.4CE Project, Phase 3. Environmental Change Institute, University of Oxford.
Matthes F., Poetsch S. 2002: Power Generation Market Concentration in Europe 1996-2000, Berlin 2002
Moskovitz, D et al. 1998: Synthesis Report: Summary of Research on Information Dis-closure, The National Council on Competition and the Electric Industry, USA, October1998.
Nordström, M., 2003: Large Industry Views on Electricity Disclosure in Europe. 4CE
Project, Phase 2. Stockholm Environment Institute.Palmer, J., 2003: Telephone Survey on European Attitudes to Electricity Disclosure.4CE Project, Phase 2. Environmental Change Institute, University of Oxford.
Palmer, J. and Lane, K., 2003: Electricity Disclosure in Europe: Cost-benefit analysis.4CE Project, Phase 3. Environmental Change Institute, University of Oxford.

8/8/2019 4CE Final Report
http://slidepdf.com/reader/full/4ce-final-report 78/88
4CE Final Report
72
Schulze, W.D., 1994: Green Pricing: Solutions for the Potential Free-Rider Problem.Boulder, Colorado. University of Colorado, 1994.
Sedano, R. P. 2002: Electric Product Disclosure: A Status Report, The Regulatory As-sistance Project, National Council on Competition and the Electric Industry, July 2002
Stern 2002: Der Strommarkt: Marken, Wechselbereitschaft, alternative Energiequellen,Stern-Trendprofile, September 2002
Swedish National Audit Office, 2000: Kunden är lös! – Konsumenternas agerande på deomreglerade el- och telemarknaderna
Timpe, C. and Buerger, V., 2002: Electricity Disclosure in Europe: A policy paper. 4CEProject, Phase 1. Oeko Institut, September 2002.
Timpe, C. and Buerger, V., 2002: Electricity Disclosure in Europe: Implementing elec-tricity disclosure in the European liberalised market. 4CE Project, Phase 1. Oeko Insti-tut, September 2002.

8/8/2019 4CE Final Report
http://slidepdf.com/reader/full/4ce-final-report 79/88
4CE Final Report
73
Appendix A – Glossary
Bilateral contract - A direct contract between two market participants (e.g. power producer,supplier, trader) outside of a centralised power pool or power exchange.
Capacity - The maximum load a generating unit, generating station, or other electrical appara-tus can actually carry under existing service conditions.
Certification – A process by which a company or product satisfies the criteria adopted by aregulating body for the control of specified requirements that need to be met. Certification pro-vides a guarantee that a particular company or product have been tested and that they meet thespecified requirements.
Cogeneration (or Combined heat and power - CHP) – A CHP plant is an installation wherethere is simultaneous generation of usable heat and power (usually electricity) in a single proc-ess. The term CHP is synonymous with 'co-generation' and 'total energy', which are terms oftenused in the United States or Member States of the European Community. Electricity generationfrom CHP plants with an inherent non-CHP component (e.g. many district heating plants withsteam turbines are operated in condensing mode in summer time emitting a large portion of theresidual thermal energy into the environment) need to be divided up into a CHP mode and acondensing mode.
Double counting - This is when the attributes of the electricity generated (e.g. benefits fromrenewable sources) are sold or accounted for more than once.
Electricity product – An electricity product has particular properties distinct from a supplier’soverall supply mix and is often marketed and sold to consumers on the basis of these propertiese.g. green electricity products, no nuclear content products, etc.
External Costs (or Externalities) - Costs resulting from a process which are not included inthe monetary price of that process, e.g. damage from pollution associated with electricity gen-eration.
Green Certificate - An standardised official record proving that a specified amount of greenelectricity has been generated. Green certificates represent the environmental value of renew-able electricity production. The certificates can be traded separately from the energy produced.
Greenhouse effect -- The presence of trace atmospheric gases make the earth warmer thanwould direct sunlight alone. These gases (including carbon dioxide [CO2], methane [CH4], ni-trous oxide [N2O], tropospheric ozone [O3], and water vapor [H2O]) allow visible light andultraviolet light (shortwave radiation) to pass through the atmosphere and heat the earth's sur-face. This heat is re-radiated from the earth in form of infrared energy (longwave radiation).The greenhouse gases absorb part of that energy before it escapes into space. This process of trapping the longwave radiation is known as the greenhouse effect. Scientists estimate thatwithout the greenhouse effect, the earth's surface would be roughly 54 degrees Fahrenheitcolder than it is today -- too cold to support life as we know it. See Global Climate Change.
Green Electricity Labels - Green electricity labels demonstrate that an electricity product ortariff meets certain independently assessed environmental criteria. Independent accreditationmay be offered by official bodies (e.g. government agencies) or by non-governmental-organisations (e.g. environmental NGOs).
Green Electricity - Electricity generated from renewable energy sources such as the wind, sun,water etc. There are varying opinions about what type of electricity should count as green andthe criteria can vary from country to country. (See definition for renewable energy below).

8/8/2019 4CE Final Report
http://slidepdf.com/reader/full/4ce-final-report 80/88
4CE Final Report
74
Green Tariffs/Products - Electricity tariffs/products that either guarantee to provide a certainpercentage of electricity from renewable energy sources, or guarantee that a certain percentageof the money paid for the tariff/product will be invested in new renewable energy capacity.
Life cycle cost – The sum of all costs, both recurring and non-recurring, related to a product
structure, system or service during its life span.Portfolio - The collection of generation investments all owned by the same individual or sup-plier.
Power exchange - An entity providing a competitive spot market for electricity through e.g.day-and/or hour-ahead auction of generation and demand bids.
Registry - Electronic database containing details of all accounts and certificates/tags held in thedisclosure system.
Renewable Energy - In general the term renewable energy refers to ‘energy obtained frompersistent and continuing flows of energy occurring in the environment’. EU countries havehistorically taken differing approaches to defining which technologies are classified as beingrenewable. This is an issue particularly regarding sources linked to wastes and to large hydro
plant. Likewise categorisation of the many forms of agricultural ‘biomass’ and ‘biofuels’ mayvary between countries. These decisions have partly been dependent on government policyobjectives and public perceptions in each given country. Discussions concerning the possibleimplementation of an EU-Directive which would include a definition of renewables have focus-sed upon the following technologies and issues:
• Biogas - Agricultural, sewage, landfill and industrial organic wastes produce a methanegas that can be collected and burnt to produce electricity. Several EU countries excludelandfill gas and sewage gas from their renewable energy support programmes.
• Biomass - Forestry and agricultural residues can be used as a fuel to produce electricityand heat. In addition, energy crops are grown specifically to be used as a fuel. Use of biomass add little or no extra carbon dioxide into the atmosphere, as plants absorb car-bon dioxide when they grow and this is then released when the plants are burnt. All EU
countries consider biomass as being renewable, though several impose conditions be-fore granting support.• Geothermal - Geothermal energy, coming from hot underground rocks is accepted as
being renewable in all EU countries. In some places steam comes to the surface natu-rally, whilst in others water can be pumped down and heated by the rocks to producesteam. Geothermal energy is most often used to provide hot water and heating for build-ings.
• Hydro - Hydropower schemes can either use a dam or use the natural flow of water in a‘run of the river’ system to generate electricity. It is widely recognised that large hydroschemes can have a significant impact on the local environment, and as such manycountries do not permit hydropower schemes above a certain size, typically 10MW, tobenefit from renewable energy support programmes. However, some countries onlyrecognise old plants in order to discourage further hydro development. Most large hy-
dro schemes have been in operation for many years, and do not need additional supportto enable them to be financially viable. Even small hydropower schemes are often sub- ject to a variety of conditions concerning their environmental impact.
• Municipal Waste - Municipal waste can be used as a fuel to produce electricity andheat. Few countries consider electricity generated from the burning of municipal wasteto be renewable. However, the organic content of municipal waste is itself from a re-newable resource, and in some countries the organic portion of the waste resource iseligible for support.

8/8/2019 4CE Final Report
http://slidepdf.com/reader/full/4ce-final-report 81/88
4CE Final Report
75
• Peat - Peat is included in the definition of renewables in some EU countries, under cer-tain conditions.
• Solar - A solar photovoltaic (PV) panel generates electricity directly from light. PVpanels can be integrated into buildings or used in a variety of other applications. All EUcountries consider PV to be a renewable energy technology. Also, active and passivesolar technologies that utilise the energy from the sun to produce heat are also widelysupported in Europe.
• Wave and Tidal Energy - The energy in waves can be captured in a number of ways.One method is to funnel the waves into a vertical column, then the motion of the wavesforces air back and forth over a bi-directional turbine to produce electricity. Severalother types of wave energy device are currently under development. Tidal energy caneither be captured by storing water behind a barrage at high tide and releasing it at lowtide, or by using underwater turbines, which can also extract energy from other marinecurrents. Several EU countries have small support programmes to encourage the devel-opment of wave and tidal systems.
• Wind - Wind turbines, which capture the energy from the wind to produce electricity,have been developed for various purposes, from large groups of grid connected wind
turbines, both on-shore and off-shore, to very small autonomous turbines used for bat-tery charging. Currently all EU countries accept wind as being a renewable energysource worthy of support.
Settlement - The process of financial settlement for products and services purchased and sold.Each settlement involves a price and quantity.
Spot Market – Market where short-term imbalances between generation and consumption areevened out by material contracts.
Supplier - An entity that sells electricity to final customers.
Switching - The process of changing electricity supplier (i.e. electricity company) or to a dif-ferent electricity product or tariff of the default supplier.
Tags – Information on the attributes of a certain volume of electricity (e.g. 1 MWh), presentedin a standardised format that can be transferred in conjunction with electricity contracts. Tagsdiffer from certificates in that tags follow the sale of electricity and are not designed to betraded separately.
Tariff - A tariff is the price or schedule of prices, contractual terms and conditions for a de-fined service or set of services.
Transmission System Operator (TSO) – Entity responsible for the secure an reliable opera-tion of the transmission grid and taking care for the provision of system services (e.g. balancingpower).

8/8/2019 4CE Final Report
http://slidepdf.com/reader/full/4ce-final-report 82/88
4CE Final Report
76
Appendix B – Example of disclosure information leaflet (A4 folded into three)
Electricity supplied bySupplier X in 2001
R'wable
2%
Other
1%
Nuclear
1%
Gas
25%
Coal
71% Fuel source Supplier
X%
Nationalaverage
consumption%
Gas 25 40
Coal 71 33
Nuclear 1 23
Other 1 1
Renewables (total) 2 3
Hydro-electric 1.5 1.4
Biomass 0.0 1.2
Wind 0.5 0.3
Solar 0.0 0.0
Other 0.0 0.0
15% of electricity sold by Supplier X was imported
Supplier X contact details
For an enquiry, please phone0807 111 111
For further information on electricity andthe environment, see
http://www.supplierx.comor phone 0807 222 222
To compare the environmental impact ofelectricity offered by different electricity
suppliers, see:http://www.electricitycompare.com
Supplier X address
YOURE
Environ

8/8/2019 4CE Final Report
http://slidepdf.com/reader/full/4ce-final-report 83/88
4CE Final Report
77
How your electricity isgenerated
The electricity provided by Supplier Xcomes mostly from coal (71%) and naturalgas (25%). Other energy sources such asnuclear, oil and renewables account for4%. Renewable sources of energy includesolar, wind and hydro-electric power.
15% of the electricity is imported. The restis generated in country X.
You can use the information provided inthis leaflet to compare the electricity soldby Supplier X to electricity sold by other
suppliers.
What impact your electricityhas on the environment
Each unit of electricity – a kilowatt hour(kWh) – supplied by Supplier X results in0.0 micrograms of radioactive waste and0.8 kilograms of carbon dioxide, agreenhouse gas.
The labels on the front of the leaflet give arating for the environmental impact of yourelectricity in terms of carbon dioxideemissions and radioactive waste. The levelof these environmental impacts dependson the power plants used to generate yourelectricity.
Carbon dioxide is released when certainfuels are burned. It is a greenhouse gasand a major contributor to climate change.
Radioactive waste is produced whenelectricity is generated by nuclear powerstations.
On a scale of A to G, where A is the leastdamaging to the environment and G themost damaging, the electricity supplied bySupplier X has the label F for carbondioxide and A for nuclear waste. This isbecause of the high proportion of coal andlow proportion of nuclear energy in the fuelmix.
Where y
The actuaindistinguishby your frieno way to ithat produceyour home distribution becomes a g
However, it you pay for Euros suppvarious ene
listed in the The nationaas a combreakdown oelectricity th

8/8/2019 4CE Final Report
http://slidepdf.com/reader/full/4ce-final-report 84/88
4CE Final Report
78
Appendix C – Example of a disclosure information insert (portfolioonly)
ELECTRICITY LABELELECTRICITY LABEL
Supplier: Supplier X
Phone: 0800 - XXXXXXXXXX
Website: www.supplier-x.com
Electricity supplied by Supplier X, 2002Electricity supplied by Supplier X, 2002
Electricity supplied by Supplier X wasgenerated from the following fuel sources
Norm EN - Electricity Directive 2003/54/EC
Gas5%
Other energysources
1%
Coal61%
Nuclear25%
Renewables8%
15% of electricity sold by Supplier X was imported
0,0%0,0%Other renewables
0,0%0,0%Solar
0,8%0,3%Biomass
3,2%3,2%Wind
3,5%4,5%Hydro electric
7,5%8,0%Renewables (total)
3,5%1,0%Other conventionalenergy sources
7%5%Gas
31%25%Nuclear
51%61%Coal
for comparison
average
consumption
Country Z
Supplier
X
Fuel source
Norm EN - Electricity Directive 2003/54/EC
Carbon DioxideEmissions (CO2)(640 g/kWh)
Radioactive
Waste(x units/kWh)
Low environmental
impact
High environmental
impact
100 = average Country Z
Environmental ImpactEnvironmental Impact
112112
8181
To compare the environmental impact of electricity
suppliers, see www.labelcompare.com
ELECTRICITY LABELELECTRICITY LABEL
Supplier: Supplier X
Phone: 0800 - XXXXXXXXXX
Website: www.supplier-x.com
ELECTRICITY LABELELECTRICITY LABEL
Supplier: Supplier X
Phone: 0800 - XXXXXXXXXX
Website: www.supplier-x.com
Electricity supplied by Supplier X, 2002Electricity supplied by Supplier X, 2002
Electricity supplied by Supplier X wasgenerated from the following fuel sources
Norm EN - Electricity Directive 2003/54/EC
Gas5%
Other energysources
1%
Coal61%
Nuclear25%
Renewables8%
15% of electricity sold by Supplier X was imported
0,0%0,0%Other renewables
0,0%0,0%Solar
0,8%0,3%Biomass
3,2%3,2%Wind
3,5%4,5%Hydro electric
7,5%8,0%Renewables (total)
3,5%1,0%Other conventionalenergy sources
7%5%Gas
31%25%Nuclear
51%61%Coal
for comparison
average
consumption
Country Z
Supplier
X
Fuel source
Norm EN - Electricity Directive 2003/54/EC
Carbon DioxideEmissions (CO2)(640 g/kWh)
Radioactive
Waste(x units/kWh)
Low environmental
impact
High environmental
impact
100 = average Country Z
Environmental ImpactEnvironmental Impact
112112
8181
To compare the environmental impact of electricity
suppliers, see www.labelcompare.com Norm EN - Electricity Directive 2003/54/EC
Carbon DioxideEmissions (CO2)(640 g/kWh)
Radioactive
Waste(x units/kWh)
Low environmental
impact
High environmental
impact
100 = average Country Z
Environmental ImpactEnvironmental Impact
112112
8181
To compare the environmental impact of electricity
suppliers, see www.labelcompare.com

8/8/2019 4CE Final Report
http://slidepdf.com/reader/full/4ce-final-report 85/88
4CE Final Report
79
Appendix D – Example of a disclosure information insert (portfolioand product)
ELECTRICITY LABELELECTRICITY LABEL
Supplier: Supplier Y
Phone: 0800 - XXXXXXXXXX
Website: www.supplier-y.com
Product: Product X
Electricity supplied by Supplier Y, 2002Electricity supplied by Supplier Y, 2002
Electricity supplied by Supplier Y wasgenerated from the following fuel sources
Norm EN - Electricity Directive 2003/54/EC
Gas5%
Other energysources
1%
Coal61%
Nuclear25%
Renewables8%
0,0%
0,5%
0,0%
10,0%
24,5%
35,0%
0,0%
65%
0%
0%
ProductX
15% of electricity sold by Supplier Y was imported
0,0%0,0%Other renewables
0,0%0,0%Solar
0,8%0,3%Biomass
3,2%3,2%Wind
3,5%4,5%Hydro electric
7,5%8,0%Renewables (total)
3,5%1,0%Other conventionalenergy sources
7%5%Gas
31%25%Nuclear
51%61%Coal
for comparison
averageconsumption
Country ZSupplier
YFuel source
Norm EN - Electricity Directive 2003/54/EC
Low environmentalimpact
High environmentalimpact
100 = average Country Z
Environmental ImpactEnvironmental Impact
CarbonDioxideEmissions(CO2)
RadioactiveWaste
To compare the environmental impact of electricitysuppliers, see www. labelcompare.com
Product XProduct X (254 g/kWh) 4747
Supplier YSupplier Y (626 g/kWh) 112112
Supplier YSupplier Y (y units/kWh) 8181
Product XProduct X 00
ELECTRICITY LABELELECTRICITY LABEL
Supplier: Supplier Y
Phone: 0800 - XXXXXXXXXX
Website: www.supplier-y.com
Product: Product XELECTRICITY LABELELECTRICITY LABEL
Supplier: Supplier Y
Phone: 0800 - XXXXXXXXXX
Website: www.supplier-y.com
Product: Product X
Electricity supplied by Supplier Y, 2002Electricity supplied by Supplier Y, 2002
Electricity supplied by Supplier Y wasgenerated from the following fuel sources
Norm EN - Electricity Directive 2003/54/EC
Gas5%
Other energysources
1%
Coal61%
Nuclear25%
Renewables8%
0,0%
0,5%
0,0%
10,0%
24,5%
35,0%
0,0%
65%
0%
0%
ProductX
15% of electricity sold by Supplier Y was imported
0,0%0,0%Other renewables
0,0%0,0%Solar
0,8%0,3%Biomass
3,2%3,2%Wind
3,5%4,5%Hydro electric
7,5%8,0%Renewables (total)
3,5%1,0%Other conventionalenergy sources
7%5%Gas
31%25%Nuclear
51%61%Coal
for comparison
averageconsumption
Country ZSupplier
YFuel source
Norm EN - Electricity Directive 2003/54/EC
Low environmentalimpact
High environmentalimpact
100 = average Country Z
Environmental ImpactEnvironmental Impact
CarbonDioxideEmissions(CO2)
RadioactiveWaste
To compare the environmental impact of electricitysuppliers, see www. labelcompare.com
Product XProduct X (254 g/kWh) 4747
Supplier YSupplier Y (626 g/kWh) 112112
Supplier YSupplier Y (y units/kWh) 8181
Product XProduct X 00

8/8/2019 4CE Final Report
http://slidepdf.com/reader/full/4ce-final-report 86/88
4CE Final Report
80
Appendix E – 4CE Programme of work
January 2002 Project commences
January – September 2002 Phase 1Task 1.1 The European electricity marketTask 1.2 Supplier-generator interfaceTask 1.3 Supplier-consumer interfaceTask 1.4 How a label fits into the marketTask 1.5 Interviews with electricity industriesTask 1.6 Workshop 1 (11 September, Berlin)Task 1.7 Phase 1 report
May 2002 – April 2003 Phase 2Task 2.1 Consumer habits at presentTask 2.2 Draft labels for Focus GroupsTask 2.3 Focus groupsTask 2.4 Telephone surveyTask 2.5 Projection of expected resultsTask 2.6 Phase 2 report
April – September 2003 Phase 3Task 3.1 Proposed label designTask 3.2 Policy considerationsTask 3.3 Cost benefit analysis
Task 3.4 Scenarios: impact on renewablesTask 3.5 Workshop 2 (19 May, London)Task 3.6 Phase 3 report & final project report
January 2002 – September 2003 Phase 4Task 4.1 WebsiteTask 4.2 Presentation to the EC (9 September 2002)
January 2002 – September 2003 Phase 5Task 5.1 Project meetingsTask 5.2 Performance indicators

8/8/2019 4CE Final Report
http://slidepdf.com/reader/full/4ce-final-report 87/88
81
The 4CE project consortium
Environmental Change Institute, Oxford University (www.eci.ox.ac.uk) - Project Leader
The Environmental Change Institute (ECI) is Oxford University’s multidisciplinary centre for the organisation
and promotion of research and teaching on the environment. The ECI has co-ordinated and participated in anumber of large EC contracts. Lower Carbon Futures (LCF) is the group dedicated to research on the rational useof energy and carbon reduction, with ten years experience in the provision of information, analysis and policyoptions to reduce the environmental impacts of energy use. Major areas of expertise are: consumer behaviour andenergy use, market transformation policy, labelling and renewable energy.
Central European University (www.ceu.hu/envsci/)
The CEU was established in 1991 as a pan-regional university committed to promoting educational and academicdevelopment throughout the former socialist block of Central and Eastern Europe and the former Soviet Union(CEE). It seeks to contribute to the advancement of open societies in CEE by offering a system of postgraduateeducation in which ideas are creatively, critically, and comparatively examined. The CEU serves as an advancedcentre of research and policy analysis and facilitates academic dialogue. The Department of Environmental Sci-ences and Policy of CEU is a centre of excellence for environmental scholarship, post-graduate education andtraining in CEE and has played a key role in addressing the CEE region’s environmental legacies on an academic
and professional level.
EVA (www.eva.ac.at)
Energieverwertungsagentur, the Austrian Energy Agency (EVA) was established in 1977 as a non-profit organi-sation. It is the Austrian energy research and policy institution in which the federal and the provincial administra-tion and some thirty important institutions and corporations from a variety of economic sectors co-operate. EVAis the principal partner of the federal government in its effort to attain its energy policy objectives, which aimmainly at a stimulation of renewable energy sources, at a macro-economically efficient production and a rationaluse of energy, and innovative technologies. EVA is the Austrian Member of the European Energy Network EnR,leader of the Austrian OPET consortium and member of the AFB-nett.
IT Power (www.itpower.co.uk)
IT Power is a leading renewable energy consultancy company based in the UK with 20 years experience in the
management and implementation of international projects. The company has key expertise in market studies,energy policy and economics, dissemination activities, organisation of seminars, as well as R&D, engineeringdesign and project management. IT Power is part of the ‘ELGREEN’ project team, who are developing tradingrules for green electricity in Europe and creating a Green Electricity Exchange model. IT Power has been particu-larly involved in the work concerned with the labelling of green electricity in the EU.
Öko-Institut (www.oeko.de/indexb.html)
The Öko-Institut (Institute for Applied Ecology) is one of the leading independent environmental research or-ganisations in Germany. The Öko-Institut mission is to analyse and evaluate current and future environmentalproblems, and to develop and implement strategies and models for sustainable solutions. At present, the Insti-tute's staff comprises about 80 scientists and engineers working at its Central Office in Freiburg and at the Berlinand Darmstadt offices. The Institute’s Energy & Climate Division is working on problems of energy planning(systems analysis, scenario design), renewable and energy-efficiency technologies, utility regulation and imple-mentation of sustainable energy strategies in liberalised markets and national and international climate policy.
Stockholm Environment Institute (www.sei.se/)
The Stockholm Environment Institute (SEI) is an independent, non-profit international research institute special-ising in sustainable development and environment issues. SEI was established by the Swedish government in1989. Its research programme aims to clarify the requirements, strategies and policies for a transition to sustain-ability. SEI’s mission is to support decision-making and induce change towards sustainable development aroundthe world by providing integrative knowledge that bridges science & policy in the field of environment & devel-opment.
8/8/2019 4CE Final Report
http://slidepdf.com/reader/full/4ce-final-report 88/88
ECI RESEARCH REPORT 28
Lower Carbon FuturesEnvironmental Change InstituteUniversity of Oxford
5 South Parks RoadOxford OX1 3UBUnited Kingdom
Telephone: +44 1865 281180
Fax: +44 1865 281202E-mail: [email protected]: www.eci.ox.ac.uk
© Environmental Change Institute, 2003