4d051 /0t9 i best available copy · the test results were also compared on a basis of net time at...
TRANSCRIPT

PART 4 OG WE'\SCOTROL
WADC TECHNICAL REPORT 53-336FLEC Y},•. ,i• :,R,4FILE CO PY4 p /o,ý q ogl
STiHE CREEP PROPERTIES OF METALS UNDER INTERMITTENT
STRESSING AND HEATING CONDITIONSPart 4. Creep Results for Alclad 7075-T6 Aluminum Alloy and
Comparison with Results for Other Materials
N. H. G. DANIELS
H. B. MASUDA
JOHN E. DORN
UNIVERSITY OF CALIFORNIA
MAY 1956
Statement AApproved for Public Release
WRIGHT AIR DEVELOPMENT CENTER
•• 4D051 /0t9 I Best Available Copy. tl
NOTICES
When Government drawings, specifications, or other data are used for any purpose otherthan in connection with a definitely related Government procurement operation, the United StatesGovernment thereby incurs no responsibility nor any obligation whatsoever; and the fact thatthe Government may have formulated, furnished, or in any way supplied the said drawings,specifications, or other data, is not to be regarded by implication or otherwise as in any mannerlicensing the holder or any other person or corporation, or conveying any rights or permissionto manufacture, use, or sell any patented invention that may in any way be related thereto.
Qualified requesters may obtain copies of this report from the ASTIA Document ServiceCenter, Knott Building, Dayton 2, Ohio.
This report has been released to the Office of Technical Services, U. S. Department of Com-merce, Washington 25, D. C., for sale to the general public.
Copies of WADC Technical Reports and Technical Notes should not be returned to the WrightAir Development Center unless return is required by security considerations, contractual obliga-tions, or notice on a specific document.
WADC TECHNICAL REPORT 53-336
PART 4
THE CREEP PROPERTIES OF METALS UNDER INTERMITTENT
STRESSING AND HEATING CONDITIONSPart 4. Creep Results for Alclad 7075-T6 Aluminum Alloy and
Comparison with Results for Other Materials
N. H. G. DANIELS
H. B. MASUDA
JOHN E. DORN
UNIVERSITY OF CALIFORNIA
MAY 1956
MATERIALS LABORATORY
CONTRACT No. 33(038)-11502PROJECT No. 7360
WRIGHT AIR DEVELOPMENT CENTER
AIR RESEARCH AND DEVELOPMENT COMMAND
UNITED STATES AIR FORCE
WRIGHT-PATTERSON AIR FORCE BASE, OHIO
Carpenter Litho & Prtg. Co., Springfield, 0.- 1Best Available Copy

FOREWORD
This report was prepared by the Institute of Engineering Research,University of California, Berkeley, California, under USAF ContractNo. AF 33(038)-11502. The contract was conducted under'Project No. 7360,"Materials Analysis and Evaluation Techniques"t, Task No. 73605, "DesignData for Metals', formerly RDO No. 614-13, "Design and Evaluation Data forStructural Metals", and was administered under the direction of the Mat-erials Laboratory, Directorate of Research, Wright Air Development Center,with Mr. E. L. Horne acting as project engineer. This report covers workaccomplished between October 1953 and October 1954.
The authors wish to express their appreciation of the help given byMr. L. A. Shepard, who had been associated with previous work on the sub-ject at the University of California
WADC TR 53-336 Pt 4
ABSTRACT
A study was made of the creep properties of clad aluminum alloy75S-T6 under intermittent heating and loading conditions at 300°F and6000F. A few tests were also conducted at 450°F under intermittent heat-ing conditions.
The results were correlated by means of the empirical functionalequation
E FWhere • total strain
w wtimea- = stressF = strain function
= stress function.
As suggested in previous reports, the function f was shown to beapproximately independent of strain and of the type of intermittent test-ing cycle. The prediction of intermittent condition creep data can there-
.fore be carried out from a knowledge of the constant load isothermal data,and a single test under the intermittent condition.
A review of the literature has shown that although in a significantproportion of cases the above analysis can be used successfully, the func-tion -f often varies considerably -with strain, and in some instances isnot independent of the type of intermittent condition. Nevertheless eventhe approximate prediction of intermittent creep data by flexible use ofthe method is likely to be of value.
The test results were also compared on a basis of net time at temp-erature under load. It appears that any intermittent cycle permittingrecovery and overaging of the material in the absence of load has adeleterious effect on its creep resistance. Under other intermittentconditions the creep of the material is approximately the same on a nettime basis as its creep under steady load isothermal conditions.
PUBLICATION REVIEW
This report has been reviewed and is approved.
FOR THE COMMNDER:
f Technical DirectorMaterials LaboratoryDirectorate of Research
WADC TR 53-336 Pt 4 iii
TABLE OF CONTENTS
Page
Introduction ..... .... . . . . . . . . . . 1
Material, Equipment, and Test Methods ....... ......... 4
Test Results ........ . • .. . . . . . . . .8
1. Results at 300*F . . . . . . . 8. 0 * 0 0 * * 0 * *2o Results at 450F ... .. . ... . 0 0 0• 0 * 9 0 0 0 * . 223. Results at 600PF . . . 0 0 0 0 0 * * * * * . . 22
Discussion of Test Results . • • .... •• •....... 34
1. Methods of Analtical Approach .a.... ...... .*. .342. Analysis of 300 F Data .................. 37
(a) Met Time Approach . o. .. .. .. .. . . . .• 37
(b) Analytical Correlation and Prediction 0 . . 40
3. Analysis of 450*F Data . . . . . . . . . . . .. . 49
(a) Net Time Approach . . . . o ........ 49(b) Analytical Correlation and Prediction . . . . . . . 53
4. Analysis of 600F Data ........ ...... 53
(a) Net Time Approach ............. . 53(b) Analytical Correlation and Prediction . . .. . . . . 58
Evaluation of Analytical Methods 0 .0..0. ... . o• .... 62
1. Introduction . . . . . .. . 0 .. . . . 622. Criteria for Evaluation . . .. 0 o . . a . .. . . . 633. Methods of Evaluation.0 * * * o & * e @ . . . . . . o 674. Application to Steady Load-Isothemal Creep Data . . . . . 685. Application to Published Intermittent Condition Creep Data 70
(a) MagnesiumAlloyFS-lH ....... o.••.•• 71(b) 24•-T3 Aluminum Alloy ..... .......... 74(c) Low Carbon N-155 Alloy ............... 76(d) Inconel X . 0... 0 0 0 .0 . o . . . . .. . 76(e) Titanium Alloy RC 13-A ..... ......... 79(f) Type 321 Stainless Steel ... . ...... 79
6. Results of Evaluation of Analytical Method ...... . * 82
Conclusions .. .. .0. .... 0 0. * 0 o . .. 0 • * * 0 * 0 86
Bibliography 0 . . . . 0 . 0 0 0 0 0 . . 0 * * 0 0 * 89
UADC TR 53-336 Pt 4 iv
LIST OF TABLES
Table Page
I. Creep of Clad Aluminum Alloy 75S-T6 at 300°F under Steady andIntermittent Conditions. Times to Various Total Strains . . . 10
II. Creep of Clad Aluminum Alloy 75S-T6 at 300OF under Steady andIntermittent Conditions. Times to Various Creep Strains . . . 12
III. Creep of Clad Aluminum Alloy 75S-T6 at 450°F. Steady Stress,Intermittent Temperature 1 Hr./l Hr., Cycle 3. Total Times toReach Various Total Strains .... ............. 23
IV. Creep of Clad Aluminum Alloy 75S-T6 at 4500F. Steady Stress,Intermittent Temperature 1 Hr./1 Hr., Cycle 3. Total Times toReach Specified Creep Strains 24
V. Creep of Clad Aluminum Alloy 75S-T6 at 600°F under Steady andIntermittent Conditions. Total Times to Reach Various TotalStrains . . . . . . . . . . . . ••. 27
VI. Comparison, of Average Net Times (Net tS ) to Reach SpecifiedStrains for Various Intermittent Conditions. Creep of 75S-T6at 300°F 38
VII. Analysis of Creep Data for 75S-T6 at 3000F. Cycle 3 .... 42
(a) Total Strain Basis .............. . 42(b) Creep• Strain Basis ................. 43
(c) Average K5 Values for Steady Load Steady Temper-ature Tests ... . . . . . . . . . . 0 44
VIII. Values of ' 4 at Various Stresses, Total Strains, and Inter-mittent Conditions. Creep of 75S-T6 at 300°F . . . . . . . . 47
(a) Total Strain Basis .................. 7(b) Creep Strain Basis . . . . . . . . . . . . . . . . 48
IX. Average Values of Ket and Kq for Various Stresses and Inter-mittent Conditions. Creep of 75S-T6 at 300°F . . . .. . 51
X. q Values for Various Stresses, Strains, and IntermittentConditions. Creep of 75S-T6. 4500F. Cycle 3 . . . . . . . . 54
(a) Total Strain Basis .. . . . . . . . 54(b) Creep Strain Basis . . . . . . . . . . . . . . . . . 54
XI. Comparison of Average Net Times (Net t ) to Reach SpecifiedStrains for Various Cyclic Conditions. Creep of 75S-T6 at
W 600F . ........................... 57
WADe 53-336 Pt 4 v
Table Page
XII. Values of K3 at Various Stresses, Total Strains, and Inter-mittent Conditions. Creep of 75S-T6 at 6000'F ........... ... 59
XIII. Average Values of V(g and V\5 for Various Stresses and Inter-mittent Conditions. Creep of 75S-T6 at 600F . .. .. .. . 60
XIV. Comparison of Experimental and Calculated Creep Data forSteady Load Isothermal Creep of 75S-T6 at 3006F .... . . . 66
(a) Comparison on Time Basis. . . . . . . ..... . 66(b) Comparison on Stress Basis . . ...... . . . . . 66
XV. Average K Factor Values for Various Stresses and IntermittentConditions. Creep of FS-lH Magnesium Alloy . . . . . . . . . 73
(a) 300OF ....................... 73(b) 450ýF . .. .. .. .. .. .. .. .. .. . .. . 73
XVI. xK Factor Values for Various Stresses and Intermittent Con-ditions. Creep of 24S-T3 Aluminum Alloy . . . . . . . . . . . 75
(a) 450*' . . . . . . . . ... . . . . . . . .. . 75(b) 600*F 75
XVII. \. Factor Values for Various Stresses, Strains, and Inter-mittent Conditions. Creep of Low Carbon N-155 Alloy . . . . . 77
(a) 1350eF ........................ 77
(b) 1500OF . . . . . . . . . . .............. 78
XVIII. Average K Factor Values for Various Stresses and IntermittentConditions. Creep of Inconel X ..... . . . . . . 80
XIX. Average 'K Factor Values for Various Stresses and IntermittentConditions. Creep of Titanium Alloy RC-130A ......... 81
XX. Average K Factor Values for Various Stresses and IntermittentConditions. Creep of Type 321 Stainless Steel . . . . . . . . 83
(a) 120iF ........................ 83(b) 1350*F ... . . . . . .. .. . 83
WADC TR 53-336 Pt 4 vi

LIST OF ILLUSTRATIONS
Figure Page
1. Diagramatic Representation of Cycles of Intermittent Loadingand/or Heating. . . . . . . . ................. . . . 7
2. Creep of 75S-T6. 300*F. Steady Load and Temperature .... 14
3. Creep of 753-T6. 3000F. Steady Load, Intermittent Temper-ature. 1 Hr./l Hr. Cycle 3 . . . . . . . . . . . . .. .. 14
4. Creep of 75S-T6. 300*F. Steady Temperature, IntermittentLoad. 1 Hr./1 Hr. Cycle 1 . . . . . . . . . . . . . . . . . 15
5. Creep of 75S-T6. 300F. Steady Temperature, IntermittentLoad. li Hr./% Hr. Cycle 2 .. . . . . . . . . . . . .. 15
6. Creep of 75S-T6o 300*F. Intermittent Load and Temperature.In Phase. 1 Hr./1 Hr. Cycle 5 . . . . . ............ .. 16
7. Creep of 75S-T6. 3000F. Intermittent Load and Temperature.Out of Phase. 1 Hr./1 Hr. Cycle 6 . . . . . . . . . . . . . 16
8. Creep of 75S-T6. ý3000F. Intermittent Load and Temperature.In Phase. * Hr.A Hr. Cycle 7 ............... 17
9. Creep of 75S-T6. 3000F. Intermittent Load and Temperature.Out of Phase. * Hr./% Hr. Cycle 8 .... ............ . . 17
10. Creep of 75S-T6. 3000F. Stress/Log Time Curves. Steady Loadand Temperature . . . . . . . . . . . . . . . . . . 18
11. Creep of 75S-T6. 3000F. Stress/Log Time Curves. Steady Load,Intermittent Temperature. 1 Hr./1 Hr. Cycle 3 . . . . . . . 18
12. Creep of 75S-T6. 3000F. Stress/Log Time Curves. SteadyTemperature, Intermittent Load* 1 Hr./1 Hr. Cycle 1 . . . . 19
13. Creep of 75S-T6. 300*F. Stress/kg Time Curves. SteadyTemperature, Intermittent Load. 1, Hr./ Hr. Cycle 2. . . . 19
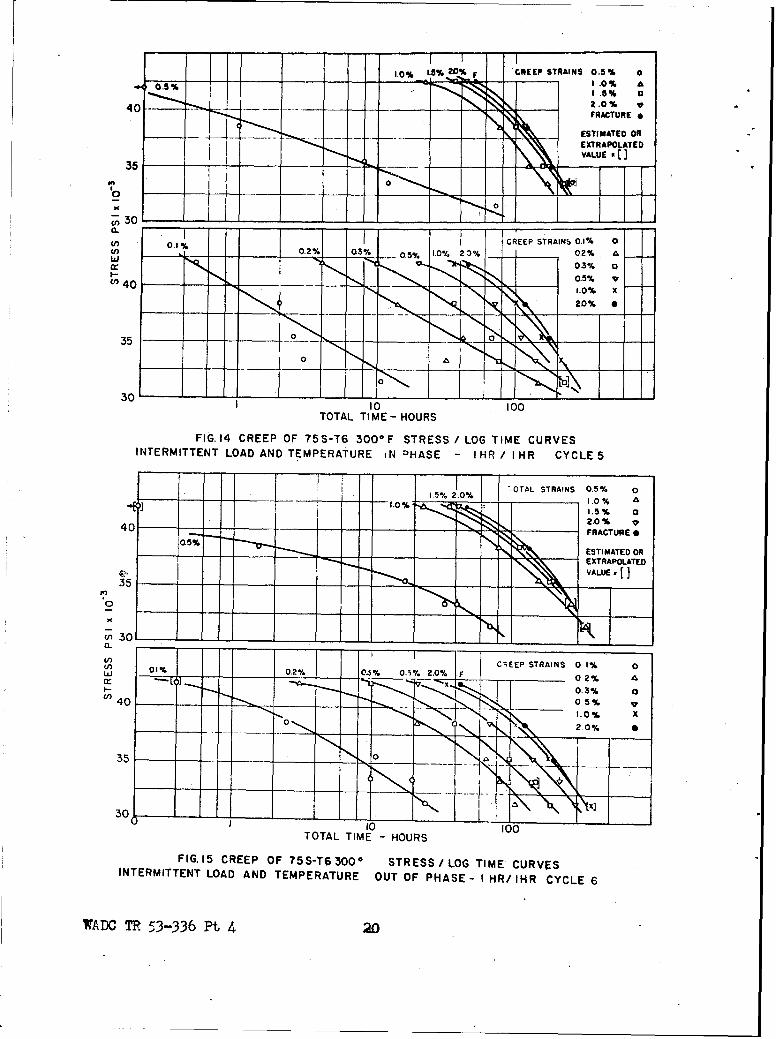
14. Creep of 75S-T6. 3000F. Stress/Log Time Curves. Inter-mittent Load and Temperature. In Phase. 1 Hr./l Hr. Cycle 5 20
15. Creep of 75$-T6. 3000F. Stress/Log Time Curves. Inter-mittent Load and Temperature. Out of Phase. 1 Hr./1 Hr.Cycle 6 . . . . . . . . . .. . . . . . . 20
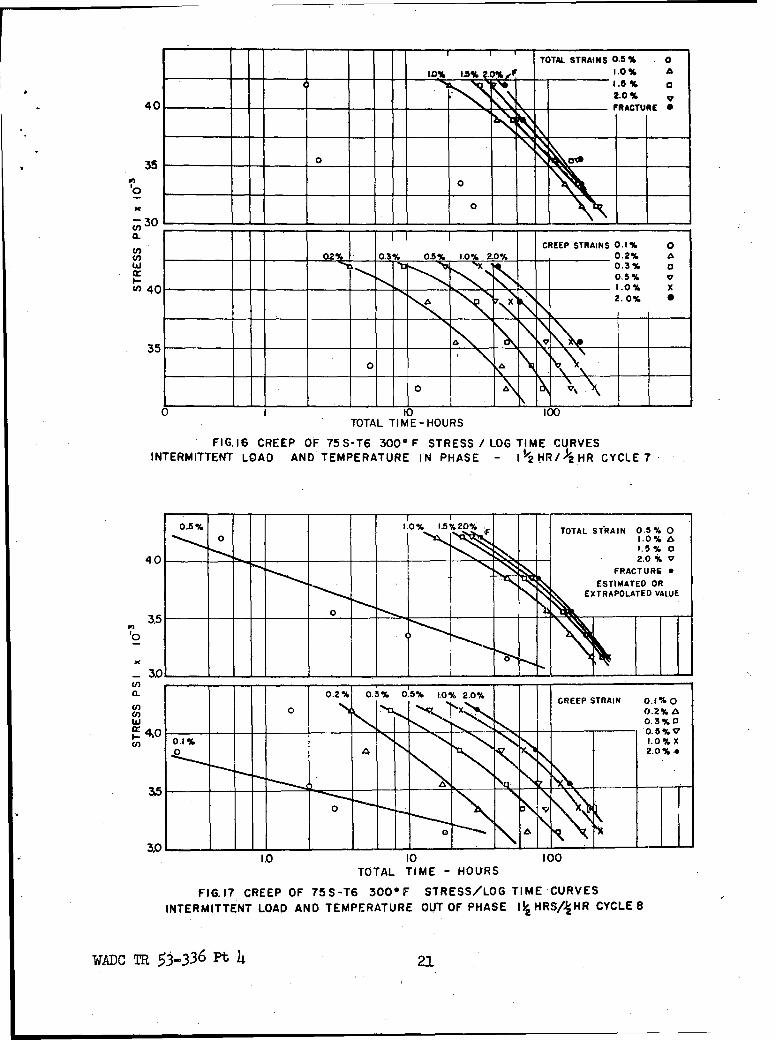
16. Creep of 75S-T6o 3000'F, Stress/Log Time Curves. Inter-mittent Load and Temperature. In Phase, 21 Hr.A Hr.Cycle 7 5 .3.-.3.3.. . . . .. .. . . . . . . . . . 21
WADC TM 53-336 Pt 4 vii
Figure Page
17. Creep of 758-T6. 30OPF. Stress/Log Time Curves. Inter-mittent Load and Temperature. Out of Phase. 1i Hr./4 Hr.Cycle 8 .. .. .. .. .. .. .. .. ... . ... 21
18. Creep of 75S-16. 450 0 F. Steady Load, Intermittent Temper-ature. 1 Hr./l Hr. Cycle 3 .. .. .. ..... ....... . 25
19. Creep of 753-T6. 4500 F. Stress/kog Time Curves. Steady Load,Intermittent Temperature. 1 Hr./l Hr. Cycle 3 ....... 26
20. Creep of 75S-T6. 6004F. Steady Load and Temperature .... 28
21. Creep of 758-T6. 600*F. Steady Load, Intermittent Temperature 28
22. Creep of 75S-T6. 600kF. Intermittent Load and Temperature.In Phase. 1 Hr./ Hr. Cycle5 .... ... ...... ..
23. Creep of 753-T6. 600"F. Intermittent Load and Temperature.Out of Phase. 1 Hr./l Hr. Cycle 6 . . . ......... 29
24. Creep of 753-T6. 6000 F. Intermittent Load and Temperature.In Phase. i4 Hr.4 Hr. Cycle 7 . . . . . . . . . . . . . . . 30
25. Creep of 758-T6. 600F. Intermittent Load and Temperature.Out of Phase. 1i Hr.4 Hr. Cycle 8 . . . . . . . . . . . . . 30
26. Creep of 755-T6. 6000 F. Stress/Log Time Curves. Steady Loadand Temperature . . . . . ........... ....... 31
27. Creep of 75&-T6. 6000F. Stress/Log Time Curves. Steady Load,Intermittent Temperature. 1 Hr./l Hr. Cycle 3 . . . . . . . 31
28. Creep of 75S-T6. 600 0 F. Stress/Log Time Curves. Inter-mittent Load and Temperature. In Phase. 1 Hr./l Hr. Cycle 5 32
29. Creep of 755-T6. 600*F. Stress/Log Time Curves. Inter-mittent Load and Temperature. Out of Phase. I Hr./1 Hr.,cycle 6 ., 32
30. Creep of 753-T6. 6000 F. Stress/Log Time Curves. Inter-mittent Load and Temperature. In Phase. 1i Hr.4 Hr.Cycle 7 .. .. .. .. .. .. .. .... . .... 33
31. Creep of 75S-T6. 600eF. Stress/Log Time Curves. Inter-mittent Load and Temperature. Out of Phase. I4 Hr.4 Hr.Cycle 8 . . . . . . . . . . . . . . . . . . . . . . .33
32. Hypothetical Deformation During Various Types of Cycles . • - 41
WADC TR 53-336 Pt 4 viii

Figure Page
33. Prediction of Creep Data. 75S-T6. 300*F. Cycle 3 . . ... 46
(a) Total Strain/Total Time Curves . . . . . . . . . .. . 46(b) Creep Strain/Total Time Curves . .. .. ... . 46
34. Variation of K with Stress and Strain. 75S-T6. 3000 F.Cycle 3 . . . .'. . . . . . . . . . . . 0 . 50
(a) K . . . . . . . . . . . . . . . . . . . . ...... 50(b) 50
35. Variation of Ka with Stress and Strain. 75S-T6. 4500 F.Cycle 3 ........................... 55
36. Prediction of Creep Data. 75S-T6. 4500 F. Cycle 3. TotalStrain/Total Time Curves . . . . . . .55
37. Variation of K Values with Stress and Strain. 75S-T6. 6000 F.Cycle 3 . . ............................ 61
38. Prediction of Creep Data. 75s-T6. 6000F. Cycle 3. TotalStrain/Total Time Curves . 61
39. Actual and Calculated Stress/Log Time Curves. 75S-T6. 30041F.Steady Load and Temperature ......... . . . . . .. 65
40. Creep of FS-lH Magnesium Alloy. 3000F. Intermittent Load1 Hr. On/1 Hr. Off. Experimental and Predicted Curves. . . . 72
41. Experimental and Predicted Creep Curves. Type 321 StainlessSteel. Steady Load and Temperature. 1350 F . ..... . 84
42. Experimental and Predicted Creep Curves. Type 321 StainlessSteel. Intermittent Heating. 1350OF ............. . . . . 84
WADC TR 53-336 Pt 4 ix

ERRATA
Aluminum and titanium alloy designations as referenced Jin this report should be replaced by the current designationsas given below:
Old Designation Current Designation
75S-T6 7075-T624S-T3 2024-T3RC-130A C-Il02S 11004S 300463s 6o63-T6
WADC TR 53-336 Pt 4 x

"flTRDIJTION
"It is only on rare occasions that the design engineer has data
available on the behavior of appropriate materials under the precise con-
ditions of the intended usage, and it is often impracticable to conduct
laboratory tests simulating closely the known or expected variation in
stress, temperature, and environment to which the part will be exposed
during its service life. This is the case for aircraft structural and
engine components subjected to such stresses and temperatures as to make
creep one of the limiting design criteria. Mhile almost all of the con-
siderable body of creep data collece'd for a wide variety of materials is
derived from isothermal tests conducted under steady constant lead, the
actual use of the material may involve a highly irregular and complex
.history of stress and temperature conditions. It had been considerea
sufficient to design conservatively on the basis of the isothermal steady
load tensile creep properties even at the expense of some inefficiency
but indications were found(1_,293) that cyclic conditions of stressing or
heating could in some cases cause accelerated creep and premature failure
such that the design ms not in fact conservative.
The present investigation was therefore ,undertaken to ascertainwhat
effects might be encountered when materials were subjected to Qreep under
intermittent loading or heating, or combinations of intermittent loading
and heating. A previous report(4) has described the results of intermittent
stress tests on clad aluminum alloys 75S-T6 and 24S-T3 at 3004P, 450eF and
600*7, and on commercial purity titanium at 400.Fo Intermittent temper-
ature tests on 753-T6 and 248-T3 alloys at 4 and combined inter-
mittent .stress and temperature tests on 75S-T6 alloy at 450&p(6) have also
leen reported. The work described in the present report was cencerned
]DC TR, 53-336 Pt4 4
with intermittent temperature., and combined intermittent stress and temper-
ature tests on clad aluminum alloy 75S-T6 at 300*F and.60eF., and some
additional intermittent temperature tests at 4501F.
In the earlier reports referred to above, it was concluded that
under the test conditions employed, intermittent temperature., or in phase
cycles of intermittent stressing and temperature do not greatly affect
the creep properties of the alloys tested when the deformation and rupture
characteristics are compared with-steady load isothermal creep., as judged
on a basis of net time under load at the test temperature. Subjecting
the material to intermittent stressing at a steady temperature or to out
of phase combined cycles of load and temperature (where the test piece
is at test temperature in the absence of load for part of the cycle) does,
however, produce accelerated creep and earlier rupture as compared with
steady load isothermal conditions, again using the above net time criterion.
Extensive work at Cornell Aerona utical Laboratories., Inc. (7.,8) on
the creep behavior of a variety of alloys under intermittent.stressing
or heating conditions has shown that creep can be either accelerated or
retarded according to the relative influence exerted by such factors as
overaging,'crystal recoveiT,,ductility changes, creep recovery, and thermal
stress effects.
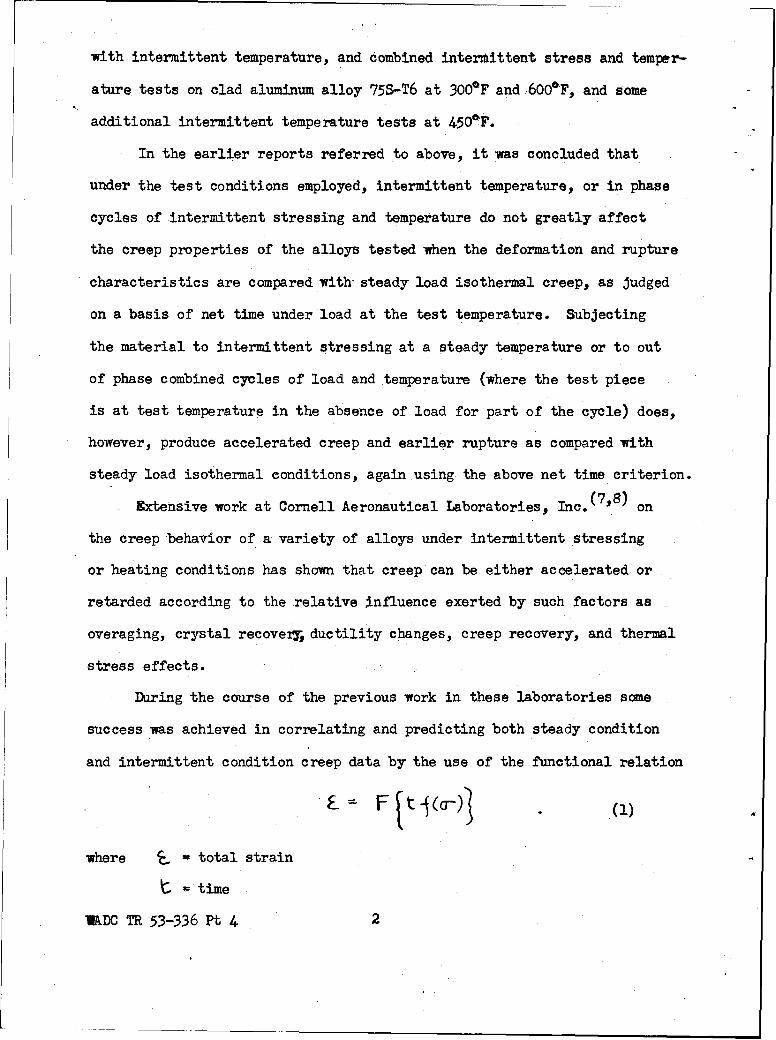
During the course of the previous work in these laboratories some
success -was achieved in correlating and predicting both steady condition
and intermittent condition creep data by the use of the functional relation
F t io-)I
where total strain
time
IRDO TR 53-336 Pt 4 2

a- = stress
F = strain function
4 = stress function.
Plotting strain against log time at various stresses for creep under steady
or intermittent conditions gave, for any particular test temperature and
type of test, a series of more or less homologous creep curves which dif-
fered primarily in their displacement along the log time axis. Then, if
were the time to reach a certain strain at a selected standard stress
, the time, I , to reach the same strain at some other stress 0-
-would be given by
t t') ~(&(o)j (2)
or t (3)
By using this relation, a single composite creep curve could be drawn,
representing the creep behavior of the material at one temperature under
a specified steady or intermittent condition, thus permitting a simple
comparison of the effects of various types of cycle. The value of (1)
obtained for the same stresses was only slightly dependent on the strain,
and similar values were found for steady stress isothermal creep and for
the various types of intermittent test cycle. Thus the function F con-
tains the effect of the cyclic condition. and the stress function ý is
approximately independent of strain or the type of test. Consequently if
one intermittent stress test were run at the standard stress G-S , the
time • to achieve the same strain at any other intermittent stress, 0-,
for the same cycle could be determined from
79DC TR 53-336-Pt 4 3
where K I - and is determined from two steady stress creep
curves, and 1i•§ from the single intermittent stress creep curve at the
standard stress a . Furthermore, if tests at a series of stresses under
steady load isothermal conditions are already available over a suitable
range, intermediate values of V(a-q)c may be interpolated from a plot of
log • against log a- where 3, has been chosen appropriately.
The additional test results obtained under various intermittent
conditions, and presented in this report, have been analyzed both on the
basis of the net time under load at test temperature and on the basis of
the functional equation (1). Predicted creep curves calculated by the
use of equations (2) and (4) using K values averaged over various strains
up to and including fracture are compared with the experimental results.
Universal application of this empirical method of analysis and pre-
diction should not be expected. This is borne out by the later section
of this report dealing with a general evaluation of the method. Never-
theless, in view of the paucity of experimental creep data under conditions
of intermittent loading and heating, even the approximate quantitative
prediction of such data was considered a worthwhile goal, and the anal-
ytical work summarized in this report has been prosecuted from this point
of view.
MATERIAL, EQUIPMENT AND TEST METHOD
All tests in the present series were conducted on clad aluminum
alloy 75S-T6 (Government Specification An-A-13) of the same batch as that
used in earlier work(4'5,6) in these laboratories. Details of the analysie
and room temperature tensile properties have been reported previously.(4)
The material was supplied in the form of a number of 10" x 20" sheets of
WADC TR 53-336 Pt 4 4

the same production batch, and specimens were cut from these parallel to
the rolling direction, the sheets being numbered consecutively as they
were taken from the box.
The equipment used in these tests was that which has been previously
described,(9"10) with the later modificationi(6) n which the heat capacity
of the furnaces was reduced, so that they could meet more easily the short
heating period required in tests involving the use of intermittent heat-
ing conditions. In consequence, the initial heating of the test piece
before the first test cycle took place more rapidly than previously, and
in order to compensate approximately for this, the first load was applied
two hours, instead of three hours, after the initial heating of the test
piece was commenced. A check of this compensation was made by testing equi-
valent specimens at the same stress using the new standard two hours initial
heating period in one case, and an initial heating, controlled by hand to
simulate the earlier three hour procedure, in the other case. The creep
curves and fracture times obtained were practically identical in the two
cases and the use of the revised two hour initial heating period was
therefore considered justified.
During the steady high temperature portion of each cycle, the temper-
ature of the specimen was maintained constant within +3,F of the reported
test temperature, and was measured by two iron-constantan thermocouples
held in place on the specimen near the extensometer gauge points by adhe-
sive glass tape or string. Sometimes a third thermocouple in the center
of the gauge length was also employed. Stresses were determined to within
an accuracy of 25 psi, and the creep extensions were measured on a two
inch gauge length to 0.01% strain. In order to avoid the inconsistencies
which would be caused by variable or inaccurate initial strain measurements
WADC TR53-336 Pt4 5

in such data as the time taken to reach a given strain, all creep curves
were corrected to standard values of the initial strain corresponding to
the particular test stress. These values were obtained either from stress-
strain curves determined at the test temperature in the creep testing
machine using manual incremental loading and a mechanical extensometer,
or as the mean of the initial deformations recorded for the stress in
question in a large number of creep tests.
The appropriate sequence of intermittent heating and stressing was
started at the time of initial application of the test load, and all times
were taken from this reference point. Loading and unloading times for
both steady and intermittent load tests were approximately two minutes.
Intermittent load cycles, either alone or in combination with intermittent
temperature cycles, of 1 hr. and 1-21 hrs. respectively out of a total cycle
of two hours were used. For tests involving intermittent heating condi-
tions the same periods of 1 hr. and I1 hrs. out of a total cycle time of
2 hrs. were used during which the specimen was maintained at the test
temperature, In the former case - hr. was allowed for heating to test
temperature, the specimen being cooled to room temperature in 6 mins. and
maintained at room temperature for 24 mins. In the latter case (lp hrs.
at temperature per 2 hr. cycle), heating to the test temperature was
accomplished in 20 mins. the remaining 10 mins. being spent at room temper-
ature or cooling down to it. For the combined intermittent heating and
stressing tests, cycles with the on-load period both in phase and out of
phase with the period of constant elevated temperature were used, tests
being conducted for both 1 hr. and l1 hr. cycles of load and temperature.
The eight types of cycle are shown diagramatically in Fig. 1, cycle 4
being included for completeness although it was not used in the test series
WADC TR 53-336 Pt 4 6
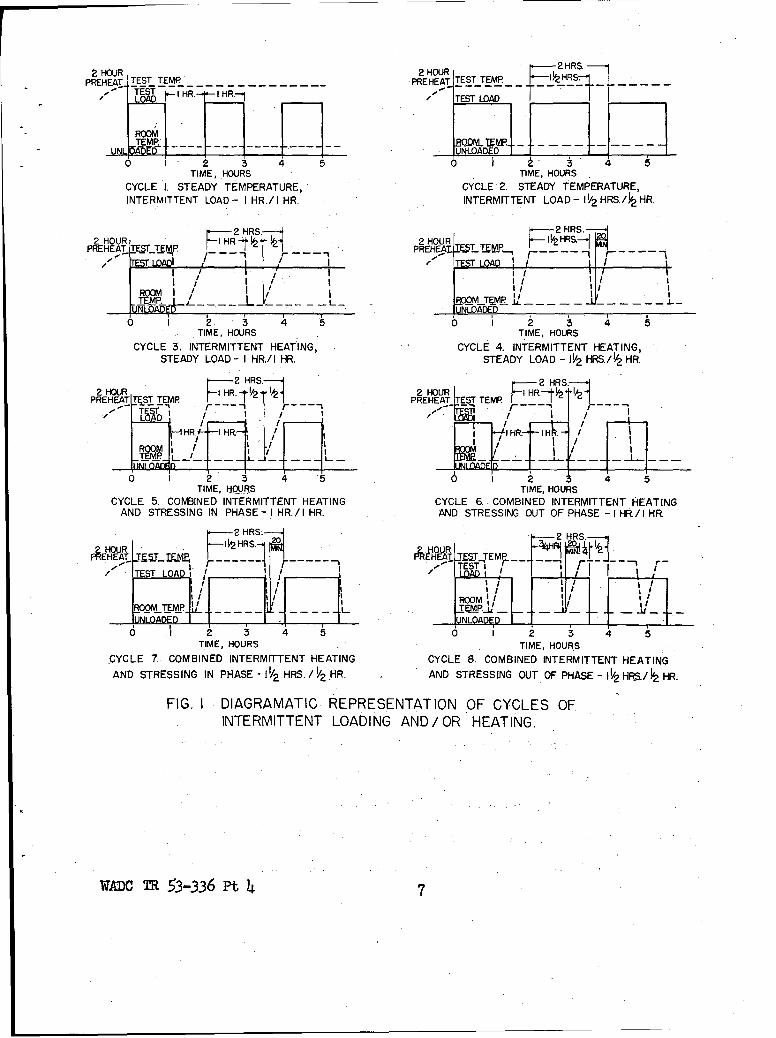
2 HOUR 2 HOUR 2RPREHEAjTEST-------------------------PREHEAT TEST TEMP 111.HRS
Lo TE ThHR.-- HR.-1 TEST LOAD --
ROOMTEMP:__.IM -
UNI fbI ----- -__ - JUNLOADED ____
0 I 2 3 4 5 6 It5TIME, HOURS TIME, HOURS
CYCLE 1. STEADY TEMPERATURE, CYCLE 2. STEADY TEMPERATURE,INTERMITTENT LOAD - I HR/ I HR. INTERMITTENT LOAD- I'/2 1-HRS./ýHR.
PREHEROMTEM -TMPý
S T A D O A - I H R/ I H . S T E A D Y L O D - 1 1 2 HSUH
"PRHA ITEST TM I, PEETTEST TEMD iI
LN kE /UUAEL_ --- L
0 1ITIME, HOURiS TIME, HOURS
CYCLE 5. CNIE INTERMITTENT HEATING, CYCLE 6..CMIE INTERMITTENT HEATING,ADSTRESSIN INA PHS-I R I HRH. N STRESSINGLOUT OF PHASE - HR/HR
2 HRS. 2 HRS2HOUR p-I HRS. -I20 'It 2OUR1 HR.Jý '/2 1
PREHEAT T ETIMfP j. PREHEAT ES EMP FTEST OD Z9I, ESi I I
IH/ flt R.
IN n ,I
0 2 3 4 5 06 2 3 4 5TIME, HOURS TIME, HOURS
.CYCLE 7. COMBINED INTERMITTENT HEATING CYCLE 8. COMBINED INTERMITTENT HEATINGAND STRESSING IN PHASE - I1/ HRS./'/I HR.. AND STRESSING OUT OF PHASE - I iHRS/I~ HR.
INERITEN LODIGAN/RAETIG
WAD MR 53-36PtD
covered by this report.
TEST RESULTS
The test results obtained during the period covered by this report
are presented in Tables I-V inclusive and in Figs, 2-31.inclusive. All
times given were the total elapsed times, the creep curves for intermittent
conditions being drawn as the envelope of readings taken at the end of the
constant temperature, under load period of each cycle. At this time, the
temperature conditions approximated closely to equilibrium, and the strain
readings were therefore most consistent. At other intermediate points on
the cycle the strain readings may be influenced by differential expansion
between the outer tube and inner rod of the, extensometer as heating or
cooling is taking place.
1. Results at 3000F.
The data already presented(4) at 3 00QP on clad aluminum alloy 75S-T6
were extended in the presented series of creep tests to the cases of inter-
mittent heating under steady load, and combined intermittent loading and
intermittent temperature. Only one cycle, of one hour at steady elevated
temperature per total cycle of two hours, (Cycle 3) was used in the inter-
mittent heating case. For the tests under conditions of combined inter-
mittent heating arid loading, two time cycles of 1 hr. and ] hrs. on time
per 2 hr. cycle were employed and for both time schedules tests were con--
ducted with the loading both in phase (cycles 5 and 7) and out of phase
(cycles 6 and 8) with the heating. In reviewing the results of these tests
it was found that certain incompatibilities existed between them and the
early isothermal steady load and intermittent load data using I hr. and
WADC TR 53-336 Pt 4 8
Shrs. on times per 2 hro cycle. (Cycles 1 and 2)0 CQnsequently these
three series of tests were repeated to ensure that a complete series of
comparable creep tests were available under the eight combinations of
steady or intermittent stress or temperature. At the end of the test
program, a repeat series (Series II) of tests at 300eF under cycle 7
conditions were done, using a sheet of material different from that used
for the previous series (Series I). The results obtained indicated a
greater creep streigthq particularly at low stresses, than the Series I
results shown in Fig. 8, the Series II results being compatible with the
earlier data(4) rather than with the present Series 1o It seGws probable,
therefore, that the differences between the earlier data, and that
presently reported, may well be ascribed to slight differences between
different sheets of the test material stock. The Series II results
under cycle 7 conditions are included at the foot of Tables I and II.
The results obtained are reported in Table I in terms of the total
elapsed test times at the various stresses to reach specified total
strains. Table II contains similar data related to specified creep
strains. The creep strains were obtained by subtracting from the total
extension measured by the equipment the best values for the strain tak-
ing place on first application of the load the remainder being the time
dependent or creep strain portion of the deformation. Figs. 2-9 inclu-
sive show the families of creep curves obtained under the various steady
and intermittent testing conditions at 3000F. The data of Tables I and
II have been replotted in Figs. 10 17 inclusive to give stress versus
log-time design curves for specified values of the total or creep
strains.
WADC TR 53-336 Pt 4 9
TABLE I
Creep of Clad Aluminum Alloy 75S-T6 at 300OF
under Steady and Intermittent Conditions
Total Times to Reach Various Total Strains
Type Total Time (Hrs.) to Reach Total Elong.of Stress Strains- f on 2" at
Test psi 0.5% 1.0% 1.5% 2.0% 3.0% Fracture Fracture
Steady Load 42,000 [0.21 8T 14 10 -- 19.9 2.54and Temperature 38,500 [0.3] 25 462 534 58 58.6 3.56
35,500 [0.4] 47 67 76 80,' 80.3 3.3233,500 22 84 104 1124 - 115.4 2.6433,500 8 95 123 127 - 146.4 2.7231,500 25 132 159 168 -- 169.8 2.72
Steady Temperature 42,000 -- 17.5 26 30 3342 36.2 5.68Intermittent Load 38,500 ( 4 46 59 66 71 72.3 3.341 Hr./l Hr. 35,500 5 87 -- - -- 94.7 1.22Cycle 1 35,500 5 91 115 124 129 130.1 3.64
33,500 30 143 167j 176 18012 180.8 3.1531,500 43 200 240 2521 -- 256.1 2.92
Steady Temperature 42,000 -- 17 27 32 36i 38.7 3.86Intermittent.Load 38,500 1 4C 54 61 65 66.9 6.1814 Hr.A Hr. 35,500 6 73, 94 102 i08ý 109.3 4.44Cycle 2 35,500 5i 762 97 106 110-2 i11 3.69
33,500 14 112 137 148 154 155 5.7231,500 27 142 174 188 -- 196.3 2.67
Steady Load 42,000 [o.] 16 30 39 484 54.4 6.08Intermittent Temp. 38,500 1 56 79 884 -- 94.2 2.481 Hr./1 Hr. 35,500 0 113 145 160 -- 168.3 2.44Cycle 3 33,500 29 176 219 [2301 . - --
31,500 70 -- -- I -- -
Intermittent Load 42,000 [O.] 22 36 43 49 50.7 3.50and Temperature 38,500 1 7612 102i 114 - 118.8 2.40In Phase 35,500 8 126 157 171 182i 182.8 3.421 Hr./1 Hr. 33,500 12 170 223 245 .. ....Cycle 5 31,500 72 -- -.--.
Intermittent Load 42,000 [O.] 23 35 41 46 46.6 3.16and Temperature 38,500 I1 80 112 123 130 132.3 4.10Out of Phase 35,500 17 157 187 197 204 204.4 3.401 Hr.AHr. 33,500 40 - -. . .. .Cycle 6 33,500 33 [2601 -. ..
31,500 70 [335] 1 1 -
WADC TR 53-336 Pt 4 10

TABLE I (Contvd.)
Intermittent Load 42,000 2 30 301, 41 48 49.2 3.12and Temperature 3$,500 -- 43 55 60• 65 66 3.94In Phase 359500 .110 144 158 166:o 167 3.431- Hr.A Hr. 33,500 21Z 130 159 -- 165.5 1.74Cycle 7 (Series I) 31,500 30 170 214 225 -- --
Intermittent Load 42,000 ! 16 24 28 -- 32.6 3.00and Temperature 38,500 < • 50 66 74 80 81.5 3.34Out of Phase 35,500 3 94 120i 131 -- 137.3 2.4611- Hr.A Hr. 33,500 10 136 176 --.. 192.8 1.98Cycle 8 31,500 49 193 229 245 247.2 2.13
Intermittent Load 429000 14 251- 31 332 35.0 3.72and Temperature 389500 $ 48 68 76 80 84.2 4.17
In Phase 35,500 2 98 127 140 146 152.9 3.591-1 Hr.A/ Hr. 33,500 19 143 173 187 194 194.9 2.58Cycle 7 31,500 26 224 (2751 -- -- N.F. -Repeat Series II
[ I- Extrapolated or Estimated Value
WADC TR 53-336 Pt4 4l
TABLE II
Creep of Clad Aluminum Alloy 75S-T6 at 300°F
under Steady and Intermittent Conditions
Total Times to Reach Various Creep Strains
Type Total Times (Hrs.) to Reach Creepof Stress _ U __75 - Strains of:
Test psi 0.51 0.2% 0.3% 0.5% 1.0% .0
Steady Load 42,000 2 3 7 13and Temperature 38•500 5 12 24F 44 5A
35,500 2 2 25 37 64 7933,500 14 36 56 76 99 115315,500 312 37 *72 112. 153 169I-
Steady Temperature 429000 -- 4 81 16 25 32Intermittent Load 38,500 2 12 25 41X 574 691 Hr./1 Hr. 35,500 2 30 53 78 - .--Cycle 1 35,500 2•a 25 47 79 111 126
33,500 10 57 90 128 163 17931,500 13 64 112 172 232 254
Steady Temperature 42,000 -- 3 7p 15: 26 34Intermittent Load 38,500 1.4. 20 36L 53 6411 Hr./A Hr. 35,500 Ž2- 22 42 67 91 106Cycle 2 35,500 4 17t 40 67 94 1081
33,500 2- 32 62 97 132 1511331,500 11 41 75 120 166 193
Steady Load 42,000 1 4 8 151 29 41Intermittent Temp. 38,500 2 10 25 49 76 91 Hr./1 Hr. 35,500 6 30 60 100 145 168Cycle 3 33,500 8 55 98 144 208 -
31500 20 103 [180] -- . --.
Intermittent Load 42,000 0.5 4 10 20 36 46and Temperature 38,500 2 14 36 71 100 1184In Phase 35,500 ;2 42. 68 110 152 1781 Hro/l Hr. 33,500 3 32 76 140 213 --Cycle 5 31,500 11 155 [225] -- -- --
Intermittent Load 42,000 [0-4] 3 10 214 34 43and Temperature 38,500 21 40 70 108 128Out of Phase 35,500 11 67 96 142 183 2011 Hr./l Hr. 33,500 20 97 [150] -- -- --
Cycle 6 33,500 10 83 142 223 --..
31,500 25 107 192 292 [375] --
WADC TR 53-336 Pt 4 12
TABLE II (Cont'd.)
Intermittent Load 42,000 -- 4 91 181 33 44and Temperature 38,500 -- 14 31 41 53A 634In Phase 35,500 - 22 51 94 139 16311 Hr./ Hr. 33,500 54 46 74 115 154 --Cycle 7, Series I 31,500 12 49 90 140 206 -
Intermittent Load 42,000 i1 4 74 14 23 301and Temperature 38,500 -- 5 23 444 64 774Out of Phase 35,500 2 17 48 82 117 1341L Hr./% Hr. 33,500 3 31 64 93 155 [1951Cycle 8 31,500 18 69 112 168 222 -
Intermittent Load 42,000 2t 51 13 '25 334and Temperature 38,500 1 10 21 42 66 80
In Phase 35,500 1 184 42 83 123 1451- Hr.A Hr. 33,500 7 48 81 126 167 1924Cycle 7 31,500 2 51 i11 188 - --
Repeat Series II
[ = Extrapolated or Estimated Value
NOTE: The following mean values of the initial strains on loadingwere used in arriving at the data of Tables I and IIM
42,000 psi 0.455%38,500 psi 0.415%35,500 psi 0.385%33,500 psi 0.362%31,500 psi 0.340%
WADC TR 53-336 Pt 4 13

.0 42000 PSI 3650PI IPI
9.9 Has 58S.? MRS S.3 MRS 33500 PSI 315 0 PSI3.00% 3.58% 332% 33-500 PS II
FRACTURE FRACTURE FRACTURE1115.4mRS 464MS 16.s "eas.2.5 2.62% 2.72% -2.12%
00
z1.5
U)
_j-00
I-.
0 ---__ .1 -L -L0 25 50 75 100 125 150 175 200 225TOTAL TIME - HOURS
FIG.2 CREEP OF 75S-T6 300OF STEADY LOAD AND TEMPERATURE
54.4 MIRS.
42~O 38500 PSI
2.5 -FRACTURE -- 35500PSi94.2 M~RS. FRACTURE2.48% 168.3 MRS.
2.0 2.42 %
0
2 33 500 PSI
I.-
0
0.54 __ _ 0-0-0 __ _ _ _ _ _ __ _ _
0 25 50 75 100 125 150 175 200TOTAL TIME --HOURS
FIG 3 CREEP OF 75S-T6 300* F STEADY LOADINTERMITTENT TEMPERATURE IHR/IHR CYCLE 3
WJADc TR? 53-336 Pt 4 14

30 42,000 P S .38,500 Psi 33,500 Ps IFRACTURE FRACTURE FRACTURE36.2 MRS 72.3 MRS 180.8 MRS
2.5
2.0
En
35,50 PS I31,5OOPSI
FRACTURE94.7 MRSFRACTIIU
1.0 1.22 -e .i M2RS2.92%
00 25 50 75 100 125 150 175 200 225
TOTAL TIME - HOURS
FIG.4 CREEP OF 75S-T6 3000 F STEADY TEMPERATURE,
INTERMITTENT LOAD I HR/ I HR CYCLE I
3.0 42,OOOPSI 38,500PS 1 35,500pst 35,500psi 35,500PSi
FRACTURE FRACTURE FRACTURE FRACTURE FRACTURE38a.7 MRS 66.9 MRS I 109.3 MRS III MRS 155 MRS3.86 % 6.18% j 4.44% 3.69% 5.72% 31,500 PSI
I FRACTURE25 -196.3 MRS
2.67%
20
z
0.5,
0 25 .50 7.5 100 125 150 175 200 225TOTAL TIME - HOURS
FIG.5 CREEP OF 75 S -T6 3000 F STEADY. TEMPERATURE, INTERMITTENTLOAD 1 '/2 HR/ H2 HR CYCLE 2
~DC~53333.5

.042000 PSI1 35500 PSIRATREFRACTURE
50..r IRS FRACTURES3.50% 3.42 %
2.5____
FRACTURElie .3MRS
2.40%
2.0____
0
Z
4I-
'~* 1.03_%_ IN
0
TOTAL21 TIM-HUR
FIG.6 CREEP OF 75 S-T6 3000 F INTERMITTENT LOAD ANDTEMPERATURE IN PHASE I HR./ I HR. CYCLE 5
3.0 42000 PSI 38500 PSI 35500 PSI
FRACTURE FRACTUREFRCR466 MRS 132.3HMRS FRACTURE
3.6%4,10% 3.40%
2.5 1____
2.0a
F_ 1.
in1 __
IZ-
0.5 2656R
142 MRS
0 25 50 75 100 125 150 175 200 225TOTAL TIME - HOURS
F IG.7 CREEP OF 75S-T6 300OF INTERMITTENT LOAD ANDTEMPERATURE OUT OF PHASE I HR / IHR CYCLE 6
wAflU TR 53-336 Pt 4 16

3.0 4200WOPS1 3SSOOPS4 3550OPSI
FRACTURE FRACTURE FRACTURE49.2 MRS S6HRS 167 MRS3.12 3.94% 3.43%
2.5 __
2.0
33500C PS3IFIVACTURESISHRS 131500 PSI74 % FRACTURE
--- 156% IN
0)
1.-
0.5
00 25 50 75 100 125 150 175 200 225
TOTAL TIME-HOURSFIG.8 CREEP OF 75 S -T6 3000 F INTERMITTENT LOAD AND
TEMPERATURE IN PHASE I '4 HR/ ý2HR CYCLE 7
3.042p00 PSI 36,500 Ps IFRACTURE FRACTURE
32.6 MRS 01.5 MRS
3.00% 3.34 % 3850 IS
FRACTURE1573ZMRS2.46%
2.0 -.--. 33AOOPSI-FRACTURE192.8' MRS
0 31,500 PS%
025, 50 75 100 125 150 175 200 225TOTAL TIME- HOURS
FIG. 9 CREEP OF 75S-T6 300OF INTERMITTENT LOAD ANDTEMPERATURE I'/ 2 ,HR/'/2 HR OUT OF PHASE CYCLES
wACTit53-336 Pt4 17
- - - 10% 18% .. 0%TOTAL. STRAINS3 0.5- -% 1. 2.%.0
1.6 01.0 9FR*CTIIRE@
35
"U) 30__ _ _ _ _
-h 048% 0.3% 0.8% 1.0% CREP 0RI 0.1% &
0.040 -.4 1.0 % x
0.0
35 - 0x
300
TOTAL TIME - HOURS
P15.10 CREEP OF T5S-T& 3007F STRESS/LOG TIME CURVESSTEADY LOAD AND TEMPERATURE
TOTAL MTAIN$ 0.11% 0
.1.0% a40____ 2.0%
PRACTUREO0KITIMAT90 Off
CREEPI $TRAIN 0,1% 00.1% 3% 8% _ 1% 1,0%3
u~401.0% x
30ýTOTAL TIME - HOURS10
FIG. 11 CREEP OF T5 S-T6 300OF STRESS /LOG TIME CURVESSTEADY LOAD INTERMITTENT TEMPERATURE I IHRt/ I MR CYCLE 3
WAD TR 53-336 Pt4 is

1.0% to TOTAL $TRAINS 0.5% 01.0% a
40 2.0% vp0.5% FRACTURE.e
35-
00
-30 _ _ _ _ _ _ _ _ _
fiCREEP STRAINS 0,1 % 0V) 0.2% 0,3% 0.5% ir6% 2.0% 02
w 0.2 % tS 0.1% -0.% 5 a
U) 401,0% x
35 - 1---______
301 -
TOTAL TIME -HRS
FIG. 12 CREEP OF 75 S-T6 3000F STRESS/ LOG TIME CURVESSTEADY TEMPERATURE INTERMITTENT LOAD I HR/I HR CYCLE I
- - -- - TOTAL STRAINS 0.5% 01.0% 1.5% 2.0% 1.0 %
\F 1.5 %0
______ _____ ______FRACTURE
065% 1ý
'0
S0.
0.2% 0.3% 0.5%1.0%2.0%CREEP STRAINS 0.1 % o
0.2 03% 0. N 10%\0 0.2% &11 1 0.3% 0____ 1.0%2.0%
0 0 100TOTAL TIME H'OURS
FIG. 113 CREEP OF 75S-T6 3000 F STRESS/LOG TIME CURVESSTEADY TEMPERATUJRE, INTERMITTENT LOAn I ý HRS./P2 N CYCLE 2
wADC TR 53-336 pt 4 19
1.0% 1.5% 210 F CREEP STRAINS 0.5% 00.5%1 .0% A
.5% a40- ---- .__-__ 2.0%
FRACTURE*-4---- -~--- - ---- - . .ESTIMATED OR
EXTRAPOLATEDVALUE *[
35I
0.1% I CREEP STRAINS 0.1% 00.2% 03% -- 0.5% 1.0% 2 3% 0.2% A
w. 0.3% 0
I. ,0.% X
20% 6
0
30__10 100
TOTAL TIME -HOURSFIG. 14 CREEP OF 75S-T6 3000eF STRESS /LOG TIME CURVES
INTERMITTENT LOAD AND TEMPERATURE IN -HASE I HR I IHR CYCLE 5
OTAL STRAINS 0.5
40I I FRCTR
TOTAL TIEVALHOUR
FI.5CEP F7ST3)SRS/O TIMEE CURVINS01 0UNEMITN LOAD AND % TEMERAUR OUT% O 0 P SE 02 HRIRCYLA
wAD R5-3 t42
TOTAL STRAINS 0.5 % 0____ 1% 1.5% .0~ -F__ 1.0% A
1.5% a2.0%
40 _ _-FRACTUREO
35 ~~0 '_ _
0
00
~30 ___- --- 7 _---1_
CREEP STRAINS 0.1% 0
In
"U)40 N-_ _
35 - _
00
TOTAL TIME-HOURS
FIG.16 CREEP OF 75 S-T6 3000 F STRESS /LOG TIME CURVESINTERMITTENT LOAD AND TEMPERATURE IN PHASE - 1"2 HR/)2'HIR CYCLE 7
0.0.%5.3 10.% 15% 2.0% 1 CREEPA STRAIN 0.5% 0
0 0%.1%
40 2.0%16.
3,50
W.0 0.%0TOA0IE) OR
FI.1 CRE0.3%-T 00 TRS/OGTM3CRE4NEMTETLA NDTMEAUEOTO PHS SI HR.5RYCE V
W0.1% T. 03..3 %t X

2. Results at 450eF.
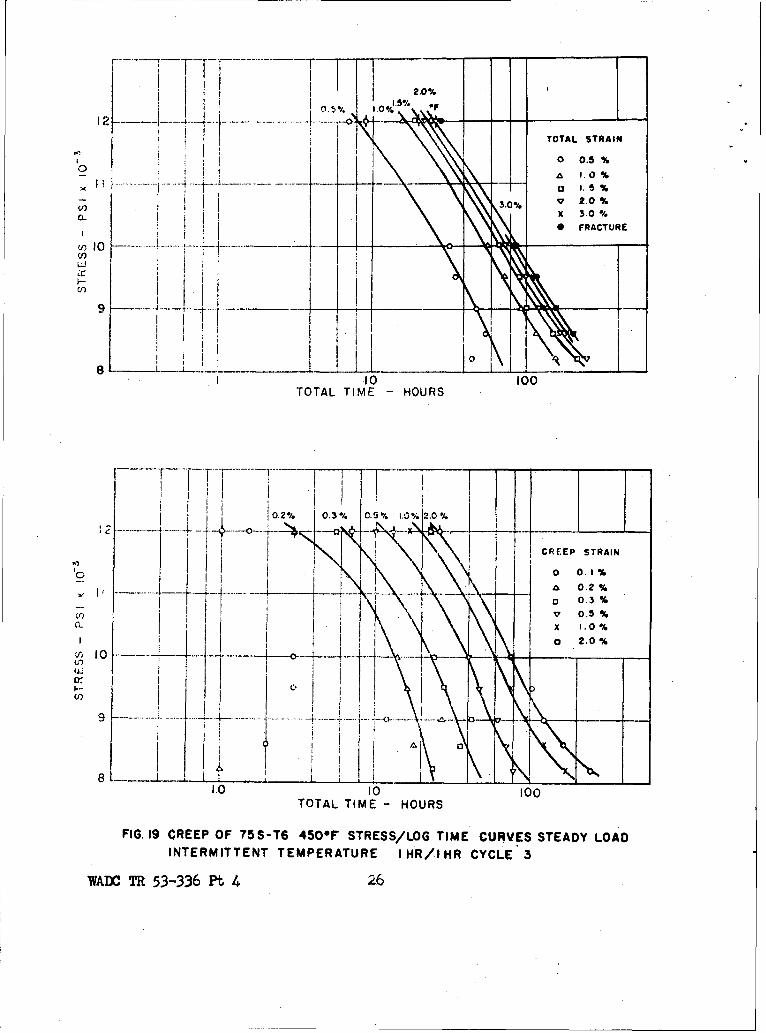
Only one test condition was employed at 450*7, namely that of
steady load intermittent temperature,, using a cycle of one hour at the
steady elevated test temperature for a total cycle time of two hours
(Cycle 3). Previous reports(495,6) contain creep data for clad aluminum
alloy 75S-T6 at 450*F under the other intermittent conditions employed
in the tests at 300'F and also the steady load, intermittent heating
conditions of cycle 4. The results obtained in the present tests are
reported in the same manner as the data obtained at 300'? in Tables III
and IV-m1mFtg9 18 and 19.
3. Results at 600'F.
Tests at 600'F on 75S-T6 ilnoy under isothermal steady load and
intermittent load using both a 1 hr./l hr. (Cycle 1) and a * hr.A hr.
(Cycle 2) cycle have already been reported.(4) In this report the
results of further tests at 600'? using steady load intermittent heat-
ing (cycle 3) and both in phase (cycles 5 and 7) and out of phase
(cycles 6 and 8) combinations of intermittent heating and loading are
given. For comparison purposes, steady load isothermal creep tests at
600*F have also been done and the results included in this section.
These results, obtained on specimens from the same sheet of material
as for the Series II, Cycle 7 tests at 300'F are in good agreement with
earlier tests,(/) and the times to reach specified strains appear to be
somewhat higher, particularly at the lower stresses, that might be ex-
pected from the other presently reported intermittent data at 6006Y,
which wme obtained using specimens cut from other sheets of the test
material stock. The data 1*re again been assembled in a manner .similar
UM TR 53-336 Pt 4 22
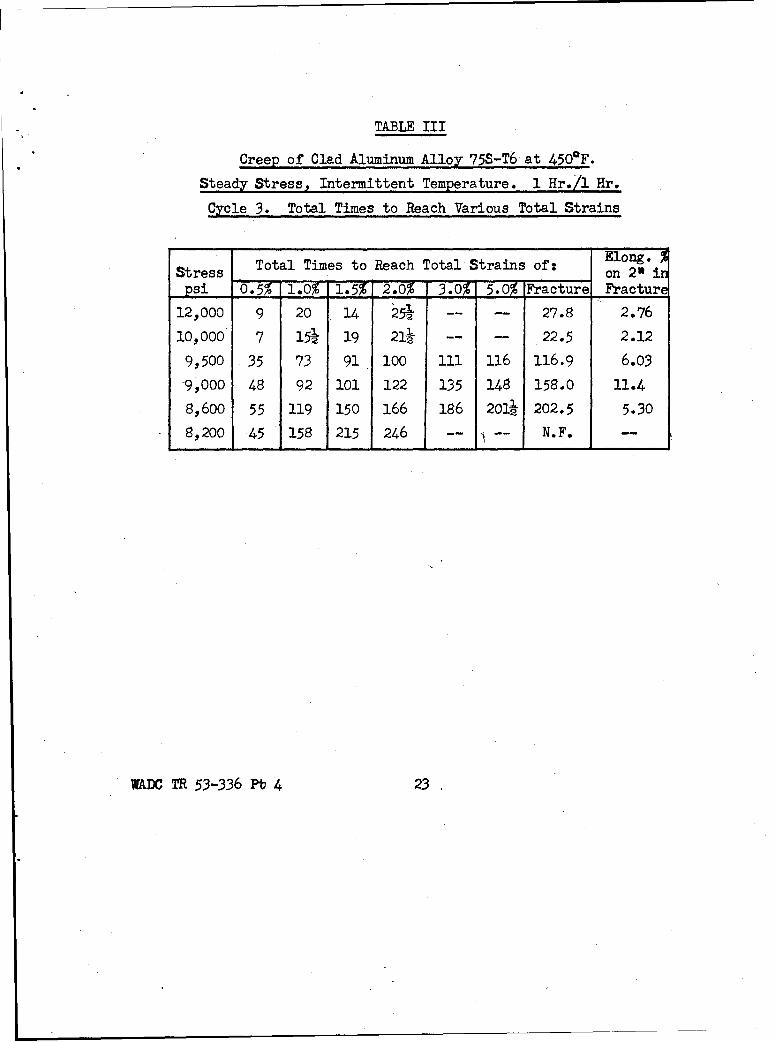
TABLE III
Creep of Clad Aluminum Alloy 75S-T6 at 45OeF.
Steady Stress, Intermittent Temperature. 1 Hr./1 Hr.
Cycle 3. Total Times to Reach Various Total Strains
Stress Total Times to Reach Total Strains of: Elong.
psi 0.5% l1.,0 1.5% 2.O% 3.0% 5.0 Fracture Fracture
12,000 9 20 14 254- -- -- 27.8 2.76
10,000 7 15i 19 211 .. .. 22.5 2.12
9,500 35 73 91 100 i11 116 116.9 6.03
9,000 48 92 101 122 135 148 158.0 11.4
8,600 55 119 150 166 186 201ý 202.5 5.30
8,200 45 158 215 246 -- -- N.F. --
WADC TR 53-336 Pb 4 23

TABLE IV
Creep of Clad Aluminum Alloy 75S-T6 at 450eF.
Steady Stress, Intermittent Temperature. 1 Hr./l Hr. Cycle 3.
Total Times to Reach Specified Creep Strains
Stress Total Times to Reach Creep Strains ofzpsi 0.1 % o.2% 0".3% 0.5% 1.0% ,2.0%
12,000 1 3 7 13 22 26
12,000ooo 3 51 10 16 22
10,000 3 14 24 40 61 75
9,500 3 16 28 46 76 102
9,000 12 2-7A2 42 62 95 12A-
8,600 2 18 36 71 127 164
8,200 -- 1 24 79 171 250
NOTE: The following mean values of the initialstrains on loading were used in arrivingat the data of Tables III and IV:
12,000 psi 0.140%10,000 psi 0.117%9,500 psi 0.111%9,000 psi 0.106%8,600 psi 0.100%8,200 psi 0.096%
WADC TR 53-336 Pt 4 24

0 -0
oc~
) U)
0 X ;
U) 2
! 0n
- - 0
ow.
N N I 0.
EON
0 9 0 0 0 0
%/ NIVhl.S Wl.LO±L
TAM 7R53'm336ft 4 215
I 151.2.0%
I ...... i.. ..0ýs -- -
I TOTAL STRAIN
10 0 0.5 %
I~ .3.% ~ 20%
CL 3.0% X 3.0 %0 FRACTURE
8) 1007Li~
TOTAL TIME -HOURS
10.2%. 0.3% 0.!i%
I~I iCREEP STRAIN
C3 0.3 %
v 0.3 %
I~ Ii I .0 %I 0 2.0 %
1.0 10 100
TOTAL TIME -HOURS
FIG. 19 CREEP OF 75 S-T6 450*F STRESS/LOG TIME CURVES STEADY LOAD
INTERMITTENT TEMPERATURE IHR/IHR CYCLE 3
WADC TR 53-336 Pt 4 -
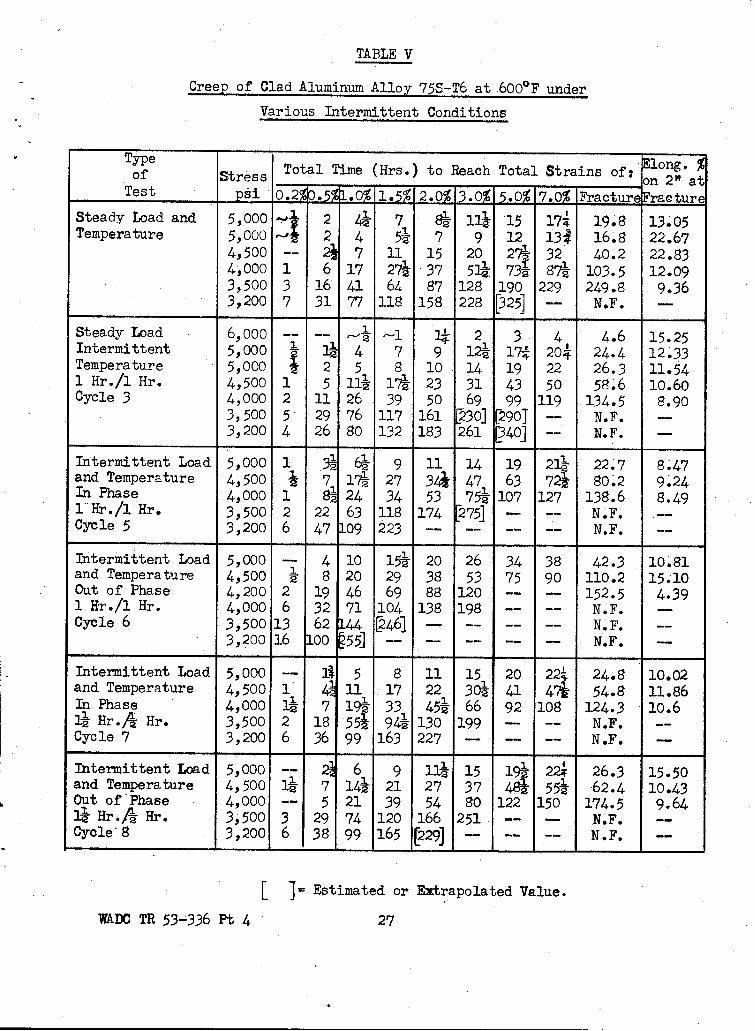
TABLE V
Creep of Clad Aluminum Alloy 75S-T6 at 6000F under
Various Intermittent Conditions
Type
of Stress Total Time (Hrs.) to Reach Total Strains of: Elong.of Streson 2" at
Test psi 0.2%0.5%1.0% 1.5% 2.0% 3.0% 5.0% 7.0% Fracture FracturSteady Load and 5,000 - 2 4 7 81 113 15 174 19.8 13.05Temperature 5,000 2 4 52 7 9 12 134 16.8 22.67
4,500 -- 7 11 15 20 27ý 32 40.2 22.834,000 1 6 17 272 37 511 73A 87i 103.5 12.093,500 3 16 41 64 87 128 190 229 249.8 9.363,200 7 31 77 118 158 228 [325] -- N.F.
Steady Load 6,000 -- - I - 2 3 4 4.6 15.25Intermittent 5,000 le 4 7 9 12425 17W 204 24.4 12.33Temperature 5,000 2 5 8 10 14 19 22 26.3 11.541 Hr./1 Hr. 4,500 1 5 114 174 23 31 43 50 58.6 10.60Cycle 3 4,000 2 11 26 39 50 69 99 119 134.5 8.90
3,500 5 29 76 117 161 230) [290o -- N.F. -3,200 4 26 80 132 183 261 [340]1 -- N.F. -
Intermittent Load 5,000 1 A 6- 9 11 14 19 21- 22.7 8.47and Temperature 4,500 1 7 174 27 341 47 63 72• 80.2 9.24In Phase 4,000 1 8'2 24 34 53 754 107 127 138.6 8.491 Hr./l Hr. 3,500 2 22 63 118 174 275] - -- N.F. --Cycle 5 3,200 6 47 109 223 -- -- -- -- N.F. --
Intermittent Load 5,000 - 4 10 151 20 26 34 38 42.3 10.81and Temperature 4,500 ' 8 20 29 38 53 75 90 110.2 15.10Out of Phase 4,200 2 19 46 69 88 120 -- - 152.5 4.391 H r./l Hr. 4,000 6 32 71 104 138 198 .. .. NF. -Cycle 6 3,500 13 62 144 [2461 - .. .. .. N-F. --
3,200 16 00 .551 -- - I--. N.F. -
Intermittent Load 5,000 -- 11 5 8 11 15 20 22-4 24.8 10.02and Temperature 4,500 1 11 17 22 30i 41 47 54.8 11.86In Phase 4,000 14 7 19 33 454 66 92 108 124.3 10.6I14 Hr./A Hr. 3,500 2 18 554 944 130 199 - -- N.F. --Cycle 7 3,200 6 36 99 163 227 --. .. . N.F. -
Intermittent Load 5,000 -- 6 9 114 15 19,- 22. 26.3 15.50and Temperature 4,500 I4 7 1442 21 27 37 4S 551 62.4 10.43Out of Phase 4,000 -- 5 21 39 54 80 122 150 174.5 9.64I1 Hr./ Hr. 3,500 3 29 74 120 166 251 -- - N.F. --Cycle 8 3,200 6 38 99 165 (229] . 1. . N.F. --
Estimated or Extrapolated Value.
WADC TR 53-336 Pt 4 27

105000 PsiFRACTURE 4500 PSI
WOM8RS FRACTURE
1113,05% 4000 PSI
13.05%FRACTURE
12010. a l SR S ___12.09%
80
cr80
FRFRACTUREV ~ 4. 2 4.6MR
6. 0 2441R
12S *%8
26.3R FRACTURE
14.0 1.4% 5860R0-400PS,FRACTUFRCTUE
4.34.5 ,R15.25% 58.00%
8.0 MR
0.0
2 .0
U)60
20 251 50 732005 15 2 0 225
TOTAL TIME -HOURS
FIG.21 CREEP OF 75S-T6 600*F STEADY LOAD INTERMITTENTTEMPERATURE I HR/IHR CYCLE 3
wm Tc 53-336pt 4 28

4500 fPSIFRACTURE
____ 80.2 MRS 4000 PSI____ -10.0c .9,24% FRACTURE
500 PSI 138.6 MRSz ~~FRACTURE .9
zi, 8.022.7 MRS~8.0 8.47%
2ama
20
0 25 50 75 100 125 11 0 175 200TOTAL TIME -HOURS
FIG. 22 CREEP OF 75S-T6 600' F INTERMITTENT LOAD ANDTEMPERATURE IN PHASE I HR/ IHR CYCLE 5
ý4500 PSIFRACTURE
14.0 110.2 MRS - ____ ___
5000 PSI12.0 FRACTURE - ____
42.38%R
10'0z
1 - 8.0
.j
-1 6.0 - 20 O
4.09 40oo PSI
2.0 __.04%
0.0 250 50i 754. H0A2SIO 17 0
TOTA TIM i8. HOUR
FI6G23 CREEP OF 75S-T6 600OF INTERMITTENT LOAD ANDTEMPERATURE OUT OF PHASE I HR/IHR CYCLE 6
WADO TR 53-336 Pt 4 29

14.0 -
I 4500 PSII FRACTURE
12.0 11.8 % 4000 PSI ___
5000 PSI FRACTUREF11A~TR 124.3 MRS
a MRS10.60 %
5s.0
0,11- .0 30 S
20 9
2.0.07
0 = ............ - _____ 33.5 MRSo 25 so 75 100 ~25 150 t5 200 225
TOTAL TIME -HOURS
F16.24 CREEP OF 75 S-T6 600*F INTERMITTENT LOAD AND
TEMPERATURE IN PHASE- IkJ6HR/IPIR. CYCLE?7
14.0 5000 PsIFRACTURE26.3 MRS16.50%
12.0 - -
4500 PSI- - FRACTURE ________4000 Psi
at 00 2.4I4RS FRACTURE10.43 % '1714-5 MRS
I-
-a
2.0
0c l25 50is10 i2 5 175 200 225TOTAL TIME- HOURS
FIG.25 CREEP OF 75S-T6 600-F INTERMITTENT LOAD ANDTEMPERATURE OUT OF PHASE I.,-HR/.' R CYCLE 8
Y oM 53-336.Pt 4 3

I III0 .0.2%. TOTAL STRAINI I0 0.5%
0.2% 0.5% T 72.O~ IA.0%
5.0- 2. 0%
'50
S 45 - C3UIEXTRAPOLATED VALUE
.- 5
'A
3.5 - - -
3.01
TOTAL TIME -HOURS 10
FIG. 26 CREEP OF 75 S - TOS 600- F STRESS/LOG TIME CURVESSTEADY LOAD AND TEMPERATURE
7.5TOTAL STRAIN$ 0.2% 0
3 10%0.50% 0
0.2% 0.5% 1.0% 1.5% 2.0% 5.0% F :.50%
5.0 0
5.0%FRACTURE 0
4.5_ ~J EXTRAPOLATED OR
3' 45 - -____ESTIMATED VALUE
0.
w 4.0
3.-
TOTAL TIME -HOURS
FIG. 27 CREEP 'OF 75 S- TO 600* F STRESS/LOG TIME CURVES
STEADY LOAD AND INTERMITTENT TEMPERATURE I H R/IHMR CYCLE 3
WADC TR 53-.336 Pt~ 4 31

5.5TOTAL STRAIN 0.2% 0
0.5% a
3.0% 1.5%5
lo0
(I)
I--3.5 __ _ _ __ _ _
00
TOTAL TIME -HOURS
FIG. 28 CREEP- OF 75 S- T6 6000F STRESS/LOG TIME CURVES
INTERMITTENT LOAD AND TEMPERATURE IN PHASE I HR/I HR CYCLE 5
TOTAL STRAIN_*O____0
0.%
1.0%
0.% 1% 20 30.%F15
U,,
3.5-
TOTAL T IM E-HOU RS
FIG.29 CREEP OF 75S-T6 6000 F. STRESS/LOG TIME CURVES
INTERMITTENT LOAD AND TEMPERATURE
OUT OF PHASE IHR/IHR CYCLE 6
WAD(; ¶R 53-336 Pt 4 3,2

TOTAL STRAINS 0.2% 00.5% 00.2 10% 2.0% 1.0% a0.2%1.0 1.% 30%150
\\5.0 2,0 %_ ,.5 v 0
3.0% x5.0% *
(n
40
a-
3.5
3.01.0 10 00 000
TOTAL TIME -HOURS
FIG. 30 CREEP OF 75 S-T6 600- F STRESS/LOG TIME CURVESINTERMITTENT LOAD AND TEMPERATURE IHRS/ - HR
IN PHASE CYCLE 7
-TOTAL STRAINS 0.2% 00.5 0
0%3.0% 1.0%
5.0% 1.0% 1.5% 2-0% 5.0%5.0 c•2.0% V
S3.0% X
S'FRACTURE 0'- 4.5 0 -
(n
£n 4.0w
U)
3 .5O -
.00
3.5 . 01 01 0
TOTAL TIME-HOURS
FIG.31 CREEP OF 75 S- T6 6000 F STRESS/LOG TIME CURVESINTERMITTENT LOAD AND TEMPERATUREOUT OF PHASE I!- HR/-. HR CYCLE 8
WADC TR 53-336 Pt 4

to that used for the test results at 300°F and 4500F, with the exception
that th4 use of creep strains has not been continued. At the highest
stress of 5,000 psi the strain on initial application of the load is
estimated to be 0.09%, while at the lowest stress of 3,200 psi the cor-
responding initial strain is 0.06%. Not only is the accuracy in the
estimation of these very small strains somewhat low, but even at the
lowest stress the time taken to reach 0.5% creep strain is not signifi-
cantly different from that taken to reach 0.5% total strain. It has
therefore been considered sufficient to report only the times to reach
specified total strains, data for 0.2% total strain being included to
provide an indication of the creep behavior of the material at small
deformations, even though these data are on occasions somewhat erratic.
Figs. 20-25 inclusive show the creep curves obtained under the
various test conditions employed, while the results are summarized as
the total elapsed times taken to reach specified total strains in Table V.
The values from this table have been plotted as stress/log time design
curves in Figs. 26-31 inclusive.
DISCUSSION OF TEST RESULTS
1. Methods of Analytical Approach
With the completion of the present test program, a fairly extensive
set of data at the three temperatures, 300°F, 4500 F, and 600*F, on 75S-T6
alloy was made available for detailed analysis. Four methods of analyz-
ing these data have been used, and on the basis of present results one
has been selectod as the most satisfactory. Method 1 was based on the
use of the total times ( • ) to reach various total strains as read
KADC TR 53-336 Pt 4 34

directly from plots of total otrain against total time. Method 2 was
similar, but various creep strains -ere used in place of total strain
values. The creep strains are determined by subtracting from the total
strains measured by the equipment all plastic and elastic strains occurr-
Ing on the initial application of the test loado For 758-T6 at the test
temperatures, these initial •gtrAins included very little, if any, plastic
deformation, even at the highest test load of 42,000 psi at 300*F when
the initial strain was 0o45%. In method 3 the experimental data were
plotted on stress versus log time coordinates as the total elapsed time
at the various test stresses to reach specified values Of the total strain
(0.5%, 1o0%, lo5%9 2°0% etc.) and rupture. Smooth average curves were
then drawn for each specified strain, and the times to reach these strains
atxaiy given stress can then be read from the curves. For the test
stresses, these times, (% ) may be considered as the most probable times
required to reach the specified strains. In this way the effects of the
scatter normally encountered in creep testing were minimized without an
excessive burden of testing, and by replotting the t5 values at various
strains. for each test stress on strain/time coordinates a typical creep
curve for each test stress may be obtained. Creep curves at any inter-
mediate stress can obviously also be arrived at by interpolation, while
limited extrapolation can also be carried out in maiy cases if due judg-
ment is exercised0 Method 4 involves a similar approach, using creep
strains instead of total strains.
Two different view points have been used in the analyses of the data.
In the first, comparisons of the experimental results under the various
cyclic conditions have been made on a basis of net time under load at
the test temperature. in order to assess the effect Of cyclic conditions
WADC TR 53-336 Pt 4 35

on the rate at which creep takes place under the influence of the test
stresses and temperatures.
A second type of analysis has been carried out using the correlation
and prediction methods, previously discussed, 4,5,6) based on the proposed
functional equation
where • total strain
(2=time
stress
F = strain function
= stress function.
Whence
tz.tT (5)
if the function is independent of strain, where
= time at some standard stress to reach a total strain E,
time at some other stress, O- ,to reach a total strain F,
- time at some standard stress to reach a total strain E.
t time at the other stress, T- to reach a total strainF
In the following discussion, the constant 1 as calculated using the ex-
perimentally determined times, ' , is denoted as , while that cal-
culated using the most probable times, V , obtained from the appropriatestress/log time curves is denoted by K . Correspondingly, the predicted
times, calculated by using tfor the chosen standard test and the appro-
priate K. in accordance with equation (5), will be designated "calc. h,
while the calculated times, using and the appropriate K3 will be
WADC TR 53-336 Pt 4 36
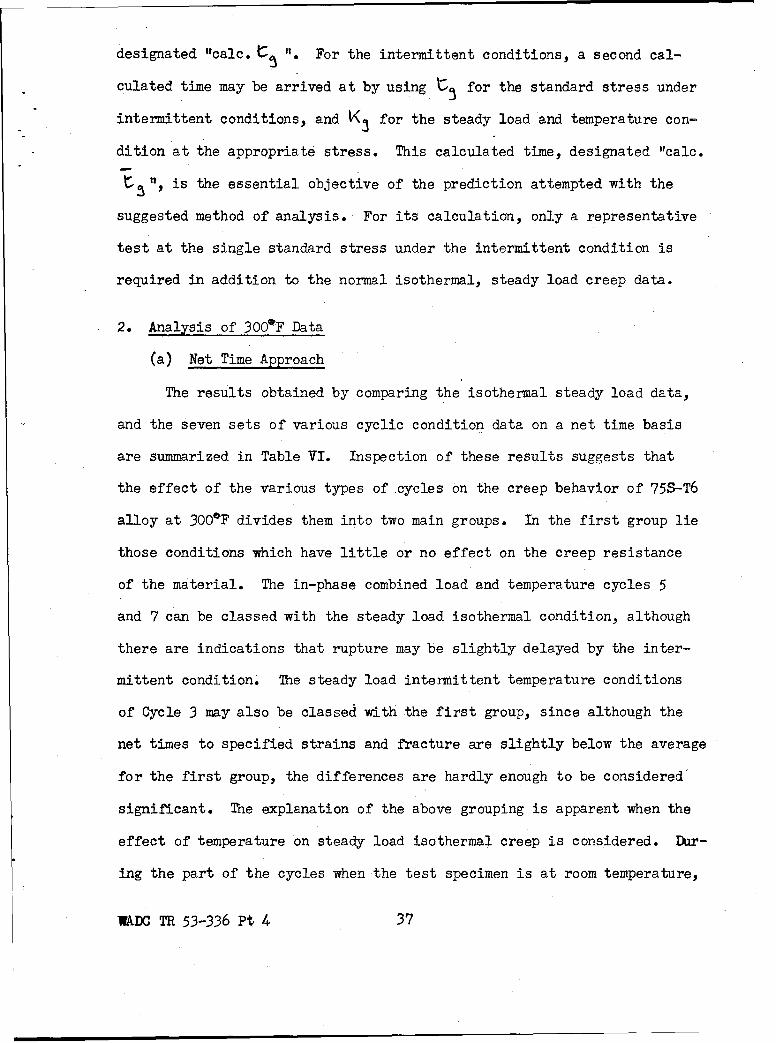
designated Itcalc. It " For the intermittent conditions, a second cal-
culated time may be arrived at by using • for the standard stress under
intermittent conditions, and K for the steady load and temperature con-
dition at the appropriate stress. This calculated time, designated "1calc.
' is the essential objective of the prediction attempted with the
suggested method of analysis. For its calculation, only a representative
test at the single standard stress under the intermittent condition is
required in addition to the normal isothermal, steady load creep data.
2. Analysis of 300#F Data
(a) Net Time Approach
The results obtained by comparing the isothermal- steady load data,
and the seven sets of various cyclic condition data on a net time basis
are summarized in Table VI. Inspection of these results suggests that
the effect of the various types of cycles on the creep behavior of 75S-T6
alloy at 300'F divides them into two main groups. In the first group lie
those conditions which have little or no effect on the creep resistance
of the material. The in-phase combined load and temperature cycles 5
and 7 can be classed with the steady load isothermal condition, although
there are indications that rupture may be slightly delayed by the inter-
mittent condition. The steady load intermittent temperature conditions
of Cycle 3 may also be classed with the first group, since although the
net times to specified strains and fracture are slightly below the average
for the first group, the differences are hardly enough to be considered
significant. The explanation of the above grouping is apparent when the
effect of temperature on steady load isothermal creep is considered. Dur-
ing the part of the cycles when the test specimen is at room temperature,
ADC TR 53-336 Pt 4 37

TABLE VI
Comparison of Average Net Times (Net • ) to
Reach Specified Strains for Various Intermittent Conditions
Creep of 75S-T6 at 300eF
Total SteadyStress Strain Load an Cycle ycle Cycle Cycle ycle ycle Cyclepsi % Temp. 1 2 3 5 6 7 8
42,000 0.5 -- -- -- -- -- -- -
1.0 8.3 8T- 16 8 11 6 15 81.5 14 13 21 15 18 9 23 122.0 18 15 24 194_ 21-i 10 30 14
Fracture 204 18 27 27 24 12 36 16
38,500 0.5 < 1 l [A]1.0 25 23 32 274 37 20 3A 241.5 42 394- 42 39 50 26 45 332.0 51 33 46 44 55 29 52 37
Fracture 58 36A 51 47 58i 33 61 40
35.,500 0.5 [2] 2 4 5 3 4 [6]1.0 52 45- 5% 56Q2 60 40 67 491.5 75 55 69 74 78 46 78 602.0 90 60 76 81 85 50 86 65
Fracture 97 64i 821 85 92 51 94 70
33,500 0.5 [1O] 10 10 144 10 9 [13J [1O]1.0 84 65 81 85 85 60 95 751.5 110 81 97 108 nO [65] 112 852.0 122 88 105 113 120 - 120 90
Fracture 130 91 l124j [115] [122] -- 127 91
31,500 0.5 [501 32 21 35 27 17 [301 --1.0 135 106 1121 128 [110] [84] 126 951.5 155 120 131 [148] [145] -- 161 1152.0 165 126 141 [1551 160o - 165 120
Fracture 170 130 150 .. .. .. .. 124
L ] = Estimated Value
*Series I Data
WADC TR 53-336 Pt 4 38

or considerably below 300*Fq creep will be negligible for cycle 3, and
cannot occur in cycles 5 and 7 when the load is also removed. Farther,
except for the brief period near test temperature during the heating
portion of each cycle9 the specimen will not be affected by such temper-
ature dependent processes as recovery, relaxation, or agikgo
Under the out of phase combined intermittent conditions of cycles
6 and 89 and the intermittent stress steady temperature conditions of
cycles 1 and 2s the material creeps appreciably faster than under the
steady load isothermal condition as Judged on a net time basis, with the
effect being least in the case of cycle 2o This can be attributed pri-
marily to the recovery and overaging occurring at the elevated temperature
in the absence of load0 However, this does not appear to be a complete
explanation., since on this basis the recovery 9nd 'overaging effect should
be greatest for the case of cycle 1 where the specimen is at temperature
in the absence of load for half of the total cycle, and approximately the
same for the other three cases, where the specimen is at temperature in
the absence of load for j hr. in each 2 hr. cycle. In fact cycle 6 appears
to be most deleterious, and cycle 2 causes only a slight acceleration of
creep. It should be mentioned that in the case of both cycles 1 and 2,
creep recovery was observed during the off load pqrtion of the cycle.
Although such observations were not possible in the other cases with the
equip*ent used, since thermal effects in the extensometer during the over-
lapping intermittent temperature part of the combined intermittent cycle
obseed the true changes in specimen deformation, it is nevertheless
reasonable to assume that creep recovery also took place.
If .during the elevated temperature loaded part of each cycle the
creep rate decreases with time, it may happen that in 1i hrs. of these
WM TR 53-336 Pt 4 39

conditions (cycle 2) the specimen creeps only a little more than in 1 hour
(cycle 1). When the specimen is at temperature in the absence of load,
the amount of creep recovery in iz hr. (cycle 2) may not be much less than
in 1 hr. (cycle 1). Thus the net deformation during one complete 2 hour
cycle of cycle 2 may be but little greater than during one complete 2 hour
cycle of cycle 1. On the other hand, the net time taken for this deforma-
tion is 1i2 hours in the first case (cycle 2), but only 1 hour in the
second case (cycle 1). Consequently, if this type of behavior continues
in a greater or lesser degree throughout the test, in order to reach a
specified strain the net time (at temperature under load) would be greater
in the case of cycle 2, or, in general, would be greater the greater the
proportion of each cycle which the test specimen spends under load.
Fig. 32 shows diagrammatically a hypothetical case under the various cyclic
conditions used in second group of cycles, namely those which produce an
acceleration of creep and rupture, and it will be seen that while no numer-
ical significance can be attached to the values, the arrangement of the
various cycles in order of their relative effect on creep behavior agrees
with the experimental observations. A detailed, accurate analysis of the
creep behavior during a cycle at various places along the creep curve
would obviously be necessary before this hypothesis could be considered
further.
(b) Analytical Correlation and Prediction
Although a detailed presentation of the results of applying Eqs. (3)
and (4) to the data obtained at 300'F is not possible within the scope of
this report, a typical example is given in Table VII for the case of
cycle 3 conditions. It will be seen that the predicted values of the
time to reach given total strains, agree reasonably well with the values
WADC TR 53-336 Pt 4 40

STEADY LOAD, STEADY TEMP
NET TIME.x 2 HRS.DEFORMATION x X
-_ E NET *INERAGE"STRAIN RATE £ 0.5 X/HR.
CYCLE I
NET TIME a I HR.
-. DEFORMATION x O. 72 X
NET AVERAGECREEP STRAIN RATE =072 X/HR.,/ CREEPRECOVERY
CYCLE, 2------ - . .. NET" TIME . ,a I H S.DEFORMATION a 0.74X
CREEP NET AVERAGEREEP -RECOVERY STRAIN RATE • 0.49X/HR.
CYCLE 6
NET TIME x HR.
DEFORMATION - 0.54XNLOAD OFF NET AVERAGE
CREEP TEMpP LOW TEMP. LOW,, CREEP STRAIN RATE a 1.08 X/HR.
NO CREEP NO CREEP RECOVERYRRECOVERY
CYCLE 8
NET TIME x I HR.
DEFORMATION s 0.77X
LOAD T 1 CREEP NET AVERAGERECOVERY STRAIN RATE • O.77X/HR.SNO CREEP
HOURS
FIG. 32 HYPOTHETICAL DEFORMATION DURING VARIOUS TYPES OF CYCLES.
WADC TR 53-336 Pt 4 41
TABLE VII
Analysis of Creep Data for 75S-T6 at 300*F.Cycle 3
Table VI~a. Total Strain Basis
Stress Total Times to Total Strains of Average
Stress_ (___ ___ Graphical)psi Variable 0.5 1.0 1.5 2.0 Fracture "'K" Value
42,000 t 0.1 16.0 30.0 39. 54.41ý 0.0 3.5 2.6 2.3 1.7 2.6
calb. t 0.4 21.5 30.5 34.0 36.0- 16.0 30.0 39.0 54.0
-- 3.4 2.6 2.3 1.7 2.6calc. .S 0.4 21.0 30.0 34.0 36.0calc. t 0.3 19.0 27.0 30.0 32.5
38,500 k 1.0 56.0 79.9 88.5 94.0 1.0(Standard) 1:.0 55.0 78.0 88.0 94.0 1.0
35,500 • 9.0 113.0 145.0 160.0 168.30.11 0.50 0.55 0.55 0.56 0.52
calc. V 2.0 108.0 152.0 170.0 181.010.0 113.0 148.0 162.0 170.00.10 0.49 0.53 0.54 0.55 0.52
calc. t5 2.0 106.0 150.0 169.0 181.0calc.. 2.0 98.0 134.0 157.0 168.0
33,500 29.0 176.0 219.0 230.0 -K, 0.035 0.32 0.36 0.39 -- 0.34
calc. 1 3.0 165.0 232.0 260.0 276.029.0 170.0 215.0 225.0 230.00.035 0.32 0.36 0.39 0.41 0.36
calc. t5 3.0 153.0 217.0 244.0 261.0calc. b 2.5 138.0 195.0 220.0 235.0
31,500 70.0 -- --
S0.014 - - -- -- 0.22calc. t 4.5 256.0 361.0 404.0 430.0
70.0 255.0 295.0 310.0 --0.014 0.22 0.26 0.28 -- 0.26
calc. t 4.0 211.0 300.0 338.0 361.0calc. 3.5 183.0 260.0 293.0 313.0
WADC TR 53-336 Pt 4 42
Table VImb. Creep Strain Basis
AverageStress Total Times to Creep Strain of: Graphical)psi Variable 0.1 0.2 0.3 0.5 1.0 2.0 "IK" Value
42,000 1.0 4.0 8.0 15.5 29.0 44.52.0 2.5 3.1 3.2 2.6 2.1 2.6
caic. 1.0 4.0 9.0 19.0 29.0 36.00.9 4.0 8.0 15.5 29.0 44.0
5 2.7 3.0 3.0 3.0 2.6 2.1 2.7calc. _ 0.9 4.0 9.0 17.5 28.0 34.5calc. 0.8 4.0 8.5 17.0 27.0 33.0
38,500 tpt.r 2.0 10.0 25.0 49.0 76.0 93.5 1.0(Standard) 2.3 11.0 24.0 47.0 75.0 93.0 1.0
35,500 6.0 30.0 60.0 100.0 145.0 168.00.33 0.33 0.42 0.49 0.52 0.56 0.44
calc. ,, 4.5 23.0 57.0 111.0 173.0 214.0t 5.5 30.0 58.0 96.0 140.0 168.0K 0.43 0.37 0.41 0.49 0.54 0.55 0.46
calc. , 5.0 24.0 52.0 102.0 163.0 202.0calc. t5 5.0 23.0 50.0 98.0 156.0 194.0
33,500 t.ý 8.0 55.0 98.0 144.0 208.0 --•<• 0.25 0.18 0.26 0.34 0.37 -- 0.25
calc. LX• 8.0 40.0 100.0 196.0 304.0 374.0I 9.5 55.0 100.0 145.0 210.0 250.0V5 0.24 0.20 0.24 0.32 0.36 0.37 0.29
calc. _ 8.0 38.0 83.0 162.0 259.0 321.0calc. k$ 7.0 34.5 75.0 147.0 235.0 291.0
31,500 20.0 103.0 180.0 --.. .K ear- 0.10 0.10 0.14 - - -- 0.12
calc. tý,_ 19.0 92.0 208.0 408.0 633.0 779.0I-j 17.0 100.0 180.0 218.0 305.0 375.0Ks 0.14 0.11 0.13 0.22 0.25 0.25 0.17
calc._ I13.5 65.0 141.0 277.0 441.0 547.0calc. t3 11.0 52.0 114.0 224.0 357.0 443.0
WADC TR 53-336 Pt 4 43

Table VII (Cont Id.)
Estimated or extrapolated value.:e, - Actual experimental times, from strain/time creep curves.
• • value based on t,, for standard stress."" for other stress o
aloo t - Calculated tines for equation (2), using average V<9. forappropriate stress and te,, for standard stress (38,500 psi).
t3 - Best average time, determined from stress/log time plotsusing tk. values at specified strains.
- OP value based on I V CZ for standard stressa \3o3 a a im for other stresscalco Calculated times from equation (2) using average tr2 for
appropriate stress and for standard stress (38,p500 psi).Cale. Calculated times from equation (2) using average W for
appropriate -stress frcm steady load steady temperatue' tests(see TableV2>, below) and '9 for standard stress (38,500 psi)under intermittent cycle 3 conditions.
Table VIlco Average 4Z Values for Steady Load Steady Temperature
Tests, (Used in Calculation of Cale. Above)
Kverage W3 for Stress lverage K5 foiTotal' ri.... .. psi Creep Strains
2.9 429000 2.81.o0 38,9500 1.0
(Standard)0.56 35,500 0.480.4a- 33.,500 0.32o03o 31s,500 0o21
SM TR53-336 Pt4 4

determined from the test data, for total strains of 1% or greater. The
values, cal o , predicted from the appropriate average values of K
for the steady load isothermal data, and the times VS to various total
for a representative test at the standard stress under intermittent con-
ditions, also agree well over the range 1% to the fracture, with the
representative values of at the other test stresses under intermittent
conditions. Data predicted by both methods are plotted as strain versus
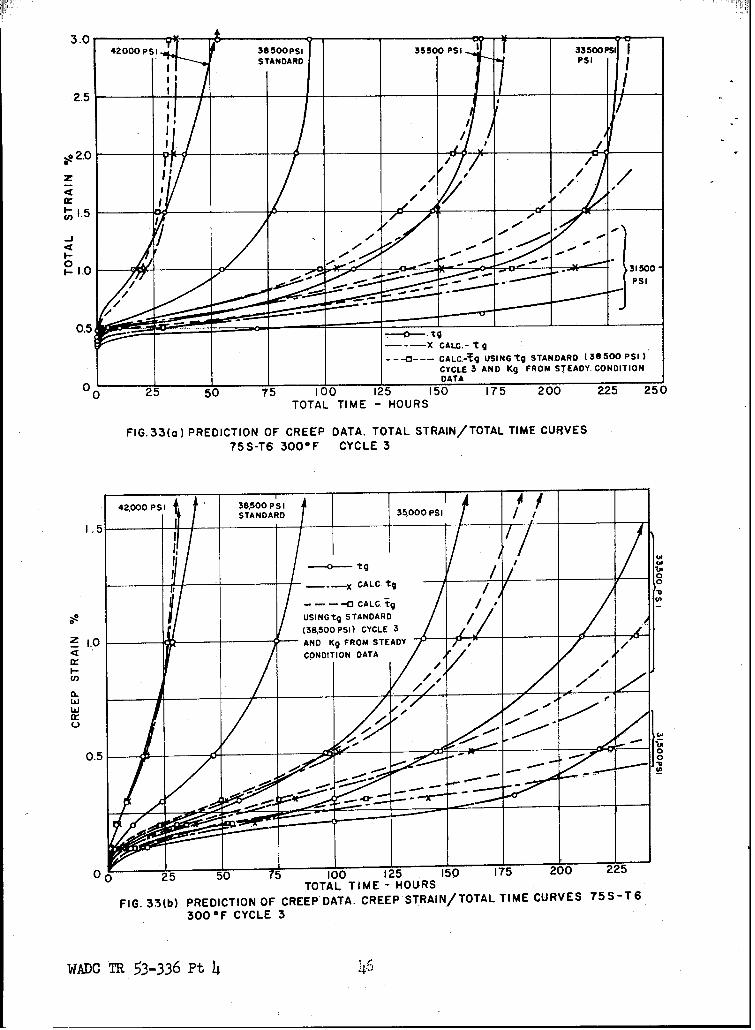
time-curves in Fig. 33(a). By using a standard stress of 38,500 psi, it
may be seen that the predicted values calc. I or calc.t , become
less close to test data as the stress level of the predicted results be-
comes more removed from the chosen standard stress. In the case given
as an example, some improvement can be made by using a standard stress
closer to the stress for which data ase to be predicted.
Further examination of Table VII and Fig. 33(b) will show that if
the same analytical processes are applied to the times required to reach
specified creep strains, as opposed to total strains, improved agreement
is reached at the lower strain values, covering an equivalent total strain
range of 0.5-1.0%. At the higher values of strain, however, the use of
creep strain data causes a surprisingly greater deviation between pre-
dicted and actual values than is the case when total strain data m'e used.
Further, the deviation increases more rapidly in the case of creep strain
data, as the stress departs from the chosen standard stress. If agreement
is sought over the largest possible range of creep. therefore, the total
strain basis for analysis is to be preferred.
This same conclusion can be derived from a study of Tables VIII and
Mi4n which both detailed and average K values are shown for the var-
ious cyclic conditions. Table VIII demonstrates that the condition involved
WADC TR 53-336 Pt 4 45
3.0P ~ 35 3550PS 33500P5
.2.5SANOsPI
o2.0
05
-- 0- -- CALC.-'fg USING tg STANDARD (36 500 PSI)
CYCLE 3 AND Kg FROM STEADY. CONDITION
00 25 50 75 100 125 150 175 200 225 250TOTAL TIME - HOURS
FIG. 33(o) PREDICTION OF CREEP DATA. TOTAL STRAIN/TOTAL TIME C.URVES75S-T6 300OF CYCLE 3
42,000 PSI 138,500 PISI10 sSTANDARD 3AOOO~
1.5 7I wg
0
--- x CALC. tq /0--0 CALC. tg U
USIN~tg STANDARD /(38,500P51) CYCLE 3 .
S1.0 AND Kg FROM STEAhDY
1- I CONDITION DATA
w
C-)
0.5 I
00I 25 50 75 100 125 150 175 200 22TOTAL TIME - HOLURS
FIG. 33(b) PREDICTION OF CREEP DATA. CREEP STRAIN/TOTAL TIME CURVES 75S-T6-300*F CYCLE 3
WADO; TR5~3-336 Pt 4 4
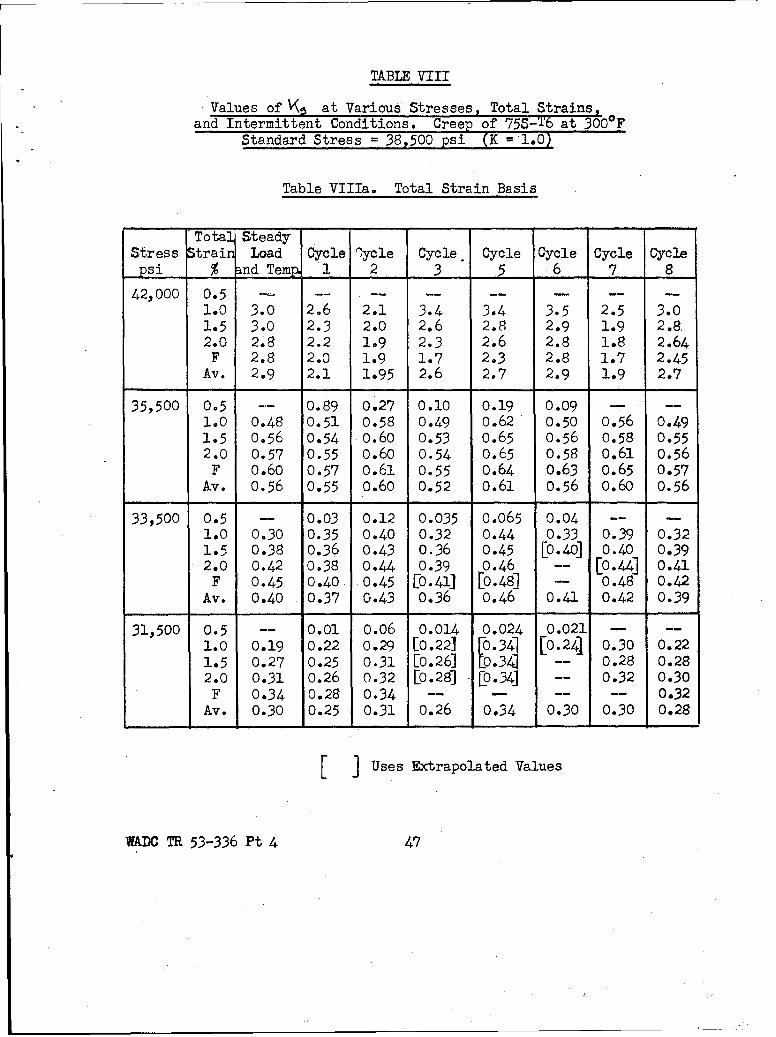
TABLE VIII
Values of Y\5 at Various Stresses, Total Strains,and Intermittent Conditions. Creep of 75S-T6 at 300OF
Standard Stress = 38,500 psi (K = 1.0)
Table VIIIa. Total Strain Basis
Total SteadyStress Strain Load Cycle Cycle Cycle Cycle Cycle Cycle Cyclepsi % and Tem 1 2 3 5 6 7 8
42,000 0.5 -. --..-....
1.0 3.0 2.6 2.1 3.4 3.4 3.5 2.5 3.01.5 3.0 2.3 2.0 2.6 2.8 2.9 1.9 2.82.0 2.8 2.2 1.9 2.3 2.6 2.8 1.8 2.64F 2.8 2.0 1.9 1.7 2.3 2.8 1.7 2.45
Av. 2.9 2.1 1.95 2.6 2.7 2.9 1.9 2.7
35,500 0.5 -- 0.89 0.27 0.10 0.19 0.09 - --
1.0 0.48 0.51 0.58 0.49 0.62 0.50 0.56 0.491.5 0.56 0.54 0.60 0.53 0.65 0.56 0.58 0.552.0 0.57 0.55 0.60 0.54 0.65 0.58 0.61 0.56
F 0.60 0.57 0.61 0.55 0.64 0.63 0.65 0.57Av. 0.56 0.55 0.60 0.52 0.61 0.56 0.60 0.56
33,500 0.5 - 0.03 0.12 0.035 0.065 0.04 -- -
1.0 0.30 0.35 0.40 0.32 0.44 0.33 0.39 0.321.5 0.38 0.36 0.43 0.36 0.45 [0.40] 0.40 0.392.0 0.42 0.38 0.44 0.39 0.46 -- [0.44] 0.41
F 0.45 0.40 0.45 [0.41] [0.48] - 0.48 0.42Av. 0.40 0.37 0.43 0.36 0.46 0.41 0.42 0.39
31,500 0.5 -- 0.01 0.06 0.014 0.024 0.021 - --
1.0 0.19 0.22 0.29 [0.221 [0.341 [0.24] 0.30 0.221.5 0.27 0.25 0.31 [0.26] [0.341 -- 0.28 0.282.0 0.31 0.26 0.32 [0.28] L0.34] -- 0.32 0.30F 0.34 0.28 0.34 - - -- 0.32
Av. 0.30 0.25 0.31 0.26 0.34 0.30 0.30 0.28
[ 3 Uses Extrapolated Values
WADC TR 53-336 Pt 4 47
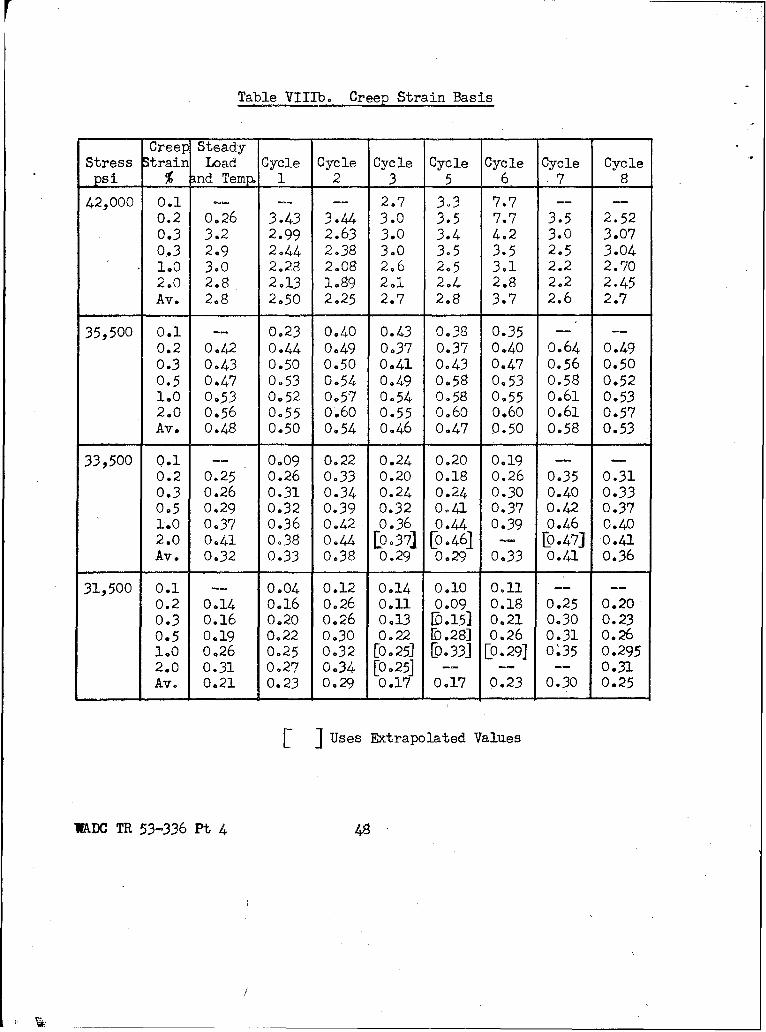
Table VIIIb. Creep Strain Basis
Creep SteadyStress Strain Load Cycle Cycle Cycle Cycle Cycle Cycle Cyclepsi % 3nd Temp 1 2 3 5 6 7 8
42,000 0.1 ...-- 2.7 3.3 7.7 -- --
0.2 0.26 3.43 3.44 3.0 3.5 7.7 3.5 2.520.3 3.2 2.99 2.63 3.0 3.4 4.2 3.0 3.070.3 2.9 2.44 2.38 3.0 3°5 3.5 2.5 3.041.0 3.0 2.28 2.08 2.6 2.5 3.1 2.2 2.702.0 2.8 2.13 1.89 2.1 2.4 2.8 2.2 2.45Av. 2.8 2.50 2,25 2.7 2.8 3.7 2.6 2.7
35,500 0.1 -- 0.23 0.40 0.43 0.38 0.35 - --
0.2 0.42 0.44 0.49 0.37 0.37 0.40 o.64 0.490.3 0.43 0.50 0.50 0.41 0.43 0.47 0.56 0.500.5 0.47 0.53 0.54 0.49 0.58 0.53 0.58 0.521.0 0.53 0.52 0.57 0.54 0.58 0.55 o.61 0.532.0 0.56 0.55 0.60 0.55 0.60 0.60 0.61 0.57Av. 0.48 0.50 0.54 0.46 0.47 0.50 0.58 0.53
33,500 0.1 -- 0.09 0.22 0.24 0.20 0.19 -- -0.2 0.25 0.26 0.33 0.20 0.18 0.26 0.35 0.310.3 0.26 0.31 0.34 0.24 0.24 0.30 0.40 0.330.5 0.29 0.32 0.39 0.32 0.!1 0.37 0.42 0.371.0 0.37 0.36 0.42 0.36 0.44 0.39 0.46 0.402.0 0.41 0.38 0.44 Loo371 [0.461 -- [0.47J 0.41Av. 0.32 0.33 0.38 0.29 0.29 0.33 0.41 0.36
31,500 0.1 -- 0.04 0.12 0.14 0.10 0.11 --..
0.2 0.14 0.16 0.26 o.11 0.09 0.18 0.25 0.200.3 0.16 0.20 0.26 0.13 .O15] 0.21 0.30 0.230.5 0.19 0,22 0.30 0.22 [0.28] 0.26 0.31 0.261.0 0.26 0.25 0.32 [0.25] [0.33] O.29] 0.35 0.2952.0 0.31 0.27 0.34 [0.25] -- -- -- 0.31Av. 0.21 0.23 0.29 0.17 0.17 0.23 0.30 0.25
[ Uses Extrapolated Values
WADC TR 53--336 Pt 4 48

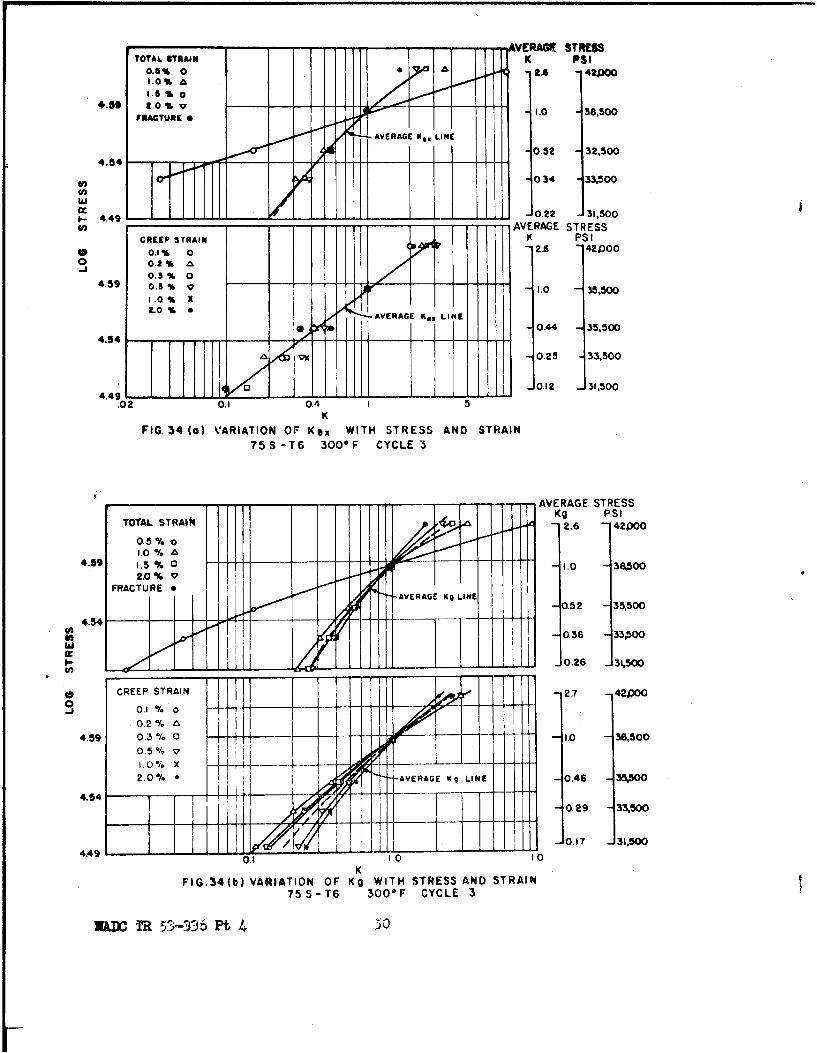
in the use of Bq. (2) for prediction purposes, namely that the value of
the factor K is independent of strain, is not stectly fulfilled, the
"values of j varying systematically with strain. and the spread of the
values increasing as the stress departs from the chosen standard where
- 1,00 Fig° 34 shows the effect of both stress and strain on the V
factor for the case of cycle 3 conditions0 This might well be expected
at 300?F where overaging will continue throughout the duration of the
creep test9 thus causing a continued change in the material undergoing
creep as time increases during the test. It is likely that this would
cause a change of K. with time., which is synonymous with a change of
with straino
Table IX shows the improvement effected by the averaging technique
used in getting representative values. It can also be seen from this
table that9 in spite of the variation of K with strain., as noted above,
the average -lues do not vary excessively with the cyclic condition. An
indicatd in an earlier section, prediction of creep under intermittent
conditions can therefore usefully be carried out with a minimm of test-
ing under intermittent conditionsp particularly if the stress range for
which predicted dataare required is not too largeg
3o A�hi s of 450'* Data
(a) Net Ti-e Approach
(kil one cycle (cycle 3) was used in the tests conducted in the
present program, since studies of the effect of the other intermittent
conditions had already been madeo As was found during the presently
reported series of tests at 300*F, the test results obtained in the cur-
rent inv4stigation under cycle 3 conditions were not entirely compatible
UMIR5J,3j6 It 4
TOTAL STRAeN K PSI0.6% 0 3 2.6 42,00I.O% A•0. %
4.59 2.0 % . 1.0 38,500PIATURtE
AVERAE LEAVERAGE
CREElP STRAIN K PSIS0.0% 0 -2.6 42500
o 0.2% ,A"45 0.5%
, -- 0.25 -33,500
1 4.49 •,0.22 - 31,500
.02 0.1 0.4 i 5K
FIG. 34 (a) VARIATION OF Kg1 WITH STRESS AND STRAIN75S-T6 300*F CYCLE
AVERAGE STRESS
A Kg PSI
CR E $ RI - 2 .6 42JD oo
1. 038% &4.9 0.5 % v ;. 3 .0
1.0 % ,
.- 0.4 2 35,500
4.540.36 - 33,500
14.4
I- T 63 FC0E(I)
TOCTAL STRAIN 2.7 42P00
0.2%
4.-0.% 11106 - 1.0 38,500
F A 0 ,0 •AVERA GE K 9 LINE -0.46 - 35 ,500
4 .5 4 -- -3
S• -J LT .33,500
4.59 0.1 .0 03,500
KFIG.34(b) VARIATION OF Kg WITH STRESS AND STRAIN
75 S- T6 300 F CYCLE 3
xAI-05.29- 3-5Pt,0

TABLE IX
Average Values of Yex and Kc for Various
Stresses and Intermittent Conditions
Creep of 75S-T6 at 300°F
[% DeviationCycle ycle ycle Cycle Cycle Cycle Cycle from SIST
Stress SLST 1 2 3 15 16 7 8 -
Total Strain Values
f 42,000 3.0 2.2 2.0 2.6 2.8 3.1 1.6 2.6 3 47It 2.9 2.1 1.95 2.6 2.7 2.9 1.9 2.7 -- 34
K_ 38,500 1.0 1.0 1.0 1.0 1.0 1.0 1.0 1.0 --
1.0 1.0 1.0 1.0 1.0 1.0 1.0 1.0 -- -
Ke( 35,500 0.56 0.53 0.58 0.52 0.60 0.60 0.47 0.55 7 1K4 " 0.56 0.55 0.60 0.52 0.61 0.56 0.60 0.56 9 7KZ 33,500 0.40 0.38 0.42 0.34 0.46 0.41 0.34 0.38 15 15A It 0.40 0.37 0.43 0.36 0.46 0.41 0.42 0.39 I5 10'K$ 31,500 0.31 0.25 0.31 0.22 0.36 0.32 0.26 0.27 16 29KI H. 0.30 0.25 0.31 0.26 0.34 0.30 0.30 0.28 13 13
Creep Strain Values
< 2,000 9 2.55 2.20 6 3.4 4.0 2, 2.9 38 24\ " 2.8 2.50 2.25 2.7 2.8 3.7 2.6 2.7 32 14
K, 38,500 1.0 1.0 1.0 1.0 1.0 1.0 1.0 1.0 -- -" 1.0 1.0 1.0 1.0 1.0 1.0 1.0 1.0 - -
, 35,500 0.50 0.48 0.56 0.44 707-2 0.4 0.51 0.55 24 14""0.48 0.50 0.54 0.46 0.47 0.50 0.58 0.53 21 4
K,, 33,500 0.33 0.32 0.40 0.25 0.49 0.26 0"36 0.37 48 24It 0.32 0.33 0.38 0.29 0.29 0.33 0.41 0.36 29 9
Ke 31,500 0 0 0.30 0.12 0.40 0.20 0.28 0.26 95 43( 0.21 0.23 0.29 0.17 0.17 0.23 0.30 0.25 43 19
SLST = Steady Load, Steady Temperature
WADC TR 53-336 Pt 4 51
with those previously described in the above references. The present
series showed the material to be considerably weaker at the lower stresses
under intermittent temperature cycle 3 conditions when compared with the
early steady load isothermal data although agreement was good at the higher
stresses. This conclusion is unlikely to be correct, and is contradictory
to the previous results and to the results obtained in the extensive tests
of the present series at 3000 F. Further, at 3000 F, shorter times were
required to reach specified strains or fracture in the present steady load
isothermal tests than in those conducted earlier. It was considered that
the differences might perhaps be explained by differences in testing tech-
niques, but check tests mentioned earlier showed that the change in the
initial heating cycle of the test piece before the application of the
first load was not responsible. It was also considered possible that the
long storage of the material (3j years) might have resulted in slight
chhnges in its properties. Check tensile tests agreed closely with those
carried out when the material was first delivered, but it was still poss-
ible that although no change in tensile properties could be detected, the
creep properties may have been affected particularly at the slower creep
rates since it is well known that the creep properties of many materials
are very sensitive to minute changes in structure. A well known example
is the effect of different deoxidising agents on the creep rate of killed
open hearth steels.(ll) When, however, the repeated Series II tests at
300OF under cycle 7 conditions, and the 600OF steady load isothermal tests
were done on the same sheet of specimen stock and both these sets of re-
sults indicated a creep strength greater than that found by other tests
in the presently reported work, and more compatible with earlier reported
data( I it seemed most probable that the differences discussed arise
WADC TR 53-336 Pt 4 52
arise from variation between the sheets of specimen stock material.
(b) Analytical Correlation and Prediction
Application of the methods of correlation and prediction already
described to the present cycle 3 test data at 450OF gave good results.
The K factor appears to be much more independent of strain over the
range from 0.5% total strain to frpcture, than was the case at 3000F, and
excellent agreement between experimental and predicted curves was obtained.
Table X and Figs. 35 and 36 illustrate these points. The greater inde-
pendence of the K values at 450OF than at 3000F with respect to strain
agrees with the suggnested explanation offered for the 300%F case. At
450°F any overaging at. test temperature is probably completed early in
the test, and subsequent changes in the material due to this cause are
minor. No changes in the K values as the test continues are therefore
to be expected due to this cause.
It will be seen from Fig. 35 and Table X that at 4500 F, as at 3000 7F,
the correlation procedure adopted is much more successful when total strains
are used than when the analysis is conducted on the basis of creep strain.
4. Analysis of 600OF Data
(a) Net Time Approach
In agreement with the comparisons discussed at 450OF between the
data of the present test series, and previously reported data,(416) cer-
tain differences between the two sets of results appear to exist. As was
the case at 450"F, agreement between the two groups of data is good for
the higher stress shorter time tests, but in the present series the mat-
erial now appears weaker in the longer time lower stress tests than pre-
viously reported results indicated. For this reason a new series of
WADC TR 53-336 Pt 4 53

TABLE X
K( Values for Various Stresses, Strains, and Intermittent Conditions.Creep of 75S-T6. 450-F. Cycle 3.
Table Xa. Total Strain Basis
Stress for Total Strains of: Average
psi 0.5% 1.0% 1.55% 2.0% 3.0% 5.0 racture Y
12,000 5.1 4.6 4.7 4.6 4.6 4.6 4.6 4.610,000 1.38 1.33 1.33 1.34 132 1.33 1.349,500 Standard Stress. All = 1.09,000 0.75 0.75 0.74 0.75 0.74 0.751 0.73 0.768,600 0.59 0.60 0.59 0.60 0.59 0.59 0.58 0.608,200 0.46 0.48 0.48 0.48 0.48 0.49 0.49 0.47
Table Xb. Creep Strain Basis
1 AverageStress ( for Creep Strains of: Graphical)psi 0.1% 0.2% 0.3% 0.5% 1.0% 2.0% 5.0% ye
12,000 -- 5.3 5.1 4.6 4.4 4 :4 4. 4 4.710,000 - 1.19 1.22 1.18 1.20 1.2 1.25 1.309,500 Standard Stress. All = 1.09,000 -- 0.84 0.85 0.81 0.78 0.75 0.76 0.788,600 -- 0.76 0.72 0.67 0.61 0.58 0.55 0.648,200 -- 0.70 0.60 0.52 0.43 0.38 -- 0.52
WADC TR 53-336 Pt 4 54
AVERAGE STRESSKg PSI
40-4.6 12,000
TCTAL STRAIN0.5% 0o ,% &
40 o.S % 0"20% 13.0% X /-1.34 -5.0%
FRACTURE * 1.0 95003.96
-- 0.76. 9000
/ • -10.60 8600
-f 4.7 -12,000
4.060 CREEP STRAIN
o0.I % o0.2 %0.3% 0
4.0t 0.5%1.0% x -1.30 10000
2.0%05.0% • SlI 1.0 - 9500
II.9H 0.78 -9000
IIIII.-0.64 j 8600
3.91 .. X...,,JJ...L I_- ox 0.52 82000.1 1.0 10Kg
FIG.35 VARIATION. OF Kg WITH STRESS AND STRAIN75S-T6 450 F CYCLE 3
7.0 19500 Psi
12 000 PSiI 10000 PSI STANDARD 9000 PSI 6600 PSI 8200PSI
- ACTUAL I5.0 -.- CALC.tg-PREOICTED I
4.0
-J.0 mz0
2.0
O0 25 50 75 loo 125 150 175 200 225 250
TOTAL TIME -HOURS
FIG. 36 PREDICTION OF C•REEP DATA TOTAL STRAIN/ TOTAL TIME CURVES
75 S-T6 450 0F. CYCLE 3
wA= TR 53-336* t 4 55
Z4.C .

steady load isothermal tests were conducted to provide a basis for compar-
ing the tests of the presently reported series by the net time nethod.
As previously described the results obtained were compatible with earlier
reported data(A). but indicated somewhat greater strength, particularly
at the lower stresses than presently reported intermittent data. These
differences are considered to arise from slight differences between the
various sheets of specimen stock°
A comparison is made in Table XI., where it may be seen that in gen-
eral the various cyclic conditions appear to have no systematic effect
on the creep behavior of 75S-T6 alloy at 6007F. A possible exception to
this generalization exists for the steady load, intermittent heating con-
ditions of cycle 3, particularly at the lower stresses. The increased
creep apparently resulting from this cause may most probably be ascribed
to small amounts of deformation occurring during the heating portion of
bach cycle, where the temperature begins to approach 60 0* 7 , and the test
load is operative. The same conditions exist to a more restricted degree
in the combined out of phase cycle S. Here, although the specimen is
under load during the heating portion of each cycle, the rate of heating
is greater, and tte effect suggested would be considerably less. The
slightly lower values of the net time to specified strains for the longer
times support this suggestion.
The approximate equivalence of all the cyclic test conditions enaqysd
at 600'7, as opposed to the marked weakening effects observed at 300OF for
some cycles, supports the explanation previously offered. The recovery
and overaging processes. which are considered primarily responsible for
the reduction in creep strength at 300F in those cases when the specimen
is subjected to elevated temperature in the absence of load, will undoubtedly
UM TR 53-336 Pt 4 56
TABLE XI
Comparison of Average Net Times (Net tg) to
Reach Specified Strains for Various Cyclic Conditions
"Creep of 75S-T6 at 6000F
Total SteadyStress Strain Load and Cycle Cycle Cycle Cycle Cyclepsi % Temp. ,3 5 6 7 8
5,000 0.2 1 10.5 2 1 1 1 l l1.0 4" 2-+ 3 21 4 31.5 6 3f 4 4 62.0 71 51 5 84 63.0 10 61 '?:& a Sl4 715.0 13 9 10 81 15 10F 18 121' 11-1ý 1.1-IL la 13~
4,500 0.2 - _ 1 4 I--0.5 3 24 21 1 31.0 51 U2 6 6a 71 Q-21.5 12 8 10 10 12 102.0 l.• 11 13; 13 16L 133.0 20ýý 1-52 17' 1- i.1- 23 + 11.5.0 29 21 231 26 31 23t
F 41 29 30 38 401 32
4,000 0.2 1* 1. l --
0.5 6 5y. 5 2 4 61.0 17 1 14 18 13 1412
1.5 27i 19•2 23i 26 26- 21t2.0 37 25 33 34 35 293.0 50 341 421 47r 51 4145.0 72 48 60 -- 70 61F 102 68 88 -- 94 88
3,500 0.2 3 2 112 3t 2 -0.5 16 13i 12 16 13i 12.11.0 43 26' 32 50 40 331.5 66 42 60 [70] 65 521-2.0 90 57 90 - 86 733.6' 128 80 -- -- 150 1135.0 190 110 ...-- --
F 250 .-- .-- --
3,200 0.2 7 2*- 2j 7 4 --0.5 31 21 20 27 27 2111.0 78 40 55 [87] 79 551.5 18 66 113 [15j 131 982.0 160 93 -- - 184 1403.0 230 130 --.. .. .5.0 [330] [180] .. .. . ..
[. = Estimated or Extrapolated DataWADC TR 53-336 Pt 4 57

take place very much more rapidly at 6000 F. Overaging will be complete
at a very early stage of the test, while the effects of deformation at
300OF which are recovered slowly at this temperature in the absence of
load, are unlikely to occur at 6000 F, where tensile results indicate that
recovery is very rapid.
(b) Analytical Correlation and Prediction
The procedures used to analyze the test data obtained at 300*F have
been applied to the 600*F data, with the exception that for reasons given
previously, the test results have been expressed only in terms of total
strain, the creep strain data being omitted. Tables XII and III summarize
the results of correlation by the K factor, while Figs. 37 and 38 provide
examples of the prediction of creep data by the use of this correlation
for cycle 3 conditions (steady load, intermittent temperature, 1 hr./1 hr.).
On the whole prediction of the 6000 F data showed somewhat better agreement
with the average experimental values than was the case for 3000F, but the
same tendencies were found for increased deviation of the predicted creep
curve from the experimental curve as the stress became more remote from
the standard stress on which the correlation was based. Agreement of the
average V< values for the same stress applied under different cyclic con-
ditions was close, confirming the postulate that the stress function, 1
of Eq. (1) is,to a good approximation, independent of the cyclic condition.
Consequently the maximum use may be made of the prediction methods developed,
and the calculation of data at any stress (within a moderate stress range)
under intermittent conditions requires only one test at some standard
stress under the intermittent condition, and sufficient steady load iso-
thermal creep data to evaluate the K for the unknown stress in relation
to the standard. Alternatively at 600*F a fair approximation for the
WADC TR 53-336 Pt 4 58

TABLE XII
Values of K%( at Various Stresses, Total Strain and
Intermittent Conditions. Creep of 75S-T6 at 6004F.
Standard Stress = 4,500 psi (Ka - 1.O).
TotalStress Strain New Cycle Cycle Cycle Cycle Cyclepsi _ SLST 3 5 6 7 8
5,000 0.2 1.40 1,96 1.60 -- 1.76 --0.5 1.50 2.35 1.76 2.44 1.89 2.01.0 1.76 2.44 1.94 2.70 2.02 2.101.5 2.00 2.33 2.22 2.58 2.06 2.152.0 2.07 2.34 2.30 2.60 2.00 2.173.0 2.05 2.38 2.27 2.59 2.03 2.335.0 2.23 2.33 2.35 3.06 2.05 2.35
F 2.28 2.32 2.61 3.16 2.16 2.42Av. 2.05 2.35 2.30 2.60 2.05 2.20
4,000 0.2 0.56 0.49 0.51 0.24 0.53 --0.5 0,50 0.43 0.49 0.40 0.49 0.48140 0.44 0.44 0.46 0.37 0.48 0.451.5 0.44 0.45 0.43 0.38 0.47 0.472.0 0.42 0.44 0.40 0.39 0.47 0.453.0 0.41 0.45 0.40 0.37 0.45 0.425.0 0.40 0.44 0.39 - 0.44 0.39
F 0.40 0.43 0.34 -- 0.43 0.37Av. 0.45 0.45 0.45 0.38 0.45 0.45
3,500 0.2 0.23 0.25 0.22 0.55 0.27 -0.5 0.19 0.17 0.21 0.16 0.20 0.231.0 0.17 0.21 0.20 0.14 0.20 0.202.0 0.17 0.19 0.15 - 0.19 0.183.0 0.16 0.19 - -- 0.15 0.165.0 0.15 0.19 -- --
F 0.16 -- -- -- --
Av. 0.18 0.20 0.20 0.16 0.18 0.19
3,200 0.2 0.100 0.18 0.12 0.026 0.16 --0.5 0.097 0.11 0.12 0.097 0.10 0.131.0 0.096 0.14 0.12 0.077 0.10 0.121.5 0.100 0.13 0.089 0.087 0.094 0.102.0 0.097 0.12 -- -- 0.090 0.0933.0 0.089 0.12 ...--.5.0 0.088 0.12 ....
Av. 0.097 0.12 0.12 0.070 0.10 0.11
WADC TR 53-336 Pt 4 59
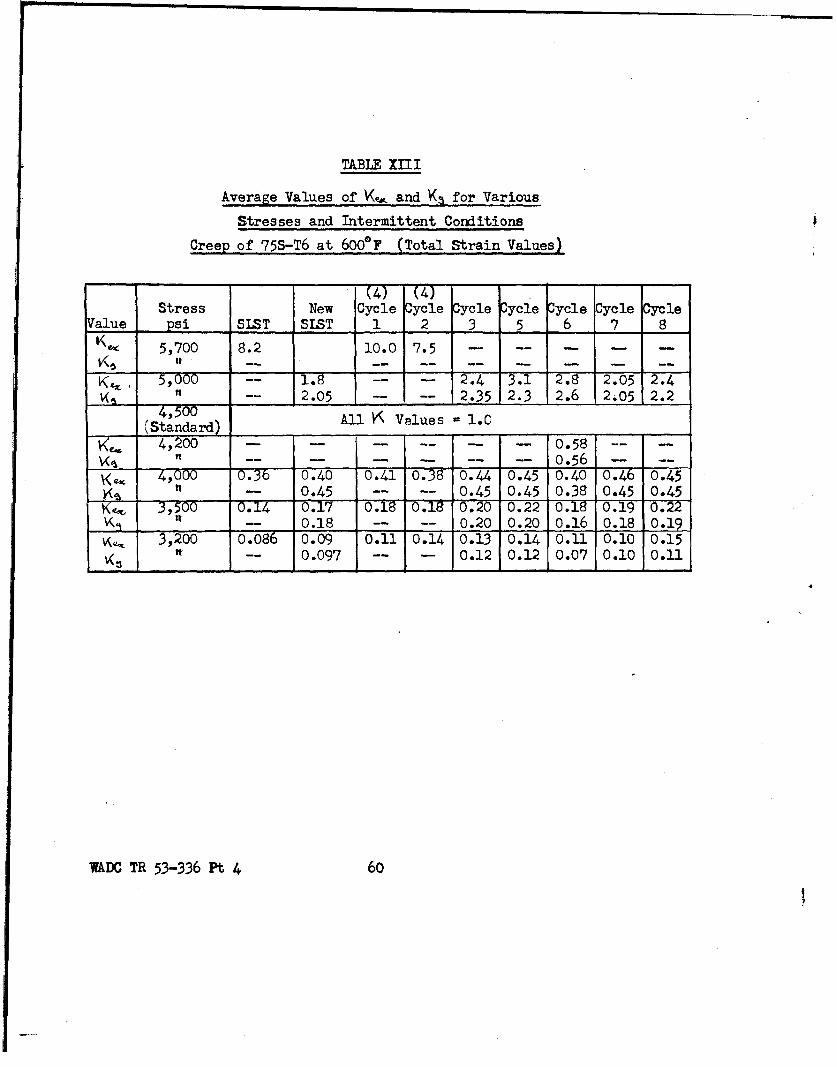
TABLE XIII
Average Values of Ye, and Ws for Various
Stresses and Intermittent Conditions )
Creep of 75S-T6 at 600OF (Total Strain Values)
4 (4)Stress New Cycle Cycle Cycle ycle ycle ycle Cycle
Value psi SLST SLST 1 2 3 5 6 7 8
5,700 8.2 10.0 7.5 - -- - -- -
5,000-- -- 2.4 3.1 2.8 2.05 2.4ft -- 2.05 .. .. 2.35 2.3 2.6 2.05 2.2
4,500 20 .
All K Values , 1.0(Standard)__________S4,200 ..- . . . 0.58 . --v- "-. .. . .. ..- 0.56 - --1<O 4,000 0.37 0.40 0.41 0.38 0.44 0.45 0.40 0.46 0.45K it -- 0.45 --. . 0.45 0.45 0.38 0.45 0.45
ZVI 3,500 0.14 0.17 0.18 0.18 0.20 0.22 0.18 0.19 0.22K 4 - 0.18 -- -- 0.20 0.20 0.16 0.18 0.19• 3,200 0.086 0.09 0.11 0.14 0.13 0.14 0.11 0.10 0.15
It -- 0.097 -- -- 0.12 0.12 0.07 0.10 0.11
WADC TR 53-336 Pt 4 60
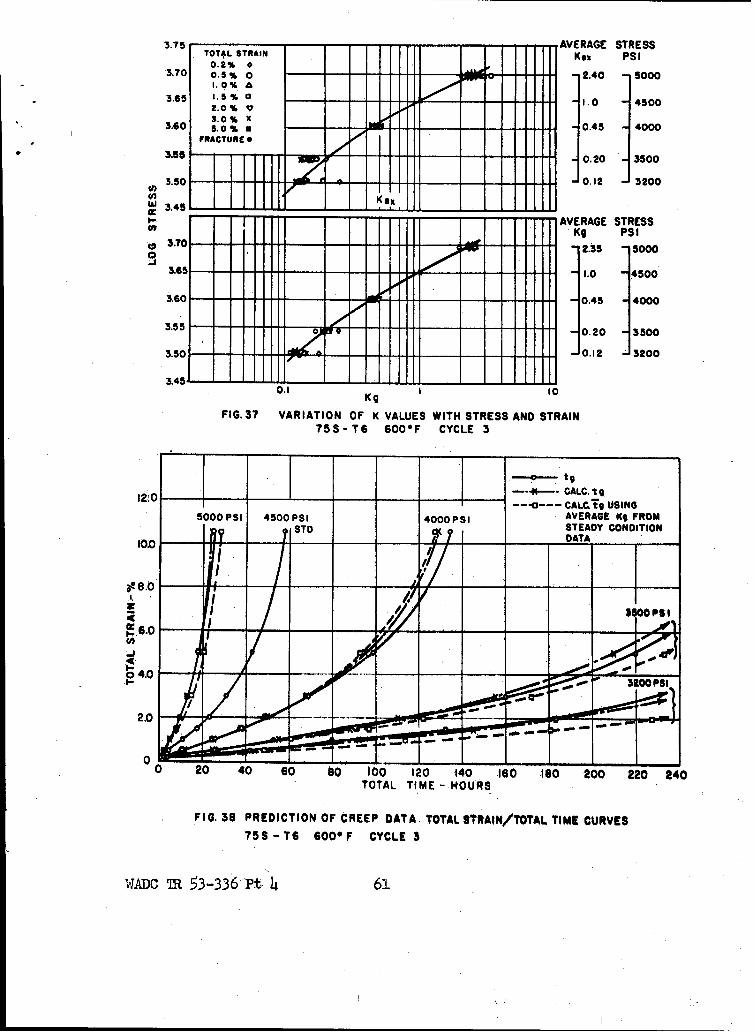
375 AVERAGE STRESSTOTAL STRAIN Kex PSI0.2% 93.70 0.5% 0 - - 2.40 -150001.0% a
3.65 1.S % 0 - -- -1.0 4500
2.0% x3.60 3.0% x0 -- 0.45 4000
-F 0.20 . 3500
3.50 -_ -- -0.12 3200(o KexI. 3.4 :0
I- - - -AVERAGE STRESSam Kg PSI,g 3.70 - 2.35 50000
3.6o 5 - - -1---- 1.0 4500
3.6 O- - -0.45 4000
3.55-- a 9 0.20 J3500
3.50 -JI - - - - 0.12 3200
3.45- 1 110.1 Kg 10
FIG. 37 VARIATION OF K VALUES WITH STRESS AND STRAIN755- T6 600*F CYCLE 3
9- t9
Ito,_ -- *-. CALC. tg--- o--- CALQT9 USING5000 PSI 4500 PSI 4000PSI AVERAGE Kg FROM
SO, STD STEADY CONDITION
_____.0__ DATAIO I
8.I
I PSI
_
4.j
o-
0 20 40 SO 80 100 120 140 ,160 10 200 220 240TOTAL TIME -HOURS
FIG. 38 PREDICTION OF CREEP DATA. TOTAL STRAIN/TOTAL TIME CURVES
75S-TS 600*F CYCLE 3
WADC mR 53-336 Pit 4 61
intermittent condition may be achieved as described in the previous section
by using the total strain values obtained from a steady load isothermal
test reached in the same net time under load at the test temperature.
EVALUATION OF ANALYTICAL METHOID
1. Introduction
The successful use of methods of analysis and prediction of creep
data developed and discussed in this and previous reports has so far been
demonstrated only for a relatively limited range of intermittent conditions,
and in detail for only one material - aluminum alloy 75S-T6. The detailed
analysis of these results has not only shown that for most of the cases
examined good agreement between calculated and actual creep curves can be
obtained at moderate strains but it has also shown that the Y factor in-
volved in the method is insensitive to the type of cycle involved-in tests
underintermittent conditions, at least within the range of the eight cases
studied. This detailed analysis has also disclosed a weakness in the
method, inasmuch as the factor K is slightly dependent on strain, its
variation with strain (or time) increasing as the test stress becomes
further removed from the standard stress of the analysis. It was there-
fore considered necessary to conduct an extensive survey of available
creep data from both steady load isothermal tests, and from intermittent
condition tests in order to assess the validity, and the range of applica-
tion of the proposed methods of analysis. The former type of data could
be used to evaluate the extent to which the ( factor might vary with
strain, and to established whether the basic equation
WADC TR 53-336 Pt 4 62

previously proposed could be applied to the prediction of creep data in
general, or whether restrictions on its range of validity were imposed
by such variables as type and composition of material, stress range, strain
range. and duration of the test. These limitations would be additional
to the obvious condition that the above equation cannot be valid when
large plastic strains are produced on application of the test stress. An
analysis has also been made of the results of creep tests under several
types of intermittent conditions carried out .at Cornell Aeronautical Lab-
oratories Inco(7,8) on a number of materials, in order to test the apparent
independence of the VK factor with respect to the type of intermittent
test condition observed in the present series of tests.
2. Criteria for Evaluation
Up to the present, it has been considered desirable for the predicted
times to reach various strains at some specified stress to be within 420%
of the average experimental value. For strains of about 1% this criterion
would represent agreement of the same order as the normal scatter found
in creep testing many commercial alloys. Bowevet, it may be that this
standard is unneccessari..y rigid, particularly at low strains. The design
1nomat.ion often required is the value of the stress which will cause
specified strains or fracture in given -i•ues. In many cases an error of
±20% in the times involved is associated-with a considerably lower per-
centage error in the corresponnding value of- the stress. The data for the
steady lead isothermal creep.of 75S-T6 alloy at 30O0'F7gve been used to
illustrate this point. The values of calc It) f6r specified total strains
at the five test stresses have been replotted as stress/log time curves,
and the stress required to produce strains of 1.0%, 1.5%, 2.0% and fractare
WADC TR 53-336 Pt 4 63
in times of 20, 50, 100 and 150 hrs. determined from the graphs. Fig. 39
shows the actual and calculated stress/log time curves. In Table XIV(a)
the comparison of calculated and experimental data is made on a time basis,
while in Table XIV(b) the comparison is made on the stress basis described
above. It may be seen that the difference using the latter criterion is
for the most part negligible from the design viewpoint, even though
appreciable differences exist when the corresponding comparison is made
on a time basis. At low stresses and longer times, when the stress/log
time diagrams often become flatter, considerable differences in times to
reach a specified strain may still correspond to an unimportant difference
in permissible design stresses. Judgment as to the effectiveness or other-
wise of the proposed prediction procedures must therefore be related not
to any absolute standard of agreement, but to the permissible design tol-
erances required by considerationg such as operational stress, minimum
'endurance, permissible maximum deformation, and material characteristics.
One further point may be made before consideration of the methods and
results of the detailed survey of data which has been carried out. It
is certain that no empirical method of analysis of creep data can be
universally applied. Consideration of the effect of such complications
as metallurgical changes during the progress of creep, and the effect
of creep itself in changing the initial structure of a material exposed
to the combined influence of stress and temperature make it fundamentally
impossible to arrive at general laws of creep(12) which can be extensively
applied to commercial alloys until our knowledge of creep behavior and
processes is much more advanced than at present. Sven partial success
in the application of methods of analysis and prediction which is likely
to assist in the reduction of the quantity of testing, particularly
VADC TR 53-336 Pt 4 64
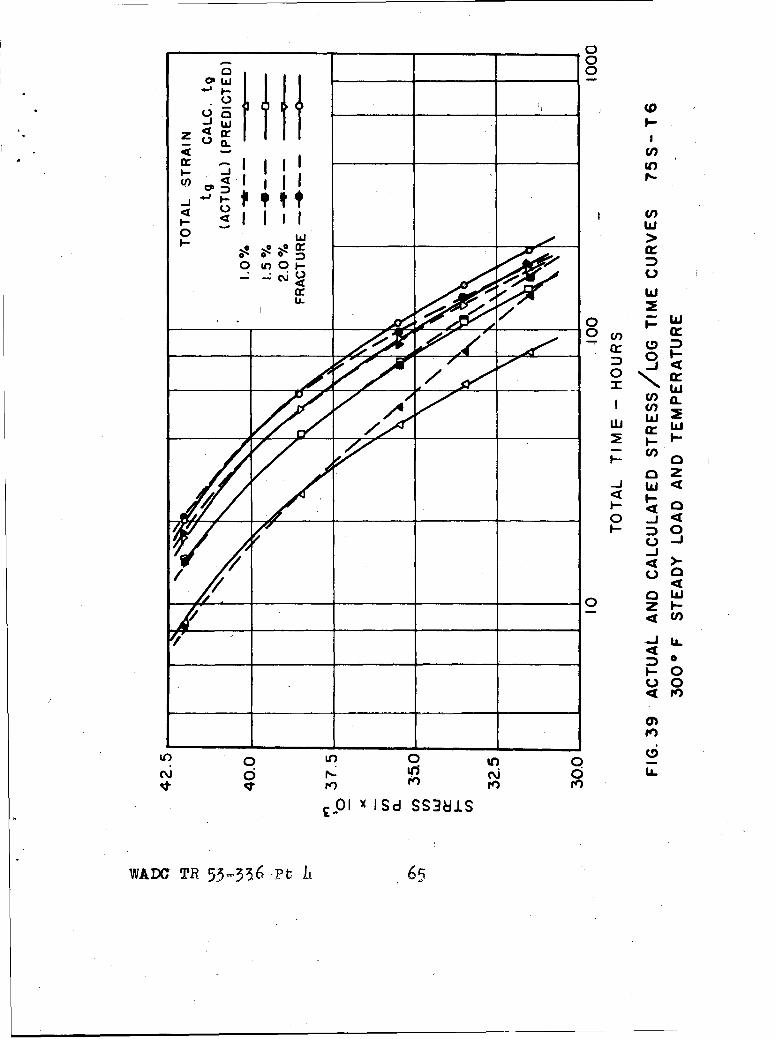
0
-J 0o 4d_ 0r
0 II
4 0 0,
-0010
cnn
0
140 w4
a Z4-J W
U-J
U()
Q00re)
0e)
0 O 0 Nc 0
£91l X lSd SS381S
WADC TR? 53-33.6 pt, It 6.

TABLE XIV
Comparison of Experimental and Calculated Creep Data
for Steady Load, Isothermal Creep of 75S-T6 at 300°F
Table XIVa. Comparison on Time Basis
Total Times (Hrs.) to Flea h Specified Total StrainsStress erimental ( ) Calculated (calc. rpsi 1.0% 1.5X 2.0 racture 1.0% 1.5% 2.0% Fracture
42,000 8.3- 14 18 20• 8.6 141 171 2038,500 25.0 42 51 58 . .. . .
(Standard)35,500 52.0 72 90 97 45.0 75 91 10433,500 84.0 110 122 130 63.0 107 128 14531,500 135.0 155 165 170 83.0 140 170 193
Table XIVb. Comparison on Stress Basis
Stresses (psi)xlO- to Produce Specified Total StrainsTime Experimental CalculatedHrs. M.03-7.5% 2.0% Fracture 1.0% 1.5 2.0% Fracture
20 39.3 41.2 41.7 42.0 39.5 41.3 41.7 42.050 35.7 37.6 38.6 39.2 34.9 37.7 38.7 39.2
100 32.9 34.0 34.8 35.3 30.2 33.8 35.1 35.7150 31.0 31.6 32.2 32.5 27.0 31.1 32.3 33.2
IADC TR 53-336 Pt; 4 66
testing under intermittent heating and stressing, may therefore be con-
sidered to represent some progress in the study of creep under these
conditions.
3. Methods of Evaluation
In the application of the basic equation
S(1)
previously proposed, it has been assumed that the stress function,,
is independent of strain, and consequently
K (5)
where t total time at some standard stress to reach a total strain E,
o- =total time at some other stress, a- , to reach a total strain E,
It% s total time at the standard stress to reach a total straine.L
= total time at the other stress, 6- , to reach a total strain 2.
In fact it has been found that K is not truly independent of strain, and
further that the variation in K increases as the stress, 0--, departs from
the standard stress. The variation in K with strain has therefore been
used to study the validity of Eq. (1), while the average value of K with
respect to strain at various stresses has been used to estimate whether
the prediction of intermittent data can be accomplished from steady load
isothermal test results and only one intermittent test. Such a prediction
relies on the independence of{ and therefore K , with respect to inter-
mittent conditions. Studies of the variations in the value of K have
therefore been made for the data from Cornell Aeronautical Laboratories
Inc.(7,8) in addition to the analysis made in preceding sections of the
WADC TR 53-336 Pt 4 67
data accumulated in these laboratories.
Such a detailed study of the vast body of available steady load
Isothewal creep data is manifestly not possible within the time available,
and more rapid methods of evaluation have therefore been applied. Therm
data er presented as creep curves of strain (or log strain) plotted againt
the logarithm of the tine., the analysis proposed is applicable ihen the
cur-es at a series of stresses are displaced relative to each other along
the log time axis by a distance approzimately independent of strain for
any pair of ourveso From Eq. (5), at any pair of values for the standard
stress and the stress a-9 the stress/log time design curves for the spec-
Mfied total strains t, and Ewill be equally spaced with respect to the
logt i axus, an my be seen in the calculated curves of 71g. 39. The
deviation of the experimental curves from parallelity can therefore be
ased as an indication of the success or failure of Zq. (1). Further, if
the gtress fanction, is independent of the cyclic condition, the
stress/log time curves for any intermittent creep testing condition should
be parallel with those deri~ed from steady load isothermal data at each
and every value of the specified strain. The position of a set of curves
under an given test oondition willn, of course, vary, such variation being
controlled by the strain function, IF of equation (1).
4 ApWioation of teady Load.& Isothermal CreeD Data
From the detailed analysis of the data presented In this and previous
related reports, it seemed probable that accurate prediction of steady load
isothermal creep data by the methods proposed would be subject to limita-
tions of both stress and strain. The use of the graphical comparison
methods described in the previous section has made it possible to examin
UM TR53-3 36 t4 68

over one hundred and fifty sets of creep curves for a variety of materials.
References to the currently published data examined are given in the bib-
liography at the end of this report.(13-22) In no case was any correlation
found to cover the entire strain and stress range of a series of tests,
but in approximately one third of the cases examined the proposed analytical
method appeared to give useful results over reasonable ranges of stress
and strain. Creep curves at relatively low test temperatures for several
commercial aluminum alloys (24S-T, 75S-T, R30l-T(13) 2S, 4S(14), 63ST(15))
in various conditions did not appear to constitute homologous series of
the type indicated by Eq. (1), but correlation was considerably improved
at temperatures of about 350P-4000 F. At these temperatures K factor val-
ues (and hence predicted times to reach specified strains) appeared to be
usually within +20% of a mean value over a range of stresses which would
produce fracture in times from 50-800 hrs., and over a total strain range
bf from 1.0% to fracture (5-10%). The results of Sherby and Dorn on annealed
aluminum 2S-0 (16) and on 99.6%(14,16) aluminum could not be consistently
correlated for any of four temperatures (90 0F-4000 F) or for any annealed
condition within tolerances of approximately 50% in times to reach various
strains. Creep data on high purity aluminum and a series of dilute solid
solution alloys of aluminum with copper, magnesium, zinc, and germanium
at 300F117) gave reasonably constant K( values over stress ranges capable
of producing rupture in from 10 hrs. to 500 hrs. and for a strain range
of approximately 10% to fracture (50-60%). The creep of dilute aluminum
silver alloys,(17) however, did not fit in with the analysis, the Y\ values
varying with strain by a factor of up to 2 even over very restricted ranges
of stress. Creep data on some austenitic and ferritic gas turbine disc
alloys(18l19,20) did not show good agreement with Eq. (1), except at
WADC TR 53-336 Pt 4 69
certain temperatures, but some success was experienced with creep data
on Inconel X, and much of the long time creep data on the nickel-chromium
base British high temperature alloys Nimonic 80, Nimonic 80A, and Nimonic
90(21) could be effectively correlated within reasonable limits of accuracy,
even for strains as low as 0.1% and for test times in some cases over 10,000hours. The extensive data of Cross and Simmons (22) on a wide variety of
heat resisting gas turbine alloys provided further evidence of useful
agreement with Eq. (1), usually over restricted ranges of stress and strain,
in approximately one third of the families of creep curves or stress/log
time design curves examined.
.Although the general survey of steady load isothermal creep data so
far completed must be considered as indicating qualitatively rather than
quantitatively the degree of agreement of experimental results with the
functional Eq. (1), it is apparent that its application to the correlation
and prediction of steady load isothermal data is by no means universal.
No effective generalizations as to when the method is likely to be suc-
cessful can be made, and its use must therefore be a matter of judgment
for each individual case under consideration. 'When it is used flexibly,
and with due regard to the limitations of stress or strain range encoun-
tered in any particular application, it would seem that considerable
benefit may be derived from its use as a means of interpolating and ex-
trapolating existing data complementary to such well known methods as
the use of stress/log time design curves.
5. Application to Published Intermittent Condition Creep Data
The survey of the foregoing section has shown that in a proportion
of steady load isothermal creep data, the variation of K with strain is
WADC TR 53-336 Pt 4 70

sufficiently minor as to render feasible the prediction and correlation
of such data by the use of Bqs. (4) or (5). The experimental studies of
this and previous reports indicate that where this is the ease, the value
of K is also approzimately independent of the steady or intemittent
mature of the test temperature or the applied stress. IM order to check
this, the intermittent and steady condition creep data(7p8 ) determined at
the Coznell Aeromautical Laboratories, Inc. for a variety of materials
,we- subjected to detailed analysis. No other intermittent condition creep
data suitable for such studyhave been uncovered.
(a) NMansiu 2 alo2 y
For the creep of FS-iH magnesium alloy at 3000 F., remarkable agreement
of the experimental data with the predicted data was found vhen the K
factors for the appropriate test condition was applied. An example of
this agreement is shown in Fig. 40, for a steady temperature intermittent
load (1 bhr on, I hr. off) cycle. In this case$ creep curves have also
been predicted by the application of the average K factors at the var-
ious stresses, derived from the steady load isothermal data, to the single
standard stress curve under the intermittent condition, and again, excel-
lent agreement has been obtained. A similar procedure applied to the
prediction of data with a steady temperature 11 hr. offA hr. on inter-
mittent stress cycle, or with a cycle employing steady load intermittent
temperatire (1 hr. at temperature/ 2 hr. total cycle) also gave good cor-
relation, as may be seen from Table XV where intermittent and steady
condition average K values are given.
At 450'F the analysis of the data is less satisfactory, since in
many cases strains of 2% were reached in times of less than one cycle,
UMDCTR 53-336 Pt4 71

0(I) 0
,it Ia $o
cm C 0 0 4
4 0 4
~Zw 4 '
0l.- 0 0 Z w &w I- Ii
W W IA C UIL ILU) w
Z Ir
X w
too
a. Iol-
0 w0
~z c
0 IL
0.- 000/p NOx~~3 VO
WAlmS-33P1
0 .

TABLE XV
Average K Factor Values for VariousStresses and Intermittent Conditions.
Creep of FS-IH Magnesium Alloy
Table XV(a). 3000F. 1% Total Strain - Fracture
ILST liST ILITStress 1 hr. on/ hr. on/ 1 hr. on/psi SLST 1 hr. off hr. off 1 hr. off
3,000 0.106 -- 0.105 --
4,000 [0.25] 0.27 --4,100 0.28 -- --.
5,000 0.53 0.56 0.50 0.466,000
(Standard) 1.00 1.00 1.00 1.007,000 [1.75] 1.70 1.84 1.927,100 1.88 -- --.
8,000 3.06 3.18 3.48 3.0910,000 8.8 10.7 11.3 8.312,000 25.5 33.0 32.0 19.2
Table XV(b). 450*F. 1% - 5% Total Strain
ILST lIST SLITStress 1 hr. on/ • hr. on/ 1 hr. on/psi SLST 1 hr. off I1 hr. off 1 hr. off
650 0.155 -- - -
1, 000 0.37 0.38 0.42 0.421,650
(Standard) 1.00 1.00 1.00 1.002,000 1.52 1.43 1.48 -2,350 [2.15] -- -- 2.03,150 4.00 3.6 3.8 4.14,100 [7.9 .. -- .5,000 10.0 -- 10.8 --
NOTE: Based on data from Cornell Aeronautical laboratories, Inc. (7,8)
[ ] = Interpolated ValueSIST = Steady Load, Steady TemperatureILST = Intermittent Load, Steady TemperatureSLIT = Steady Load, Intermittent Temperature
WADC TR 53-336 Pt 4 73

and such times cannot be considered as representative of true intermittent
condition behavior. For strains of 1%-5% consistent values of the K( factor
were obtained, which did not appear to be appreciably affected by the type
of intermittent cycle employed in the test. The average K factors eval-
uated from the data with due regard to the above limitations are given in
Table XV. Fracture data at 450OF have not been included in this analysis,
since it was found that the method could not satisfactorily be applied in
this instance, and only data for strains up to 5% have been made use of
where the times involved have been adequate to include the effect of inter-
mittent conditions. As for the 300°F data, the average Y values quoted
are taken from a smooth curve drawn through the experimental points on a
log stress/log K plot.
(b) 24S-T3 Aluminum Alloy(7'8)
Test results suitable for analysis for intermittent load, intermittent
temperature, and combined intermittent load and temperature conditions embody-
ing six different cycles were available at 450OF and 600°F in addition to
the steady load isothermal creep data. Variation of the value of the K
factors with strain for any particular stress and intermittent condition
was not excessive, falling within .10% of the average value in all except
a few cases, and in mary instances being considerably more consistent over
a strain range of 0.5% to fracture (approximately 3%). In many cases
where the deviations were large, use of adjusted values of the times to
reach given strains, derived from stress/log time diagrams, would effec-
tively remove or reduce the discrepancy. However, when the average K
values for the same stress applied under the various intermittent condi-
tions are compared, as in Table XVI(a), a rather large variation is apparent.
WADC TR 53-336 Pt 4 74

TABLE XVI
$ Factor Values for Various Stresses and Intermittent ConditionsCreep of 2MS-Tý3 AI,•'um Alloy
"Table XVI(a). 450"F. 0.5% Total Strain - Fracture (approx. 3%)
" ILST LST ILST SLIT -R IT SLIT ILIT V D tStress 1 Hr./ Hr./8 Frs. Hro Hr./ Sch. Bch. frompsi S 8T 1 Hr.. 3 -rs Hr 4 Lr .1 2
15,000 0.22 0.34 0.37 - 0.20 .. . .. 68 917,000 0.39 0.50 0.55 0.33 0.39 - 0.53 0.35 41 1520,000(Std.) 1.0 1.0 1.0- 1.0 1.0 1.0 1.0 1.0 - -
22,000 1.85 2.15 2.10 1.75 1.85 1.4 1.7 2.0 16 2425,000 4.9 7.0 5.8 3.3 4.0 5.0 3.9 4.6 43 20
Table VI(b). 600eF. 0,.5% Total Strain - Fracture (approx. 10%)
I-ST' IIT ILSTSLIT T T SLIT ILIT DeviationStress 1 Hr/ VJ* Hr.~/ Firs.l Fir!ý Hr./ Sch, Bch. from SISTE•i SLST 1 H H -8r 1 Hr Hr 1 2 4 -
4,000 0.13 0.10 0.056 0.15 - -- .. .. 15 575,000 0°40 0.37 0-40 0.42 0.47 0.50 0.44 0.51 27 7
"6,000(Std.) 1.0 1,0 1,0 1.0 1.0 1.0 1.0 1.0 - -
7j,000 2.25 2.2 2.2 2,0 2.0 1.85 2.15 1.80 0 208,000 4.6 4.3 3.8 3.75 3.5 3.0 4.0 3.1 0 35
10,000 17.0 14.0 1000 - 9.2 6.0 12.0 7.5 0 65
SLST - Steady Load and TemperatureILST - Intermittent Load, Steady TemperatureSLIT - Steady Load, Intermittent TemperatureILIT - Combined Intermittent Load and Temperature
NOTER Based on data from Cornell Aeronautical Laboratories, Inc.(7,8)
UN TR 53-336 Pt 4 75
Although the K factownat the lower stresses show considerably greater
variation with strain the data at 600*o follow a somewhat similar pat-
tern to that described for the 450*7 results, as may be seen from Table 171(b).
Mile in both cases a more detailed treatment involving the use of average
tes derived from stressAog time curves, and the disc,- 2ting of apparently
anamalous results leads to some vement in the consistency of results,
it would still seem that the use of average K values obtained from steady
lead isothenl data, in conjunctlin with a single test at the standard
stress under the intermittent condition, would lead to predieted data which
would in many instances fail to agree with the actual data within reasonable
1Ixmts for the material and test temperatures under consideration,
(a) lwCarbon N-5AlloXT
An attempt to correlate the creep data at 13507F and 15006F for this
$g tnemperature gas tuzbine alloy vas not entirely satisfactory. For
some series of tests, particularly those under intermittent temperature
oonditions, the variation of K with strain and stress was erratic. The
results are given in detail in Table XIM, the average K values at each
stsess being obtained from a smooth curve drawn through the points at the
varieus strains plotted on log streus/log K graphs. In some instances
the average 1( values were also corrected to take into account the effect
of an apparently non-typical test at the standard stress. Although the
average K values obtained by these methods for three of the four cycles
show fair agreement. prediction of strain/tims data did not give good
agreemeat with the experimental creep curves except for a few instaes.
(d) cnonel X(S)
By using the averaging methods described in the previons section,
UM 253-336 Pt4 76

TABLE XVII
K Factor Values for Various Stresses, Strains, andIntermittent Conditions. Creep of Low Carbon N-155 Alloy.
Table XVII(a). 1350OF
Total ILST ILST SLITStress Strain 1 hr. on/ 8 hrs. on/ 1 hr. on/
psi %_SLST 1 hr. off 8 hrs. off 1 hr. off
20,000 0.5 -- 0.18 --
1.0 0.14 0.08 --
2.0 0.092 --....
5.0 0.056 - .....Fracture 0.065 --....
Average 0.11 0.12 ..
24,000 0.5 0.38 0.44 0.20 0.711.0 0.29 0.40 0.37 0.142.0 0.34 0.33 0.44 0.195.0 0.32 0.28 0.39 -
Fracture 0.28 0.33 0.29 0.40Average 0.37 0.38 0.37
26,000 0.5 0.67 0.86 0.77 0.261.0 0.52 0.76 0.74 0.282.0 0.54 0.71 0.75 0.355.0 0.50 0.66 0.84 --
Fracture 0.54 0.69 0.58 0.69Average 0.62 0.64 0.65 -*
28,000 Standard Stress All •K = 1.0
30,000 0.5 1.43 1.50 1.09 2.121.0 1.27 1.37 4.67 1.042.0 1.22 1.33 1.28 -0.875.0 1.19 1.47 1.46
Fracture 1.10 1.84 1.17 1.53Average 1.39 1.50 1.43 -
35,000- 0.5 - -1.0 - 7.7 - --2.0 5.9 4.0 8.9 5.155.0 2.43 3.5 3.4 -
Fracture 2.02 3.8 2.8 5.6SAverage 3.1 4.0 2.8 -*
SIST - Steady Load and TemperatureILST = Intermittent Load, Steady TemperatureSLIT = Steady Load, Intermittent Temperature()
NOTES: 1. Data from Cornell Aeronautical Laboratories, Inc.2. Average K values obtained from smooth average curve through
points on log stress/log < plot. Correction applied whererequired for apparently non-typical creep curve at standard stress.
* Scatter of points on log stress/log 1 plot such that no signi-ficant average values could be obtained.
WADC TR 53-336 Pt 4 77

Table XVII(b). 1500*F
Total ILST ILST SLITStress Strain I hr. on/ 8 hrs. on/ 1 hr. on/psi % SIST 1 hr. off 8 hrs. off 1 hr. off
12,000 0.5 0.036 0.079 ....1.0 0.033 --..
2.0 0.038 .....5.0 0.050 ......
Fracture 0.067 .....Average 0.038 ....--
13,500 0.5 0.089 0.10 -- 0..11.0 0.096 0.087 - 0.152.0 0.11 0.098 -- -
5.0 0.13 0.12 ..--Fracture 0.17 0.14 - 0.28Average 0.115 0.13 --
15,000 0.5 0.21 0..30 -- 0.421.0 0.28 0.37 0.26 0.272.0 o.28 0.36 0.25 --5.0 0.31 0.38 0.30 -
Fracture 0.36 0.32 0.31 0.56Average 0.31 0.30 0.27 -*
17,000 Standard Stress. All V-, = 1.0
19,000 0.5 - 3.91 --1.0 3.44 3.88 - 1.432.0 3.34 3.06 -- 2.225.0 2.70 2.81 2.41 --
Fracture 2.31 1.9 2.02 1.94Average 3.0 3.0 2.4
21, 000 0.5 -- -- - --
1.0 - 7.6 -- 4.72.0 7.4 6.6 6.2 6.75.0 6.0 5.5 3.7 3.1
Fracture 4.7 3.9 3.5 3.1Average 6.1 7.0 3.8 -*
SLST - Steady Load and TemperaturelIST - Intermittent Load, Steady TemperatureSLIT - Steady Load, Intermittent Temperature
NOTES: 1. Data From Cornell Aeronautical Laboratories, Inc.2. Average K values obtained from smooth average curve through
points on log stress/log K plot.* Scatter of points on log stress/log K plot such that no
significant average values could be obtained.
WADI TR 53-336 Pt 4 78
good agreement us obtained between the average K values for the two
intermittent cycles and the steady load and temperature creep data for
this material at 1500*? (Table ZVIII). At 13507F, somewhat greater dif-
ferenoes between the steady, and cyclic load isothermal tests were found
although at this temperature the variation of K values with strain ims
.less than at 1500'F, where deviations from the mean value were in some
cases of the order of 50%.
(e) Titanium Alloy EC, IM3-A (8,923)
Dae to the shape of the creep curves for this material at 60007,
characterized by a very sharp turn over of •b• s-strIftb omyve, data'-.
for RC 130-A titanium alloy at this temperature could not be effectively
analyzed. At 700'?, however, fairly good correlation both within and be-
tween steady and intermittent load isothermal tests was obtained over thestrain range 2.0% to fracture (approx. 30). The average ( values ob-
tained as previously described are given in Table XID. Jata on the steady
load intermittent temperature condition wwo insufficient for effective
analysis. At 800?F only a limited range of stresses could be successfully
correlated, and therefore no correlation factors for this temperature have
been reported.
(f) Type 321 Stainless Steel(8)
The creep test data for this materialhwss been analyzed for both
1200'F and 135D5f test series. At 12000F, data for the steady load inter-
mittent temperature cycle are not considered sufficient to obtain reliable
average values. For the steady and intermittent load isothermal tests
fairly good correlation was obtained within and between the two series
for the strain range 1.0% to fracture (approx. 10%). The average K values
UM Tc 53-336 Pt 4 79
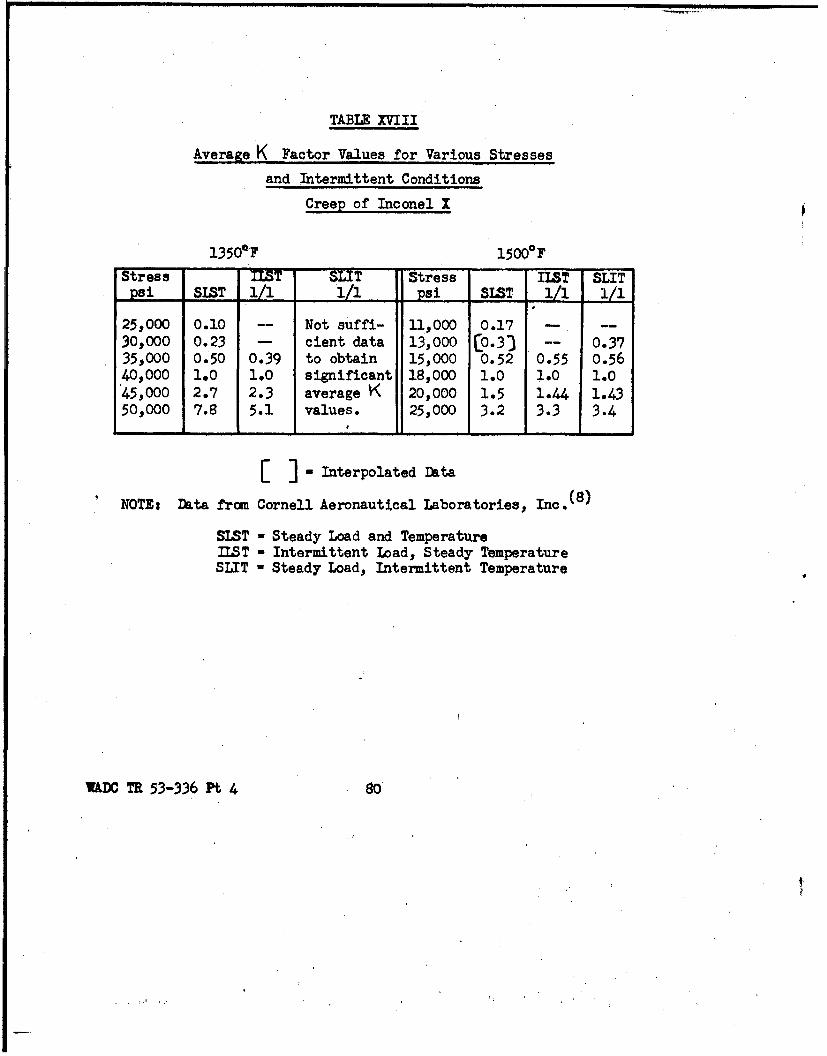
TABLE XVIII
Average K Factor Values for Various Stresses
and Intermittent Conditions
Creep of Inconel X
1350aF 15000FStress treT ssT e .. lIST SLIT
psi IST 1/ si 81ST 1/1 i/1
25,000 0.10 -- Not suffi- 11,000 0.17 - --30,000 0.23 - cient data 13,000 CO.33 -- 0.3735,000 0.50 0.39 to obtain 15,000 0.52 0.55 0.5640,000 1.0 1.0 significant 18,000 1.0 1.0 1.045,000 2.7 2.3 average K( 20,000 1.5 1.44 1.4350,000 7.8 5.1 values. 25,000 3.2 3.3 3.4
E ]- uInterpolated Data
NOTE: Data from Cornell Aeronautical Laboratories, Inc.(8)
SIST = Steady Load and TemperatureILST - Intermittent load, Steady TemperatureSLIT - Steady Load, Intermittent Temperature
WADC TR 53-336 Pt 4 80

TABLE XIX
Average K Factor Values for Various
Stresses and Intermittent Conditions.
Creep of Titanium Alloy RC 130-A4 7006F
Stress ILSTpsi SLST 1 hr. on/i hr. of
55,000 0.23 0.2465,000 0.42 0.4475,000 0.72 0.7580,000 Standard, IK = 1.085,000 1.44 1.4890,000 2.24 --
100,000 7.8 5.5
NOTE: Data from Cornell AeronauticalLaboratories, Inc.
SLST = Steady Load and TemperatureILST Intermittent Load, Steady Temperature
WADO TR 53-336 Pt 4 81
for the two *ases are given in Table 1XXa).
At 135•F fairly good coerelation was again obtained for the steady
and Intermittent load Isothermal creep data, but agreement ws less satis-
factory for the steady load Intermittent temperature cycle. Table 11(b)
gives the average K values at the various stresses at 1350*F, while a
oaparison of experimental and calculated, creep curves has been made In
Figs. 41 and 42. Fig. 41 denenstrates the results of applying the analysis
to the steady load and temperature data, while in Fig. 42 the predicted'
amrves for the intermittent temperature steady load case are shown In
ic the average K factors for the steady load isothermal case have been
applied to the standard stress creep curve of the intermittent condition.
6. nmaults of URaluation of Agalyical Method
Froa a study of a representative body of steady load isothermal
amp data on a variety of metals, it is apparent that the proposed funo-
•tional equation
while not generally applicable to all creep data. can be usefully employed
In aboat one third of t~he cases examined. For most aluiminm alloys, it
seem that correlation is more satisfactory at temperatures above about
400F, and may be better for simple solid solutions than for the relatively
complex commercial alloys. For other materials no grouping of alloys,
eve oe an approximate basis, has so far been uncovered which would in-
dicate In advance whether the creep data for a given alloy were likely
to be amenable to analysis or not. In all those cases where the method
does appear applicable, limitations are usually to be found with respect
U 0R 53-336 Pt 62
TABLE XX
Average K Factor Values for VariousStresses and Intermittent Conditions.
Type 321 Stainless Steel
Table XX(a). 120*F. 1.0% Total Strain to Fracture (approx. 10%)
Stress ILSTpsi SLST I hr. on/l hr. off
20,000 0.3422,000 0.51 0..5225,000 Standard Stress, K's - 1.027,000 1.48 1.6530,000 2.95 3.333,000 7.4 6.5
Table XX(b). 1350F. 0.5% Total Strain to Fracture (approx. 10%)
ILST -SLITStress 1 hr. on/ 1 hr. on/psi SLST 1 hr. off 1 hr. off
9,000 0.205 - 0.2910,000 0.285 0.22 0.3712,000 0.56 0.49 0.6114,000 Standard Stress, •V = 1.017,000 2.45 2.9 2.5520,000 7.5 7.6 6.4
NOTE: Data from Cornell Aeronautical Laboratories, Inc.(8)
SLST = Steady Load and TemperatureILST - Intermittent Load, Steady TemperatureSLIT = Steady Load, Intermittent Temperature
*WADC TR 53-ý336-Pt 4 83

00111 1700 4,000 pIý 1,oopsi 10,000 PSI5
Z440 RAT -
439mP
2 Nit
00 10 200300400
TOTAL TIME - HOURS
F113.41 EXPERIMENTAL AND PREDICTED CREEP CURVES TYPE 321STAINLESS STEEL STEADY LOAD AND TEMPERATURE 1350 O
(DATA BY CORNELL AERO0NAUTICAL LASS. INGCa)
1--a EXPERIMENTAL DATA (tg,)c _______ -. a-- PREDICTED DATA (CALC. *f.)1 USING K FACTORS FROM
aITNCR STEADYI LOAD ISOTHERMAL TESTS
PIN 17,000 14,000 PSI 12,000 P 9I
2. 10,000 *o000 PSIz iI I ps
4 1. 050*oo
TOTAL TIME -HOURS
F10.42 EXPERIMENTAL IAND PREDICTED CREEP CURVES TYPE 321STAINLESS STEEL INTERMITTENT HEATING 1350 O F
IDATA BY CORNELL AERONAUTICAL LABS. INC a
wh m 53-336pt 4 84~

to the range of both stress and strain over which satisfactory correlation
and prediction of data can be achieved, and while useful results can be
obtained by using the proposed method of analysis as a complement to well
established interpolation and extrapolation procedures, such as the use
of stress (or log stress) versus log time design curves, flexibility and
judgment are required in its application. Present experience has indicated
that the limitations of the proposed method arise from the fact that the
stress function, , is not independent of strain, and Eq. (1) is in
fact an excessive simplification implying as it does an equation of state
which, as has been demonstrated, cannot be generally applied to creep.
If, however, in the cases and over the ranges where Eq. (1) is a
fair approximation, the stress function,f , is the same for steady load
isothermal creep, and creep under most types of intermittent load and/or
temperature cycle, much testing time and expense can be saved by the pre-
diction of the intermittent creep data by the use of one or two chosen
intermittent tests and the appropriate V factor determined from existing,
or readily obtainable steady load isothermal creep tests. The analyses of
results of creep tests carried out both in these laboratories, and at
Cornell Aeronautical laboratories, Inc., indicate that this is generally
the case, and that in many instances fairly good agreement between pre-
diction and experiment is obtainable over a useful range. Although accu-
rate predictions are not generally possible the lack of experimental data
on the creep of materials under intermittent conditions of loading and
heating is such that even relatively crude quantitative estimates of such
data are likely to be useful until more experimental data, and a more
rigorous method of analysis based on a sound fundamental approach are
available.
WADC TR 53-336 Pt 4 85

CONCLUSIONS
1. The results of creep testing clad aluminum alloy 75S-T6 at 300OF
under isothermal-intermittent load, under steady load-intermittent temper-
ature, and under in-phase and out-of-phase cycles of combined intermittent
load and temperature conditions, show that the various cycles may be broadly
divided into two groups, according to whether they affect the net time
under load at elevated temperature to reach fracture or specified total
strains. Those cases where processes of recovery and overaging can occur
during an off-load part of the test cycle, appear to produce creep to
specified strains and fracture in times shorter than those corresponding
on a net time basis to the case of steady load isothermal creep. Such
cases are the steady temperature intermittent load cycles (cycles 1 and 2)
and the out of phase combined intermittent loading and heating cycles
(cycles 6 and 8). In all other cases the creep behavior approximates on
a net time basis to the steady load isothermal creep behavior of 75S-T6
alloy at 300OF.
2. The order of the four cycles 1, 2, 6, and 8 with respect to
their effect in causing acceleration of the creep of 75S-T6 alloy is not
directly related to the amount of time per cycle which the specimen spends
at the elevated temperature in the absence of load. A tentative explana-
tion is based on the observation that the creep curve during one cycle on
reapplication of the load appears to be of the form of the primary creep
section of the standard creep curve. Further detailed experiments would
be required before any judgment can be made on this hypothesis.
3. At 600F, where overaging must occur in a short time early in
the course of a creep test, and the material is never far removed from
the fully recovered state, the creep behavior of aluminum alloy 75S-T6
WADC TR 53-336 Pt 4 86
when judged on a basis of net time at elevated temperature under load is
approximately unaffected by intermittent conditions of heating and stressing.
4. At both 3000 F and 600*F, the creep of 75S-T6 alloy under all the
test conditions employed in the present series of tests may, to.a good
first approximation be represented by the functional equation
where 9 = total strain
S= total elapsed time
7-r = stress
F = strain function
S= stress function.
The stress function, { , is only slightly dependent on strain over the
range of stress 42,000 to 31,500 psi, and is apparently independent of the
type of intermittent test cycle of temperature and stress. The equation
can therefore be used to make effective predictions of the creep curves
under an intermittent condition from a knowledge of the creep behavior
under the normal steady load isothermal test conditions, and a single re-
presentative test at a standard stress under the intermittent condition.
5. A survey of a representative selection of available steady load
isothermal creep data op a variety of materials shows that the/above
method of analysis is not generally applicable, being effective only in
about one third of the cases, and then often being subject to limitations
of stress and strain.
6. A survey of other creep data under intermittent conditions in-
dicates that where the analysis can satisfactorily be applied to steady
load isothermal creep data, it can usually, but not invariably, be applied
WADC TR 53-336 Pt 4 87

to intermittent data on the same material over the same stress, strain,
and temperature ranges. The stress function of the equation given is then
approximately independent of the type of intermittent test cycle, and data
under intermittent conditions may be predicted as described above, permit-
ting a great reduction in the amount of testing under intermittent conditions.
WADC TR 53-336 Pt 4 88
BIBLIOGRAPHY
1. G. R. Brophy and D. E. Furman, "Cyclic Temperature Acceleration ofStrain in Heat Resisting Alloys", Transactions of the American Societyof Metals, vol. 30, 1942, p. 1115.
2. H. S. Avery, Discussion on above paper "Cyclic Temperature Accelera-tion of Strain in Heat Resisting Alloys", Transactions of the AmericanSociety for Metals, vol. 30, 1942, p. 1130.
3. H. S. Avery and N. A. Mathews, "Cast Heat Resisting Alloys of the16% Chromium, 35% Nickel Type", Transactions of the American Societyfor Metals, vol. 38, 1947, p. 980.
4. L. A. Shepard, C. D. Starr, C. D. Wiseman, and J. E. Dorn, "The Creepof Metals under Intermittent Stressing and Heating.Cqnditions. Part 1Intermittent Stressing", WADC Technical Report 53-336, Part 1.
5. L. A. Shepard, C. D. Starr, C. D. Wiseman, and J. E. Dorn, "The Creepof Metals under Intermittent Stressing and Heating Conditions. Part 2Intermittent Heating", WADC Technical Report 53-336, Part 2.
6. L. A. Shepard, C. D. Starr, C. D. Wiseman, and J. E. Dorn, "The Creepof Metals under Intermittent Stressing and Heating Conditions. Part 3Combined Intermittent Stressing and Heating". WADC Technical Report53-336, Part 3.
7. G. J. Guarnieri, "Part 1. Intermittent Stressing and Heating Testsof Aircraft Structural Metals", WADC Technical Report 53-24, Part 1.
8. G. J. Guarnieri, "Part 2. Intermittent Stressing and Heating Testsof Aircraft Structural Metals", WADC Technical Report 53-24, Part 2.
9. L. A. Shepard, C. D. Starr, C. D. Wiseman, and J. E. Dorn, "Equipmentfor Testing the Creep Properties of Metals under Intermittent Stress-ing and Heating Conditions. Part 1", WADC Technical Report 52-101,Part 1.
10. L. A. Shepard, C. D. Starr, C. D. Wiseman and J. E. Dorn, "Equipmentfor Testing the Creep Properties of Metals under Intermittent Stress-ing and Heating Conditions. Part 2. Current Modifications", WADCTechnical Report 52-101, Part 2.
11. American Society for Mechanical Egineers and American Society forTesting Materials, "Compilation of Available High Temperature CreepCharacteristics of Metals and Alloys", 1938,'Section A, Fig. 3A,p. 5.
12. John E. Dorn, "Some Fundamental Experiments on High Temperature Creep",Minerals Research Laboratory, Institute of Engineering Research,University of California (Berkeley), Technical Report Series No. 22,Issue No. 35, April 1954.
WADC TR 53-336 Pt 4 89

13. A. E. Flanigan, L. F. Tedsen, and J. E. Dorn, "Stress Rupture andCreep Tests on Aluminum Alloy Sheet at Elevated Temperatures",Aaerioan Institute of Mining and Metallurgical Engineers Transactions,vol. 171, 1947, p. 213.
14. 0. D. Sherby and J. E. Dorn, "The Effect of Cold Rolling on the CreepProperties of Several Aluminum Alloysu, American Society for Metals,vol. 43, 1951, p. 611.
15. 0. D. Sherby and J. E. Dom, Creep Properties of Two Tempers of 63SExtruded Aluminum Alloy", American Society for Testing Materials,vol. 51, 1951, p. 945.
16. 0. D. Sherby and J. E. Dorn, "Effect of Annealing on the CreepProperties of 2S-O Aluminum Alloy"t, American Society for TestingMaterials, vol. 51, 1951, p. 954.-
17. A. T. Robinson, T. E. Tietz, and J. E. Dorn, "The Function of Alloy-ing Elements in the Creep Resistance of Alpha Solid Solutions ofAluminum", American Society for Metals, vol. 44, 1952.
18. D. A. Oliver and G. T. Harris, "High Creep Strength Austenitic GasTurbine Forgings", Institute of Marine Engineers (Nngland), vol. 59,(No. 5) 1947, p. 79.
19. D. A. Oliver and G. T. Harris, "Some Proven Gas Turbine Steels andRelated Developments", Iron and Steel Institute (England). Symposiumon High Temperature Steels and Alloys for Gas Turbines, July 1952,p. 46.
20. H. W. Kirkby and C. Sykes, "Properties of Materials Intended for GasTurbines", ibid. p. 81.
21. Henry Wiggin and Company, Birmingham, England, "The Nimonic Alloys".Handbook.
22. Howard C. Cross and Ward F. Simmons, "Heat Resisting Metals for GasTurbine Parts*, Symposium on Materials for Gas Turbines. AmericanSociety for Testing Materials, 1946.
23. G. J. Guarnieri, "Part 3. Intermittent Stressing and Heating Testsof Aircraft Structural Metals', WADC Technical Report 53-24 Part 3.
WADC TR 53-336 Pt 4 90