4q 2016 investment outlook
TRANSCRIPT
1Q 2018 Investment Outlook
17 Jan 2018
Page 1, Total 30 Pages
Highlight 2017 has been a remarkable year of accelerated growth in developed market, revived growth in emerging market and the start of the reversal of accommodative monetary policy of various central banks. Catching up of Europe and emerging economies should provide a synchronized and steady growth of global markets.
Global Markets The outlook of developed market in 2018 has generally improved by the catching up of Europe and Japan economy. We believed Europe and Japan markets have more upside potential, while technology and financial sectors should also outperform.
HK/China Markets China A shares market is forecasted to outperform HSI and HSCEI, with drivers include gradual increase in margin financing level and the inclusion of A shares into MSCI Emerging Markets index. We believe HSI will float in between 29,000 – 32,000 points for Q1, with sector rotation being a main theme riding on mainland policies and economics figures.
Fixed Income Markets 10-yr Treasury Yield has broken through 2.5% level after staying above 2.4% last year end. Given the rising inflation concerns, we expect 10-yr Treasury Yield will test the 52-week high of 2.6% in the short run and prefer to shorten the bond portfolio duration in order to minimize the relevant interest rate risk.
Forex Markets On FX, we believe USD would trade broadly in range with major currencies with tests on the weak side. Commodity currencies could be a bright spot in 2018 in view of increase in global economic activity and the ramping up in oil and industrial metal price.
INVESTMENT OUTLOOK
Third Quarter 2003
Internal Use Only
JULY 2003

1Q 2018 Investment Outlook
17 Jan 2018
Page 2, Total 30 Pages
Executive Summary 3
Equities
US 5
Emerging Markets (EM) 7
Europe 9
Japan 11
China / Hong Kong 13
Global Bond Market 20
Currencies
AUD 22
CAD 23
GBP EUR
24 25
WTI
27
CO
NTE
NTS

1Q 2018 Investment Outlook
17 Jan 2018
Page 3, Total 30 Pages
EXECUTIVE SUMMARY Investment Analysis
Asset Class 1Q 2018
US equities = European equities =/+ Japanese equities =/+ Hong Kong China equities = Emerging market equities =/+ DM Corporate Bonds = EM Sovereign bonds = Asian bonds =/+ Commodity currencies + Gold =
“Red” means changes have been made recently
Symbol representation:
=/+ Neutral with a Positive bias
=/- Neutral with a Negative bias
+ Positive
- Negative
= Neutral
2017 has been a remarkable year of accelerated
growth in developed market, revived growth in emerging market and the start of the reversal of accommodative monetary policy of various central banks. Catching up of Europe and emerging economies should provide a synchronized and steady growth of global markets.
The outlook of developed market in 2018 has generally improved by the catching up of Europe and Japan economy. We believed Europe and Japan markets have more upside potentials, while technology and financial sectors should also outperform.
China A share market is forecasted to outperform
HSI and HSCEI, with drivers including gradual increase in margin financing level and the inclusion into MSCI Emerging Markets index. We believe HSI will float in between 29,000 – 32,000 points for Q1, with sector rotation being a main theme riding on mainland policies and economics figures.
10-yr Treasury Yield has broken through 2.5% level after staying above 2.4% last year end. Given the rising inflation concerns, we expect 10-yr Treasury Yield will test the 52-week high of 2.6% in the short run and prefer to shorten the bond portfolio duration in order to minimize the relevant interest rate risk.
On FX, we believe USD would trade broadly in range with major currencies with tests on the weak side. Commodity currencies could be a bright spot in 2018 in view of increase in global economic activity and the ramping up in oil and industrial metal price.
2017 has been a remarkable year of accelerated growth in developed market, revived growth in
emerging market and the start of the reversal of accommodative monetary policy of various central
banks. It is a sign of improved global economy; it is also a sign of new challenges set to investors.
Whether a lower for longer inflation might be a surprise on the upside, and whether high valuation of
global equities will be well justified by solid earnings are the core questions to the outperformance of
global markets. While the catching up of Europe and emerging economies should provide a
synchronized and steady growth of global markets, political risk, protectionism and central bank policy
error could still be the headwind of the journey to 2018.
The outlook of developed market in 2018 has generally improved by the catching up of Europe and
Japan economy. US market has been supported by fiscal policies include the tax plan and proposed
infrastructure plan. Europe showed signs of full expansion including a rapid decrease in employment
rate, historical high PMIs and a domestic demand growth mirroring the high growth period a decade

1Q 2018 Investment Outlook
17 Jan 2018
Page 4, Total 30 Pages
ago. Japan has revived growth by a consecutive 7-quarter expansion, a 10-year high of Japan’s big
manufacturers’ confidence and a potential reform from Prime Minister Abe. Of the 3 major regions of
developed markets, we believed Europe and Japan markets have more upside potentials, while
technology and financial sectors should also outperform board market in view of stronger earnings
growth at the current stage of economic cycle.
Emerging markets are expected to outperform developed markets, firstly due to an expected stable
and gradual declining strength of US dollar. Another reason is the pick-up in emerging markets’
growth. IMF has expected the differential of growth between developed and emerging markets to be
widened again by second half of 2018, implying the trend of narrowing difference between the two’s
growth has come to an end since 2013. We particularly keep a close eye on South Korea, due to its
low valuation, a dominant position in global IT industry and the investor-friendly reform of Chaebol
from the new president Moon.
China A shares market is forecasted to outperform HSI and HSCEI, with drivers including gradual
increase in margin financing level and the inclusion into MSCI Emerging Markets index. We believe
HSI will float in between 29,000 – 32,000 points for Q1, with sector rotation being a main theme riding
on mainland policies and economics figures. We prefer Macau gaming sector and Chinese brokerage
sector. Local bank sector is another favorite, thanks to the continuous loan demand from China
enterprises and the higher short term yield on HKD that is observed recently by US interest rate hike.
Finally, Chinese auto firms are also our focus due to strong demand in high margin SUVs and luxury
vehicles.
10-yr Treasury Yield has broken through 2.5% level after staying above 2.4% last year end. Given the
rising inflation concerns, we expect 10-yr Treasury Yield will test the 52-week high of 2.6% in the short
run and prefer to shorten the bond portfolio duration in order to minimize the relevant interest rate risk.
In global high yield space, US high yield would be a choice for diversification as the fundamentals of
US high yield bonds are improving and tax reform could enhance US corporate’s profitability and
optimize their financial data and eventually provide support on their bond prices.
On FX, we believe USD would trade broadly in range with major currencies with tests on the weak
side. Commodity currencies could be a bright spot in 2018 in view of increase in global economic
activity and the ramping up in oil and industrial metal prices. Europe's political uncertainty should
largely be settled after Italy’s election that is expected to happen on first week of March. With the faster
economic activity growth in EU than other developed countries, EUR could test 1.25 on dollar
afterwards. On the other hand, JPY is believed to be the weakest among all due to its ongoing
accommodate monetary policies and comparatively weaker economic growth with other developed
countries.
1Q 2018 Investment Outlook
17 Jan 2018
Page 5, Total 30 Pages
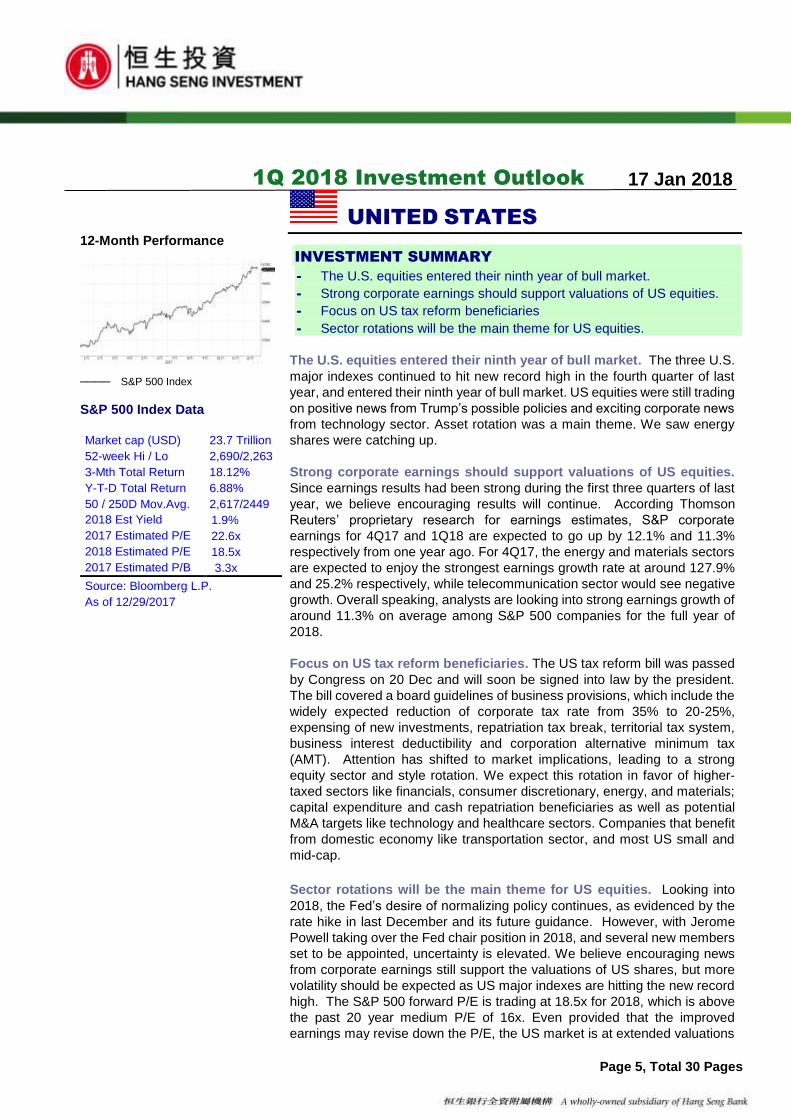
12-Month Performance
──── S&P 500 Index
S&P 500 Index Data
Market cap (USD) 23.7 Trillion
52-week Hi / Lo 2,690/2,263
3-Mth Total Return 18.12%
Y-T-D Total Return 6.88%
50 / 250D Mov.Avg. 2,617/2449
2018 Est Yield 1.9%
2017 Estimated P/E 22.6x
2018 Estimated P/E 18.5x
2017 Estimated P/B 3.3x
Source: Bloomberg L.P.
As of 12/29/2017
UNITED STATES
INVESTMENT SUMMARY
- The U.S. equities entered their ninth year of bull market.
- Strong corporate earnings should support valuations of US equities.
- Focus on US tax reform beneficiaries
- Sector rotations will be the main theme for US equities.
The U.S. equities entered their ninth year of bull market. The three U.S.
major indexes continued to hit new record high in the fourth quarter of last
year, and entered their ninth year of bull market. US equities were still trading
on positive news from Trump’s possible policies and exciting corporate news
from technology sector. Asset rotation was a main theme. We saw energy
shares were catching up.
Strong corporate earnings should support valuations of US equities.
Since earnings results had been strong during the first three quarters of last
year, we believe encouraging results will continue. According Thomson
Reuters’ proprietary research for earnings estimates, S&P corporate
earnings for 4Q17 and 1Q18 are expected to go up by 12.1% and 11.3%
respectively from one year ago. For 4Q17, the energy and materials sectors
are expected to enjoy the strongest earnings growth rate at around 127.9%
and 25.2% respectively, while telecommunication sector would see negative
growth. Overall speaking, analysts are looking into strong earnings growth of
around 11.3% on average among S&P 500 companies for the full year of
2018.
Focus on US tax reform beneficiaries. The US tax reform bill was passed
by Congress on 20 Dec and will soon be signed into law by the president.
The bill covered a board guidelines of business provisions, which include the
widely expected reduction of corporate tax rate from 35% to 20-25%,
expensing of new investments, repatriation tax break, territorial tax system,
business interest deductibility and corporation alternative minimum tax
(AMT). Attention has shifted to market implications, leading to a strong
equity sector and style rotation. We expect this rotation in favor of higher-
taxed sectors like financials, consumer discretionary, energy, and materials;
capital expenditure and cash repatriation beneficiaries as well as potential
M&A targets like technology and healthcare sectors. Companies that benefit
from domestic economy like transportation sector, and most US small and
mid-cap.
Sector rotations will be the main theme for US equities. Looking into
2018, the Fed’s desire of normalizing policy continues, as evidenced by the
rate hike in last December and its future guidance. However, with Jerome
Powell taking over the Fed chair position in 2018, and several new members
set to be appointed, uncertainty is elevated. We believe encouraging news
from corporate earnings still support the valuations of US shares, but more
volatility should be expected as US major indexes are hitting the new record
high. The S&P 500 forward P/E is trading at 18.5x for 2018, which is above
the past 20 year medium P/E of 16x. Even provided that the improved
earnings may revise down the P/E, the US market is at extended valuations

1Q 2018 Investment Outlook
17 Jan 2018
Page 6, Total 30 Pages
compared to its historical average and to other developed market equities.
We believe sector rotations will be the main theme for the US markets.
Sector Outlooks Financials (+) The financial sector benefited from asset rotation before last
year end, on positive news as a beneficiary from the new tax reform. But the
sector has been volatile, largely reacting to changes in yields. We saw the dip
in yields and the flattening of the yield curve during the second half of last year
hurt financials. We believe a tight labor market and solid economic growth
should result in a steeper yield curve over time. We therefore see financials
might out-perform the other sectors in the current Fed’s tapering and slowly
tightening cycle. Overall, growing financial strength among most financial
institutions, improving consumer finances, and reduced regulatory should add
to the positives in the financial sector.
Healthcare/Biotechnology (=/+) Healthcare sector is expected to benefit
from the tax reform. The final bill includes a tax rebate for the repatriation of
cash held overseas, which could lead healthcare companies to engage in
M&A activities. Biopharmaceutical companies are thus a key beneficiary.
Valuations of biotechnology shares also appear fair at their historical average.
Healthcare companies’ balance sheets are solid and shares thus have good
dividend yields. Long term story of high demand on healthcare products and
services as a result of aging population still intact.
Technology (+) Although tax reform has limited impact to technology sector,
as tech companies pay lower effective tax rate at around 27% on average, we
see cash repatriation to be positive drivers for the sector. We also see no
fundamental change to majority of the tech companies and continue to hold
our positive outlook on the sector. Technology companies' balance sheets are
strong, which could support mergers, share buybacks, increasing dividend
payments, and other activities that enhance earnings. Also, corporates likely
have underinvested in technology upgrades during the past few years and
may be poised to increase their investment in information technology.
Additionally, business confidence has improved and the potential for cash
repatriation could provide a boost to the sector.
Energy (=/+) Apparent discipline among oil producers have helped the energy
sector, although questions remain as to how long that can last. We see there
are pros and cons of the oil story. Tighter supply from oil producers and higher
demand from global growth help to support oil prices. But we don’t think
growth will rise to the point of producing a spike in the need for oil, thus our
long term view to the sector is neutral. But short-term, refiners will be able to
deduct their capital expenditures from taxable income immediately, as per the
provisions of the tax reform bill. Thus there are short-term catalysts for
refiners that are likely to experience a jump in their potential earnings because
of the tax reform.
Risk Considerations: 1) Uncertainty on Trump’s policy and tax reform, 2) China economic slowdown, 3) oil price volatility and 4) geopolitical threats in Europe, North Korea and the Middle East. 5) Faster-than-expected Fed rate hikes, or Fed brings confusing signals to the market in its normalization process, 6) strong USD affect U.S. competition.
1Q 2018 Investment Outlook
17 Jan 2018
Page 7, Total 30 Pages
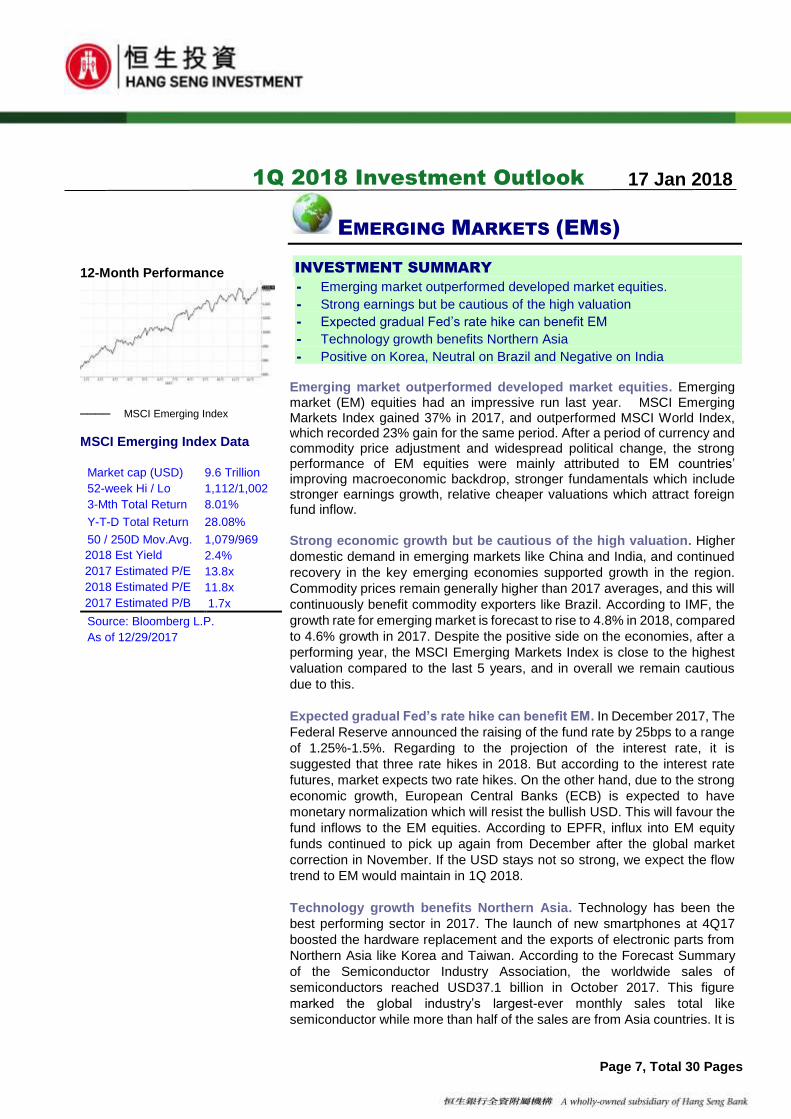
12-Month Performance
──── MSCI Emerging Index
MSCI Emerging Index Data
Market cap (USD) 9.6 Trillion
52-week Hi / Lo 1,112/1,002
3-Mth Total Return 8.01%
Y-T-D Total Return 28.08%
50 / 250D Mov.Avg. 1,079/969
2018 Est Yield 2.4%
2017 Estimated P/E 13.8x
2018 Estimated P/E 11.8x
2017 Estimated P/B 1.7x
Source: Bloomberg L.P.
As of 12/29/2017
EMERGING MARKETS (EMS)
INVESTMENT SUMMARY
- Emerging market outperformed developed market equities.
- Strong earnings but be cautious of the high valuation
- Expected gradual Fed’s rate hike can benefit EM
- Technology growth benefits Northern Asia
- Positive on Korea, Neutral on Brazil and Negative on India Emerging market outperformed developed market equities. Emerging market (EM) equities had an impressive run last year. MSCI Emerging Markets Index gained 37% in 2017, and outperformed MSCI World Index, which recorded 23% gain for the same period. After a period of currency and commodity price adjustment and widespread political change, the strong performance of EM equities were mainly attributed to EM countries’ improving macroeconomic backdrop, stronger fundamentals which include stronger earnings growth, relative cheaper valuations which attract foreign fund inflow.
Strong economic growth but be cautious of the high valuation. Higher
domestic demand in emerging markets like China and India, and continued
recovery in the key emerging economies supported growth in the region.
Commodity prices remain generally higher than 2017 averages, and this will
continuously benefit commodity exporters like Brazil. According to IMF, the
growth rate for emerging market is forecast to rise to 4.8% in 2018, compared
to 4.6% growth in 2017. Despite the positive side on the economies, after a
performing year, the MSCI Emerging Markets Index is close to the highest
valuation compared to the last 5 years, and in overall we remain cautious
due to this.
Expected gradual Fed’s rate hike can benefit EM. In December 2017, The
Federal Reserve announced the raising of the fund rate by 25bps to a range
of 1.25%-1.5%. Regarding to the projection of the interest rate, it is
suggested that three rate hikes in 2018. But according to the interest rate
futures, market expects two rate hikes. On the other hand, due to the strong
economic growth, European Central Banks (ECB) is expected to have
monetary normalization which will resist the bullish USD. This will favour the
fund inflows to the EM equities. According to EPFR, influx into EM equity
funds continued to pick up again from December after the global market
correction in November. If the USD stays not so strong, we expect the flow
trend to EM would maintain in 1Q 2018.
Technology growth benefits Northern Asia. Technology has been the
best performing sector in 2017. The launch of new smartphones at 4Q17
boosted the hardware replacement and the exports of electronic parts from
Northern Asia like Korea and Taiwan. According to the Forecast Summary
of the Semiconductor Industry Association, the worldwide sales of
semiconductors reached USD37.1 billion in October 2017. This figure
marked the global industry’s largest-ever monthly sales total like
semiconductor while more than half of the sales are from Asia countries. It is

1Q 2018 Investment Outlook
17 Jan 2018
Page 8, Total 30 Pages
expected to have high-single digit growth in 1Q 2018 and this should benefit
the Northern Asia technology exporters.
Market Outlook South Korea (+) South Korea‘s export recovery has exceeded market expectation. The export volume kept rising for 10 months from November last year. On the back of robust demand for automobiles and semiconductors, the export volume index went up 8.5% from the same month of last year. On the other hand, the Moon’s government formulated a supplementary budget of KRW 11T in 2nd quarter. The expansionary fiscal policy supported Korea’s GDP growth. Driven by strong export momentum and improved performance in the financial and construction sectors, Korea companies net earnings are expected to jump more than 50% in 2017, with tech sector surge more than 100% in net earnings. The valuation of Korea equities is very attractive, trading at 9.6x P/E, under its long term average and peers in EM market. Brazil (=) The Brazilian Government raised its forecast for 2018 GDP growth from 2.0% to 3.0%. The forecasts expected an improvement in economic activity, a reduction in corporate debt, and higher consumption. In December 2017, the Brazilian Central Bank (BCB) cut rates by 50bp to a record low of 7% and hinted there will be a further cut in February 2018. We expect the currently low inflation environment can allow the looser monetary policy to further support the domestic consumption and corporate growth. However, the vote of the pension reform has been suspended until February 2018. This reform is crucial to the Brazil’s surging public debt and if it may face more push back as 2018 is an election year for President. We remain neutral and cautious to Brazil equities. India (-) The Sensex and Nifty Indexes gained slowly in 4Q 2017 due to a slowdown of the economy by the implementation of the goods and services tax (GST) on July2017. The Asian Development Bank has lowered India’s GDP outlook for the next fiscal year from March2018 from 7.4% to 7.3% due to the rising global crude oil prices and soft growth in private sector investment. A rebounding of the commodity prices have widened the 3Q 2017 current account deficit to 1.2% of GDP from 0.6% of the previous quarter. It also surged the India’s inflation to 4.9% in November2017 which soars above the Central Bank’s target of 4%. The Reserve Bank of India has cut the interest rate by 25bps in August 2017. The rising of inflation has lowered the possibility of further rate cut. On the valuation, the Indian equities are overpriced and are trading in an expected P/E over 21x which is well above its 10 years average and we maintained a negative outlook. Risk Considerations: 1) Political, liquidity, and currency risks, 2) Fluctuation on oil / commodity prices, 3) Further slowdown in China or U.S, 4) Unexpected tightening on Fed funds rate, 5) Strong USD 6) significant depreciation of CNY/CNH

1Q 2018 Investment Outlook
17 Jan 2018
Page 9, Total 30 Pages
12-Month Performance
──── Stoxx Europe 600 Index
Stoxx Europe 600 Index Data
Market cap (USD) 10.4 Trillion Market cap (EUR) 10.3 Trillion
52-week Hi / Lo 388.1/368.4 52-week Hi / Lo 388.1/368.4
3-Mth Total Return 17.70% 3-Mth Total Return 2.75%
Y-T-D Total Return 11.22% Y-T-D Total Return 10.52%
50 / 250D Mov.Avg. 389/381 50 / 250D Mov.Avg. 379/371
2018 Est Yield 3.5% 2017 Est Yield 3.3%
2017 Estimated P/E 20.8x 2017 Estimated P/E 16.1x
2018 Estimated P/E 15.1x 2018 Estimated P/E 14.8x
2017 Estimated P/B 1.9x 2017 Estimated P/B 1.8x
Source: Bloomberg L.P.
As of 12/29/2017
Source: Bloomberg L.P.
As of 09/29/2017
EUROPE
INVESTMENT SUMMARY
- European equities performed well in 2017.
- Growth in Eurozone economy has continued to surprise to the upside
- ECB is likely to remain its expansionary monetary policy.
- Italian election will be focused in 2018
- We revised our view on European equities to positive. European equities performed well in 2017. The Europe Stoxx 600 Index gained by 11.2% in EUR term but 26.8% in USD term. Although stronger Euro was a setback for export-oriented large caps during 2H17, small companies have been receiving supports benefit from economic recovery and improving earnings momentum. As the Brexit shock dissipates and Chancellor Angela Merkel won the German election, reduced political uncertainty should boost investment sentiment. Growth in Eurozone economy has continued to surprise to the upside. The Eurozone GDP expanded by 2.6% in the third quarter of 2017. Business and consumer confidence measures for most Eurozone’s major economies reach high levels. With unemployment rates now seeing at below 9% levels, it further proved the recovery in Eurozone is on momentum. We believe that unemployment rate still has significant room to decline before full employment would be achieved. This suggests that we will see continued strong overall growth in Eurozone. ECB is likely to remain its expansionary monetary policy. As expected, the European Central Bank (ECB) left the policy rates and monthly pace of asset purchases unchanged at its December meeting. But it has paved the way for policy normalization and will likely announce its asset purchase program to continue this year. Since Euro volatility is a concern, and inflation forecasts for the next two years will be slightly lower, we believe ECB is likely to remain a moderate monetary policy for a prolonged period of time, despite tapering talk is on schedule. Italian election will be focused in 2018. German Chancellor Angela Merkel’s coalition talk came to be a bit complex lately, but the market response has been muted as political uncertainty has not affect much the growth of the German economy. Market still has hope that Merkel will work closely with French President Macron in the European Union to strengthen the Franco-German alliance in the face of Brexit and other challenges. The major risk for Eurozone is Italy’s general election in March this year. Divisions on the Italian right are increasing the risk that a populist, euroskeptic government could take power after March’s election. We revised our view on European equities to positive. As valuations of US shares are overvalued, we see European shares would be another developed market option for investors looking for diversification. Trading at estimated PE ratios of 14.9x for 2018, European equities are not over-stretched. We prefer small to mid-cap as key beneficiaries from the cyclical economic recovery in the Eurozone and a stronger currency. Within Europe, our preference is German, French and Spanish equities.
1Q 2018 Investment Outlook
17 Jan 2018
Page 10, Total 30 Pages
Germany (+) The German economy’s growth remains above average, and unemployment in Germany is at less than 4% of the working population. The ZEW business surveys also pointed that business confidence in Germany is its 17 years’ highest levels. Even though Euro turned stronger during 2H17, currency impact has not affected much of Germany’s economic growth, as the GDP growth in last November hit 2.8%yoy, much higher than estimates. This robust momentum should help the euro-area's largest economy start 2018 on a strong footing. The German DAX Index is trading at 13x 2018 prospective PE, which is more attractive than its peers in the region. France (+) The election of Emmanuel Macron as French president has diminished political risks in France. The economic situation is getting better and France's overall competitiveness is showing signs of improvement. We believe reforms in areas of labor market, pension and wealth tax will continue to be catalysts for French equities, as these positive factors have not been fully priced in the equities yet. Also valuations are not too stretched with French equities trading at 14.6x forward PE.
Italy (-) Since Matteo Renzi tendered his resignation, a technocrat
government run by another member of Renzi’s party during this interim
period. Italy will face political risk when drawing close to new election in 2018.
While the Five Star Movement has already called for new elections following
the No vote, uncertainty is likely to continue. The Italian economy appears to
have grown at a moderate pace, with the manufacturing PMI rose from a
level of 50.9 in October to 52.2 in November, indicating a small uptick in
positive economic momentum. The unemployment rate however has
remained largely flat at around 11.5% since mid-2015.
Risk Considerations: 1) Economic slowdown in U.K. due to Brexit; 2) A significant stronger Euro; 3) Drag from US stocks on failure of US Trump reflation rally 4) Resurgence of tension with Russia; 5) Slowdown in emerging markets, especially China, or weaker-than-expected demand in major emerging markets; 6) Failures to act timely by the ECB on stimulus program

1Q 2018 Investment Outlook
17 Jan 2018
Page 11, Total 30 Pages
12-Month Performance
──── Nikkei 225 Index Nikkei 225 Index Data
Market cap (JPY) 408.8 Trillion
52-week Hi / Lo 22,939/18,335
3-Mth Total Return 11.97%
Y-T-D Total Return 21.29%
50 / 250D Mov.Avg. 22,491/20,197
2017 Est Yield 1.85%
2017 Estimated P/E 19.5x
2018 Estimated P/E 19.1x
2017 Estimated P/B 1.9x
Source: Bloomberg L.P.
As of 12/29/2017
Japan
INVESTMENT SUMMARY
- Japanese equities continue to receive support and fund flow
- BoJ will likely maintain its current easy monetary policy.
- Despite modest recovery, Japan’s inflation outlook is still a concern
- Favor cyclical sectors sensitive to the global economic growth
- We turned more positive on Japanese equities Japanese equities continue to receive support and fund flow. The Nikkei 225 Stock Average stood strong hovering between 22,000 and 23,000 points once it broke through key-resistance levels of 22,000 points. The capitalization-weighted Topix Index also stood strong between 1,740 and 1,800 levels. Fund flow turned more positive to Japanese equities, due to improving corporates’ better fundamentals and improving earnings momentum.
BoJ will likely maintain its current easy monetary policy. The political landscape has stabilized after the general election in October. Prime Minister Abe’s current political policies therefore are expected to maintain. Since policy uncertainty is now minimized in Japan, investors would expect Mr. Abe to successfully implement his policy package, which is different from that of other developed countries. As the BoJ is still not too optimistic on the country’s inflation outlook, it is believed that the BoJ will likely maintain its current easy monetary policy, yield curve control, and quantitative easing. PM Abe is likely to further stress on wage hike. Despite modest recovery, Japan’s inflation outlook is still a concern. Even though Japan’s economy is on track for the longest expansion in 16 years, Japan’s wage growth continues to be moderate, and inflation is still subdued remaining below its 2% target. Thanks to growth in corporate profitability, and earnings growth has gained momentum. The growth of corporate earnings in Japan shares a strong positive correlation with the growth of the world economy. With the ongoing recovery in the global economy, we expect growth in Japan’s corporate earnings to gain momentum Favor cyclical sectors sensitive to the global economic growth. Weak yen used to be strong driver for Japanese export-oriented equities. Going forward, changes in corporate fundamentals, management policies and growth strategies will likely attract the attention of investors to a greater degree than monetary and fiscal policy. We now favor economically sensitive sectors such as industrials, which is likely to benefit from a rise in capital investment; IT, which includes a large number of companies engaged in the manufacture and sale of electronic parts and IT equipment; and materials, which includes a plethora of companies engaged in high-tech materials and general materials-related businesses.
We turned more positive on Japanese equities. We turned more positive
on Japanese equities, mainly on compelling valuations compared to the US
and Europe. The Topix Index is trading at 14.6x prospective PE for 2018,
compared to its developed peers US and Europe trading at prospective PE
of 18.5x and 15.1x respectively. Japan’s economy and exports as well as
1Q 2018 Investment Outlook
17 Jan 2018
Page 12, Total 30 Pages
corporate profits have improved, even though USD/JPY were below 110
levels during the second half of last year. Recent fund flow information also
indicated that foreign investors’ confidence in Japanese equities turned
positive.
Risk Considerations: 1) Inability to implement structural and other
economic reforms; 2) Yen appreciation due to global risk-off sentiment; 3)
significant surge in JGB yield 4) fiscal deficits caused by delayed sales taxes
increase; 5) BOJ fails to enact further easing in order to boost inflation; 6)
China’s slow-down, as China is Japan’s second largest trading partner.

1Q 2018 Investment Outlook
17 Jan 2018
Page 13, Total 30 Pages
12-Month Performance
──── HS China Enterprise Index
HS China Enterprise Index Data
Market cap (HKD) 3.05Trillion 52-week Hi / Lo 12,101 /9,311 3-Mth Return +7.3% Y-T-D Return +29.6% 50 / 250 Mov.Avg. 11,558 /10,705 2017 Est Yield 3.6% 2017 Estimated P/E 9.1x 2018 Estimated P/E 7.9x 2017 Estimated P/B 1.05x
Source: Bloomberg L.P.
As of 12/29/2017
12-Month Performance
──── CSI 300 Index
CSI 300 Index Data
Market cap (RMB) 11.7Trillion 52-week Hi / Lo 4,261 / 3,264 3-Mth Total Return +5.1% Y-T-D Total Return +24.3% 50 / 250 Mov.Avg. 4,044 / 3,664 2017 Est Yield 1.8% 2017 Estimated P/E 16.5x 2018 Estimated P/E 13.5x 2017 Estimated P/B 2.05x
Source: Bloomberg L.P.
As of 12/29/2017
CHINA / HONG KONG
INVESTMENT SUMMARY - Guarding against financial risks will be the economy’s focus, while
sustained revival of manufacturing and exports can drive the economy - Earnings estimates of the Hang Seng Index to grow by about 10% in 2018 - Hong Kong stocks may experience a further influx of southbound and global
capital - Higher A share market liquidity should be favorable to short term market
liquidity
Guarding against financial risks will be the economy's focus, while sustained revival of manufacturing and exports can drive the economy. In 2018, guarding against financial risks will be the Chinese government's top priority. Tighter measures relating to containment of financial bubbles and deleveraging and environmental pollution control are expected. While China's short-term economic growth and corporate earnings may be affected, these measures are expected to be beneficial for long-term economic development.
Looking at economic fundamentals, China's real estate market has showed signs of cooling, with the phenomenon spreading from 1-2 tier cities to 3-4 tier cities. Real estate investment and sales are expected to slow down further in 2018, and only large-cap domestic real estate stocks will continue to benefit, from economies of scale and M&As. Only the manufacturing industry can recover continuously, while private enterprises would perform better due to strong market demand for high value-added products, industrial upgrades, mechanical automation and favorable policies. In 2018, the manufacturing industry is expected to continue the revival it saw in 2017.
There was a marked rebound in exports in 2017, as demand from both G3 and non-G3 countries increased. In addition, as market demand for mid-to-high end technology products rises, these products have become the main growth point of exports, enhancing the price and quality of China's export products. This trend is expected to continue in 2018.
Earnings estimates of the Hang Seng Index to grow by about 10% in 2018. In Hong Kong, valuations are mainly driven by corporate earnings growth and liquidity. Hang Seng Index (HSI) earnings grew 25% in 2017, markedly higher than market predictions at the beginning of the year. In addition, the daily average of southbound trading went from accounting for less than 3% of Hong Kong stock transactions in 2016 to approximately 5% in the first half of 2017, and rose to above 6% by 4Q. The strong growth of corporate earnings and southbound capital boosted HSI valuations in 2017, resulting in outstanding performance. As of now, the forward P/E ratio of the HSI in 2018 is approximately 12x. With the high base of earnings, markets expect HSI earnings will continue to grow by 10% in 2018. Unless corporate earnings once again exceed expectations considerably, we believe a substantial expansion of HSI valuations led by corporate earnings to be unlikely.
Hong Kong stocks may experience a further influx of southbound and global capital. Investors should pay attention to liquidity of stock markets. In
1Q 2018 Investment Outlook
17 Jan 2018
Page 14, Total 30 Pages
12-Month Performance
──── Hang Seng Index
Hang Seng Index Data
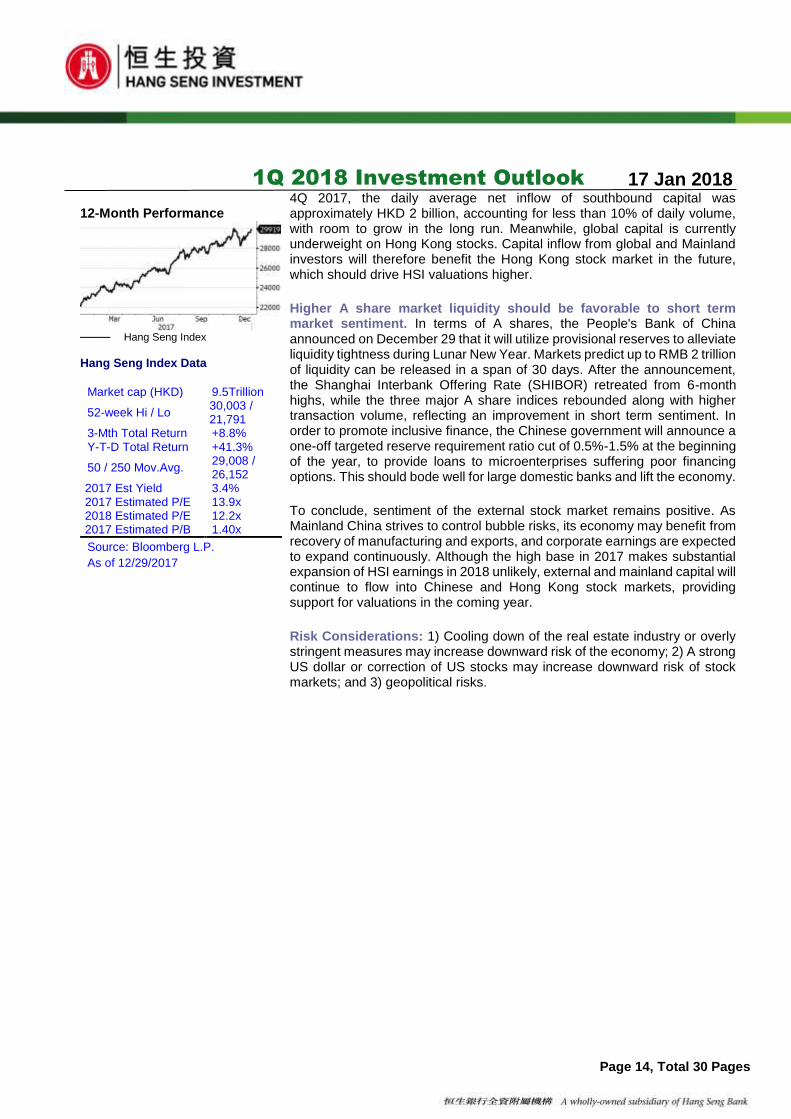
Market cap (HKD) 9.5Trillion
52-week Hi / Lo 30,003 / 21,791
3-Mth Total Return +8.8% Y-T-D Total Return +41.3%
50 / 250 Mov.Avg. 29,008 / 26,152
2017 Est Yield 3.4% 2017 Estimated P/E 13.9x 2018 Estimated P/E 12.2x 2017 Estimated P/B 1.40x
Source: Bloomberg L.P.
As of 12/29/2017
4Q 2017, the daily average net inflow of southbound capital was approximately HKD 2 billion, accounting for less than 10% of daily volume, with room to grow in the long run. Meanwhile, global capital is currently underweight on Hong Kong stocks. Capital inflow from global and Mainland investors will therefore benefit the Hong Kong stock market in the future, which should drive HSI valuations higher.
Higher A share market liquidity should be favorable to short term market sentiment. In terms of A shares, the People's Bank of China announced on December 29 that it will utilize provisional reserves to alleviate liquidity tightness during Lunar New Year. Markets predict up to RMB 2 trillion of liquidity can be released in a span of 30 days. After the announcement, the Shanghai Interbank Offering Rate (SHIBOR) retreated from 6-month highs, while the three major A share indices rebounded along with higher transaction volume, reflecting an improvement in short term sentiment. In order to promote inclusive finance, the Chinese government will announce a one-off targeted reserve requirement ratio cut of 0.5%-1.5% at the beginning of the year, to provide loans to microenterprises suffering poor financing options. This should bode well for large domestic banks and lift the economy.
To conclude, sentiment of the external stock market remains positive. As Mainland China strives to control bubble risks, its economy may benefit from recovery of manufacturing and exports, and corporate earnings are expected to expand continuously. Although the high base in 2017 makes substantial expansion of HSI earnings in 2018 unlikely, external and mainland capital will continue to flow into Chinese and Hong Kong stock markets, providing support for valuations in the coming year.
Risk Considerations: 1) Cooling down of the real estate industry or overly stringent measures may increase downward risk of the economy; 2) A strong US dollar or correction of US stocks may increase downward risk of stock markets; and 3) geopolitical risks.
1Q 2018 Investment Outlook
17 Jan 2018
Page 15, Total 30 Pages
China Sector Snapshot China Brokerage (Overweight) Although the performance of brokers is lagging in 2017, we find several investment catalysts for the sector in 2018. A share market turnover was flat but outstanding margin financing increased gradually in 2017. That means, investors’ confidence are on the increase. Moreover, members of Securities Association of China proposed to set a commission rate floor which will protect brokers' profit margin. Looking forward, A share inclusion to MSCI EM Index will trigger off institutionalization and internationalization of the sector. Also, the ramp up of Shanghai / Shenzhen Stock Connects and ETF Connects are also investment catalysts. Sector wise, we believe institutionalization and internationalization will accelerate consolidation in the sector. Brokers with institutional clients, internationalization business exposure, high quality of services, economic of scale and technical know-how will take advantages. Macau Gaming (Overweight) Macau Gross Gaming Revenue (GGR) turned to positive since Aug 2016. The growth rate record double-digit growth since Feb 2017. Macau 2017 GGR was up 19% yoy to MOP266bn, which is better than consensus estimated. The competitive advantages of Macau gaming sector is on the increase. Two new resort projects in Cotai were proposed to open in 2018. A new Cotai ferry terminal opened on 1 June, and Hong Kong – Zhuhai – Macao Bridge is also expected to open in 2018, which could increase the traffic flow and accessibility significantly. For VIP business, junkets are expanding with more VIP rooms and tables. For mass market business, gaming operators are developing its non-gaming businesses and (MICE) meetings, incentives, conferencing and exhibitions will be the direction. Also, the tourism facilities of Hengqin are under development and China government is planning to develop the Greater Bay Area, which will benefit Macau gaming sector. Thanks to the increasing China household disposal income, we believe the demand for high-end resort in Macau is rising. HK Banking (Overweight) US has raised Fed rate by 25 bps in Dec 2017. According to Bloomberg data on 29 Dec 2017, market expects Fed to raise rate by 2-3 times in 2018. 1-month and 3-month HIBOR jumped to 9-year high. HK banks are expected to be the major beneficiaries of the rate hike cycle as they could enjoy net interest margin expansion and higher earnings. According to HKMA figures, current account and saving account to total deposit ratio (CASA ratio) of licensed banks in HK reached 60%, the record high since 1997. Given the near-to-zero interest rate for current and saving account, domestic banks is enjoying cheap funding cost. Meanwhile, HK banks’ loans growth reached 21.7% yoy in Oct 2017, the highest growth rate since Feb 2014. The strong loan demand would drive banks’ interest income. On the other hand, HK banks maintained its good asset quality with only 0.45% of loans overdue >3months and rescheduled loans, the lowest level since Dec 2015. China auto (Overweight) The China Association of Automobile Manufacturers predicts that Mainland China's passenger vehicles market will grow by 3% YoY in 2018. While this is slower than 2017, luxury vehicles, SUVs and new energy vehicles will maintain rapid growth and remain the industry's growth points. Meanwhile, some automakers are collaborating with technology companies to develop vehicles with smart systems, which shall
1Q 2018 Investment Outlook
17 Jan 2018
Page 16, Total 30 Pages
alter the long term industry landscape. The Ministry of Finance and Ministry of Commerce have jointly announced measures for calculating average fuel consumption and new energy vehicle credits, encouraging traditional automakers to step up production of new energy vehicles. Despite the new measures postponing transactions of new energy vehicle credits to 2019, industry direction remains clear. New energy vehicle makers that commence research and development early are expected to generate extra income from credit transactions, thus reaping the greatest benefits. Environmental and gas sector (Overweight) During the Central Economic Work Conference, pollution reduction is one of the government’s major works in the next 3 years. We expect China government to introduce more measures to support environmental sector. Waste water treatment, waste-to-energy and wind power sectors are likely to attractive fund inflow. For wind power sector, curtailment rate has declined 4ppts yoy and 2ppts qoq in 3Q17. Curtailment rate for wind power is expected to further decline in 2018 given more local government’s implementation of minimum utilization hour policies. For gas sector, China gas consumption grew 18.7% yoy in 1-10M17, mainly driven by strong demand growth in industrial sector. Government has introduced “coal-to-gas conversions” campaign in rural area which would be the other gas growth driver in the coming years. Downstream gas distributors would be one of the major beneficiaries.
Rating Sectors Comments
Overweight
Brokerage
A share market turnover is stable and margin financing outstanding is rising means investors' confidence are improving. A share inclusion to MSCI Index will trigger off institutionalization and internationalization. Ramp up of Shanghai/Shenzhen Stock Connects, and the launch of ETF Connects are catalysts.
Macau Gaming
Gross Gaming Revenue (GGR) growth rate is trending upward. Two new resorts are expected to open in 2018. Hong Kong – Zhuhai – Macao Bridge is also expected to open in 2018, which could increase accessibility. Junkets are expanding their businesses and gaming operators are developing non-gaming facilities for mass market. The development of Greater Bay Area will create synergy with Macau.
HK Banks
Market forecasts US Fed to raise rate by further 2-3 times in 2018. HK banks’ net interest margin is likely to expansion during US rate hike cycle. Also, the strong loan demand would drive banks’ interest income, which in turn would boost their earnings growth.
Auto
Luxury brands, SUVs and new energy vehicles (NEV) are expected to maintain fast growth relative to the average growth of the industry. The upcoming NEV credit policy will bring additional trading income for NEV makers as opposed to traditional auto
1Q 2018 Investment Outlook
17 Jan 2018
Page 17, Total 30 Pages
makers who have yet to catch up on NEV production.
Environmental and Gas
During the Central Economic Work Conference, pollution reduction is one of the government’s major works in the next 3 years. We expect government to introduce more measures to support environmental sector. For gas sector, government has introduced “coal-to-gas conversions” campaign which would drive gas demand growth in the coming years. Downstream gas distributors would be one of the major beneficiaries.
Neutral
Oil
After the outperformance in 4Q17, we turned less positive on China oil sector. Although the OPEC’s extension of oil production cut would support the oil prices, we expect WTI crude oil prices to have limited upside potential. US shale oil production might increase which will cap the oil prices.
China banks
Stabilized China economic growth would ease banks’ NPL pressure. Asset quality is expected to improve in 2018. However, regulators are likely to further strengthen the regulation on banking sector, especially on off-balance sheet asset. The tight regulation might result in continuous sluggish fee income growth. We expect large banks to outperform mid-sized bank.
Insurance
Yield of 10-year Chinese government bonds remains high, enhancing the return of re-investments by large insurance companies, while also reducing their reserve expense and thus leading to higher earnings. In addition, the strong performance of A shares can boost investment income. We are therefore positive on the sector over the mid-to-long term. However, promotional activities of life insurance companies at the beginning of last year were quite effective, leading to a higher income base and putting pressure on performance this year. Thus, premium income at the beginning of this year may be relatively weaker.
HK Property
HK residential market is in shortage. That said, global interest rate is on the upward cycle. Policy risks are on the increase. As such, we downgrade it from overweight to neutral ratings.
Infrastructure
Belt and Road Forum announced that China will launch ~RMB855.8bn investment and lending facilities, which we expect will help infrastructure and railway companies to develop overseas markets in the long run. That said, China FAI ytd was 7.3% only in Oct. More importantly, monetary tightening measures may negatively affect companies

1Q 2018 Investment Outlook
17 Jan 2018
Page 18, Total 30 Pages
with high gearing ratios. Public-Private-Partnership will be main growth driver for the sector. Yet, the cash conversion cycle is longer than traditional infrastructure projects. As such, we maintain NEUTRAL for this sector.
Consumer
In the sports apparel sector, retailers of leading brands enjoy greater economies of scale and inventory levels remain healthy, while internet shopping continues to grow rapidly, further enhancing penetration of such brands. Financially sound retailers are even able to make acquisitions overseas. Looking at the dairy industry, while the Chinese government has lowered import tax on infant powdered milk, it was mainly targeted at specially formulated products and had minimal effect on the key products of dairy companies. The industry continued to recover, achieving mid-single digit growth YoY. Leading companies are attempting to improve product structure by introducing more high-end dairy products, supporting the expansion of gross profit margins.
China Property
Some developers are revising up their 2018 sales target. Sector wise, consolidation will result in M&A, which will favour large scale developers. That said, policy risks remain major concern. Gearing ratio remained high in the sector. Also, property-related lending, including construction loans and mortgage, was tightened. For example, new mortgage loans net was down 27% yoy to RMB1.04tn in 3Q17. As such, we maintain NEUTRAL for the sector.
Pharmaceutical
China government is speeding up the approval of new drugs, while government also raised the entry barrier. Bio-equivalent test is required for generic drugs. It is expected that drug makers with strong R&D capability will gain market share in the long-run. We are positive on the quality drug makers. However, after recent share price rally, valuation of drug makers becomes unattractive.
TMT
As sales of the industry leader's flagship smartphone model were lower than expected, relevant smartphone orders may be significantly lower in 1Q of next year, which could affect orders of smartphone equipment manufacturers. While we are optimistic on the mid-to-long term prospects of equipment collectors, they face greater selling pressure in the short term. Internet companies have exceeded market expectations in terms of mobile games and
1Q 2018 Investment Outlook
17 Jan 2018
Page 19, Total 30 Pages
online advertising performance. With the industry maintaining rapid growth, some of these companies are intending to list their subsidiaries in Hong Kong this year, but valuations are not very attractive. Stock prices of telecommunication companies lagged the broader market last year, but the industry's improving fundamentals make them good defensive investments.
Basic materials
We turned less bearish on basic material sector after the underperformance in 4Q17. We expect basic material prices to be supported by supply-side reform, rising global demand and low USD. However, current valuation might be priced in the improving fundamental. Current risk-to-reward ratio is not attractive. Among basic materials, we relatively prefer aluminium sector as supply-side reform just started taking effect in aluminium industry. Potential risk includes short-term USD rebound.
Underweight IPP
As we expected that 3Q17 results of China IPP was disappointed, IPP sector largely underperformed the market in 4Q17. Although coal prices are unlikely to have large upside, we are still cautious on IPP’s weak fundamental. Rise in direct power sales will add downward pressure on their blended tariff. Market expects IPPs’ earnings to have significant rebound in 2018 which might be too optimistic.

1Q 2018 Investment Outlook
17 Jan 2018
Page 20, Total 30 Pages
10-Year US Treasury Yield stays above 2.4% Source: Bloomberg US Yield Curve is flattening Source: Bloomberg Growth of China and US PPI growth in sync in 2017
Source: Bloomberg
BONDS
Fed delivered a 25 bps rate hike as expected, together with the US Tax Reform being approved, US Treasury yield closed at relatively high level Fed announced in the December meeting to raise federal fund rate by 0.25% as widely expected and kept its forecast of the rate hike path unchanged in the coming three years, i.e. raising interest rate three times in 2018 and twice in both 2019 and 2020 respectively. It is noteworthy that while the central bank raised the economic growth and lowered the unemployment rate forecast at the meeting, there is no any adjustment to the future inflation outlook. Moreover, two Fed officials voted against the rate hike decision and the distribution of the dot plot is slightly moved down, reflecting that Fed did not incorporate the economic stimulus effect of tax reform into the consideration of accelerating its monetary tightening. This has given an excuse to push the US long dated treasury yield down after the FOMC meeting. However, US Tax Reform was approved just before Christmas and the markets worry US Government will issue more bonds to finance the worsening level of budget deficit. 10-year US Treasury yield has been pushed up above 2.4% at the year end. Market is observing whether the treasury yield curve will be further flattened. Recently, US short-term treasury yield kept rising and surged up at a faster pace since September as Fed continues its rate hike plan on track, but long-term yield moved sideways, leading to flattening yield curve. Currently, the 10-year and 2-year yield spread is narrowing to 10-year low of around 60bps. Market fears that it is a harbinger of a bear market when the yield curve is further flattening or even inverted. The 2-year treasury yield was higher than the 10-year yield ahead of each of the past seven recessions including the 2007 financial turmoil. However, after the meeting, Janet Yellen acknowledged the relationship between flattening and economic slowdowns, but claimed that correlation is not causation. She thought it is just a normal reaction to a tightening monetary policy and believed there is a very little chance of an economic decline in US. Shape of US treasury yield curve depends on the following factors. Firstly tightening policy of the global central banks. Currently the 10-year US treasury yield is almost 200bps below the level during 2007 financial turmoil, which contribute most for the short-term treasury yield to overcome the long-term treasury yield. However, investors should not overlook that this phenomenon is mainly due to the implementation of quantitative easing by Fed. Fed has now begun to reduce its balance sheet, indicating an official start of tightening policy. Although market still believes other central banks have not yet followed the pace of Fed and abundant capital flows pushed down the yield curve, some countries in fact have started following the steps. The People’s Bank of China has raised reverse repo rates in bid immediately after the Fed rate hike in March and December last year, which are samples for monetary tightening acts. Investors should pay attention to the stand of European Central Bank and Bank of Japan on the topic of tightening action. If they become more active in discussing the rate hike by this year end, long-term yield may rise and the yield curve may be steepened. Secondly global economic growth. Academically, the longer the bond’s tenor, the greater the risk to investor. When investors give up short-term bonds with higher returns and invest in longer tenor bonds with lower returns instead, they should be very worried about the possible cycle of interest rate cut
1Q 2018 Investment Outlook
17 Jan 2018
Page 21, Total 30 Pages
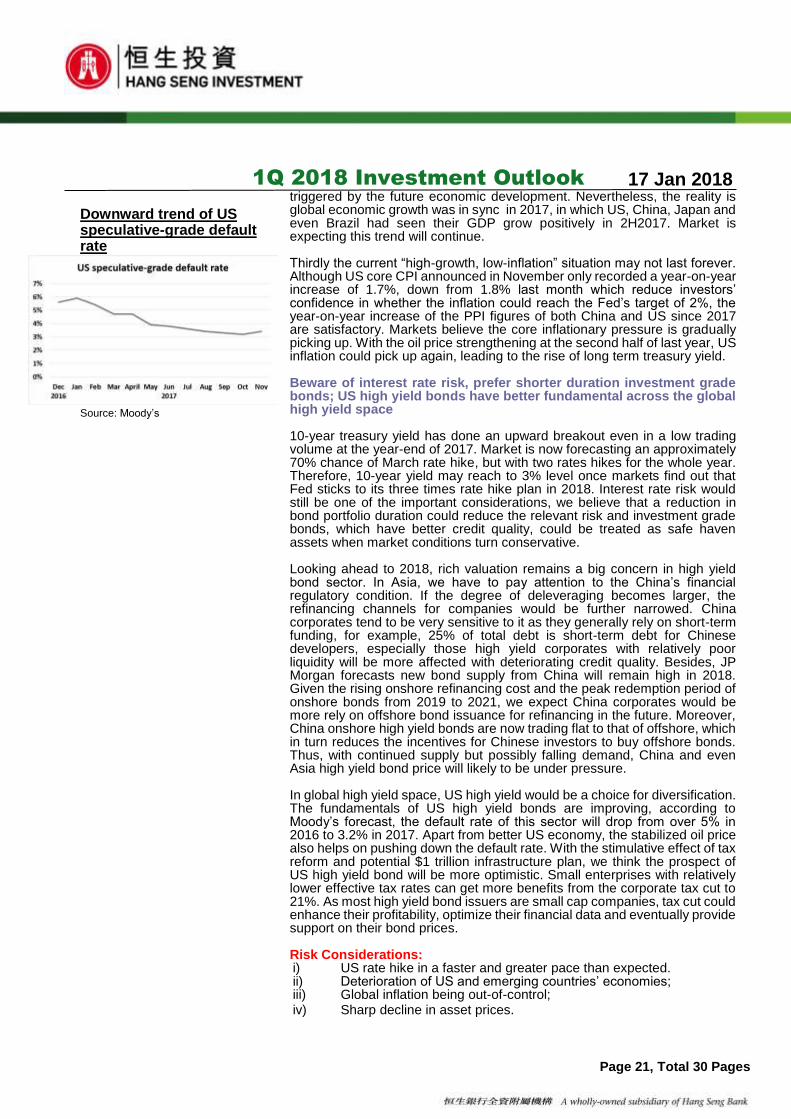
Downward trend of US speculative-grade default rate Source: Moody’s
triggered by the future economic development. Nevertheless, the reality is global economic growth was in sync in 2017, in which US, China, Japan and even Brazil had seen their GDP grow positively in 2H2017. Market is expecting this trend will continue. Thirdly the current “high-growth, low-inflation” situation may not last forever. Although US core CPI announced in November only recorded a year-on-year increase of 1.7%, down from 1.8% last month which reduce investors’ confidence in whether the inflation could reach the Fed’s target of 2%, the year-on-year increase of the PPI figures of both China and US since 2017 are satisfactory. Markets believe the core inflationary pressure is gradually picking up. With the oil price strengthening at the second half of last year, US inflation could pick up again, leading to the rise of long term treasury yield. Beware of interest rate risk, prefer shorter duration investment grade bonds; US high yield bonds have better fundamental across the global high yield space 10-year treasury yield has done an upward breakout even in a low trading volume at the year-end of 2017. Market is now forecasting an approximately 70% chance of March rate hike, but with two rates hikes for the whole year. Therefore, 10-year yield may reach to 3% level once markets find out that Fed sticks to its three times rate hike plan in 2018. Interest rate risk would still be one of the important considerations, we believe that a reduction in bond portfolio duration could reduce the relevant risk and investment grade bonds, which have better credit quality, could be treated as safe haven assets when market conditions turn conservative. Looking ahead to 2018, rich valuation remains a big concern in high yield bond sector. In Asia, we have to pay attention to the China’s financial regulatory condition. If the degree of deleveraging becomes larger, the refinancing channels for companies would be further narrowed. China corporates tend to be very sensitive to it as they generally rely on short-term funding, for example, 25% of total debt is short-term debt for Chinese developers, especially those high yield corporates with relatively poor liquidity will be more affected with deteriorating credit quality. Besides, JP Morgan forecasts new bond supply from China will remain high in 2018. Given the rising onshore refinancing cost and the peak redemption period of onshore bonds from 2019 to 2021, we expect China corporates would be more rely on offshore bond issuance for refinancing in the future. Moreover, China onshore high yield bonds are now trading flat to that of offshore, which in turn reduces the incentives for Chinese investors to buy offshore bonds. Thus, with continued supply but possibly falling demand, China and even Asia high yield bond price will likely to be under pressure. In global high yield space, US high yield would be a choice for diversification. The fundamentals of US high yield bonds are improving, according to Moody’s forecast, the default rate of this sector will drop from over 5% in 2016 to 3.2% in 2017. Apart from better US economy, the stabilized oil price also helps on pushing down the default rate. With the stimulative effect of tax reform and potential $1 trillion infrastructure plan, we think the prospect of US high yield bond will be more optimistic. Small enterprises with relatively lower effective tax rates can get more benefits from the corporate tax cut to 21%. As most high yield bond issuers are small cap companies, tax cut could enhance their profitability, optimize their financial data and eventually provide support on their bond prices. Risk Considerations: i) US rate hike in a faster and greater pace than expected. ii) Deterioration of US and emerging countries’ economies; iii) Global inflation being out-of-control; iv) Sharp decline in asset prices.
1Q 2018 Investment Outlook
17 Jan 2018
Page 22, Total 30 Pages
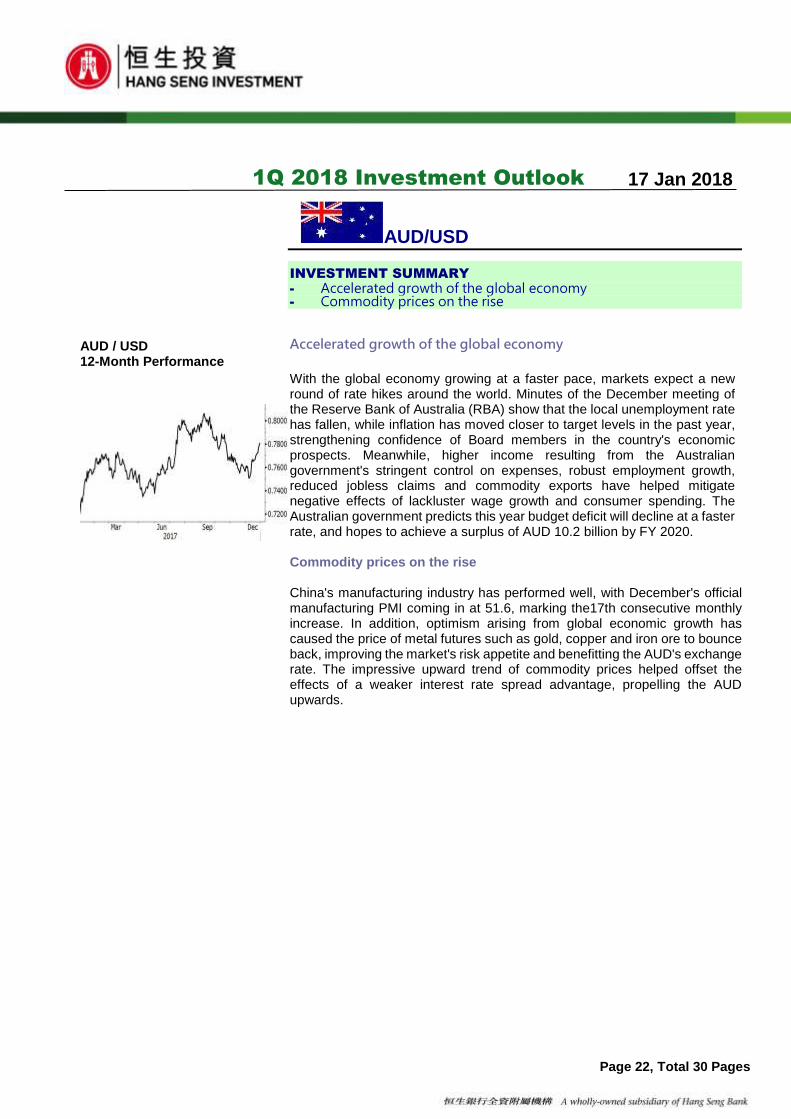
AUD / USD 12-Month Performance
AUD/USD
INVESTMENT SUMMARY
- Accelerated growth of the global economy - Commodity prices on the rise
Accelerated growth of the global economy
With the global economy growing at a faster pace, markets expect a new round of rate hikes around the world. Minutes of the December meeting of the Reserve Bank of Australia (RBA) show that the local unemployment rate has fallen, while inflation has moved closer to target levels in the past year, strengthening confidence of Board members in the country's economic prospects. Meanwhile, higher income resulting from the Australian government's stringent control on expenses, robust employment growth, reduced jobless claims and commodity exports have helped mitigate negative effects of lackluster wage growth and consumer spending. The Australian government predicts this year budget deficit will decline at a faster rate, and hopes to achieve a surplus of AUD 10.2 billion by FY 2020. Commodity prices on the rise China's manufacturing industry has performed well, with December's official manufacturing PMI coming in at 51.6, marking the17th consecutive monthly increase. In addition, optimism arising from global economic growth has caused the price of metal futures such as gold, copper and iron ore to bounce back, improving the market's risk appetite and benefitting the AUD's exchange rate. The impressive upward trend of commodity prices helped offset the effects of a weaker interest rate spread advantage, propelling the AUD upwards.

1Q 2018 Investment Outlook
17 Jan 2018
Page 23, Total 30 Pages
USD/CAD 12-Month Performance
USD/CAD
INVESTMENT SUMMARY
- Bank of Canada has not given up tightening policies - Opportunity exists within the crisis of NAFTA
Bank of Canada has not given up tightening policies
Wilkins, senior vice president of the Bank of Canada, said at last year's central bank's review meeting that over-cautious monetary policy may lead to instability in the financial markets. In addition, the BoC Governor Polotz pointed out on another occasion that as the local economy gradually improves, the reliance on loose monetary policy will also be reduced. These remarks clearly reflect that the Bank has not given up its tendency to tighten its policy in the future and increase market expectations of the interest rates hikes in the first quarter. Opportunity exists within the crisis of NAFTA The current North American Free Trade Agreement (NAFTA) negotiations are still in deadlock, the markets concern once the US withdrawn from the agreement, will pose a threat to Canada's economic and trade prospects. However, US targeted mainly the Mexican side, and Canada would not want Canadian dollar to be too weak,so that the trade surplus will not be big
enough to influence the decision of the US.
1Q 2018 Investment Outlook
17 Jan 2018
Page 24, Total 30 Pages
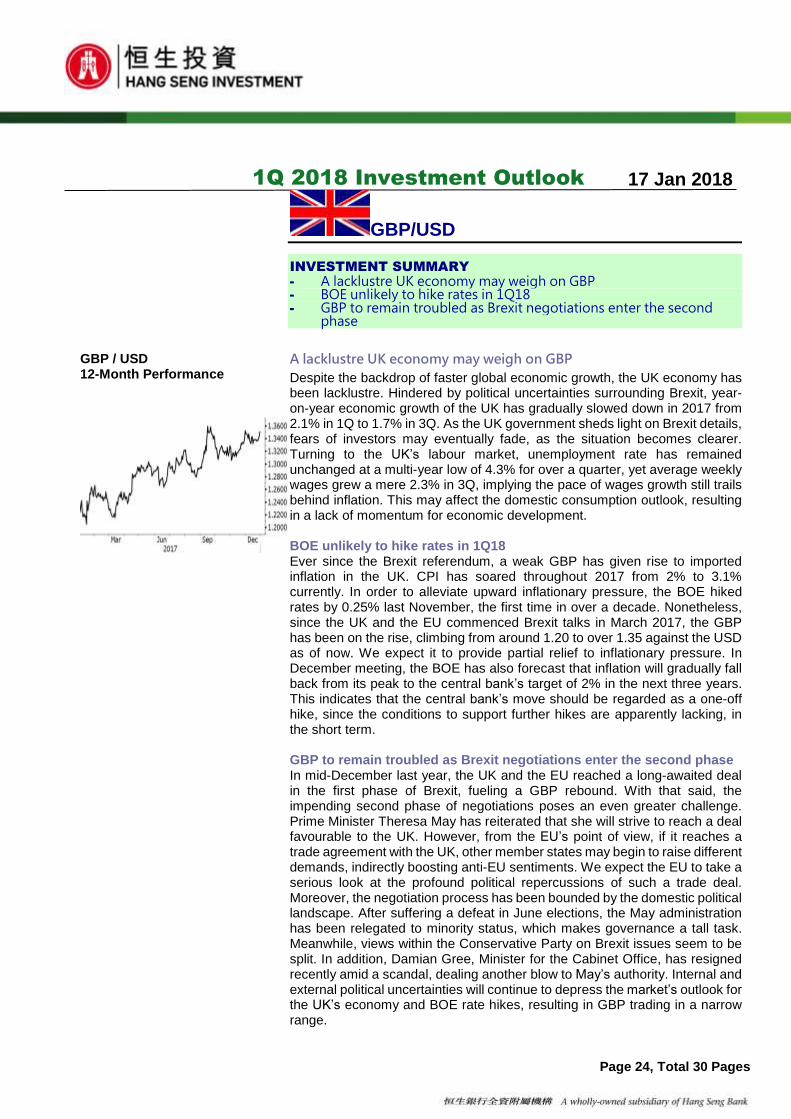
GBP / USD 12-Month Performance
GBP/USD
INVESTMENT SUMMARY
- A lacklustre UK economy may weigh on GBP - BOE unlikely to hike rates in 1Q18 - GBP to remain troubled as Brexit negotiations enter the second
phase
A lacklustre UK economy may weigh on GBP
Despite the backdrop of faster global economic growth, the UK economy has been lacklustre. Hindered by political uncertainties surrounding Brexit, year-on-year economic growth of the UK has gradually slowed down in 2017 from 2.1% in 1Q to 1.7% in 3Q. As the UK government sheds light on Brexit details, fears of investors may eventually fade, as the situation becomes clearer. Turning to the UK’s labour market, unemployment rate has remained unchanged at a multi-year low of 4.3% for over a quarter, yet average weekly wages grew a mere 2.3% in 3Q, implying the pace of wages growth still trails behind inflation. This may affect the domestic consumption outlook, resulting in a lack of momentum for economic development. BOE unlikely to hike rates in 1Q18 Ever since the Brexit referendum, a weak GBP has given rise to imported inflation in the UK. CPI has soared throughout 2017 from 2% to 3.1% currently. In order to alleviate upward inflationary pressure, the BOE hiked rates by 0.25% last November, the first time in over a decade. Nonetheless, since the UK and the EU commenced Brexit talks in March 2017, the GBP has been on the rise, climbing from around 1.20 to over 1.35 against the USD as of now. We expect it to provide partial relief to inflationary pressure. In December meeting, the BOE has also forecast that inflation will gradually fall back from its peak to the central bank’s target of 2% in the next three years. This indicates that the central bank’s move should be regarded as a one-off hike, since the conditions to support further hikes are apparently lacking, in the short term. GBP to remain troubled as Brexit negotiations enter the second phase In mid-December last year, the UK and the EU reached a long-awaited deal in the first phase of Brexit, fueling a GBP rebound. With that said, the impending second phase of negotiations poses an even greater challenge. Prime Minister Theresa May has reiterated that she will strive to reach a deal favourable to the UK. However, from the EU’s point of view, if it reaches a trade agreement with the UK, other member states may begin to raise different demands, indirectly boosting anti-EU sentiments. We expect the EU to take a serious look at the profound political repercussions of such a trade deal. Moreover, the negotiation process has been bounded by the domestic political landscape. After suffering a defeat in June elections, the May administration has been relegated to minority status, which makes governance a tall task. Meanwhile, views within the Conservative Party on Brexit issues seem to be split. In addition, Damian Gree, Minister for the Cabinet Office, has resigned recently amid a scandal, dealing another blow to May’s authority. Internal and external political uncertainties will continue to depress the market’s outlook for the UK’s economy and BOE rate hikes, resulting in GBP trading in a narrow range.

1Q 2018 Investment Outlook
17 Jan 2018
Page 25, Total 30 Pages
EUR / USD 12-Month Performance
EUR/USD
INVESTMENT SUMMARY
- ECB monetary policy already in tightening phase
- Markets factored in the positives of tax reforms and rate hikes
- Italian election risk likely to cap EUR performance ECB monetary policy already in tightening phase Strong economic growth and rebounding inflation in the Eurozone have provided favorable conditions for the monetary policy measures of the European Central Bank (ECB). Starting from January this year, the ECB will drastically cut its monthly asset purchases from €60 billion to €30 billion through September 2018. Although the ECB has stressed that the bond-purchasing program may be further extended or expanded if the Bank deemed necessary, central banks around the world have already ceased QEs and entered rate hike cycles. Both external and internal factors have exerted pressure on the ECB to accelerate its retreat from an ultra-loose monetary policy. Based on the latest projections by the ECB, Eurozone annual nominal inflation estimates for the next three years stand at 1.4%, 1.5% and 1.7% respectively, implying that inflation is expected to remain below the policy target of 2% throughout the period. Nonetheless, as ECB President Mario Draghi said in December last year, the latest data reflects that economic expansion has been gaining traction and the outlook for economic growth has improved significantly. It indicated that the ECB has regained confidence in a rebound in Eurozone inflation. Moreover, he emphasized that the ECB is concerned more about the factors driving inflation, rather than meeting an absolute target. In view of the steadily expanding Eurozone economy, market consensus is that the ECB will continue to wind down QE measures at a moderate pace. When the current bond purchasing programmer comes to an end, optimists expect the ECB to start discussing future rate hikes by the end of the year. Markets factored in the positives of tax reforms and rate hikes Although the Fed has already hiked rates thrice in 2017, the USD continues to lack upward momentum. Looking forward to 2018, markets continue to expect three rate hikes by the Fed, while revising upwards the full-year U.S. economic growth forecast for 2018 and 2019 from September estimates of 2.1% and 2.0% to 2.5% and 2.1% respectively. Fluctuations in interest rate futures reveal that the market odds of another rate hike in March have soared above 70%, yet only two rate hikes have been projected for the entire year. This indicates that investors are leaning toward a prudent stance in terms of the U.S. economy and employment outlook. On the other hand, markets have already factored in the positives of the tax reform proposed by U.S. President Trump. Moreover, actual benefits of tax cuts may not be realised in the short term and thus should provide little lift to a further rally of the USD.

1Q 2018 Investment Outlook
17 Jan 2018
Page 26, Total 30 Pages
Italian election risk likely to cap EUR performance
In Spain, the Catalan government held a referendum and declared independence unilaterally in October last year, resulting in Prime Minister Mariano Rajoy dissolving the parliament. By holding elections in December, the Spanish authorities attempted to curtail the pro-independence party’s influence from the parliament and end the independence movement. However, the pro-independence party ultimately secured an absolute majority of seats, indicating that the public opinion is still leaning towards independence. Meanwhile, Italian President Sergio Mattarella officially dissolved the parliament in December, paving way for general elections slated for March 4. According to the latest polls from numerous sources, the right wing, centre-left camp and the populist Five Star Movement are neck-to-neck in terms of popularity. As such, Italy may end up with a minority government, which would threaten the stability of its political landscape. Uncertainties surrounding the outlook for Italy’s elections are expected to weigh on the EUR, and its short-term upside is likely to be capped at around 1.21 against USD, last year’s high.
1Q 2018 Investment Outlook
17 Jan 2018
Page 27, Total 30 Pages
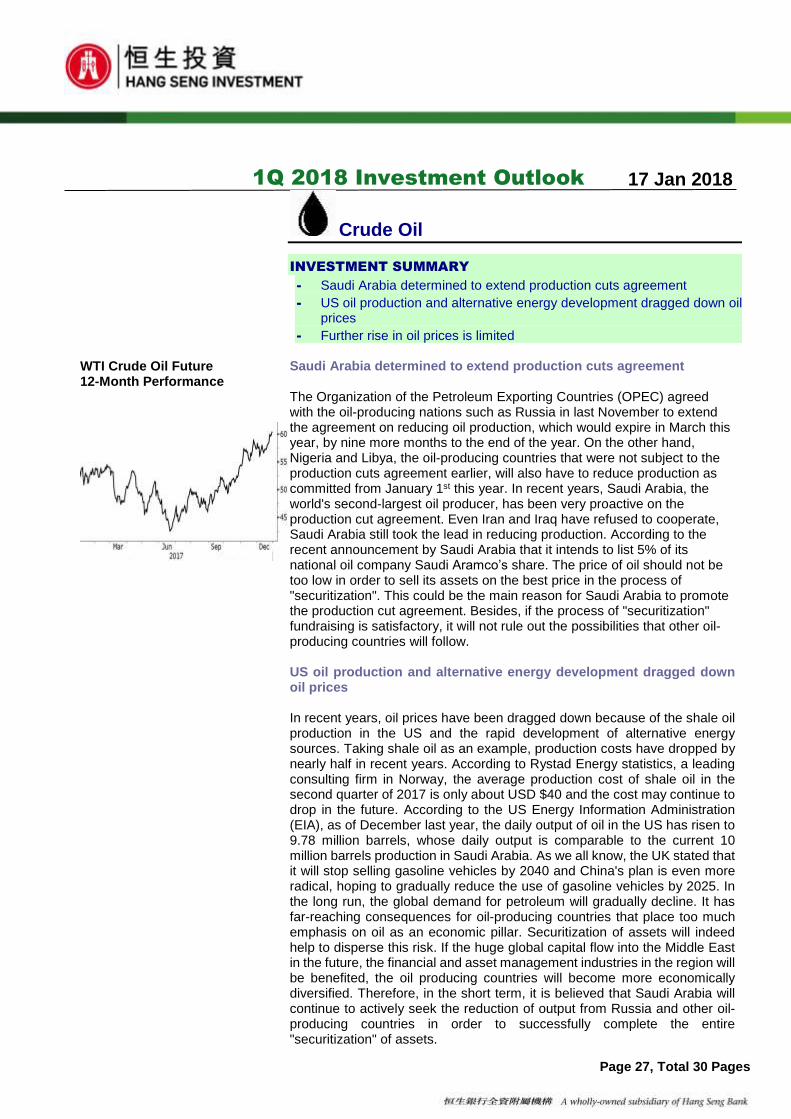
WTI Crude Oil Future 12-Month Performance
Crude Oil
INVESTMENT SUMMARY
- Saudi Arabia determined to extend production cuts agreement
- US oil production and alternative energy development dragged down oil prices
- Further rise in oil prices is limited Saudi Arabia determined to extend production cuts agreement The Organization of the Petroleum Exporting Countries (OPEC) agreed with the oil-producing nations such as Russia in last November to extend the agreement on reducing oil production, which would expire in March this year, by nine more months to the end of the year. On the other hand, Nigeria and Libya, the oil-producing countries that were not subject to the production cuts agreement earlier, will also have to reduce production as committed from January 1st this year. In recent years, Saudi Arabia, the world's second-largest oil producer, has been very proactive on the production cut agreement. Even Iran and Iraq have refused to cooperate, Saudi Arabia still took the lead in reducing production. According to the recent announcement by Saudi Arabia that it intends to list 5% of its national oil company Saudi Aramco’s share. The price of oil should not be too low in order to sell its assets on the best price in the process of "securitization". This could be the main reason for Saudi Arabia to promote the production cut agreement. Besides, if the process of "securitization" fundraising is satisfactory, it will not rule out the possibilities that other oil-producing countries will follow. US oil production and alternative energy development dragged down oil prices In recent years, oil prices have been dragged down because of the shale oil production in the US and the rapid development of alternative energy sources. Taking shale oil as an example, production costs have dropped by nearly half in recent years. According to Rystad Energy statistics, a leading consulting firm in Norway, the average production cost of shale oil in the second quarter of 2017 is only about USD $40 and the cost may continue to drop in the future. According to the US Energy Information Administration (EIA), as of December last year, the daily output of oil in the US has risen to 9.78 million barrels, whose daily output is comparable to the current 10 million barrels production in Saudi Arabia. As we all know, the UK stated that it will stop selling gasoline vehicles by 2040 and China's plan is even more radical, hoping to gradually reduce the use of gasoline vehicles by 2025. In the long run, the global demand for petroleum will gradually decline. It has far-reaching consequences for oil-producing countries that place too much emphasis on oil as an economic pillar. Securitization of assets will indeed help to disperse this risk. If the huge global capital flow into the Middle East in the future, the financial and asset management industries in the region will be benefited, the oil producing countries will become more economically diversified. Therefore, in the short term, it is believed that Saudi Arabia will continue to actively seek the reduction of output from Russia and other oil-producing countries in order to successfully complete the entire "securitization" of assets.

1Q 2018 Investment Outlook
17 Jan 2018
Page 28, Total 30 Pages
Further rise in oil prices is limited In the short to medium term, Europe and the US are in winter, which is the traditional season of peak demand for oil, supports the performance of oil prices. In addition, the global economy is improved while the economic performance and energy demand tends to be proportional. Europe's GDP in the third quarter accelerated at an annual rate of 2.5%, even higher than the same period in the US. As both the US and Europe are driving the global economy, it is conceivable that the economy will accelerate in the future and support the oil prices. It is expected that New York oil futures prices will still hover at USD $60 mark in short and medium term. However, it should be noted that if oil prices rise further, it may stimulate the US shale investors to increase their production after insuring that the costs are hedges and the profits are earned. It may also encourage oil-producing countries to increase their production and competing at the high price to increase profits, eventually lead to the abandon of the production reduction agreement.

1Q 2018 Investment Outlook
17 Jan 2018
Page 29, Total 30 Pages
Disclaimer HSIS Address : 13/F, Hang Seng Headquarter, 83 Des Voeux Road Central, Hong Kong
This document has been issued by Hang Seng Investment Services Limited (“HSIS”) for reference and information purposes
only. This document does not constitute, nor is it intended to be, nor should it be construed as any investment advice, offer or
solicitation to deal in any of the securities or investments mentioned herein. Re-distribution or adaptation in whole or in part of
this document by any means or in whatever form is strictly prohibited. This document is not intended for distribution to, or use
by, any person or entity in any jurisdiction or country where such distribution would be contrary to law or regulation.
The information contained in this document is based on sources which HSIS believes to be reliable but has not independently
verified. Any projections and opinions expressed herein are expressed solely as general market commentary and do not
constitute investment advice or guaranteed return. They represent the views of HSIS or the investment advisor(s) who wrote
this document at the time of publication and are subject to change without notice. No guarantee, representation, warranty or
undertaking, express or implied, is made as to the fairness, accuracy, timeliness, completeness or correctness of any
information, projections and/or opinions contained in this document and the basis upon which any such projections and/or
opinions have been made, HSIS and the relevant information providers accept no liability or responsibility in relation to the use
of or reliance on any such information, projections and/or opinions whatsoever contained in this document. Investors must make
their own assessment of the relevance, accuracy and adequacy of the information, projections and/or opinions contained in this
document and make such independent investigations as they may consider necessary or appropriate for the purpose of such
assessment.
HSIS is a subsidiary of Hang Seng Bank Limited which is part of the HSBC Group. Except as otherwise disclosed, HSIS has
no interest in the securities of the companies discussed in this document or member companies within the same group of such
companies as at the date of issuance of this document. Companies within the HSBC Group and/or their officers, directors and
employees may have positions in and may trade for their own account in all or any of the securities or investments mentioned
in this document. Companies within the HSBC Group may have provided investment services (whether investment banking or
non-investment banking related), may have underwritten, or may act as market maker in relation to these securities. Commission
or other fees may be earned by the HSBC Group in respect of the services provided by them relating to these securities or
investments.
The securities or investments referred to in this document may not be suitable for all investors. No consideration has been given
to any particular investment objectives or experience, financial situation or other needs of any recipient. Accordingly, no
representation is made with regard to the appropriateness of any of the securities and/or investments referred to herein for any
particular person’s circumstances. Investors must make investment decisions in light of their own investment objectives,
financial position and particular needs and where necessary consult their own professional advisers before making any
investment. This document is not intended to provide any investment advice and should not be relied upon in that regard.
Investment involves risks. Investors should note that value of securities and investments can go down as well as up and past
performance is not necessarily indicative of future performance. Foreign investments carry additional risks not generally
associated with investments in the domestic market, including but not limited to adverse changes in currency rate, foreign laws
and regulations. This document does not and is not intended to identify any or all of the risks that may be involved in the securities
or investments referred to herein. Investors should read and fully understand all the offering documents relating to such securities
or investments and all the risk disclosure statements and risk warnings therein before making any investment decisions.
The investment advisor(s) who prepared this document certifies(y) that the views expressed herein accurately reflect the
investment advisor’s(s’) personal views about the company(ies) or products covered therein and that no part of his/her/their
compensation was, is or will be directly or indirectly related to the specific views contained in this document.
© Copyright. Hang Seng Investment Services Limited. ALL RIGHTS RESERVED.
No part of this document may be reproduced, stored in a retrieval system, or transmitted, in any form or by any means, electronic,
mechanical, photocopying, recording or otherwise, without the prior written permission of Hang Seng Investment Services
Limited.
(HSIS 08/17)
1Q 2018 Investment Outlook
17 Jan 2018
Page 30, Total 30 Pages
Disclosures
Procedures are in place to identify and manage any potential conflicts of interest that arise in connection with the advisory
operations. HSIS’s investment advisors and its other staff who are involved in the preparation and dissemination of advisory
studies operate and have a management reporting line independent of HSBC Group’s investment banking business. Chinese
wall procedures are in place between the advisory business operations and other banking operations to ensure that any
confidential and price sensitive information is handled in an appropriate manner.
Investment advisor(s) is(are) paid in part by reference to the profitability of Hang Seng Bank Limited which includes brokerage
commission revenues.