4q10 disclosure and results
TRANSCRIPT
1March 22, 2011
Earnings Release Conference Call– 4Q10
Agenda
Ricardo Ribeiro Gontijo
Roberto Senna
CEO
4Q10 Highlights
Operating Highlights
2
COO
Carlos Wollenweber
CFO | IR
Operating Highlights
Financial Highlights
4Q10 Highlights
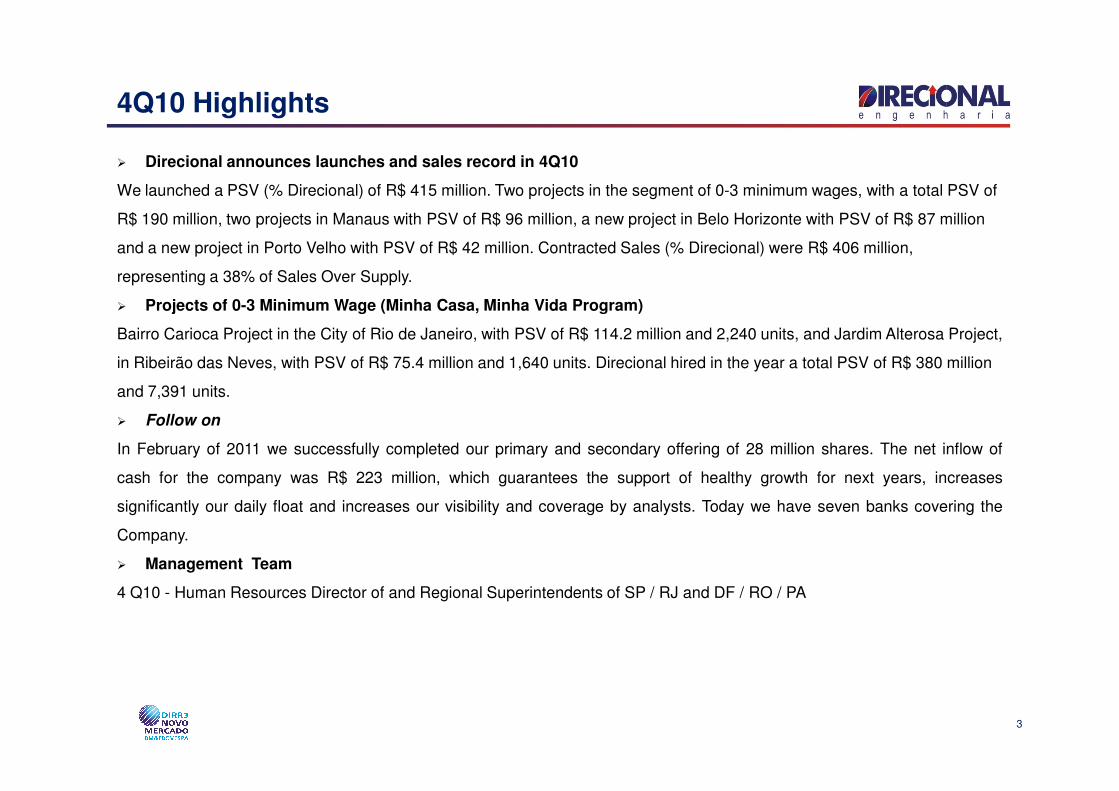
� Direcional announces launches and sales record in 4Q10
We launched a PSV (% Direcional) of R$ 415 million. Two projects in the segment of 0-3 minimum wages, with a total PSV of
R$ 190 million, two projects in Manaus with PSV of R$ 96 million, a new project in Belo Horizonte with PSV of R$ 87 million
and a new project in Porto Velho with PSV of R$ 42 million. Contracted Sales (% Direcional) were R$ 406 million,
representing a 38% of Sales Over Supply.
� Projects of 0-3 Minimum Wage (Minha Casa, Minha Vida Program)
Bairro Carioca Project in the City of Rio de Janeiro, with PSV of R$ 114.2 million and 2,240 units, and Jardim Alterosa Project,
in Ribeirão das Neves, with PSV of R$ 75.4 million and 1,640 units. Direcional hired in the year a total PSV of R$ 380 million
and 7,391 units.
3
and 7,391 units.
� Follow on
In February of 2011 we successfully completed our primary and secondary offering of 28 million shares. The net inflow of
cash for the company was R$ 223 million, which guarantees the support of healthy growth for next years, increases
significantly our daily float and increases our visibility and coverage by analysts. Today we have seven banks covering the
Company.
� Management Team
4 Q10 - Human Resources Director of and Regional Superintendents of SP / RJ and DF / RO / PA
Operating Highlights
Launches
Ricardo Ribeiro Gontijo Operating Highlights
4
� Launches
� Sales
� Land bank
� Inventory
Launches
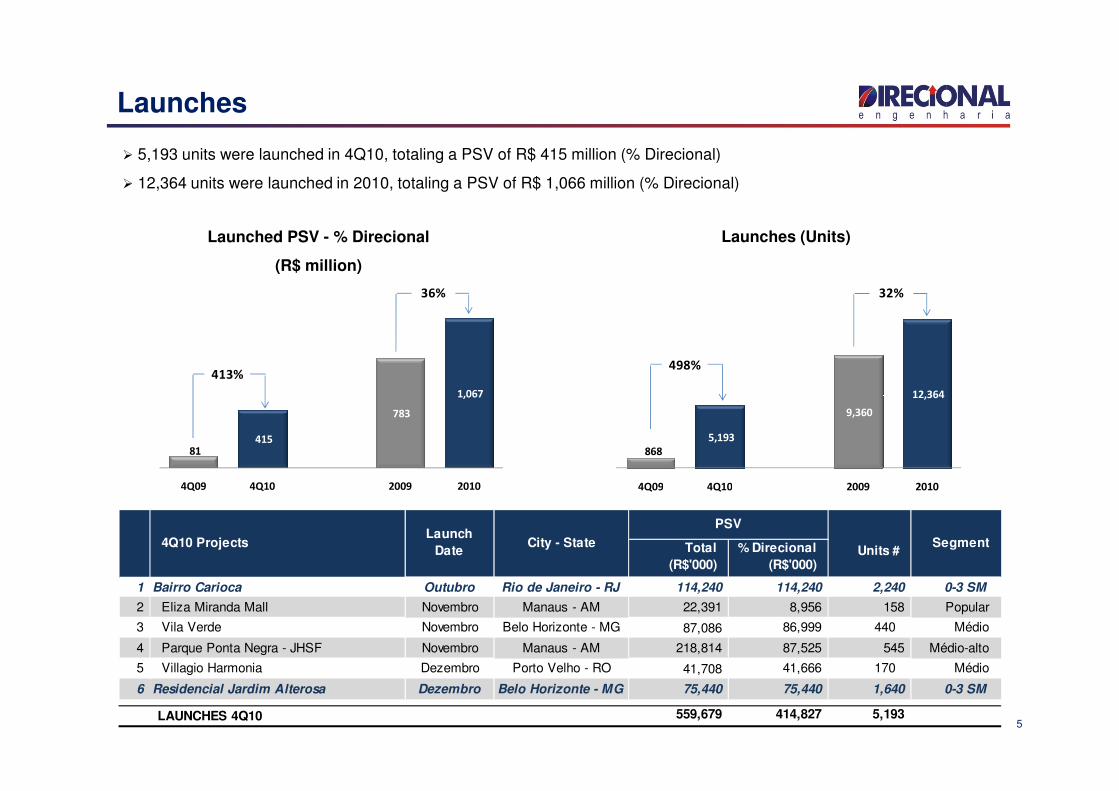
� 5,193 units were launched in 4Q10, totaling a PSV of R$ 415 million (% Direcional)
� 12,364 units were launched in 2010, totaling a PSV of R$ 1,066 million (% Direcional)
Launched PSV - % Direcional
(R$ million)
Launches (Units)
1,067
36%
413%
12,364
32%
498%
5
81 415
783
1,067
4Q09 4Q10 2009 2010
868
5,193
9,360
12,364
4Q09 4Q10 2009 2010
Total
(R$'000)
% Direcional
(R$'000)
1 Bairro Carioca Outubro Rio de Janeiro - RJ 114,240 114,240 2,240 0-3 SM
2 Eliza Miranda Mall Novembro Manaus - AM 22,391 8,956 158 Popular
3 Vila Verde Novembro Belo Horizonte - MG 87,086 86,999 440 Médio
4 Parque Ponta Negra - JHSF Novembro Manaus - AM 218,814 87,525 545 Médio-alto
5 Villagio Harmonia Dezembro Porto Velho - RO 41,708 41,666 170 Médio
6 Residencial Jardim Alterosa Dezembro Belo Horizonte - MG 75,440 75,440 1,640 0-3 SM
559,679 414,827 5,193
4Q10 ProjectsLaunch
DateCity - State Segment
Units #
LAUNCHES 4Q10
PSV
Launches Breakdown
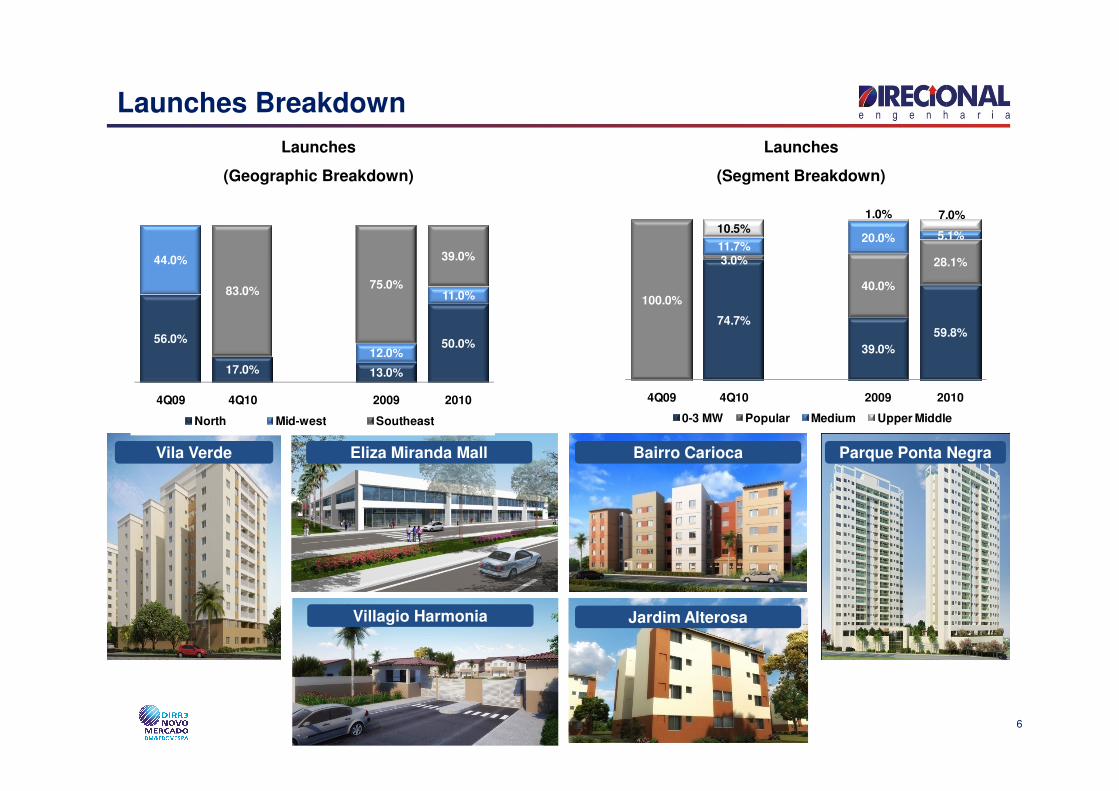
Launches
(Segment Breakdown)
Launches
(Geographic Breakdown)
56.0%
17.0% 13.0%
50.0%
44.0%
12.0%
11.0%83.0%75.0%
39.0%
4Q09 4Q10 2009 2010
74.7%
39.0%
59.8%
100.0%
3.0%
40.0%
28.1%
11.7%20.0% 5.1%
10.5%1.0% 7.0%
4Q09 4Q10 2009 2010
6
Vila Verde Parque Ponta NegraEliza Miranda Mall
Villagio Harmonia
Bairro Carioca
Jardim Alterosa
4Q09 4Q10 2009 2010
North Mid-west Southeast
4Q09 4Q10 2009 2010
0-3 MW Popular Medium Upper Middle
Sales
Contracted PSV - % Direcional (R$ million) Contracted Units
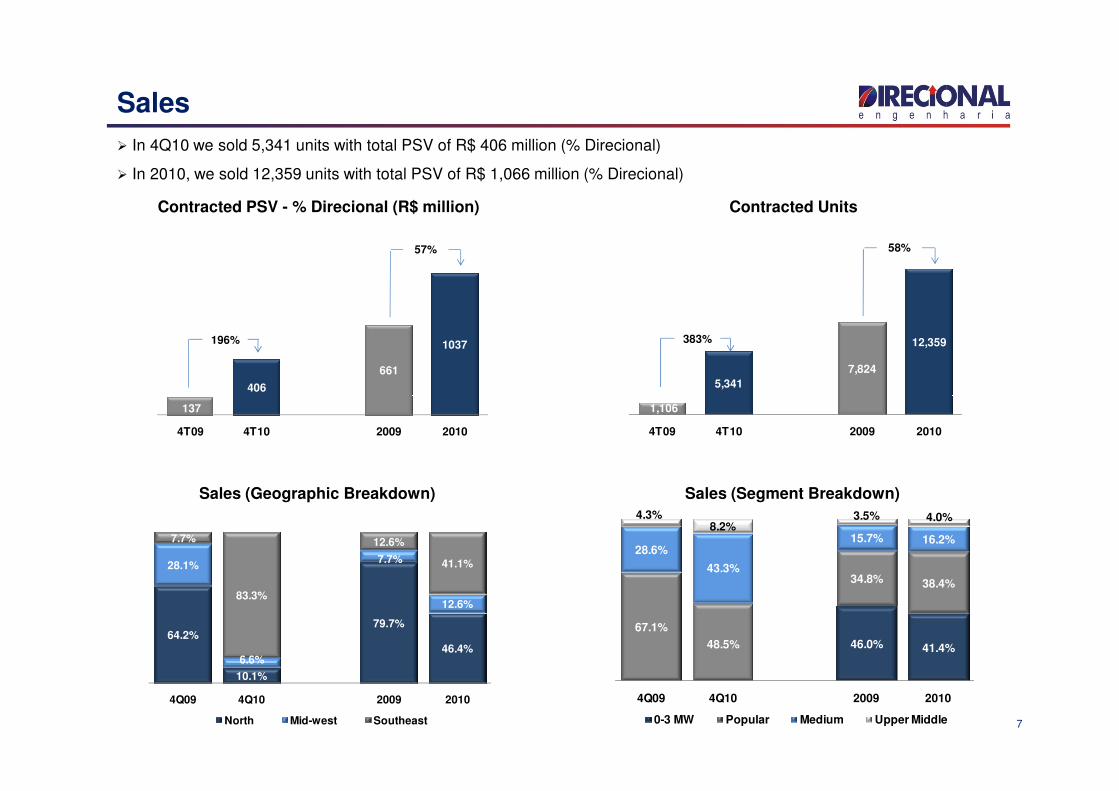
� In 4Q10 we sold 5,341 units with total PSV of R$ 406 million (% Direcional)
� In 2010, we sold 12,359 units with total PSV of R$ 1,066 million (% Direcional)
406
661
1037
57%
196%
5,341
7,824
12,359
58%
383%
7
Sales (Geographic Breakdown) Sales (Segment Breakdown)
137
4T09 4T10 2009 2010
1,106
4T09 4T10 2009 2010
64.2%
10.1%
79.7%
46.4%
28.1%
6.6%
7.7%
12.6%
7.7%
83.3%
12.6%
41.1%
4Q09 4Q10 2009 2010
North Mid-west Southeast
46.0% 41.4%
67.1%
48.5%
34.8% 38.4%
28.6%
43.3%
15.7% 16.2%
4.3%8.2%
3.5% 4.0%
4Q09 4Q10 2009 2010
0-3 MW Popular Medium Upper Middle
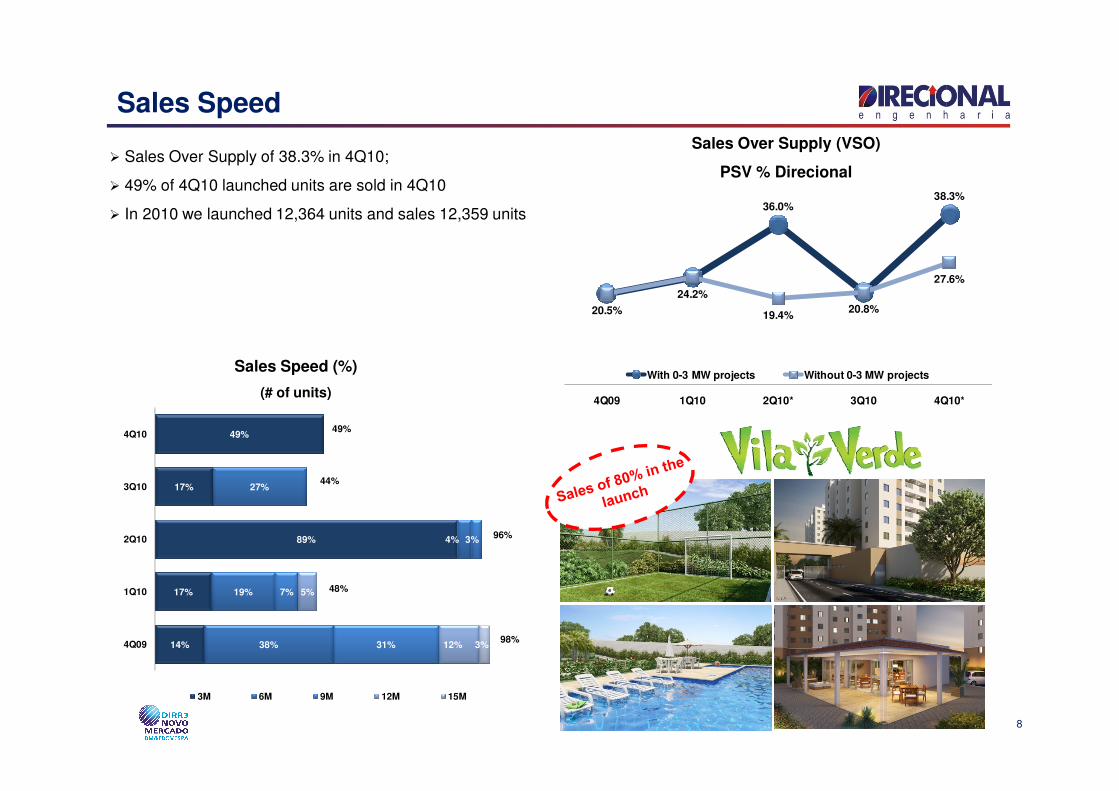
36.0%38.3%
20.5%
24.2%
19.4%20.8%
27.6%
4Q09 1Q10 2Q10* 3Q10 4Q10*
With 0-3 MW projects Without 0-3 MW projects
Sales Speed
� Sales Over Supply of 38.3% in 4Q10;
� 49% of 4Q10 launched units are sold in 4Q10
� In 2010 we launched 12,364 units and sales 12,359 units
Sales Over Supply (VSO)
PSV % Direcional
Sales Speed (%)
(# of units)
14%
17%
89%
17%
49%
38%
19%
4%
27%
31%
7%
3%
12%
5%
3%4Q09
1Q10
2Q10
3Q10
4Q10
3M 6M 9M 12M 15M
44%
96%
48%
98%
49%
4Q09 1Q10 2Q10* 3Q10 4Q10*
8
(# of units)
6,311
6,756
313
356
225
3Q10 AQUIRED LANDS REVIEW OF LAUNCHES IN LAND BANK
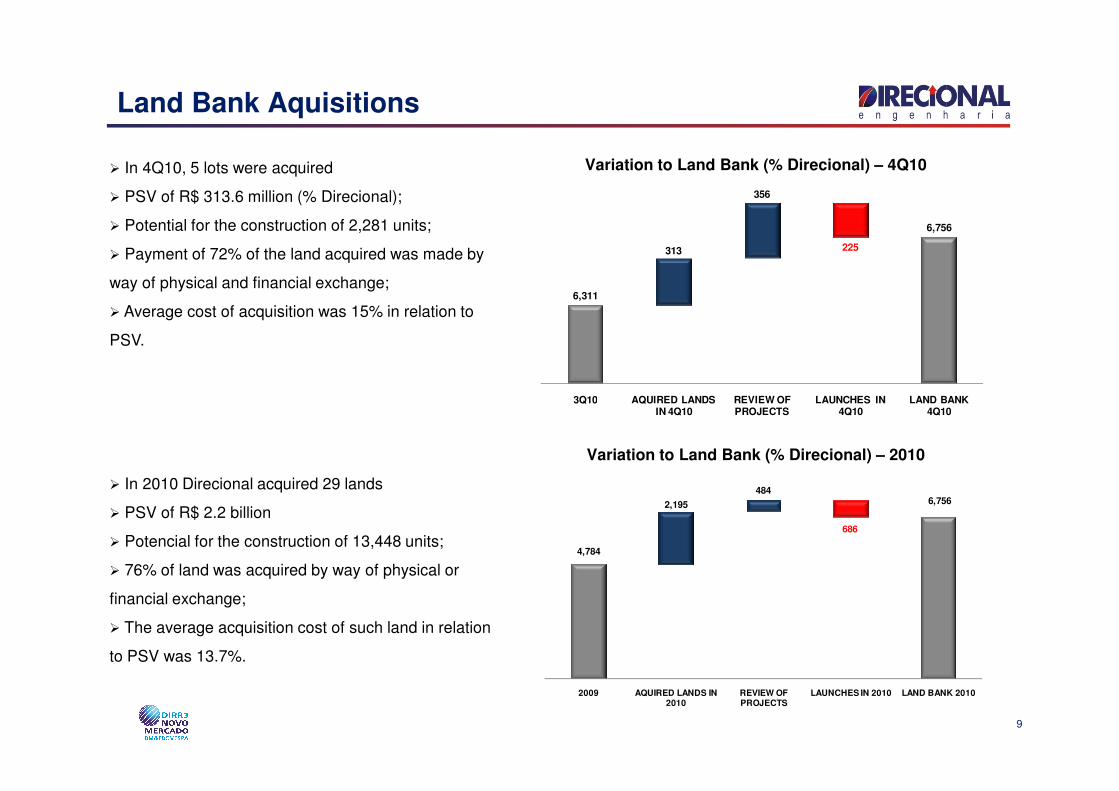
Land Bank Aquisitions
� In 4Q10, 5 lots were acquired
� PSV of R$ 313.6 million (% Direcional);
� Potential for the construction of 2,281 units;
� Payment of 72% of the land acquired was made by
way of physical and financial exchange;
� Average cost of acquisition was 15% in relation to
PSV.
Variation to Land Bank (% Direcional) – 4Q10
3Q10 AQUIRED LANDS IN 4Q10
REVIEW OF PROJECTS
LAUNCHES IN 4Q10
LAND BANK 4Q10
9
� In 2010 Direcional acquired 29 lands
� PSV of R$ 2.2 billion
� Potencial for the construction of 13,448 units;
� 76% of land was acquired by way of physical or
financial exchange;
� The average acquisition cost of such land in relation
to PSV was 13.7%.
Variation to Land Bank (% Direcional) – 2010
4,784
6,7562,195
484
686
2009 AQUIRED LANDS IN 2010
REVIEW OF PROJECTS
LAUNCHES IN 2010 LAND BANK 2010
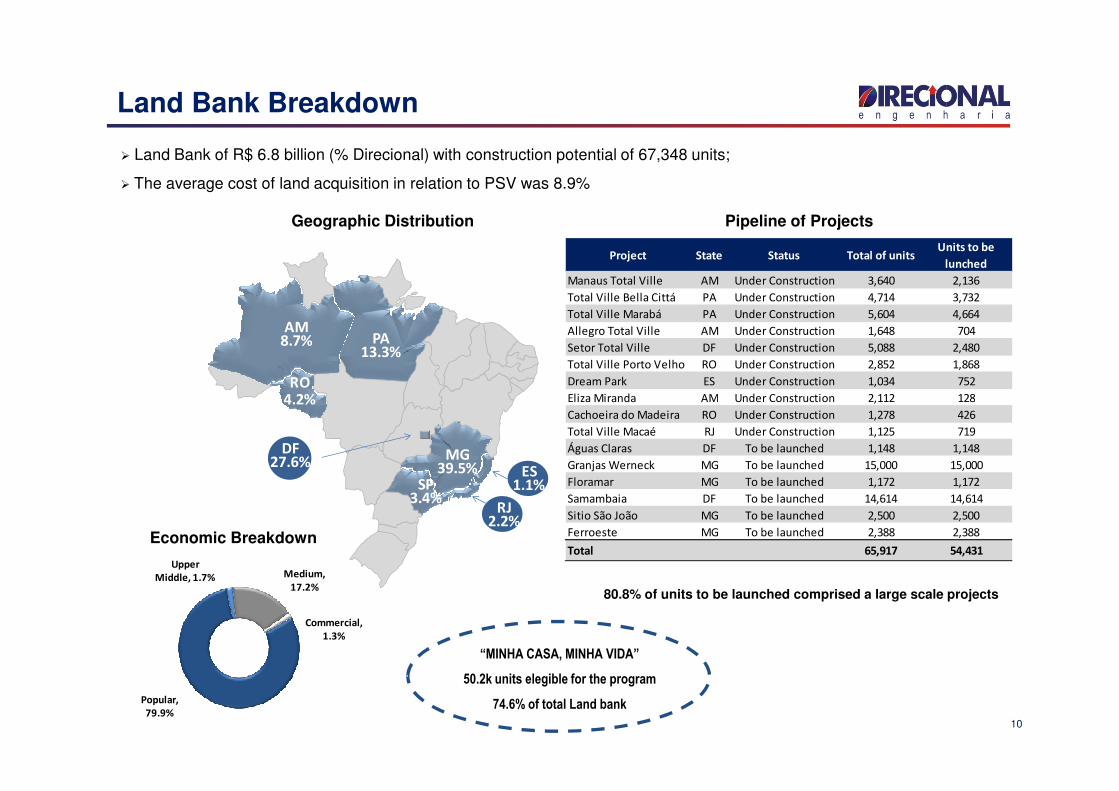
Land Bank Breakdown
� Land Bank of R$ 6.8 billion (% Direcional) with construction potential of 67,348 units;
� The average cost of land acquisition in relation to PSV was 8.9%
Geographic Distribution Pipeline of Projects
AM8.7%
RO4.2%
PA13.3%
Project State Status Total of unitsUnits to be
lunched
Manaus Total Ville AM Under Construction 3,640 2,136
Total Ville Bella Cittá PA Under Construction 4,714 3,732
Total Ville Marabá PA Under Construction 5,604 4,664
Allegro Total Ville AM Under Construction 1,648 704
Setor Total Ville DF Under Construction 5,088 2,480
Total Ville Porto Velho RO Under Construction 2,852 1,868
Dream Park ES Under Construction 1,034 752
Eliza Miranda AM Under Construction 2,112 128
10
“MINHA CASA, MINHA VIDA”
50.2k units elegible for the program
74.6% of total Land bank
Economic Breakdown
80.8% of units to be launched comprised a large scale projects
1
ES1.1%
MG39.5%
4.2%
SP3.4%
DF27.6%
RJ2.2%
Popular,
79.9%
Upper
Middle, 1.7% Medium,
17.2%
Commercial,
1.3%
Eliza Miranda AM Under Construction 2,112 128
Cachoeira do Madeira RO Under Construction 1,278 426
Total Ville Macaé RJ Under Construction 1,125 719
Águas Claras DF To be launched 1,148 1,148
Granjas Werneck MG To be launched 15,000 15,000
Floramar MG To be launched 1,172 1,172
Samambaia DF To be launched 14,614 14,614
Sitio São João MG To be launched 2,500 2,500
Ferroeste MG To be launched 2,388 2,388
Total 65,917 54,431
Total % Direcional
Launches 4Q10 209,851 120,111 665 665 50.6%
Launches 3Q10 100,151 90,364 1,020 951 55.3%
Launches 2Q10 70,985 70,606 184 153 3.7%
Launches 1Q10 86,519 77,623 669 622 51.0%
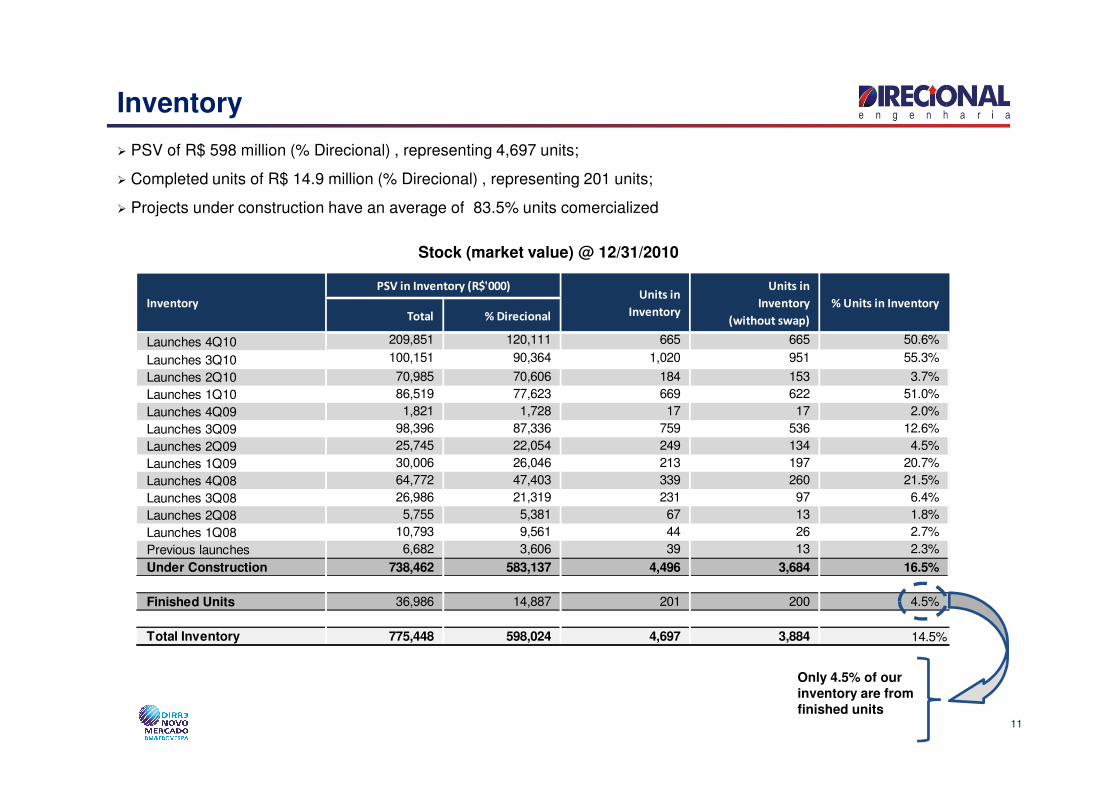
Inventory
PSV in Inventory (R$'000)Units in
Inventory
Units in
Inventory
(without swap)
% Units in Inventory
Inventory
� PSV of R$ 598 million (% Direcional) , representing 4,697 units;
� Completed units of R$ 14.9 million (% Direcional) , representing 201 units;
� Projects under construction have an average of 83.5% units comercialized
Stock (market value) @ 12/31/2010
Launches 1Q10 86,519 77,623 669 622 51.0%
Launches 4Q09 1,821 1,728 17 17 2.0%
Launches 3Q09 98,396 87,336 759 536 12.6%
Launches 2Q09 25,745 22,054 249 134 4.5%
Launches 1Q09 30,006 26,046 213 197 20.7%
Launches 4Q08 64,772 47,403 339 260 21.5%
Launches 3Q08 26,986 21,319 231 97 6.4%
Launches 2Q08 5,755 5,381 67 13 1.8%
Launches 1Q08 10,793 9,561 44 26 2.7%
Previous launches 6,682 3,606 39 13 2.3%
Under Construction 738,462 583,137 4,496 3,684 16.5%
Finished Units 36,986 14,887 201 200 4.5%
Total Inventory 775,448 598,024 4,697 3,884 14.5%
11
Only 4.5% of ourinventory are fromfinished units
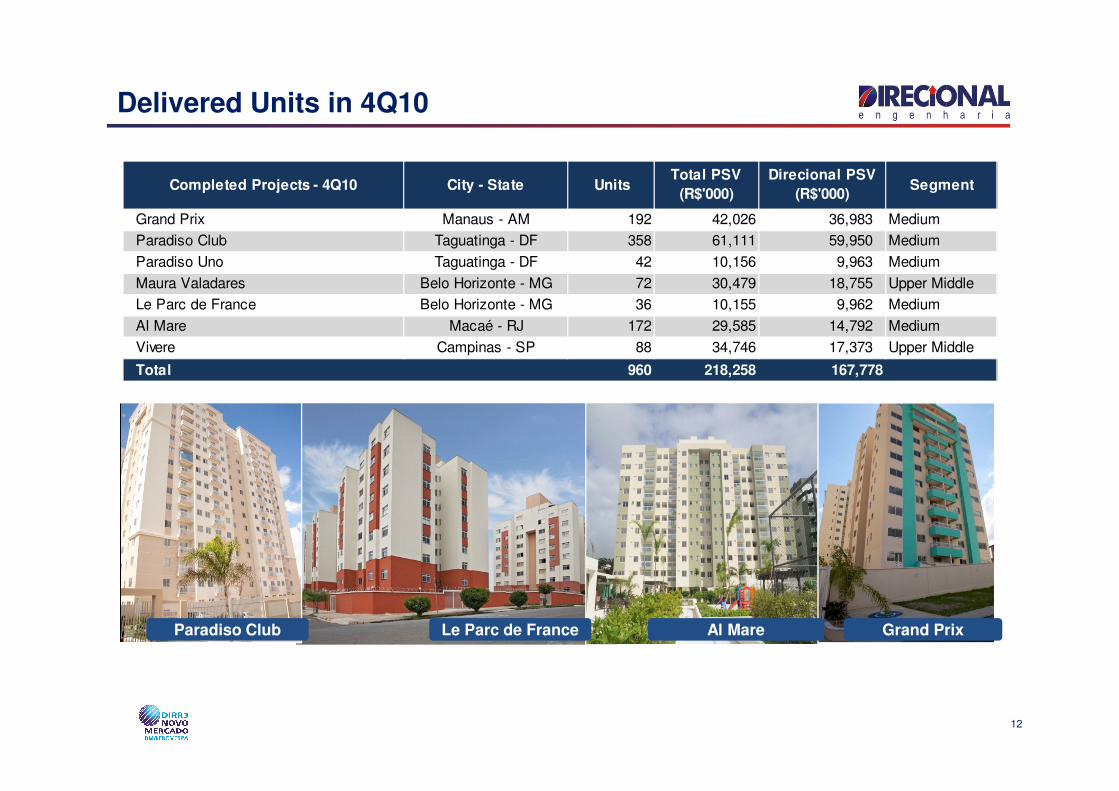
Delivered Units in 4Q10
Completed Projects - 4Q10 City - State UnitsTotal PSV
(R$'000)
Direcional PSV
(R$'000)Segment
Grand Prix Manaus - AM 192 42,026 36,983 Medium
Paradiso Club Taguatinga - DF 358 61,111 59,950 Medium
Paradiso Uno Taguatinga - DF 42 10,156 9,963 Medium
Maura Valadares Belo Horizonte - MG 72 30,479 18,755 Upper Middle
Le Parc de France Belo Horizonte - MG 36 10,155 9,962 Medium
Al Mare Macaé - RJ 172 29,585 14,792 Medium
Vivere Campinas - SP 88 34,746 17,373 Upper Middle
Total 960 218,258 167,778
12
Grand PrixParadiso Club Al MareParadiso Club Le Parc de France
Financial Highlights
Financial Performance
Carlos Wollenweber Financial Highlights
13
� Financial Performance
� Liquidity
� Results to be Recognized
� Share’s Performance
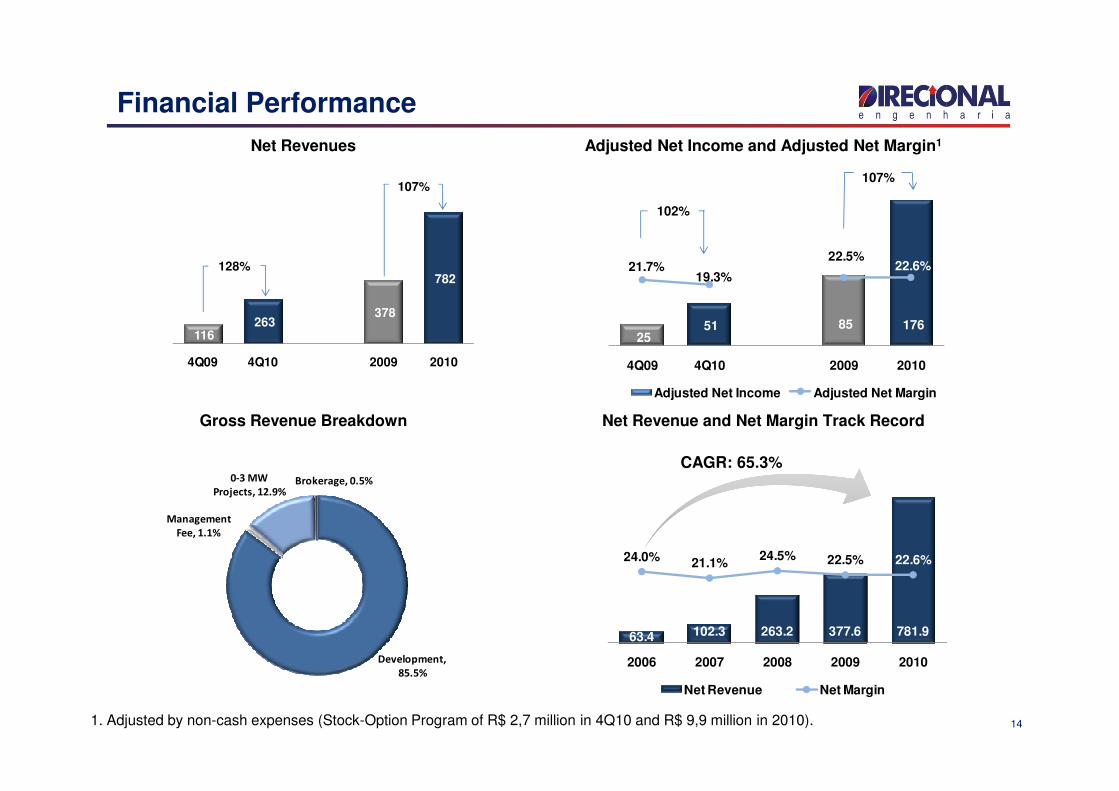
25 51 85 176
21.7%19.3%
22.5%22.6%
4Q09 4Q10 2009 2010
Adjusted Net Income Adjusted Net Margin
102%
107%
Financial Performance
Net Revenues Adjusted Net Income and Adjusted Net Margin1
116 263
378
782
4Q09 4Q10 2009 2010
128%
107%
Adjusted Net Income Adjusted Net Margin
63.4 102.3 263.2 377.6 781.9
24.0% 21.1%24.5% 22.5% 22.6%
2006 2007 2008 2009 2010
Net Revenue Net Margin
141. Adjusted by non-cash expenses (Stock-Option Program of R$ 2,7 million in 4Q10 and R$ 9,9 million in 2010).
CAGR: 65.3%
Development,
85.5%
Management
Fee, 1.1%
0-3 MW
Projects, 12.9%Brokerage, 0.5%
Gross Revenue Breakdown Net Revenue and Net Margin Track Record
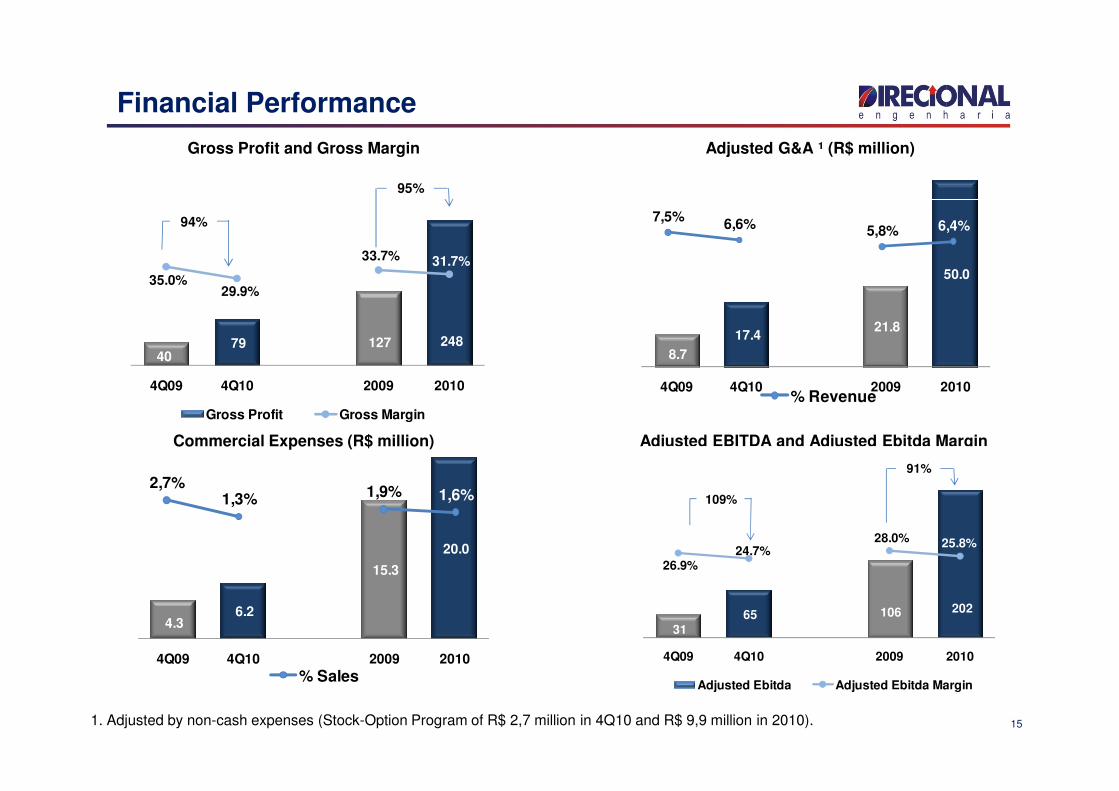
8.7
17.4 21.8
50.0
4Q09 4Q10 2009 2010
Financial Performance
Gross Profit and Gross Margin Adjusted G&A ¹ (R$ million)
7,5%6,6% 5,8% 6,4%
40 79 127 248
35.0%29.9%
33.7% 31.7%
4Q09 4Q10 2009 2010
94%
95%
% Revenue
4.3 6.2
15.3
20.0
4Q09 4Q10 2009 2010
15
Adjusted EBITDA and Adjusted Ebitda MarginCommercial Expenses (R$ million)
2,7%1,3% 1,9% 1,6%
Gross Profit Gross Margin
% Revenue
% Sales
31 65 106 202
26.9%24.7%
28.0% 25.8%
4Q09 4Q10 2009 2010
Adjusted Ebitda Adjusted Ebitda Margin
109%
91%
1. Adjusted by non-cash expenses (Stock-Option Program of R$ 2,7 million in 4Q10 and R$ 9,9 million in 2010).
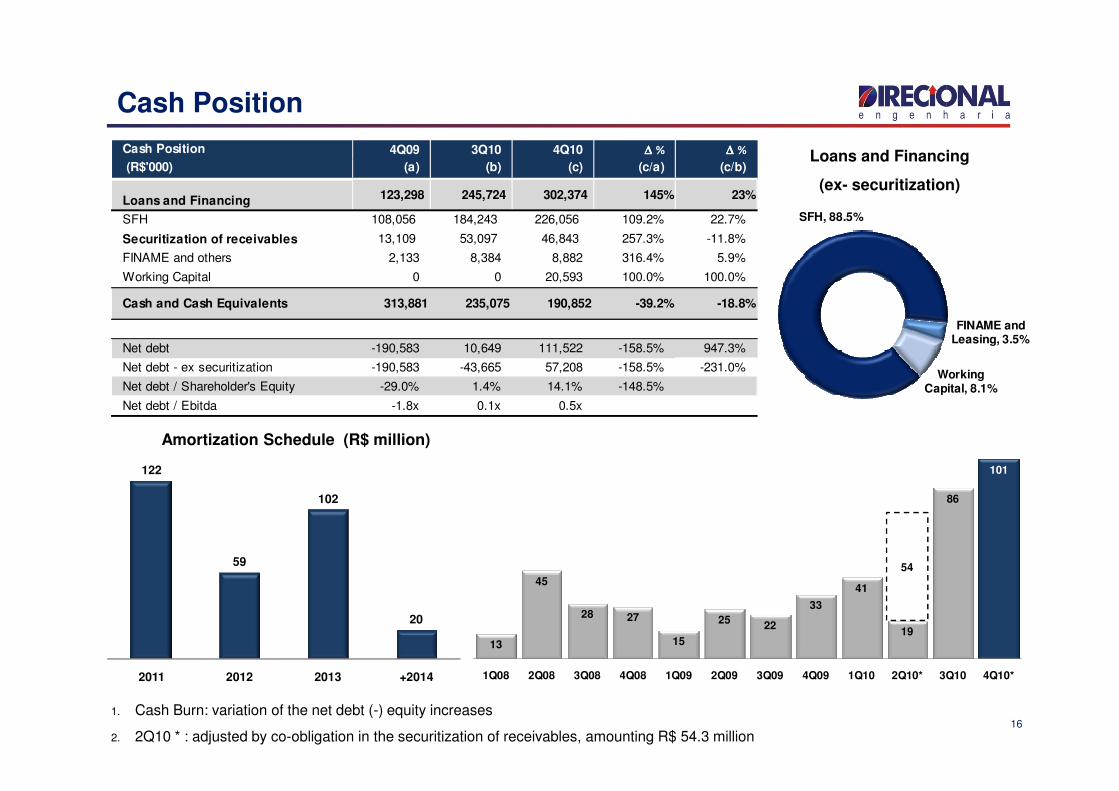
Cash Position
Loans and Financing
(ex- securitization)
Cash Position 4Q09 3Q10 4Q10 ∆∆∆∆ % ∆∆∆∆ %
(R$'000) (a) (b) (c) (c/a) (c/b)
Loans and Financing 123,298 245,724 302,374 145% 23%
SFH 108,056 184,243 226,056 109.2% 22.7%
Securitization of receivables 13,109 53,097 46,843 257.3% -11.8%
FINAME and others 2,133 8,384 8,882 316.4% 5.9%
Working Capital 0 0 20,593 100.0% 100.0%
Cash and Cash Equivalents 313,881 235,075 190,852 -39.2% -18.8%
Net debt -190,583 10,649 111,522 -158.5% 947.3%
Net debt - ex securitization -190,583 -43,665 57,208 -158.5% -231.0%
Net debt / Shareholder's Equity -29.0% 1.4% 14.1% -148.5%
SFH, 88.5%
FINAME and Leasing, 3.5%
Working Capital, 8.1%
161. Cash Burn: variation of the net debt (-) equity increases
2. 2Q10 * : adjusted by co-obligation in the securitization of receivables, amounting R$ 54.3 million
Amortization Schedule (R$ million) Cash Burn¹ (R$ million)
Net debt / Ebitda -1.8x 0.1x 0.5x
13
45
28 27
15
2522
33
41
19
86
101
54
1Q08 2Q08 3Q08 4Q08 1Q09 2Q09 3Q09 4Q09 1Q10 2Q10* 3Q10 4Q10*
122
59
102
20
2011 2012 2013 +2014
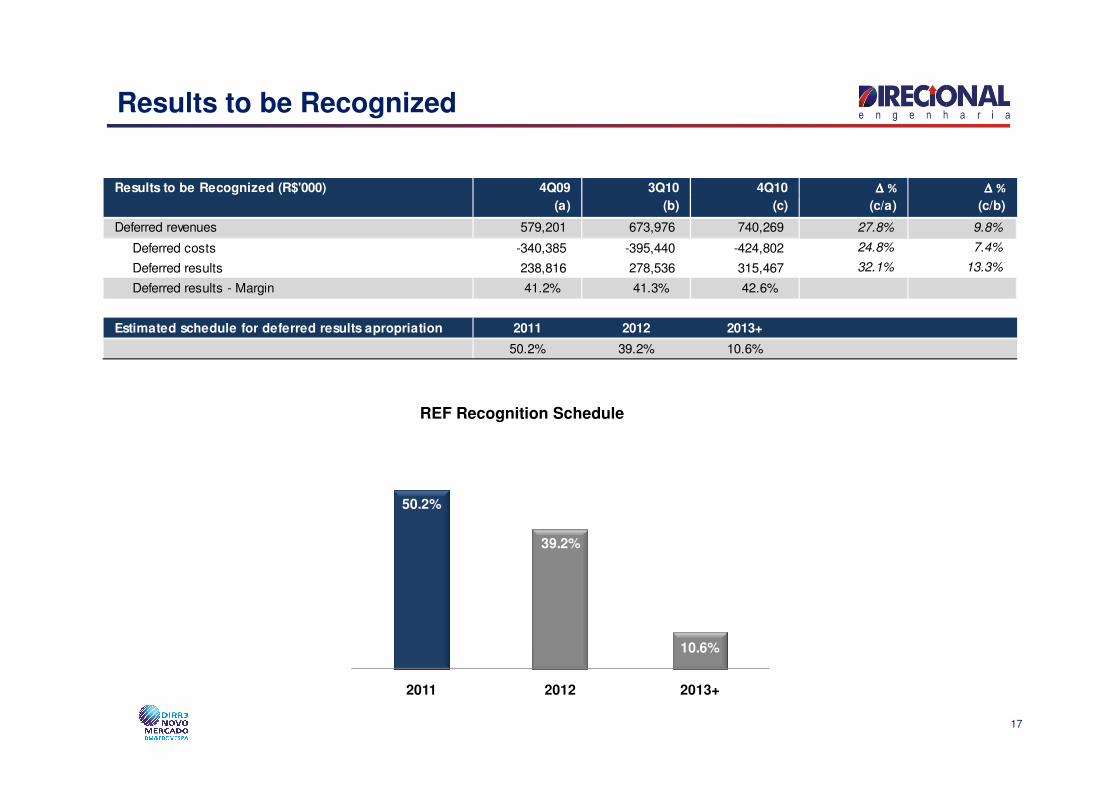
Results to be Recognized
Results to be Recognized (R$'000) 4Q09 3Q10 4Q10 ∆∆∆∆ % ∆∆∆∆ %
(a) (b) (c) (c/a) (c/b)
Deferred revenues 579,201 673,976 740,269 27.8% 9.8%
Deferred costs -340,385 -395,440 -424,802 24.8% 7.4%
Deferred results 238,816 278,536 315,467 32.1% 13.3%
Deferred results - Margin 41.2% 41.3% 42.6%
Estimated schedule for deferred results apropriation 2011 2012 2013+
50.2% 39.2% 10.6%
17
REF Recognition Schedule
50.2%
39.2%
10.6%
2011 2012 2013+
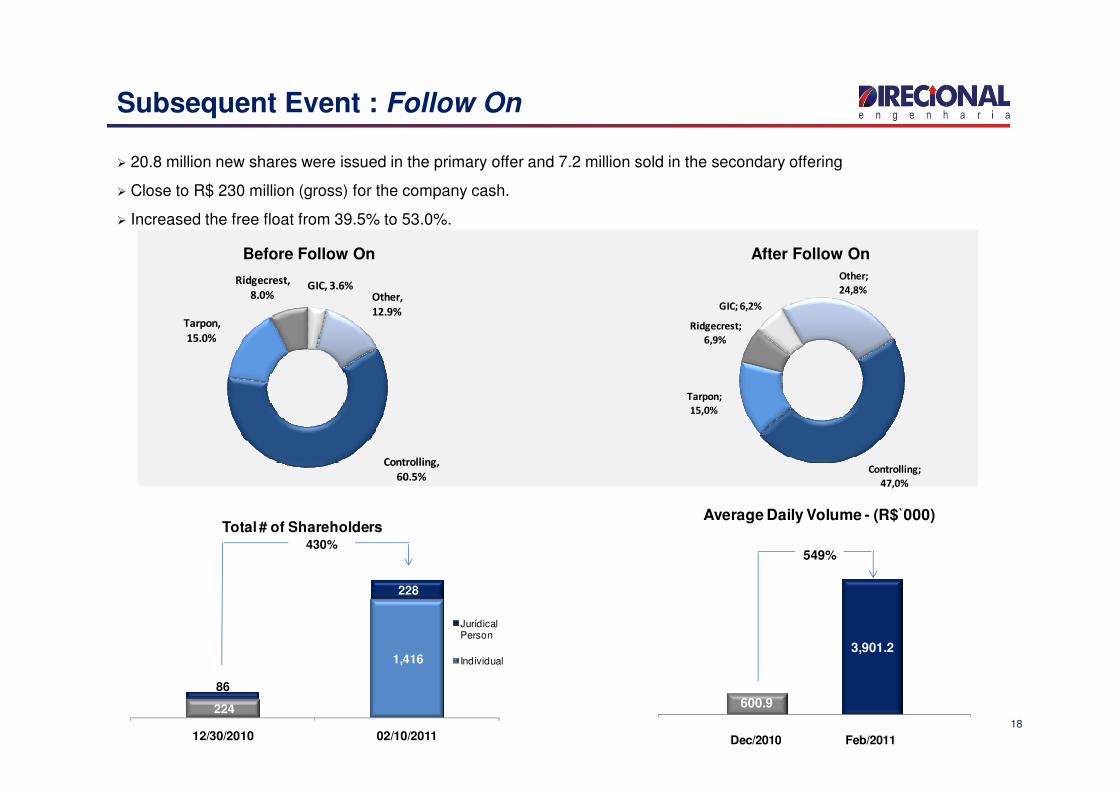
Subsequent Event : Follow On
� 20.8 million new shares were issued in the primary offer and 7.2 million sold in the secondary offering
� Close to R$ 230 million (gross) for the company cash.
� Increased the free float from 39.5% to 53.0%.
Before Follow On After Follow On
Tarpon,
15.0%
Ridgecrest,
8.0%GIC, 3.6%
Other,
12.9%
Tarpon;
Ridgecrest;
6,9%
GIC; 6,2%
Other;
24,8%
224
1,416
86
228
12/30/2010 02/10/2011
Total # of Shareholders
Jurídical Person
Individual
430%
18
600.9
3,901.2
Average Daily Volume - (R$`000)
549%
Dec/2010 Feb/2011
Controlling,
60.5%Controlling;
47,0%
Tarpon;
15,0%
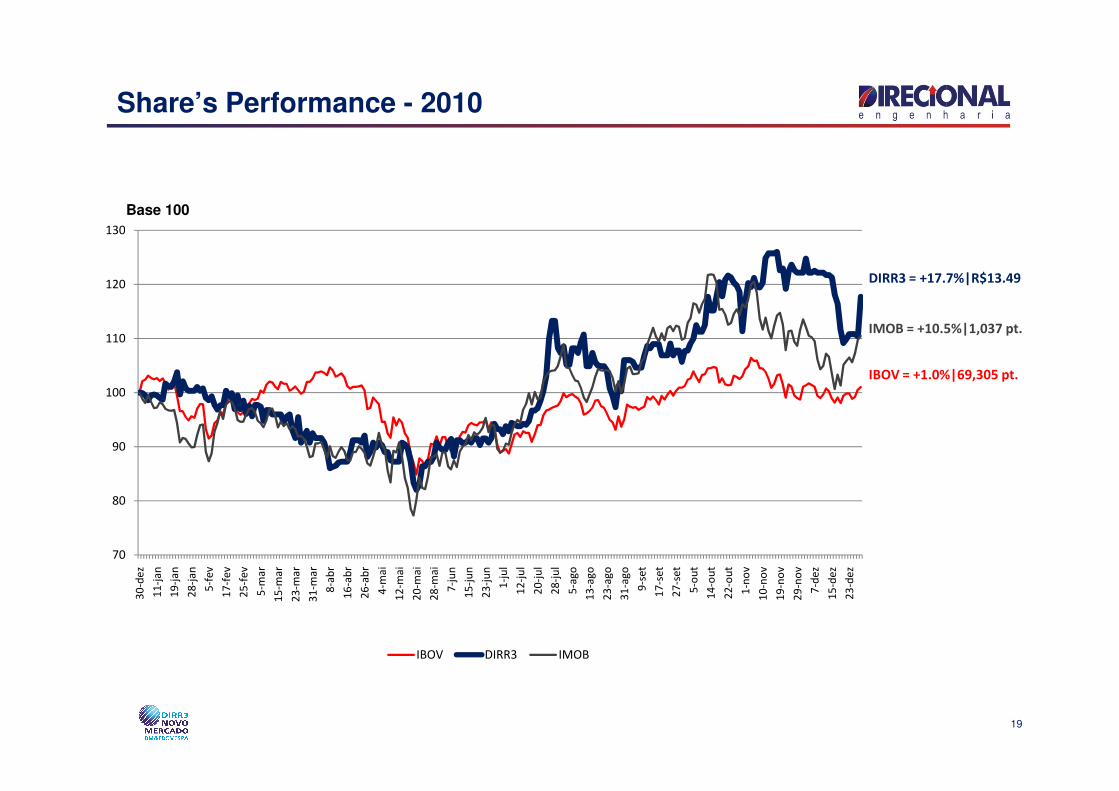
Share’s Performance - 2010
Base 100
DIRR3 = +17.7%|R$13.49
IMOB = +10.5%|1,037 pt.
IBOV = +1.0%|69,305 pt.
100
110
120
130
19
70
80
90
100
30
-dez
11
-jan
19
-jan
28
-jan
5-f
ev
17
-fev
25
-fev
5-m
ar
15
-mar
23
-mar
31
-mar
8-a
br
16
-ab
r
26
-ab
r
4-m
ai
12
-mai
20
-mai
28
-mai
7-j
un
15
-ju
n
23
-ju
n
1-j
ul
12
-ju
l
20
-ju
l
28
-ju
l
5-a
go
13
-ago
23
-ago
31
-ago
9-s
et
17
-set
27
-set
5-o
ut
14
-ou
t
22
-ou
t
1-n
ov
10
-no
v
19
-no
v
29
-no
v
7-d
ez
15
-dez
23
-dez
IBOV DIRR3 IMOB
Disclaimer
This presentation contains certain forward-looking statements concerning the business prospects, projections of
20
operating and financial results and growth potential of the Company, which are based on management’s currentexpectations and estimates of the future performance of the Company. Although the Company believes suchforward-looking statements are based on reasonable assumptions, it can give no assurance that its expectations willbe achieved. Expectations and estimates that are based on the future prospects of the Company are highlydependent upon market behavior, Brazil’s political and economic situation, existing and future regulations of theindustry and international markets and, therefore, are subject to changes outside the Company’s and management’scontrol. The Company undertakes no obligation to update any information contained herein or to revise any forward-looking statement as a result of new information, future events or other information.
Contact
Carlos Wollenweber
CFO | IR Officer
Lucas Bousas
IR Analyst
21
IR Analyst
www.direcional.com.br
(55 31) 3214-6200
(55 31) 3214-6450