4q17 earnings presentations1.q4cdn.com/.../2018/4q17-earnings-presentation-final.pdf · nyse:dnr ...
TRANSCRIPT
w w w . d e n b u r y . c o mN Y S E : D N R
4Q17 Earnings PresentationFebruary 22, 2018
N Y S E : D N R 2 w w w . d e n b u r y . c o m
Agenda
● Introduction— John Mayer, Director of Investor Relations
● Overview and Operational Update
— Chris Kendall, President & Chief Executive Officer
● Financial Review
— Mark Allen, Executive Vice President & Chief Financial Officer
N Y S E : D N R 3 w w w . d e n b u r y . c o m
Cautionary StatementsForward-Looking Statements: The data and/or statements contained in this presentation that are not historical facts are forward-looking statements, as that term is defined in Section 21E of the Securities Exchange Act of 1934, as amended,that involve a number of risks and uncertainties. Such forward-looking statements may be or may concern, among other things, financial forecasts, future hydrocarbon prices and timing, degree and length of any price recovery, current orfuture liquidity sources or their adequacy to support our anticipated future activities, our ability to further reduce our debt levels, possible future write-downs of oil and natural gas reserves, together with assumptions based on current andprojected oil and gas prices and oilfield costs, current or future expectations or estimations of our cash flows or impact of change in commodity prices on cash flows, availability of capital, borrowing capacity, availability of advantageouscommodity derivative contracts or the predicted cash flow benefits therefrom, forecasted capital expenditures, drilling activity or methods, including the timing and location thereof, nature of any future asset sales or acquisitions or thetiming or proceeds thereof, estimated timing of commencement of carbon dioxide (CO2) flooding of particular fields or areas, likelihood of completion of to-be-constructed industrial plants and the initial date of capture of CO2 from suchplants, timing of CO2 injections and initial production responses in tertiary flooding projects, development activities, finding costs, anticipated future cost savings, capital budgets, interpretation or prediction of formation details, productionrates and volumes or forecasts thereof, hydrocarbon reserve quantities and values, CO2 reserves and supply and their availability, potential reserves, barrels or percentages of recoverable original oil in place, potential increases in worldwidetariffs or other trade restrictions, the likelihood, timing and impact of increased interest rates, the impact of regulatory rulings or changes, anticipated outcomes of pending litigation, prospective legislation affecting the oil and gas industry,environmental regulations, mark-to-market values, competition, long-term forecasts of production, IRR or internal rates of return, estimated costs, changes in costs, future capital expenditures and overall economics, worldwide economicconditions and other variables surrounding our estimated original oil in place, operations and future plans. Such forward-looking statements generally are accompanied by words such as “plan,” “estimate,” “expect,” “predict,” “forecast,” “toour knowledge,” “anticipate,” “projected,” “preliminary,” “should,” “assume,” “believe,” “may” or other words that convey, or are intended to convey, the uncertainty of future events or outcomes. Such forward-looking information is basedupon management’s current plans, expectations, estimates, and assumptions and is subject to a number of risks and uncertainties that could significantly and adversely affect current plans, anticipated actions, the timing of such actions andour financial condition and results of operations. As a consequence, actual results may differ materially from expectations, estimates or assumptions expressed in or implied by any forward-looking statements made by us or on our behalf.Among the factors that could cause actual results to differ materially are fluctuations in worldwide oil prices or in U.S. oil prices and consequently in the prices received or demand for our oil and natural gas; decisions as to production levelsand/or pricing by OPEC or U.S. shale producers in future periods; levels of future capital expenditures; effects of our indebtedness; success of our risk management techniques; inaccurate cost estimates; availability of credit in the commercialbanking market, fluctuations in the prices of goods and services; the uncertainty of drilling results and reserve estimates; operating hazards and remediation costs; disruption of operations and damages from well incidents, hurricanes,tropical storms, or forest fires; acquisition risks; requirements for capital or its availability; conditions in the worldwide financial, trade and credit markets; general economic conditions; competition; government regulations, including changesin tax or environmental laws or regulations; and unexpected delays, as well as the risks and uncertainties inherent in oil and gas drilling and production activities or that are otherwise discussed in this presentation, including, withoutlimitation, the portions referenced above, and the uncertainties set forth from time to time in our other public reports, filings and public statements including, without limitation, the Company’s most recent Form 10-K.
Statement Regarding Non-GAAP Financial Measures: This presentation also contains certain non-GAAP financial measures. Any non-GAAP measure included herein will be accompanied by a reconciliation to the most directly comparableU.S. GAAP measure along with a statement on why the Company believes the measure is beneficial to investors. These reconciliations can be found on our website at www.denbury.com/investor relations/financial information and in ourperiodic filings with the SEC at www.sec.gov.
Note to U.S. Investors: Current SEC rules regarding oil and gas reserves information allow oil and gas companies to disclose in filings with the SEC not only proved reserves, but also probable and possible reserves that meet the SEC’sdefinitions of such terms. We disclose only proved reserves in our filings with the SEC. Denbury’s proved reserves as of December 31, 2016 and December 31, 2017 were estimated by DeGolyer and MacNaughton, an independent petroleumengineering firm. In this presentation, we may make reference to probable and possible reserves, some of which have been estimated by our independent engineers and some of which have been estimated by Denbury’s internal staff ofengineers. In this presentation, we also may refer to estimates of original oil in place, resource or reserves “potential,” barrels recoverable, “risked” and “unrisked” resource potential estimated ultimate recovery (EUR) or other descriptionsof volumes potentially recoverable, which in addition to reserves generally classifiable as probable and possible (2P and 3P reserves), include estimates of resources that do not rise to the standards for possible reserves, and which SECguidelines strictly prohibit us from including in filings with the SEC. These estimates, as well as the estimates of probable and possible reserves, are by their nature more speculative than estimates of proved reserves and are subject to greateruncertainties, and accordingly the likelihood of recovering those reserves is subject to substantially greater risk.
N Y S E : D N R 4 w w w . d e n b u r y . c o m
Overview & Operational UpdateChris Kendall
N Y S E : D N R 5 w w w . d e n b u r y . c o m
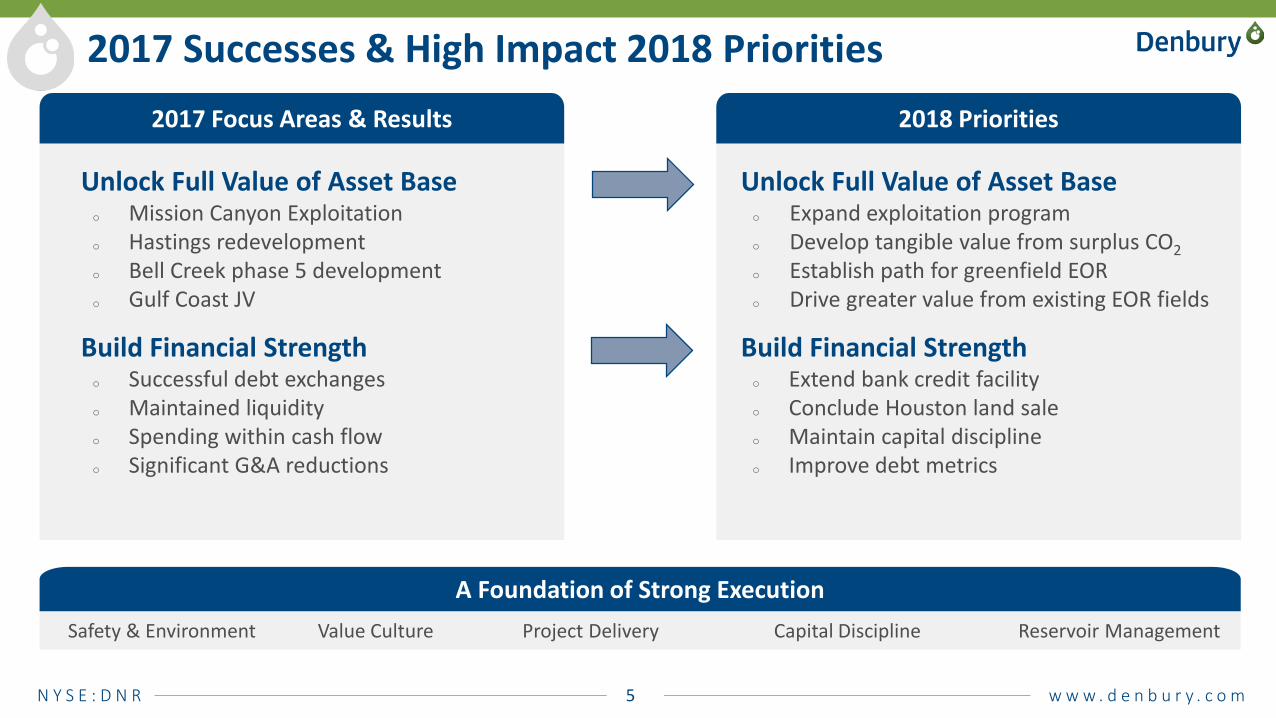
2017 Successes & High Impact 2018 Priorities
Unlock Full Value of Asset Baseo Mission Canyon Exploitationo Hastings redevelopmento Bell Creek phase 5 developmento Gulf Coast JV
Build Financial Strengtho Successful debt exchangeso Maintained liquidityo Spending within cash flowo Significant G&A reductions
2017 Focus Areas & Results
Unlock Full Value of Asset Baseo Expand exploitation programo Develop tangible value from surplus CO2o Establish path for greenfield EORo Drive greater value from existing EOR fields
Build Financial Strengtho Extend bank credit facilityo Conclude Houston land saleo Maintain capital disciplineo Improve debt metrics
2018 Priorities
Safety & Environment Value Culture Project Delivery Capital Discipline Reservoir Management
A Foundation of Strong Execution
N Y S E : D N R 6 w w w . d e n b u r y . c o m
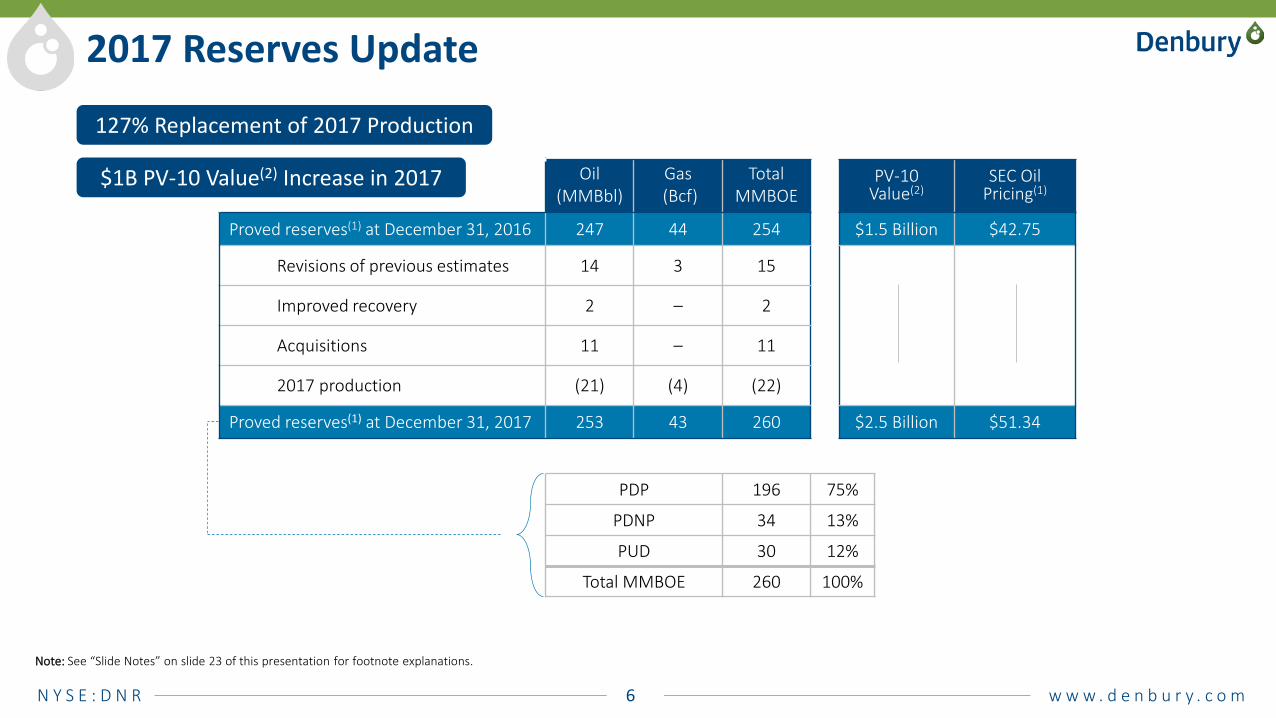
2017 Reserves Update
Oil (MMBbl)
Gas(Bcf)
TotalMMBOE
PV-10 Value(2)
SEC Oil Pricing(1)
Proved reserves(1) at December 31, 2016 247 44 254 $1.5 Billion $42.75
Revisions of previous estimates 14 3 15
Improved recovery 2 – 2
Acquisitions 11 – 11
2017 production (21) (4) (22)
Proved reserves(1) at December 31, 2017 253 43 260 $2.5 Billion $51.34
PDP 196 75%
PDNP 34 13%
PUD 30 12%
Total MMBOE 260 100%
$1B PV-10 Value(2) Increase in 2017
127% Replacement of 2017 Production
Note: See “Slide Notes” on slide 23 of this presentation for footnote explanations.
N Y S E : D N R 7 w w w . d e n b u r y . c o m
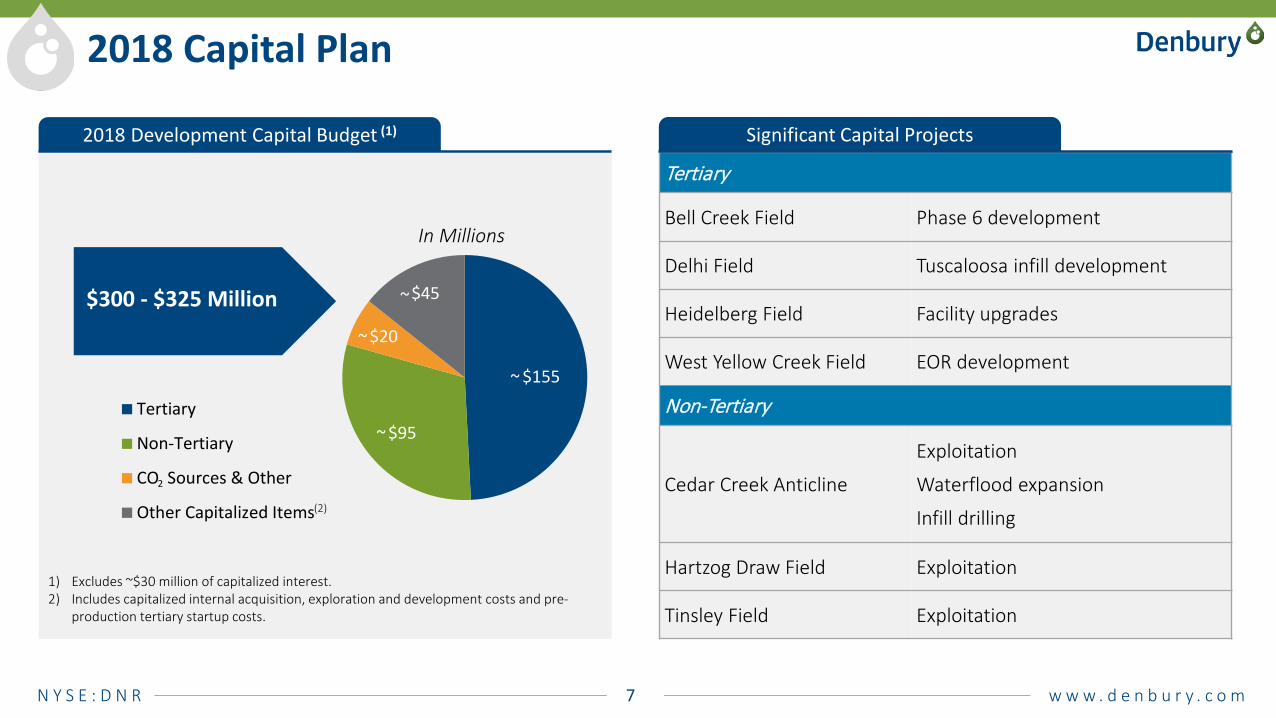
$155
$95
$20
$45
Tertiary
Non-Tertiary
CO Sources & Other
Other Capitalized Items
2018 Capital Plan
$300 - $325 Million
2018 Development Capital Budget (1)
2
1) Excludes ~$30 million of capitalized interest.2) Includes capitalized internal acquisition, exploration and development costs and pre-
production tertiary startup costs.
Tertiary
Bell Creek Field Phase 6 development
Delhi Field Tuscaloosa infill development
Heidelberg Field Facility upgrades
West Yellow Creek Field EOR development
Non-Tertiary
Cedar Creek Anticline
Exploitation
Waterflood expansion
Infill drilling
Hartzog Draw Field Exploitation
Tinsley Field Exploitation
Significant Capital Projects
~
~
~
~
In Millions
(2)
N Y S E : D N R 8 w w w . d e n b u r y . c o m
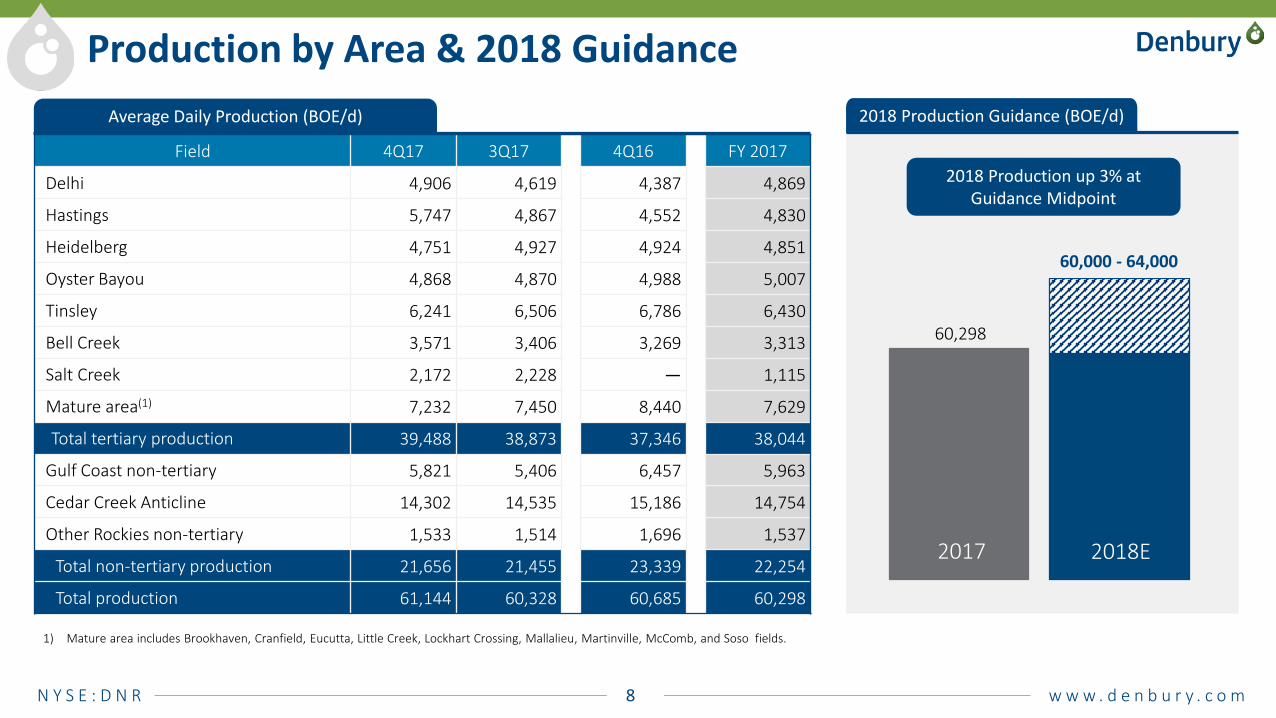
Production by Area & 2018 Guidance
Field 4Q17 3Q17 4Q16 FY 2017
Delhi 4,906 4,619 4,387 4,869
Hastings 5,747 4,867 4,552 4,830
Heidelberg 4,751 4,927 4,924 4,851
Oyster Bayou 4,868 4,870 4,988 5,007
Tinsley 6,241 6,506 6,786 6,430
Bell Creek 3,571 3,406 3,269 3,313
Salt Creek 2,172 2,228 — 1,115
Mature area(1) 7,232 7,450 8,440 7,629
Total tertiary production 39,488 38,873 37,346 38,044
Gulf Coast non-tertiary 5,821 5,406 6,457 5,963
Cedar Creek Anticline 14,302 14,535 15,186 14,754
Other Rockies non-tertiary 1,533 1,514 1,696 1,537
Total non-tertiary production 21,656 21,455 23,339 22,254
Total production 61,144 60,328 60,685 60,298
1) Mature area includes Brookhaven, Cranfield, Eucutta, Little Creek, Lockhart Crossing, Mallalieu, Martinville, McComb, and Soso fields.
Average Daily Production (BOE/d)
(2)
FY2016 2017 20182017 2018
60,000 - 64,000
60,298
2018 Production up 3% at Guidance Midpoint
2018 Production Guidance (BOE/d)
2017 2018E
N Y S E : D N R 9 w w w . d e n b u r y . c o m
Analysis of Total Operating Costs
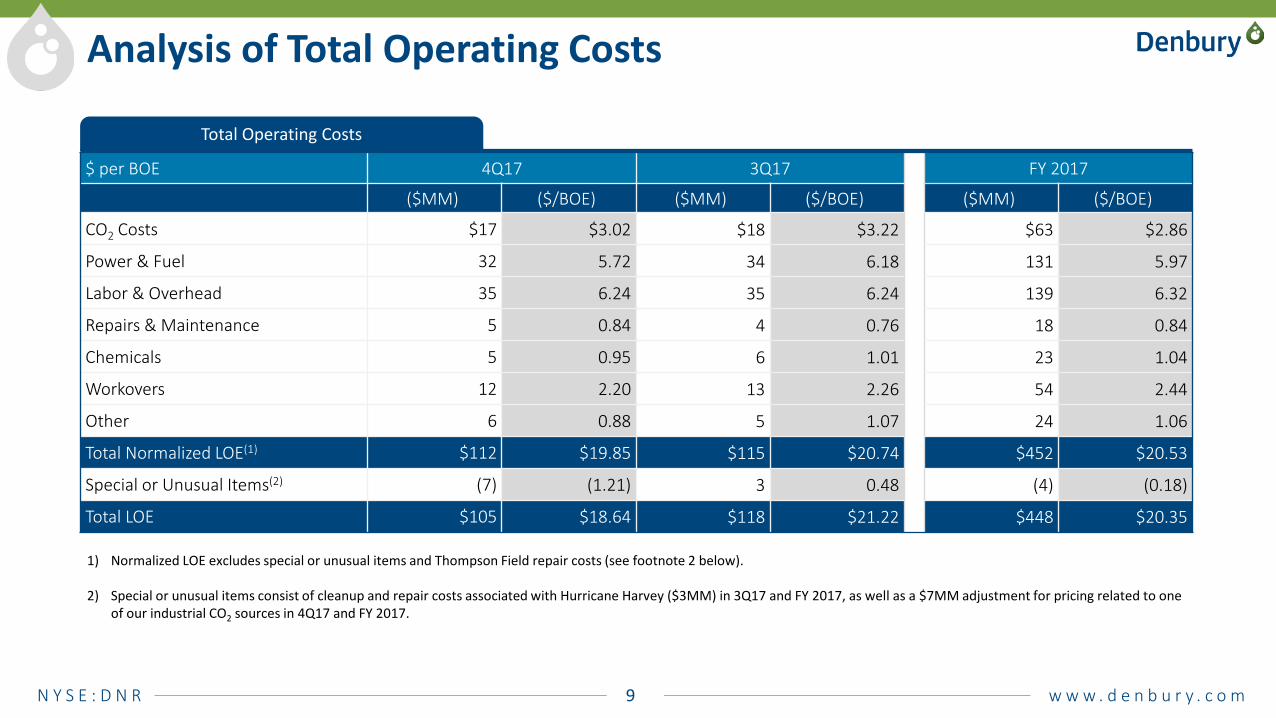
$ per BOE 4Q17 3Q17 FY 2017
($MM) ($/BOE) ($MM) ($/BOE) ($MM) ($/BOE)
CO2 Costs $17 $3.02 $18 $3.22 $63 $2.86
Power & Fuel 32 5.72 34 6.18 131 5.97
Labor & Overhead 35 6.24 35 6.24 139 6.32
Repairs & Maintenance 5 0.84 4 0.76 18 0.84
Chemicals 5 0.95 6 1.01 23 1.04
Workovers 12 2.20 13 2.26 54 2.44
Other 6 0.88 5 1.07 24 1.06
Total Normalized LOE(1) $112 $19.85 $115 $20.74 $452 $20.53
Special or Unusual Items(2) (7) (1.21) 3 0.48 (4) (0.18)
Total LOE $105 $18.64 $118 $21.22 $448 $20.35
1) Normalized LOE excludes special or unusual items and Thompson Field repair costs (see footnote 2 below).
2) Special or unusual items consist of cleanup and repair costs associated with Hurricane Harvey ($3MM) in 3Q17 and FY 2017, as well as a $7MM adjustment for pricing related to one of our industrial CO2 sources in 4Q17 and FY 2017.
Total Operating Costs
N Y S E : D N R 10 w w w . d e n b u r y . c o m
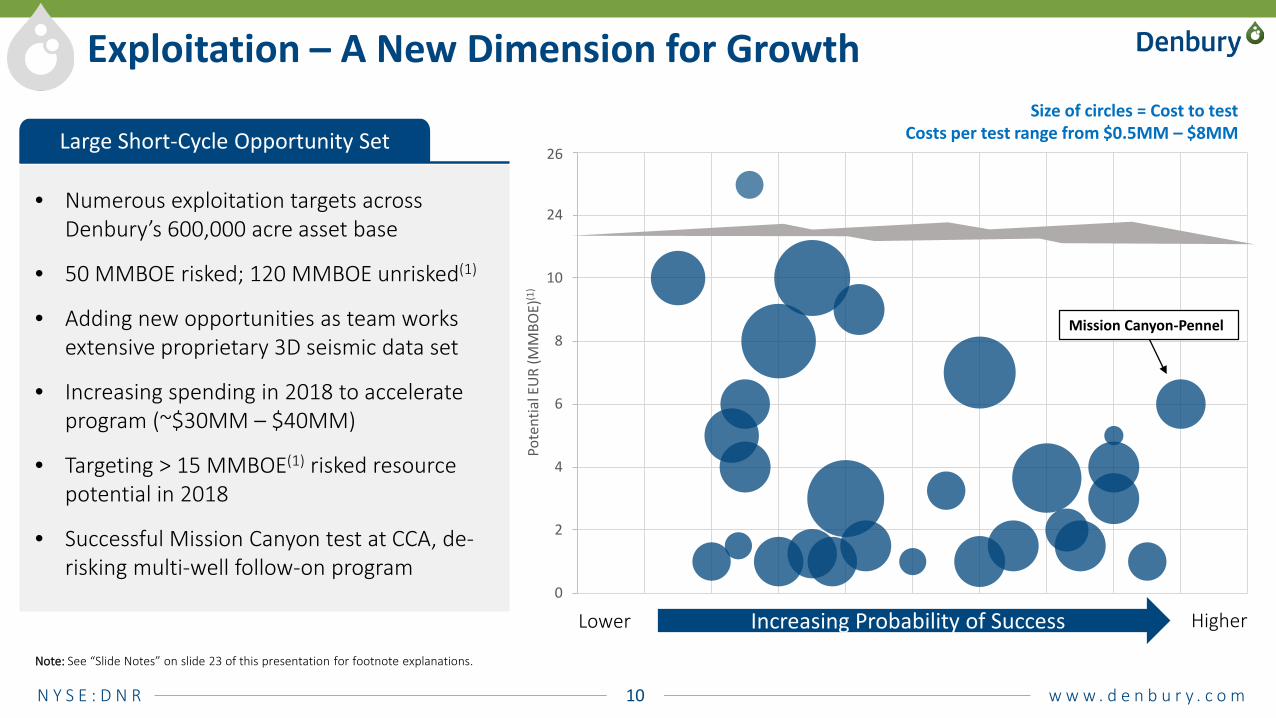
Exploitation – A New Dimension for Growth
• Numerous exploitation targets across Denbury’s 600,000 acre asset base
• 50 MMBOE risked; 120 MMBOE unrisked(1)
• Adding new opportunities as team works extensive proprietary 3D seismic data set
• Increasing spending in 2018 to accelerate program (~$30MM – $40MM)
• Targeting > 15 MMBOE(1) risked resource potential in 2018
• Successful Mission Canyon test at CCA, de-risking multi-well follow-on program
0
2
4
6
8
10
12
14
Pote
ntia
l EU
R (M
MBO
E)(1
)
Increasing Probability of Success
Mission Canyon-Pennel
Lower Higher
Size of circles = Cost to testCosts per test range from $0.5MM – $8MM
26
24
Note: See “Slide Notes” on slide 23 of this presentation for footnote explanations.
Large Short-Cycle Opportunity Set
N Y S E : D N R 11 w w w . d e n b u r y . c o m
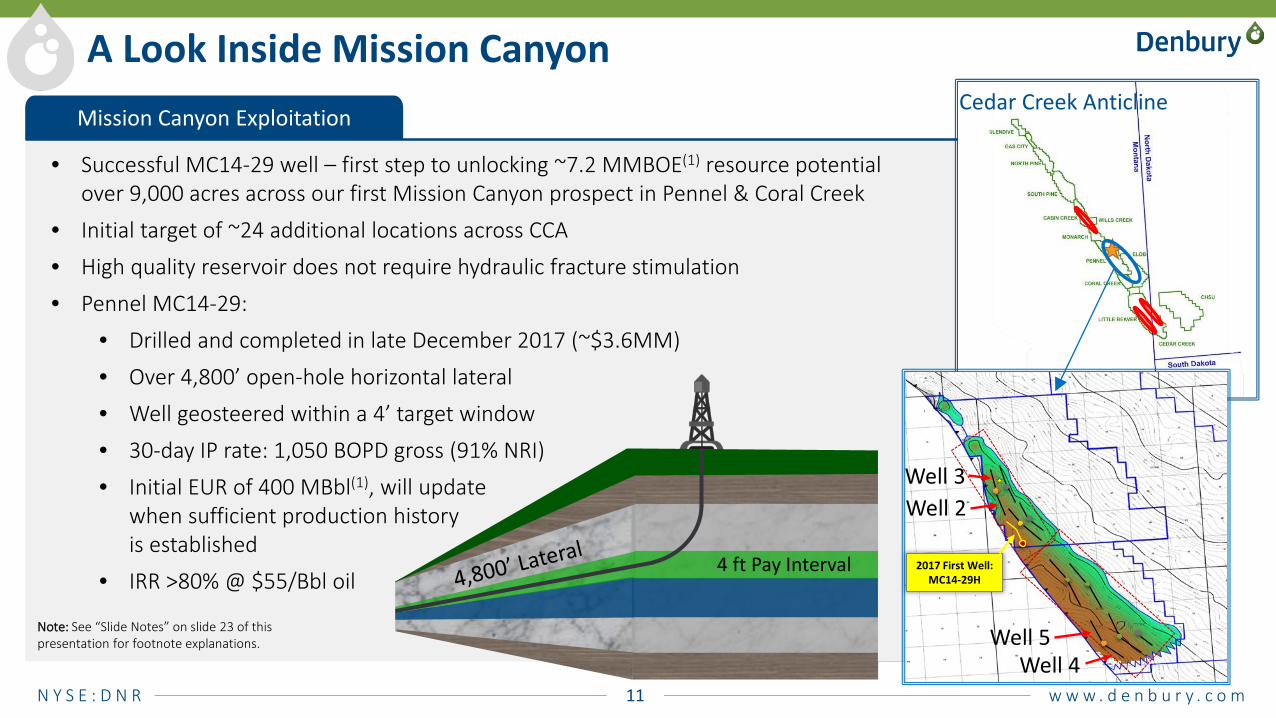
Mission Canyon Exploitation
A Look Inside Mission Canyon
• Successful MC14-29 well – first step to unlocking ~7.2 MMBOE(1) resource potential over 9,000 acres across our first Mission Canyon prospect in Pennel & Coral Creek
• Initial target of ~24 additional locations across CCA
• High quality reservoir does not require hydraulic fracture stimulation
• Pennel MC14-29:
• Drilled and completed in late December 2017 (~$3.6MM)
• Over 4,800’ open-hole horizontal lateral
• Well geosteered within a 4’ target window
• 30-day IP rate: 1,050 BOPD gross (91% NRI)
• Initial EUR of 400 MBbl(1), will updatewhen sufficient production historyis established
• IRR >80% @ $55/Bbl oil
Cedar Creek Anticline
4 ft Pay Interval
Insert Text Insert Text
2017 First Well: MC14-29H
Well 2
Well 5Well 4
Well 3
Note: See “Slide Notes” on slide 23 of this presentation for footnote explanations.
N Y S E : D N R 12 w w w . d e n b u r y . c o m
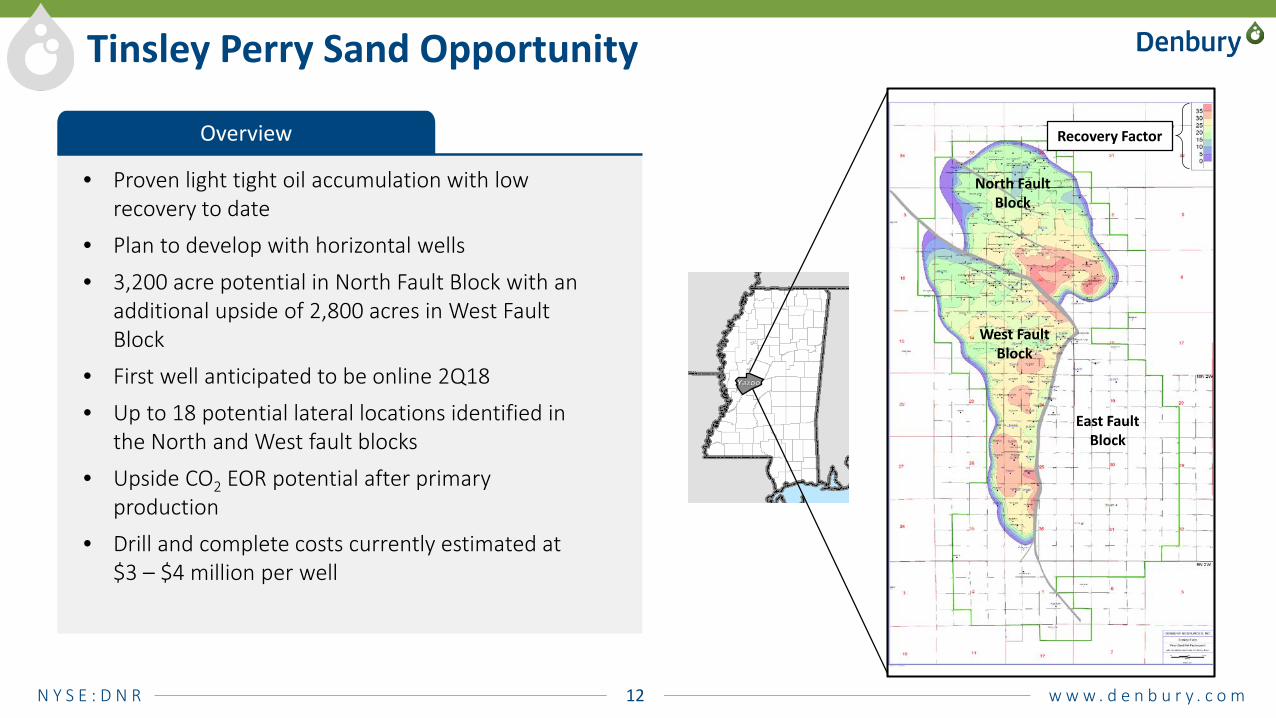
Tinsley Perry Sand Opportunity
Overview
• Proven light tight oil accumulation with low recovery to date
• Plan to develop with horizontal wells
• 3,200 acre potential in North Fault Block with an additional upside of 2,800 acres in West Fault Block
• First well anticipated to be online 2Q18
• Up to 18 potential lateral locations identified in the North and West fault blocks
• Upside CO2 EOR potential after primary production
• Drill and complete costs currently estimated at $3 – $4 million per well
West Fault Block
North Fault Block
East Fault Block
Recovery Factor
N Y S E : D N R 13 w w w . d e n b u r y . c o m
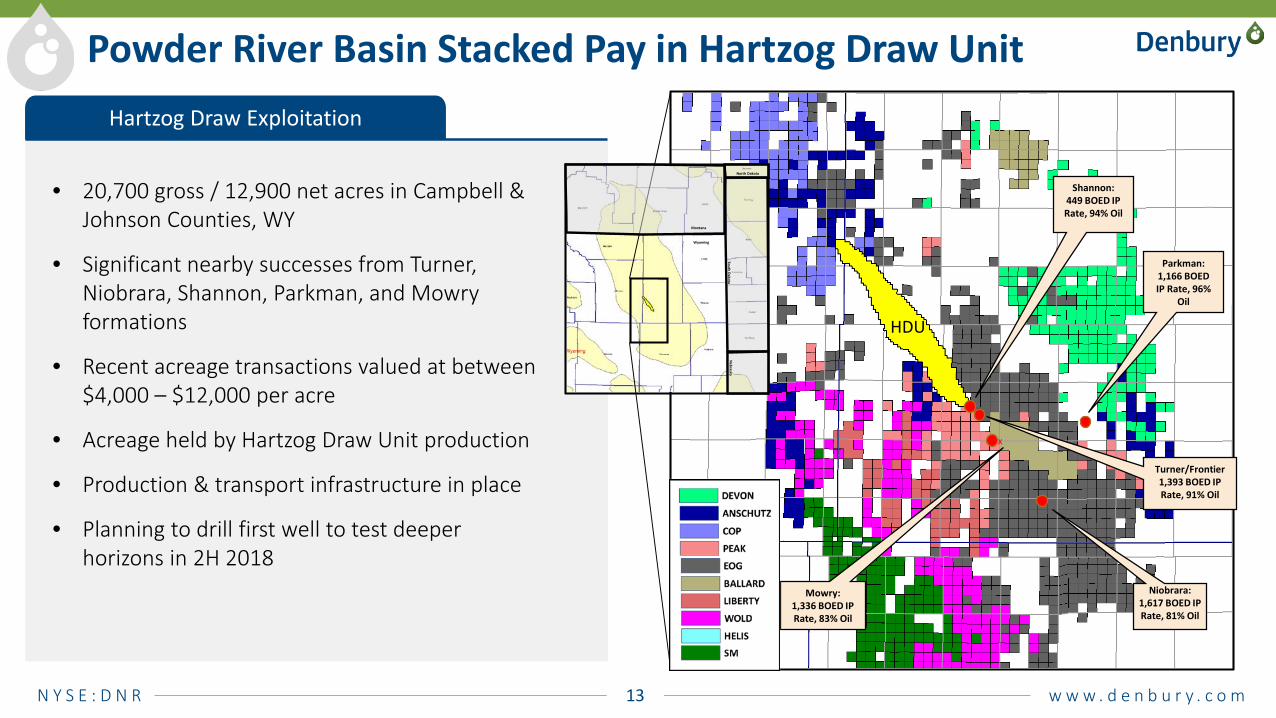
Powder River Basin Stacked Pay in Hartzog Draw Unit
• 20,700 gross / 12,900 net acres in Campbell & Johnson Counties, WY
• Significant nearby successes from Turner, Niobrara, Shannon, Parkman, and Mowry formations
• Recent acreage transactions valued at between $4,000 – $12,000 per acre
• Acreage held by Hartzog Draw Unit production
• Production & transport infrastructure in place
• Planning to drill first well to test deeper horizons in 2H 2018
x
x
xxx
Mowry: 1,336 BOED IP Rate, 83% Oil
Turner/Frontier 1,393 BOED IP Rate, 91% Oil
Niobrara: 1,617 BOED IP Rate, 81% Oil
Shannon:449 BOED IP Rate, 94% Oil
Parkman:1,166 BOED IP Rate, 96%
Oil
HDU
South Dakota
Nebraska
North Dakota
Montana
Wyoming
Hartzog Draw Exploitation
N Y S E : D N R 14 w w w . d e n b u r y . c o m
Financial ReviewMark Allen
N Y S E : D N R 15 w w w . d e n b u r y . c o m
4Q17 3Q17 FY 2017
In millions, except per-share data Amount Per Diluted Share(2) Amount Per Diluted
Share(2) Amount Per Diluted Share(2)
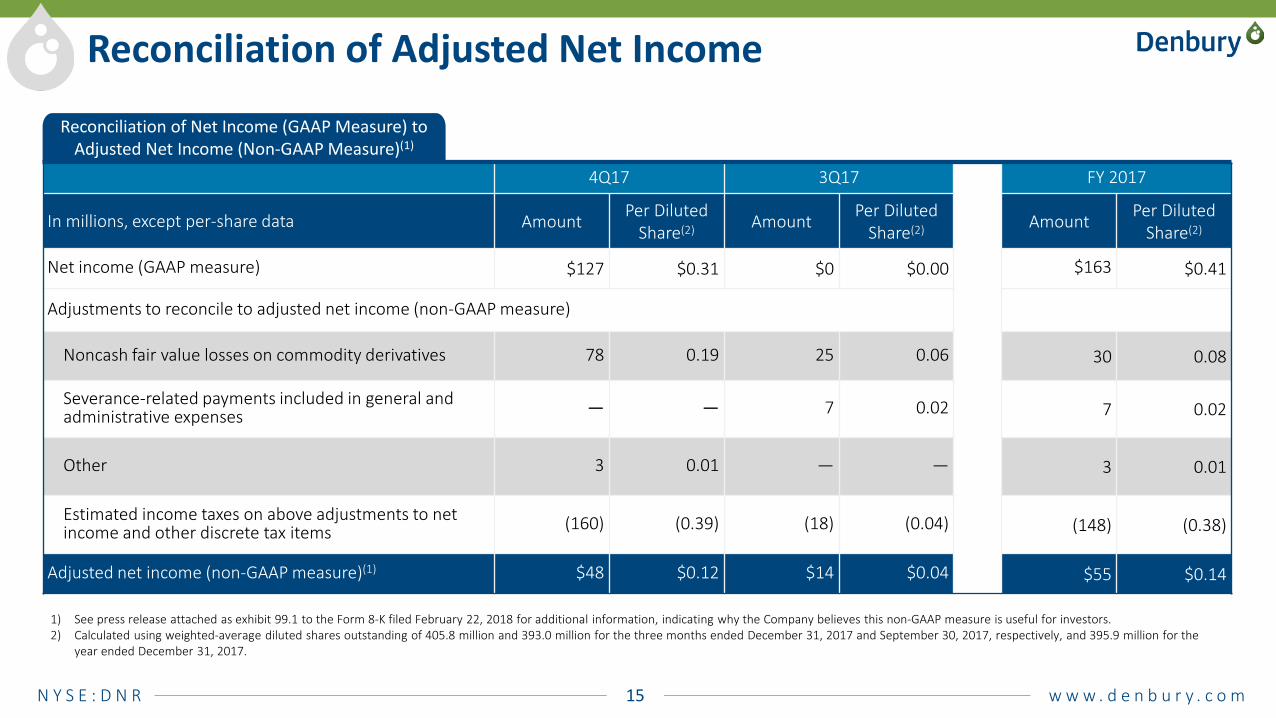
Net income (GAAP measure) $127 $0.31 $0 $0.00 $163 $0.41
Adjustments to reconcile to adjusted net income (non-GAAP measure)
Noncash fair value losses on commodity derivatives 78 0.19 25 0.06 30 0.08
Severance-related payments included in general and administrative expenses — — 7 0.02 7 0.02
Other 3 0.01 — — 3 0.01
Estimated income taxes on above adjustments to net income and other discrete tax items (160) (0.39) (18) (0.04) (148) (0.38)
Adjusted net income (non-GAAP measure)(1) $48 $0.12 $14 $0.04 $55 $0.14
1) See press release attached as exhibit 99.1 to the Form 8-K filed February 22, 2018 for additional information, indicating why the Company believes this non-GAAP measure is useful for investors.2) Calculated using weighted-average diluted shares outstanding of 405.8 million and 393.0 million for the three months ended December 31, 2017 and September 30, 2017, respectively, and 395.9 million for the
year ended December 31, 2017.
Reconciliation of Adjusted Net Income
Reconciliation of Net Income (GAAP Measure) to Adjusted Net Income (Non-GAAP Measure)(1)
N Y S E : D N R 16 w w w . d e n b u r y . c o m
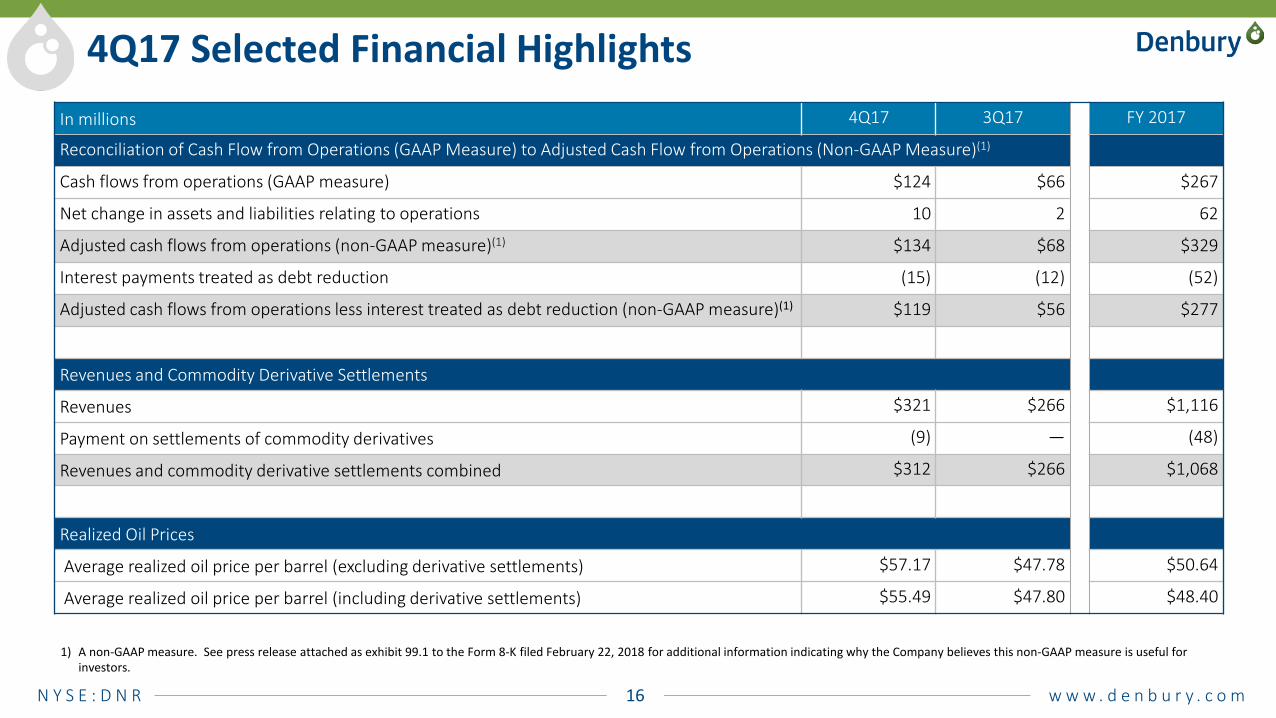
1) A non-GAAP measure. See press release attached as exhibit 99.1 to the Form 8-K filed February 22, 2018 for additional information indicating why the Company believes this non-GAAP measure is useful for investors.
4Q17 Selected Financial HighlightsIn millions 4Q17 3Q17 FY 2017
Reconciliation of Cash Flow from Operations (GAAP Measure) to Adjusted Cash Flow from Operations (Non-GAAP Measure)(1)
Cash flows from operations (GAAP measure) $124 $66 $267
Net change in assets and liabilities relating to operations 10 2 62
Adjusted cash flows from operations (non-GAAP measure)(1) $134 $68 $329
Interest payments treated as debt reduction (15) (12) (52)
Adjusted cash flows from operations less interest treated as debt reduction (non-GAAP measure)(1) $119 $56 $277
Revenues and Commodity Derivative Settlements
Revenues $321 $266 $1,116
Payment on settlements of commodity derivatives (9) — (48)
Revenues and commodity derivative settlements combined $312 $266 $1,068
Realized Oil Prices
Average realized oil price per barrel (excluding derivative settlements) $57.17 $47.78 $50.64
Average realized oil price per barrel (including derivative settlements) $55.49 $47.80 $48.40
N Y S E : D N R 17 w w w . d e n b u r y . c o m
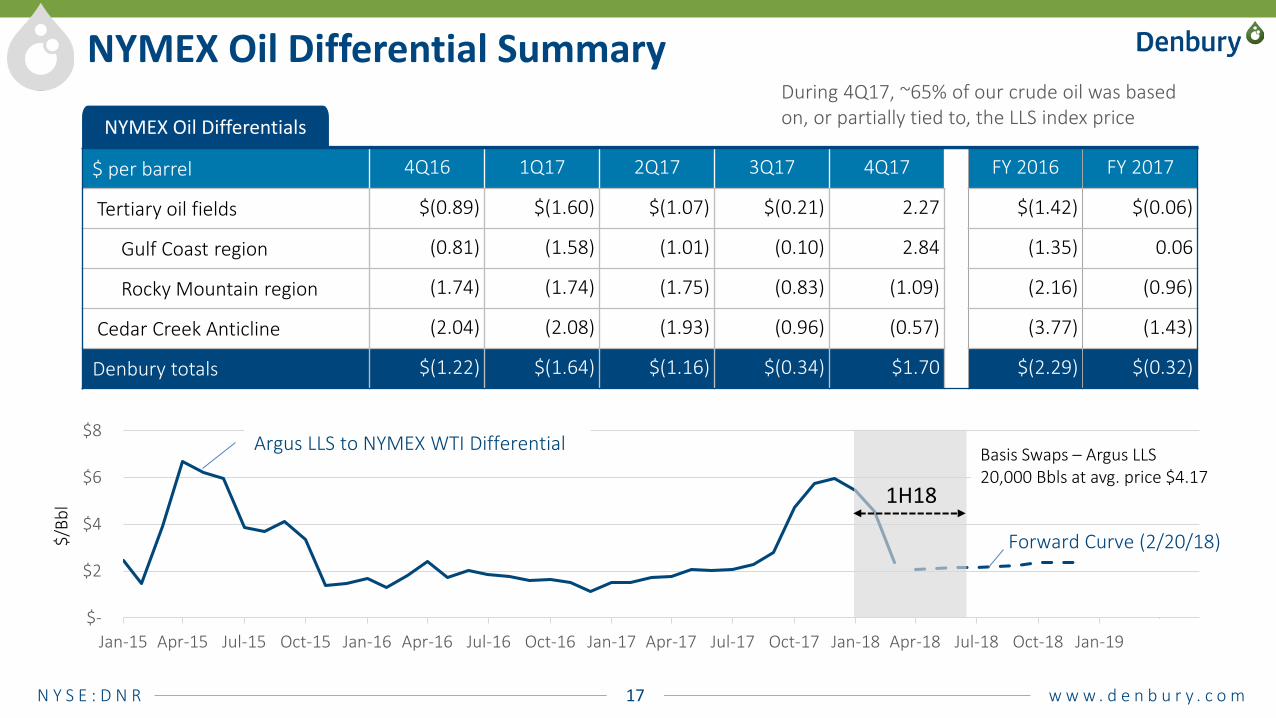
$ per barrel 4Q16 1Q17 2Q17 3Q17 4Q17 FY 2016 FY 2017
Tertiary oil fields $(0.89) $(1.60) $(1.07) $(0.21) 2.27 $(1.42) $(0.06)
Gulf Coast region (0.81) (1.58) (1.01) (0.10) 2.84 (1.35) 0.06
Rocky Mountain region (1.74) (1.74) (1.75) (0.83) (1.09) (2.16) (0.96)
Cedar Creek Anticline (2.04) (2.08) (1.93) (0.96) (0.57) (3.77) (1.43)
Denbury totals $(1.22) $(1.64) $(1.16) $(0.34) $1.70 $(2.29) $(0.32)
NYMEX Oil Differential Summary
$-
$2
$4
$6
$8
Jan-15 Apr-15 Jul-15 Oct-15 Jan-16 Apr-16 Jul-16 Oct-16 Jan-17 Apr-17 Jul-17 Oct-17 Jan-18 Apr-18 Jul-18 Oct-18 Jan-19 Apr-19
Argus LLS to NYMEX WTI Differential
Forward Curve (2/20/18)
During 4Q17, ~65% of our crude oil was based on, or partially tied to, the LLS index price
Basis Swaps – Argus LLS20,000 Bbls at avg. price $4.17
NYMEX Oil Differentials
1H18
$/Bb
l
N Y S E : D N R 18 w w w . d e n b u r y . c o m
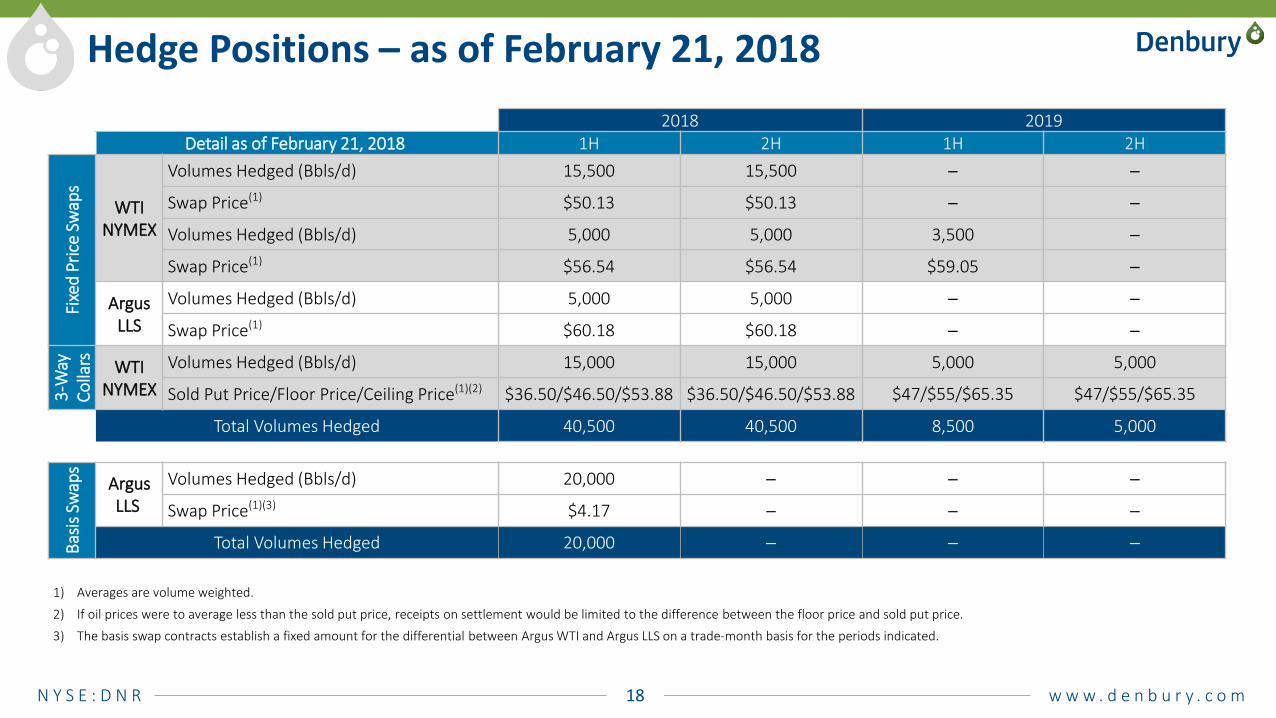
Hedge Positions – as of February 21, 20182018 2019
Detail as of February 21, 2018 1H 2H 1H 2H
Fixe
d Pr
ice
Swap
s
WTI NYMEX
Volumes Hedged (Bbls/d) 15,500 15,500 ─ ─
Swap Price(1) $50.13 $50.13 ─ ─
Volumes Hedged (Bbls/d) 5,000 5,000 3,500 ─
Swap Price(1) $56.54 $56.54 $59.05 ─
Argus LLS
Volumes Hedged (Bbls/d) 5,000 5,000 ─ ─
Swap Price(1) $60.18 $60.18 ─ ─
3-W
ay
Colla
rs WTI NYMEX
Volumes Hedged (Bbls/d) 15,000 15,000 5,000 5,000
Sold Put Price/Floor Price/Ceiling Price(1)(2) $36.50/$46.50/$53.88 $36.50/$46.50/$53.88 $47/$55/$65.35 $47/$55/$65.35
Total Volumes Hedged 40,500 40,500 8,500 5,000
Basis
Sw
aps
Argus LLS
Volumes Hedged (Bbls/d) 20,000 ─ ─ ─
Swap Price(1)(3) $4.17 ─ ─ ─
Total Volumes Hedged 20,000 ─ ─ ─
1) Averages are volume weighted.
2) If oil prices were to average less than the sold put price, receipts on settlement would be limited to the difference between the floor price and sold put price.
3) The basis swap contracts establish a fixed amount for the differential between Argus WTI and Argus LLS on a trade-month basis for the periods indicated.
N Y S E : D N R 19 w w w . d e n b u r y . c o m
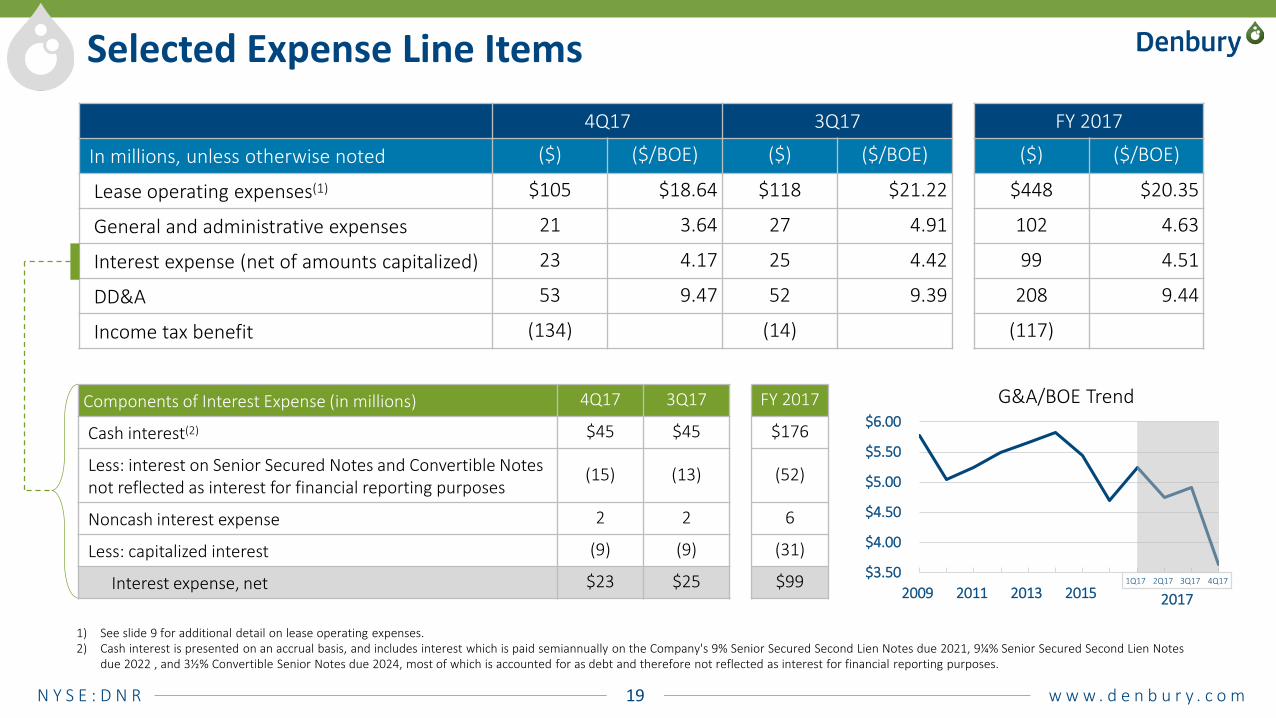
4Q17 3Q17 FY 2017
In millions, unless otherwise noted ($) ($/BOE) ($) ($/BOE) ($) ($/BOE)
Lease operating expenses(1) $105 $18.64 $118 $21.22 $448 $20.35
General and administrative expenses 21 3.64 27 4.91 102 4.63
Interest expense (net of amounts capitalized) 23 4.17 25 4.42 99 4.51
DD&A 53 9.47 52 9.39 208 9.44
Income tax benefit (134) (14) (117)
1) See slide 9 for additional detail on lease operating expenses.2) Cash interest is presented on an accrual basis, and includes interest which is paid semiannually on the Company's 9% Senior Secured Second Lien Notes due 2021, 9¼% Senior Secured Second Lien Notes
due 2022 , and 3½% Convertible Senior Notes due 2024, most of which is accounted for as debt and therefore not reflected as interest for financial reporting purposes.
Components of Interest Expense (in millions) 4Q17 3Q17 FY 2017
Cash interest(2) $45 $45 $176
Less: interest on Senior Secured Notes and Convertible Notes not reflected as interest for financial reporting purposes
(15) (13) (52)
Noncash interest expense 2 2 6
Less: capitalized interest (9) (9) (31)
Interest expense, net $23 $25 $99
Selected Expense Line Items
$3.50
$4.00
$4.50
$5.00
$5.50
$6.00
2009 2011 2013 2015 1Q17 3Q17
G&A/BOE Trend
1Q17 2Q17 3Q17 4Q17
2017
N Y S E : D N R 20 w w w . d e n b u r y . c o m
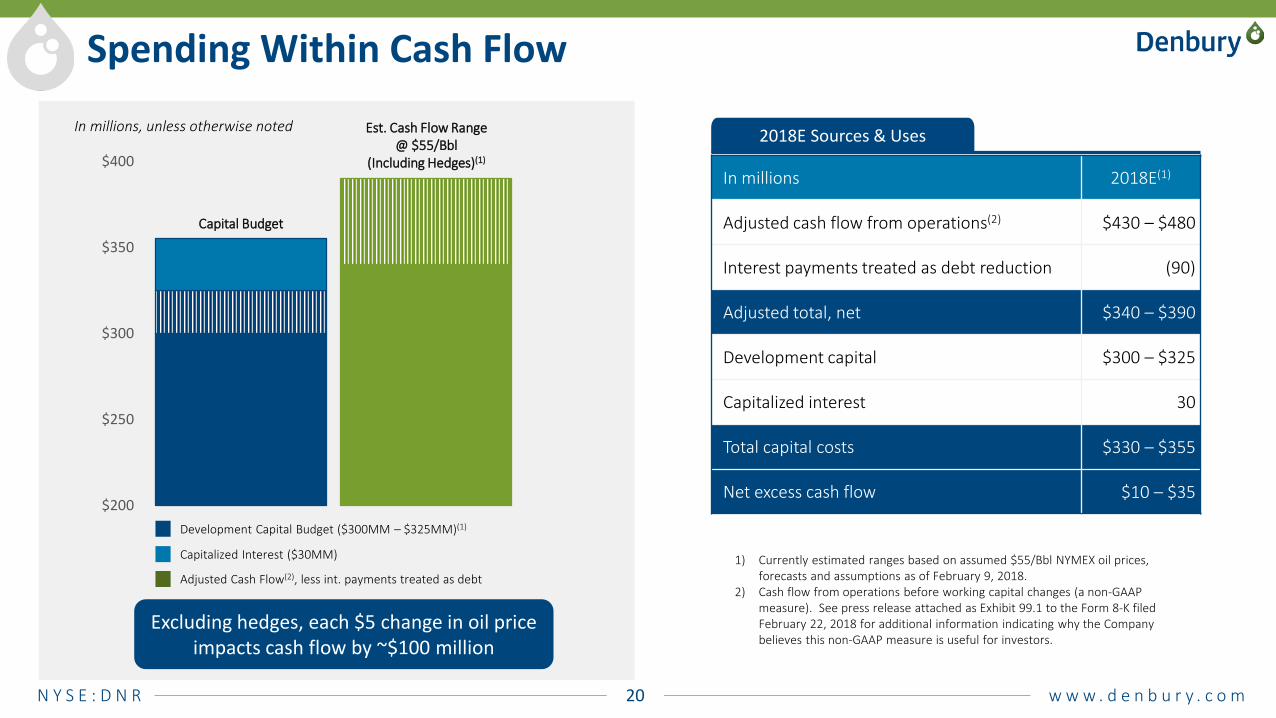
Spending Within Cash Flow
$200
$250
$300
$350
$400
Capital Budget
In millions, unless otherwise noted
In millions 2018E(1)
Adjusted cash flow from operations(2) $430 – $480
Interest payments treated as debt reduction (90)
Adjusted total, net $340 – $390
Development capital $300 – $325
Capitalized interest 30
Total capital costs $330 – $355
Net excess cash flow $10 – $35
2018E Sources & UsesEst. Cash Flow Range @ $55/Bbl
(Including Hedges)(1)
1) Currently estimated ranges based on assumed $55/Bbl NYMEX oil prices, forecasts and assumptions as of February 9, 2018.
2) Cash flow from operations before working capital changes (a non-GAAP measure). See press release attached as Exhibit 99.1 to the Form 8-K filed February 22, 2018 for additional information indicating why the Company believes this non-GAAP measure is useful for investors.
Excluding hedges, each $5 change in oil price impacts cash flow by ~$100 million
Capitalized Interest ($30MM)
Development Capital Budget ($300MM – $325MM)(1)
Adjusted Cash Flow(2), less int. payments treated as debt
N Y S E : D N R 21 w w w . d e n b u r y . c o m
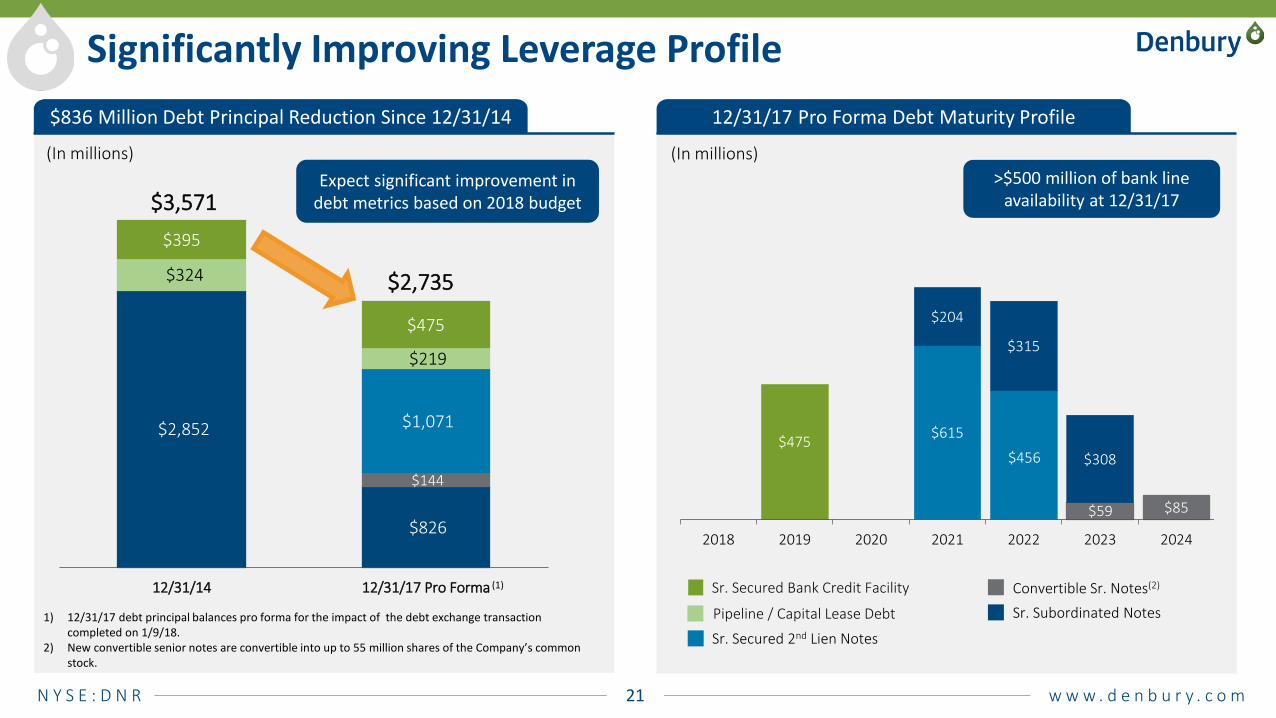
$836 Million Debt Principal Reduction Since 12/31/14
$2,852
$826
$144
$1,071
$324
$219
$395
$475
12/31/14 12/31/17 Pro Forma
Significantly Improving Leverage Profile
$3,571
$2,735
(In millions)
$475 $615
$204
$456
$315
$59
$308
$85
2018 2019 2020 2021 2022 2023 2024
Convertible Sr. Notes(2)
Sr. Subordinated Notes
Sr. Secured Bank Credit Facility
Pipeline / Capital Lease Debt
Sr. Secured 2nd Lien Notes
12/31/17 Pro Forma Debt Maturity Profile
(In millions)
1) 12/31/17 debt principal balances pro forma for the impact of the debt exchange transaction completed on 1/9/18.
2) New convertible senior notes are convertible into up to 55 million shares of the Company’s common stock.
(1)
Expect significant improvement in debt metrics based on 2018 budget
>$500 million of bank line availability at 12/31/17
N Y S E : D N R 22 w w w . d e n b u r y . c o m
Q&A
N Y S E : D N R 23 w w w . d e n b u r y . c o m
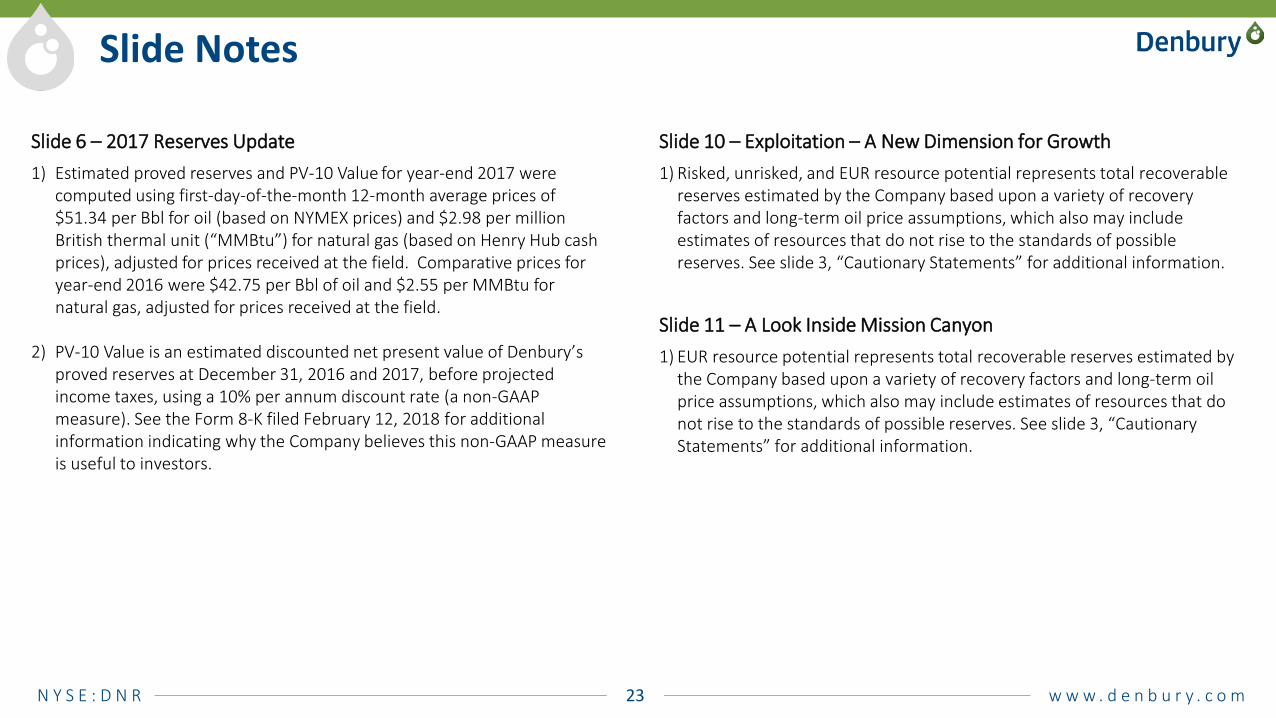
Slide Notes
Slide 10 – Exploitation – A New Dimension for Growth1) Risked, unrisked, and EUR resource potential represents total recoverable
reserves estimated by the Company based upon a variety of recovery factors and long-term oil price assumptions, which also may include estimates of resources that do not rise to the standards of possible reserves. See slide 3, “Cautionary Statements” for additional information.
Slide 11 – A Look Inside Mission Canyon1) EUR resource potential represents total recoverable reserves estimated by
the Company based upon a variety of recovery factors and long-term oil price assumptions, which also may include estimates of resources that do not rise to the standards of possible reserves. See slide 3, “Cautionary Statements” for additional information.
Slide 6 – 2017 Reserves Update1) Estimated proved reserves and PV-10 Value for year-end 2017 were
computed using first-day-of-the-month 12-month average prices of $51.34 per Bbl for oil (based on NYMEX prices) and $2.98 per million British thermal unit (“MMBtu”) for natural gas (based on Henry Hub cash prices), adjusted for prices received at the field. Comparative prices for year-end 2016 were $42.75 per Bbl of oil and $2.55 per MMBtu for natural gas, adjusted for prices received at the field.
2) PV-10 Value is an estimated discounted net present value of Denbury’s proved reserves at December 31, 2016 and 2017, before projected income taxes, using a 10% per annum discount rate (a non-GAAP measure). See the Form 8-K filed February 12, 2018 for additional information indicating why the Company believes this non-GAAP measure is useful to investors.