4q18 earnings release€¦ · in 4q18, 57,569 cars were purchased and 32,281 cars were sold,...
TRANSCRIPT

4Q17 and 2017 Earnings Release
2
Dear Investors, We finished the year of 2018 with impressive results. The average rented fleet of the Car Rental Division increased 39.4%, totaling 97,245 cars, while Fleet Rental’s grew 19.5%, reaching 42,321 cars. Seminovos sales totaled 111,279 cars in the year, representing a growth of 22.9%. The final result was consolidated net revenues of R$ 7.9 billion, 30.3% higher than in 2017, with a net income totaling R$659.2 million in the year. Despite the strong growth and operational challenges as a result of our business strong expansion, the main quality and productivity indicators evolved. Our customer satisfaction index, measured by the NPS (net promoter score), has increased in all segments and the result of our annual organizational climate survey has placed us among the top 25% of companies conducting the same survey by Korn Ferry. We won several quality related awards, of which we highlight the Época Reclame Aqui awards (winner for the 4th consecutive time in Car Rental and 2nd consecutive time in Seminovos), best car rental company by Datafolha, best service company and best rental company for Small and Midsize Companies by Estadão newspaper. We were also elected the most innovative company in the category of transportation and logistics, according to the "Valor Inovação" award of Valor Econômico newspaper and were evaluated the 22nd most valuable brand in Brazil according to Interbrand, reaffirming the recognition of our brand. Last year’s results consistency is due to a planned and shared transformation agenda between the Board of Directors and the Executive Officers. I would like to highlight some priorities that were part of this agenda: (1) Our careful renewal and succession process of the Company's management. A process conducted with great caution, ensuring the alignment of the new professionals with the values of Localiza, promoting a smooth transition to preserve the experience and knowledge of the successors, who temporarily remain at the Company as senior advisors; (2) In order to take advantage of market movements and technology opportunities, we invest in the development of our employees and leaders, as well as in hiring new talents with complementary skills. In addition, we placed a culture project, with the participation of all employees, which reinforces and updates our values and characteristics, preparing us for future challenges; (3) We have expanded our digital leadership by investing in customer experience innovation and operational excellence across the platform. We have also invested in our brand, reinforcing our leadership in customer’s preference and brand awareness; (4) We continue focusing and carefully working with our programs of integrity, governance, and sustainability that strengthen our reputation in the market with all stakeholders. We would like to thank the investors who trusted the Company and participated in our primary funding of R$1.8 billion concluded in February 2019. With these resources we will support our business and expansion plans. We also thank our employees for the commitment and energy they have dedicated to making all this happen, taking even better care of our clients and cultivating a trust relationship with all our stakeholders. We started 2019 with even higher motivation and focused on the growth with profitability and quality goals, expanding our market leadership.
Eugênio Mattar.
3
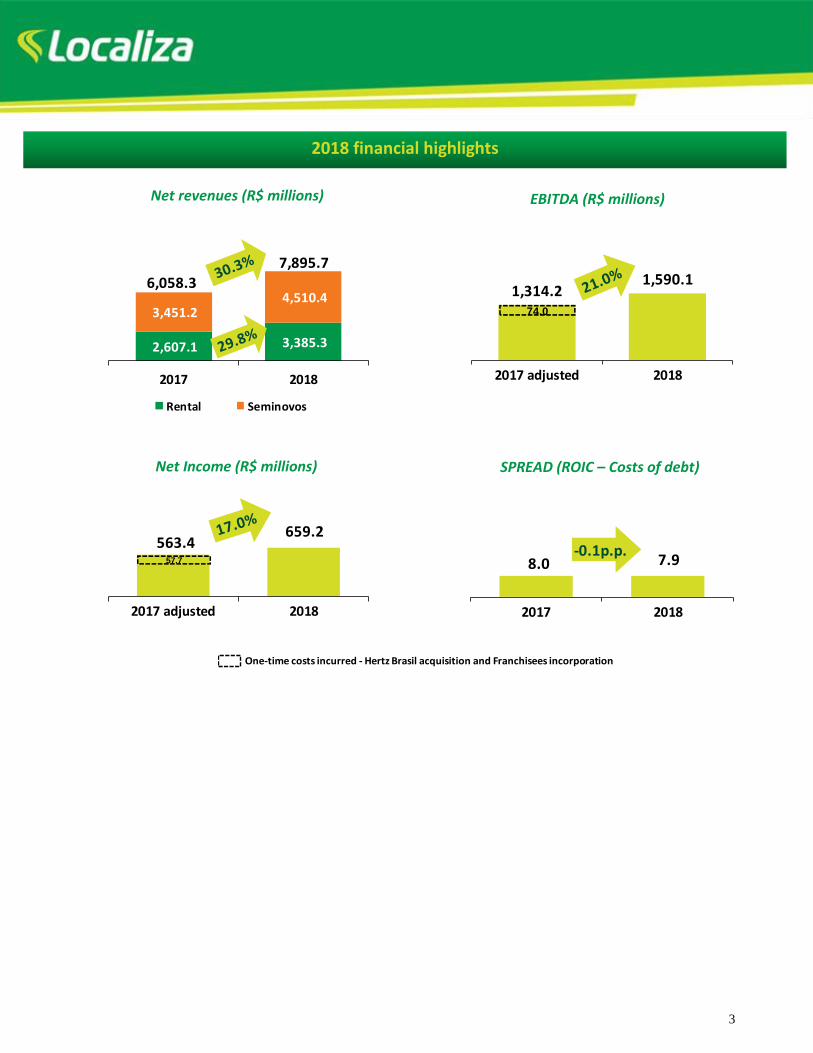
2018 financial highlights
Net revenues (R$ millions)
EBITDA (R$ millions)
Net Income (R$ millions)
SPREAD (ROIC – Costs of debt)
One-time costs incurred - Hertz Brasil acquisition and Franchisees incorporation
+38,0%4T/4T
+38,6%4T/4T2,607.1 3,385.3
3,451.2 4,510.4
6,058.3
7,895.7
2017 2018
Rental Seminovos
1,314.2 1,590.1
2017 adjusted 2018
74.0
563.4 659.2
2017 adjusted 2018
57.7 8.0 7.9
2017 2018
-0.1p.p.
4
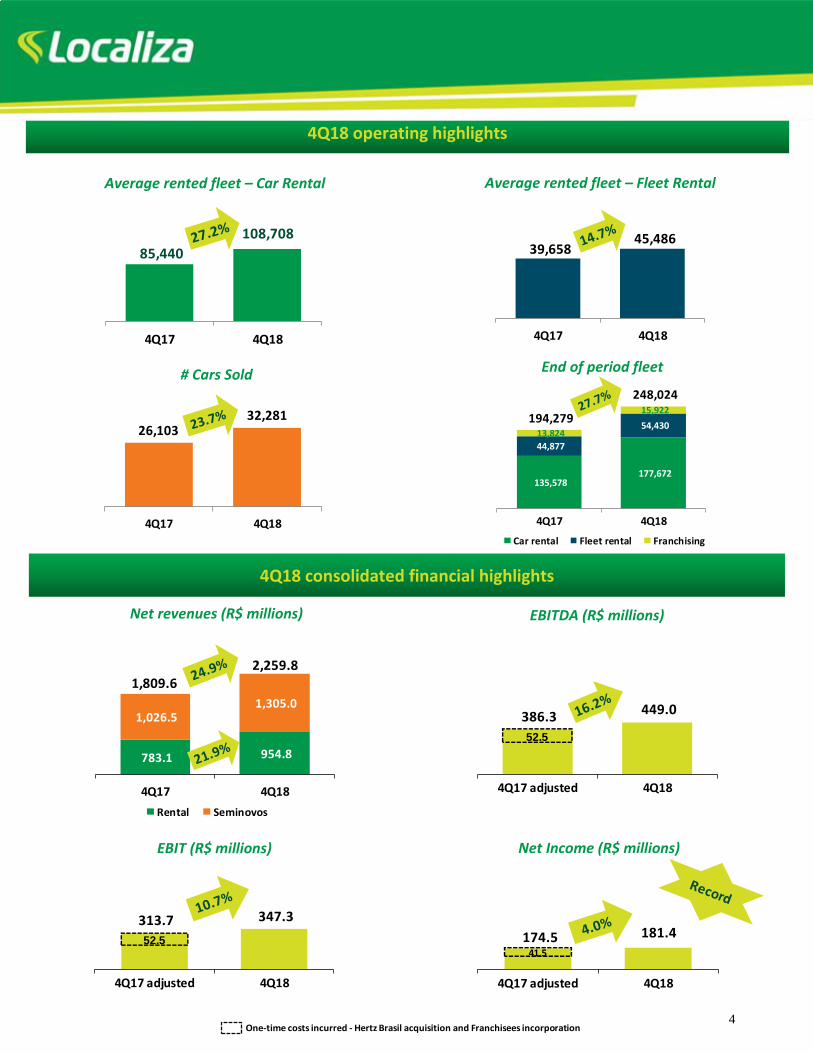
85,440
108,708
4Q17 4Q18
39,658 45,486
4Q17 4Q18
4Q18 operating highlights
Average rented fleet – Fleet Rental
Net Income (R$ millions)
Average rented fleet – Car Rental
4Q18 consolidated financial highlights
EBIT (R$ millions)
Net revenues (R$ millions)
EBITDA (R$ millions)
# Cars Sold End of period fleet
26,103 32,281
4Q17 4Q18
135,578 177,672
44,877
54,430 13,824
15,922 194,279
248,024
4Q17 4Q18
Car rental Fleet rental Franchising
One-time costs incurred - Hertz Brasil acquisition and Franchisees incorporation
+38,0%4T/4T
+38,6%4T/4T783.1 954.8
1,026.5 1,305.0
1,809.6 2,259.8
4Q17 4Q18
Rental Seminovos
386.3 449.0
4Q17 adjusted 4Q18
52.5
313.7 347.3
4Q17 adjusted 4Q18
52.5 174.5 181.4
4Q17 adjusted 4Q18
41.5
5
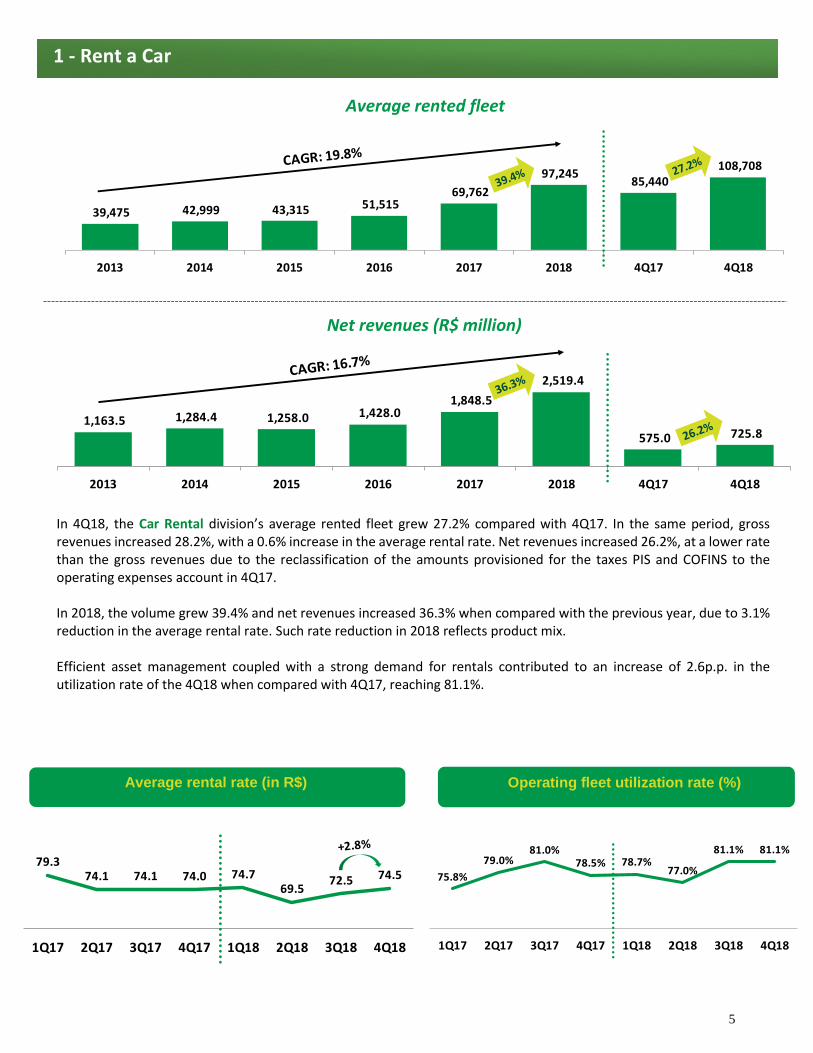
Average rented fleet
Net revenues (R$ million)
In 4Q18, the Car Rental division’s average rented fleet grew 27.2% compared with 4Q17. In the same period, gross revenues increased 28.2%, with a 0.6% increase in the average rental rate. Net revenues increased 26.2%, at a lower rate than the gross revenues due to the reclassification of the amounts provisioned for the taxes PIS and COFINS to the operating expenses account in 4Q17. In 2018, the volume grew 39.4% and net revenues increased 36.3% when compared with the previous year, due to 3.1% reduction in the average rental rate. Such rate reduction in 2018 reflects product mix. Efficient asset management coupled with a strong demand for rentals contributed to an increase of 2.6p.p. in the utilization rate of the 4Q18 when compared with 4Q17, reaching 81.1%.
Average rental rate (in R$)
1 - Rent a Car
Operating fleet utilization rate (%)
39,475 42,999 43,315 51,515 69,762
97,245 85,440
108,708
2013 2014 2015 2016 2017 2018 4Q17 4Q18
79.374.1 74.1 74.0 74.7
69.572.5 74.5
1Q17 2Q17 3Q17 4Q17 1Q18 2Q18 3Q18 4Q18
75.8%
79.0%81.0%
78.5% 78.7%77.0%
81.1% 81.1%
1Q17 2Q17 3Q17 4Q17 1Q18 2Q18 3Q18 4Q18
1,163.5 1,284.4 1,258.0 1,428.0 1,848.5
2,519.4
575.0 725.8
2013 2014 2015 2016 2017 2018 4Q17 4Q18
6
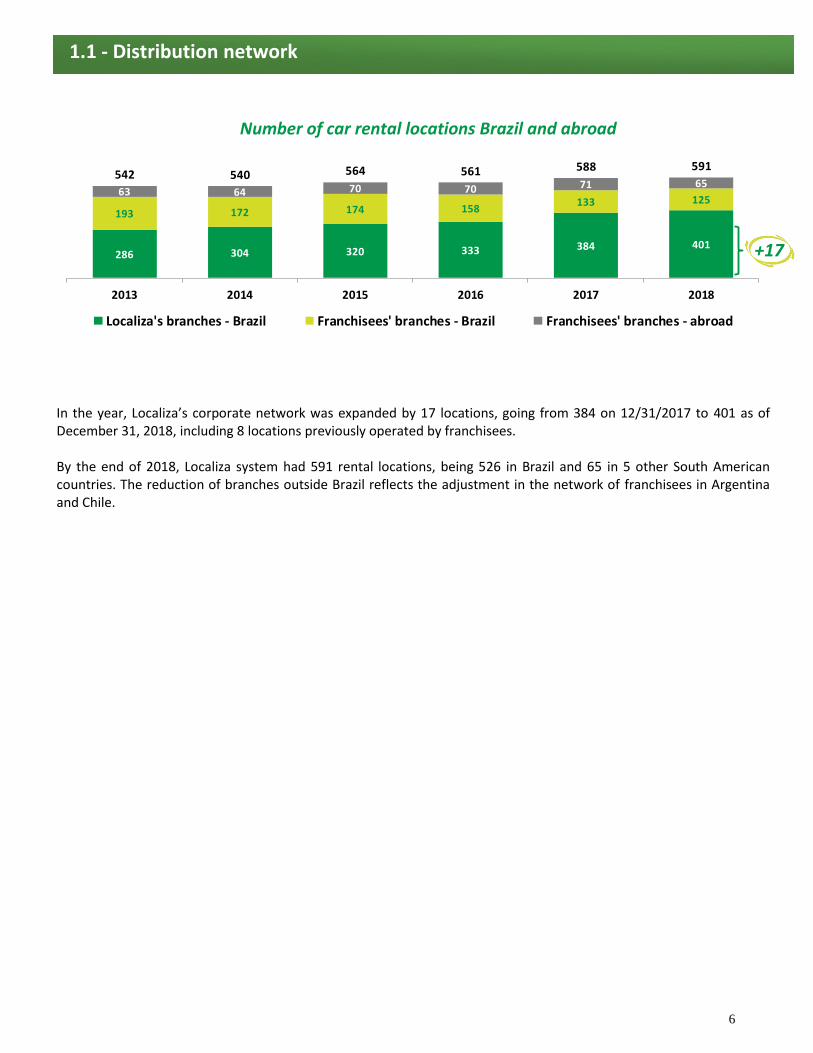
Number of car rental locations Brazil and abroad
In the year, Localiza’s corporate network was expanded by 17 locations, going from 384 on 12/31/2017 to 401 as of December 31, 2018, including 8 locations previously operated by franchisees. By the end of 2018, Localiza system had 591 rental locations, being 526 in Brazil and 65 in 5 other South American countries. The reduction of branches outside Brazil reflects the adjustment in the network of franchisees in Argentina and Chile.
1.1 - Distribution network
286 304 320 333 384 401
193 172 174 158133 125
63 64 70 70 71 65542 540 564 561 588 591
2013 2014 2015 2016 2017 2018
Localiza's branches - Brazil Franchisees' branches - Brazil Franchisees' branches - abroad
+17
7
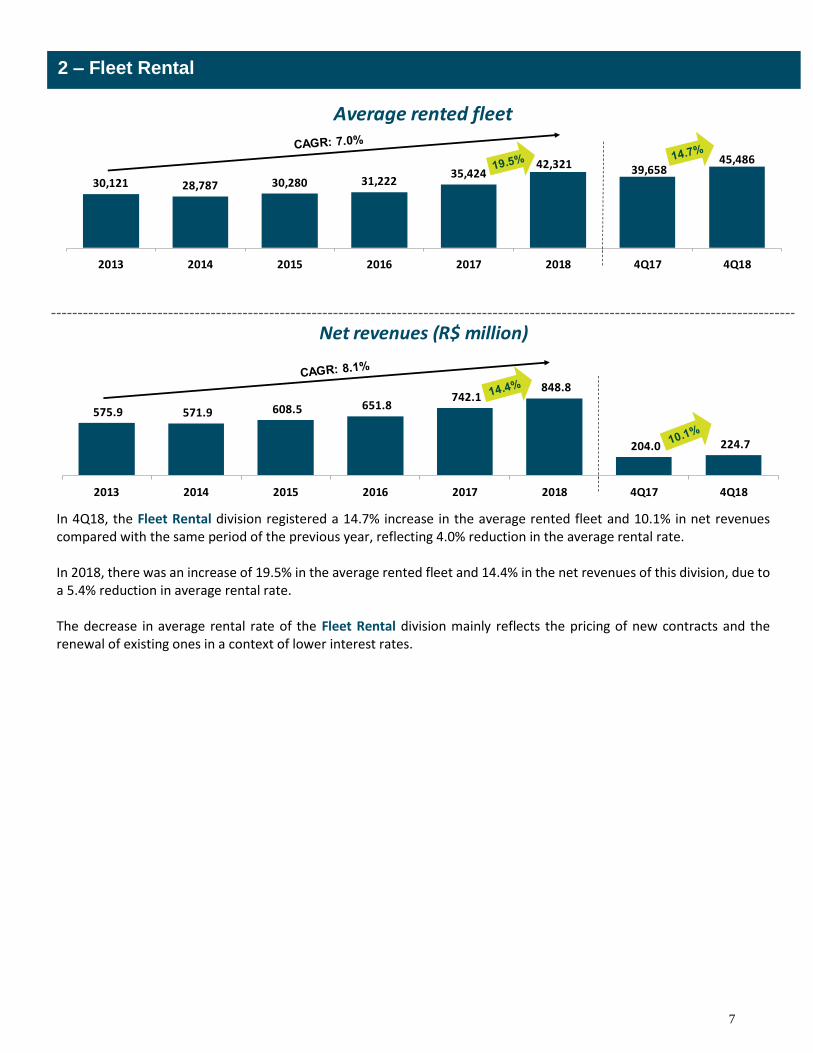
In 4Q18, the Fleet Rental division registered a 14.7% increase in the average rented fleet and 10.1% in net revenues compared with the same period of the previous year, reflecting 4.0% reduction in the average rental rate. In 2018, there was an increase of 19.5% in the average rented fleet and 14.4% in the net revenues of this division, due to a 5.4% reduction in average rental rate. The decrease in average rental rate of the Fleet Rental division mainly reflects the pricing of new contracts and the renewal of existing ones in a context of lower interest rates.
Net revenues (R$ million)
2 – Fleet Rental
Average rented fleet
30,121 28,787 30,280 31,22235,424
42,321 39,65845,486
-
5,000
10,000
15,000
20,000
25,000
30,000
35,000
40,000
45,000
50,000
2013 2014 2015 2016 2017 2018 4Q17 4Q18
575.9 571.9 608.5 651.8 742.1
848.8
204.0 224.7
2013 2014 2015 2016 2017 2018 4Q17 4Q18
8
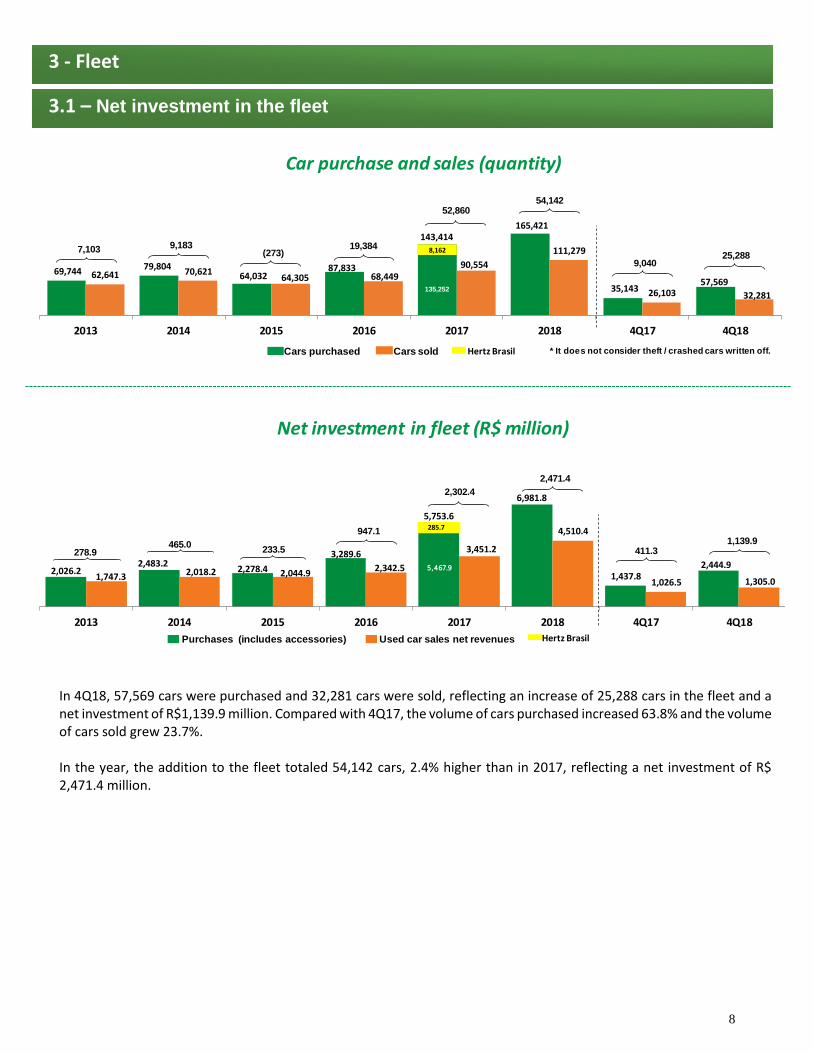
In 4Q18, 57,569 cars were purchased and 32,281 cars were sold, reflecting an increase of 25,288 cars in the fleet and a net investment of R$1,139.9 million. Compared with 4Q17, the volume of cars purchased increased 63.8% and the volume of cars sold grew 23.7%. In the year, the addition to the fleet totaled 54,142 cars, 2.4% higher than in 2017, reflecting a net investment of R$ 2,471.4 million.
3 - Fleet
3.1 – Net investment in the fleet
Net investment in fleet (R$ million)
Car purchase and sales (quantity)
Cars purchased Cars sold Hertz Brasil
69,744 79,804 64,032
87,833
143,414 165,421
35,143 57,569
62,641 70,62164,305 68,449
90,554
111,279
26,103 32,281
2013 2014 2015 2016 2017 2018 4Q17 4Q18
7,103 9,183(273)
19,384
135,252
8,162
52,860
9,040
* It does not consider theft / crashed cars written off.
54,142
25,288
Purchases (includes accessories) Used car sales net revenues Hertz Brasil
2,026.22,483.2
2,278.4
3,289.6
5,753.6
6,981.8
1,437.82,444.9
1,747.3 2,018.2 2,044.92,342.5
3,451.2
4,510.4
1,026.5 1,305.0
2013 2014 2015 2016 2017 2018 4Q17 4Q18
465.0278.9 233.5
947.1
5,467.9
285.7
2,302.4
411.3
2,471.4
1,139.9
9
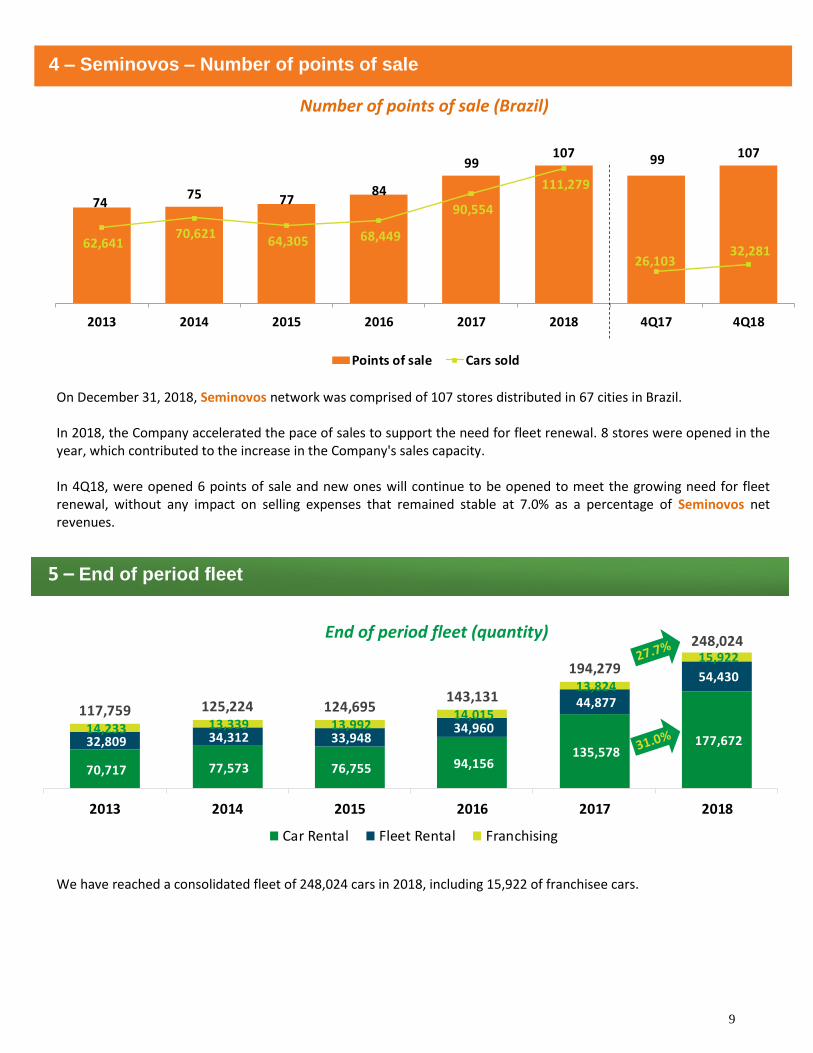
Number of points of sale (Brazil)
On December 31, 2018, Seminovos network was comprised of 107 stores distributed in 67 cities in Brazil. In 2018, the Company accelerated the pace of sales to support the need for fleet renewal. 8 stores were opened in the year, which contributed to the increase in the Company's sales capacity. In 4Q18, were opened 6 points of sale and new ones will continue to be opened to meet the growing need for fleet renewal, without any impact on selling expenses that remained stable at 7.0% as a percentage of Seminovos net revenues.
End of period fleet (quantity)
We have reached a consolidated fleet of 248,024 cars in 2018, including 15,922 of franchisee cars.
4 – Seminovos – Number of points of sale
5 – End of period fleet
70,717 77,573 76,755 94,156 135,578
177,672 32,809 34,312 33,948 34,960
44,877
54,430
14,233 13,339 13,992 14,015
13,824
15,922
117,759 125,224 124,695143,131
194,279
248,024
2013 2014 2015 2016 2017 2018
Car Rental Fleet Rental Franchising
7475 77
84
99107 99 107
62,641 70,621
64,305 68,449
90,554
111,279
26,103 32,281
-
20,000
40,000
60,000
80,000
100, 000
120, 000
140, 000
160, 000
0
20
40
60
80
10 0
12 0
14 0
2013 2014 2015 2016 2017 2018 4Q17 4Q18
Points of sale Cars sold
10
Consolidated net revenues (R$ million)
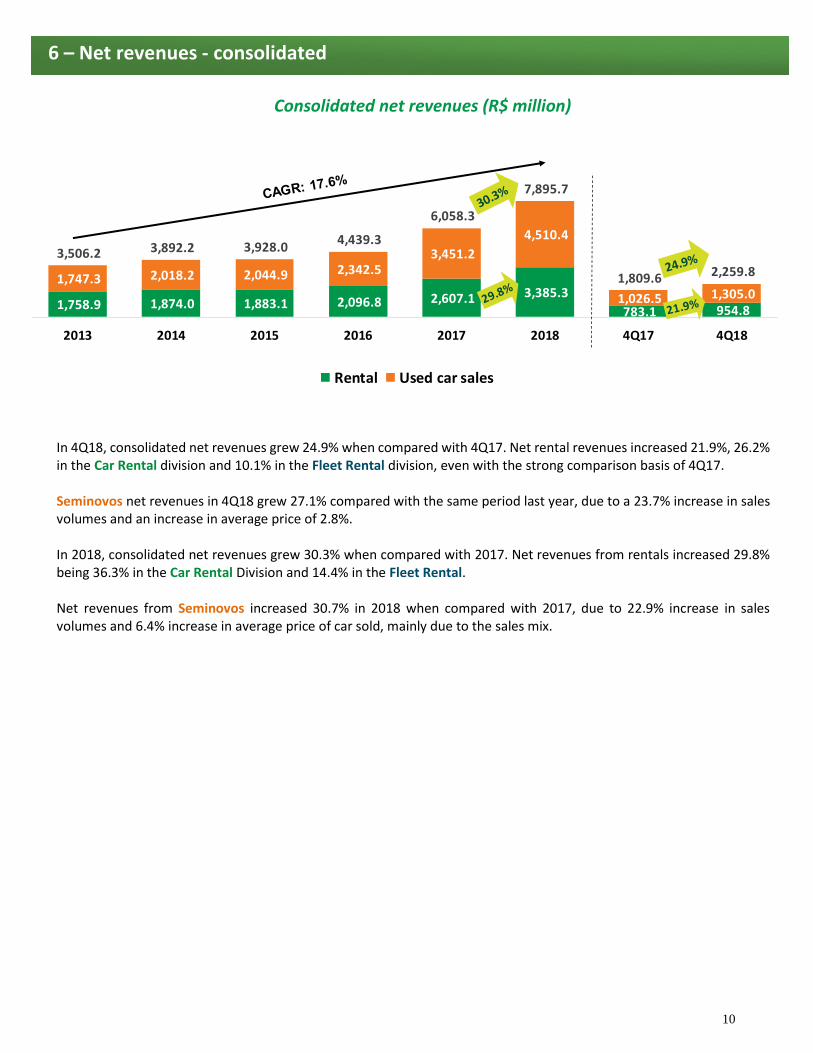
In 4Q18, consolidated net revenues grew 24.9% when compared with 4Q17. Net rental revenues increased 21.9%, 26.2% in the Car Rental division and 10.1% in the Fleet Rental division, even with the strong comparison basis of 4Q17. Seminovos net revenues in 4Q18 grew 27.1% compared with the same period last year, due to a 23.7% increase in sales volumes and an increase in average price of 2.8%. In 2018, consolidated net revenues grew 30.3% when compared with 2017. Net revenues from rentals increased 29.8% being 36.3% in the Car Rental Division and 14.4% in the Fleet Rental. Net revenues from Seminovos increased 30.7% in 2018 when compared with 2017, due to 22.9% increase in sales volumes and 6.4% increase in average price of car sold, mainly due to the sales mix.
6 – Net revenues - consolidated
1,758.9 1,874.0 1,883.1 2,096.8 2,607.1 3,385.3
783.1 954.8
1,747.3 2,018.2 2,044.9 2,342.5 3,451.2
4,510.4
1,026.5 1,305.0
3,506.2 3,892.2 3,928.0 4,439.3
6,058.3
7,895.7
1,809.6 2,259.8
2013 2014 2015 2016 2017 2018 4Q17 4Q18
Rental Used car sales
11
Consolidated EBITDA (R$ million)
EBITDA margin:
(*) From 2014 on, it considers the new appropriation criteria of the overhead, which is also appropriated to Seminovos. (**) Adjusted by the one-time costs incurred – Hertz Brasil acquisition and Franchisees incorporation.
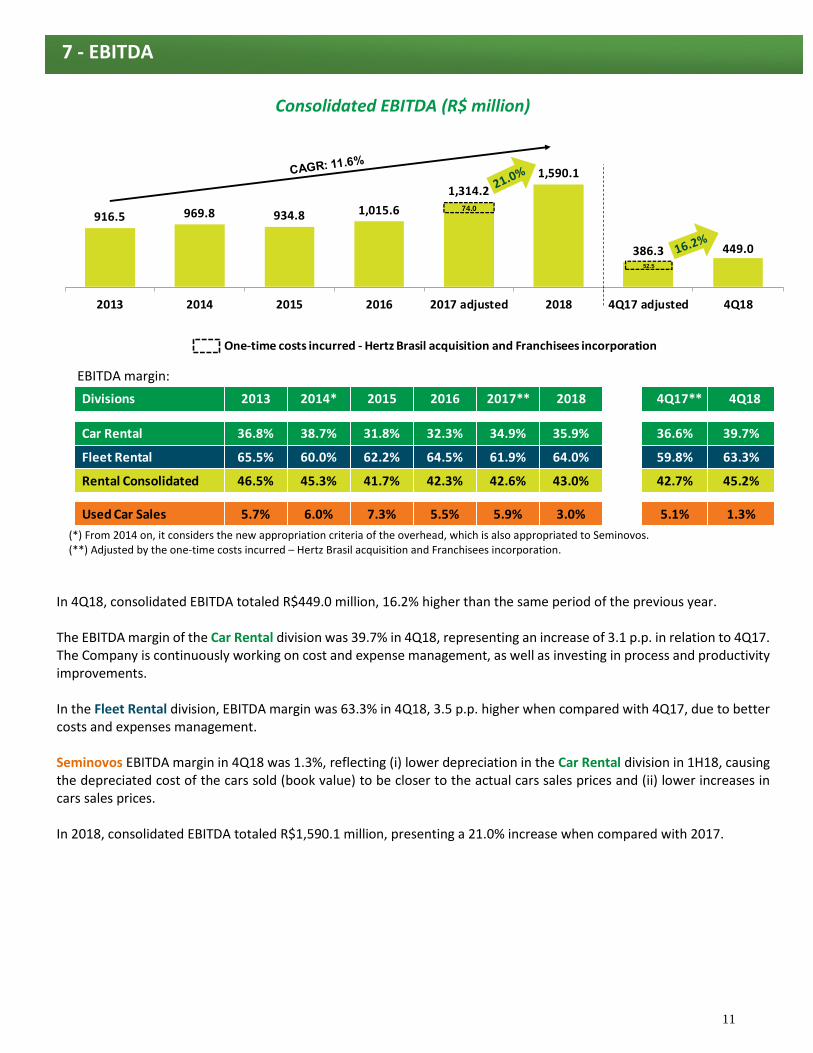
In 4Q18, consolidated EBITDA totaled R$449.0 million, 16.2% higher than the same period of the previous year. The EBITDA margin of the Car Rental division was 39.7% in 4Q18, representing an increase of 3.1 p.p. in relation to 4Q17. The Company is continuously working on cost and expense management, as well as investing in process and productivity improvements. In the Fleet Rental division, EBITDA margin was 63.3% in 4Q18, 3.5 p.p. higher when compared with 4Q17, due to better costs and expenses management. Seminovos EBITDA margin in 4Q18 was 1.3%, reflecting (i) lower depreciation in the Car Rental division in 1H18, causing the depreciated cost of the cars sold (book value) to be closer to the actual cars sales prices and (ii) lower increases in cars sales prices. In 2018, consolidated EBITDA totaled R$1,590.1 million, presenting a 21.0% increase when compared with 2017.
7 - EBITDA
One-time costs incurred - Hertz Brasil acquisition and Franchisees incorporation
916.5 969.8 934.8 1,015.6
1,314.2
1,590.1
386.3 449.0
2013 2014 2015 2016 2017 adjusted 2018 4Q17 adjusted 4Q18
74.0
52.5
Divisions 2013 2014* 2015 2016 2017** 2018 4Q17** 4Q18
Car Rental 36.8% 38.7% 31.8% 32.3% 34.9% 35.9% 36.6% 39.7%
Fleet Rental 65.5% 60.0% 62.2% 64.5% 61.9% 64.0% 59.8% 63.3%
Rental Consolidated 46.5% 45.3% 41.7% 42.3% 42.6% 43.0% 42.7% 45.2%
Used Car Sales 5.7% 6.0% 7.3% 5.5% 5.9% 3.0% 5.1% 1.3%
12
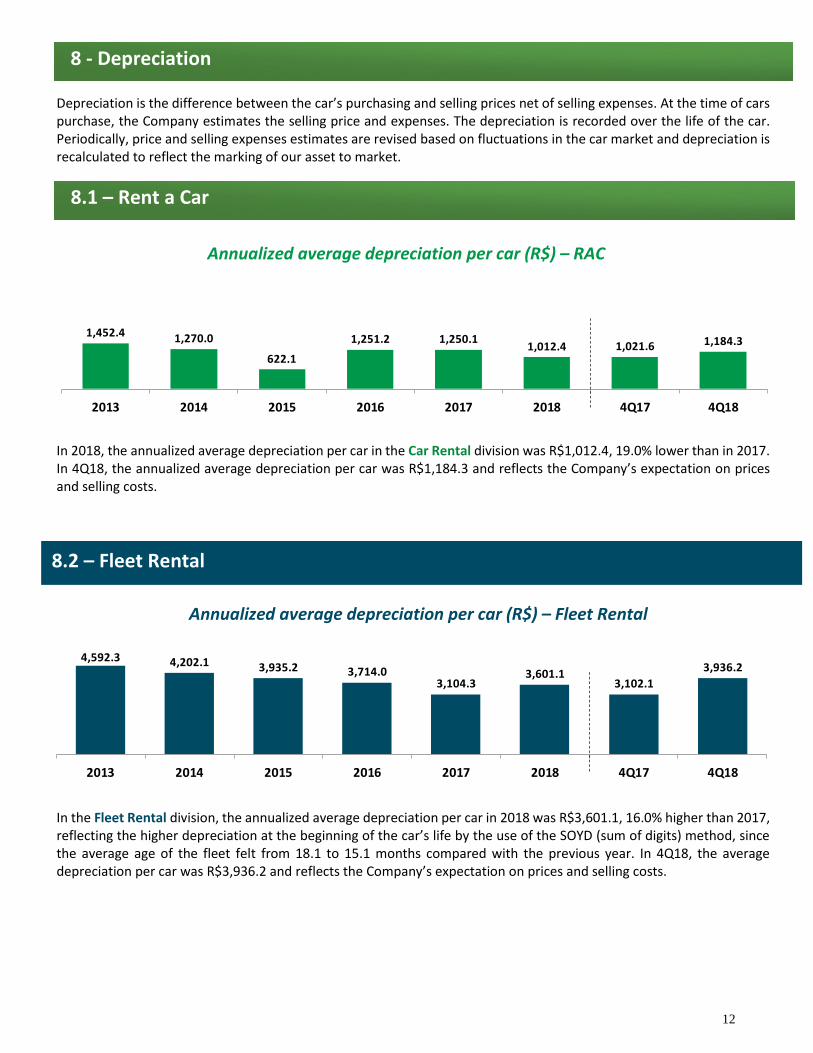
Depreciation is the difference between the car’s purchasing and selling prices net of selling expenses. At the time of cars purchase, the Company estimates the selling price and expenses. The depreciation is recorded over the life of the car. Periodically, price and selling expenses estimates are revised based on fluctuations in the car market and depreciation is recalculated to reflect the marking of our asset to market.
Annualized average depreciation per car (R$) – RAC
In 2018, the annualized average depreciation per car in the Car Rental division was R$1,012.4, 19.0% lower than in 2017. In 4Q18, the annualized average depreciation per car was R$1,184.3 and reflects the Company’s expectation on prices and selling costs.
Annualized average depreciation per car (R$) – Fleet Rental
In the Fleet Rental division, the annualized average depreciation per car in 2018 was R$3,601.1, 16.0% higher than 2017, reflecting the higher depreciation at the beginning of the car’s life by the use of the SOYD (sum of digits) method, since the average age of the fleet felt from 18.1 to 15.1 months compared with the previous year. In 4Q18, the average depreciation per car was R$3,936.2 and reflects the Company’s expectation on prices and selling costs.
8.2 – Fleet Rental
8 - Depreciation
8.1 – Rent a Car
4,592.3 4,202.1 3,935.2 3,714.03,104.3
3,601.13,102.1
3,936.2
2013 2014 2015 2016 2017 2018 4Q17 4Q18
1,452.4 1,270.0
622.1
1,251.2 1,250.11,012.4 1,021.6 1,184.3
2013 2014 2015 2016 2017 2018 4Q17 4Q18
13
Consolidated EBIT (R$ million)
The EBIT margin is calculated over the rental revenues:
(*) Adjusted by the one-time costs incurred – Hertz Brasil acquisition and Franchisees incorporation
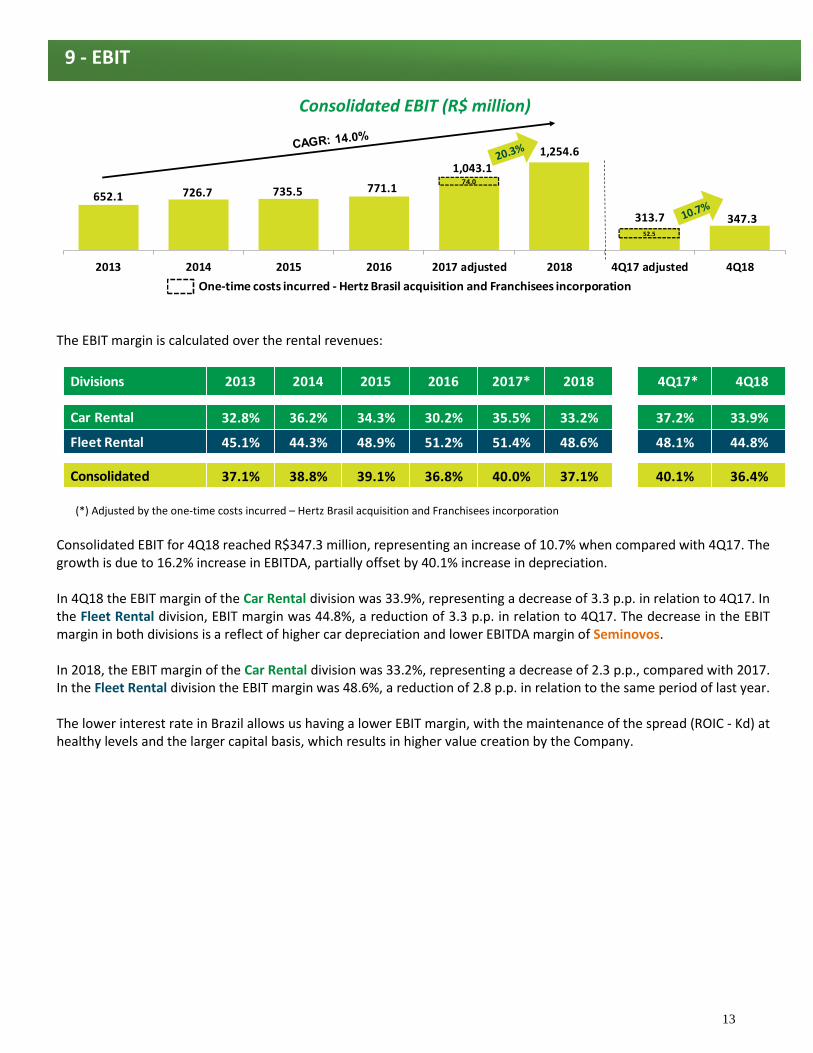
Consolidated EBIT for 4Q18 reached R$347.3 million, representing an increase of 10.7% when compared with 4Q17. The growth is due to 16.2% increase in EBITDA, partially offset by 40.1% increase in depreciation. In 4Q18 the EBIT margin of the Car Rental division was 33.9%, representing a decrease of 3.3 p.p. in relation to 4Q17. In the Fleet Rental division, EBIT margin was 44.8%, a reduction of 3.3 p.p. in relation to 4Q17. The decrease in the EBIT margin in both divisions is a reflect of higher car depreciation and lower EBITDA margin of Seminovos. In 2018, the EBIT margin of the Car Rental division was 33.2%, representing a decrease of 2.3 p.p., compared with 2017. In the Fleet Rental division the EBIT margin was 48.6%, a reduction of 2.8 p.p. in relation to the same period of last year. The lower interest rate in Brazil allows us having a lower EBIT margin, with the maintenance of the spread (ROIC - Kd) at healthy levels and the larger capital basis, which results in higher value creation by the Company.
One-time costs incurred - Hertz Brasil acquisition and Franchisees incorporation
9 - EBIT
652.1 726.7 735.5 771.1
1,043.1
1,254.6
313.7 347.3
2013 2014 2015 2016 2017 adjusted 2018 4Q17 adjusted 4Q18
74.0
52.5
Divisions 2013 2014 2015 2016 2017* 2018 4Q17* 4Q18
Car Rental 32.8% 36.2% 34.3% 30.2% 35.5% 33.2% 37.2% 33.9%
Fleet Rental 45.1% 44.3% 48.9% 51.2% 51.4% 48.6% 48.1% 44.8%
Consolidated 37.1% 38.8% 39.1% 36.8% 40.0% 37.1% 40.1% 36.4%
14
Consolidated net income (R$ million)
(*) Adjusted by the one-time costs incurred – Hertz Brasil acquisition and Franchisees incorporation
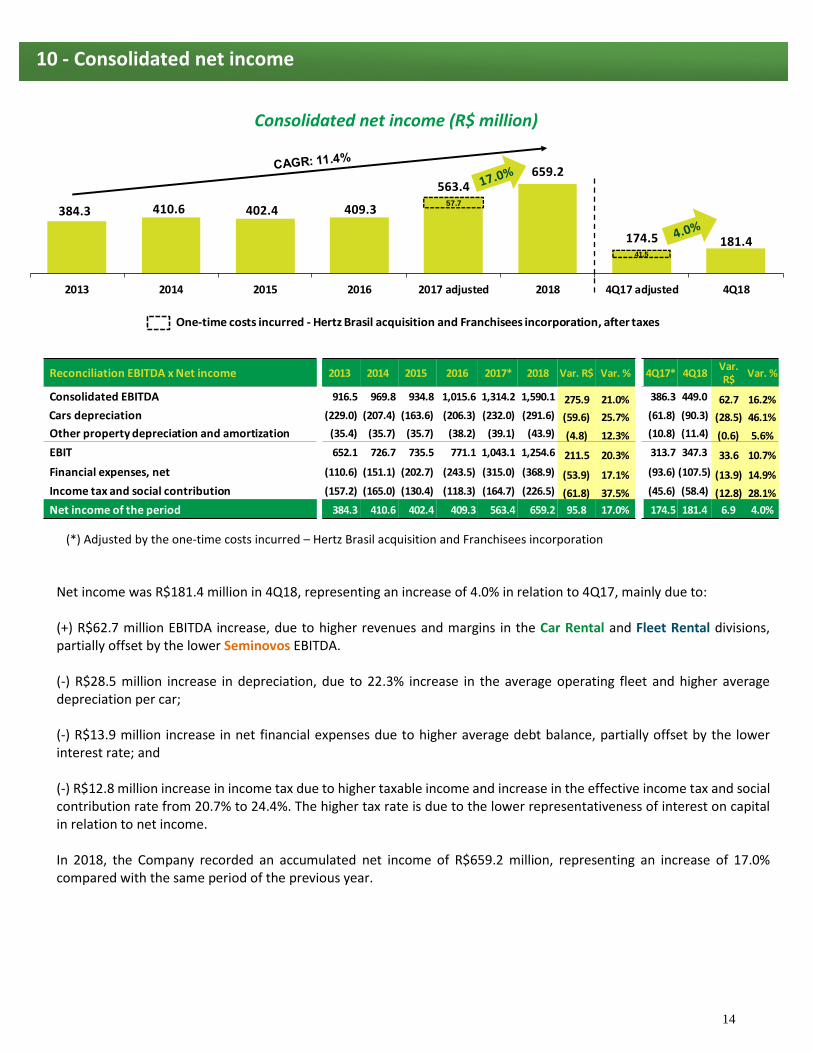
Net income was R$181.4 million in 4Q18, representing an increase of 4.0% in relation to 4Q17, mainly due to: (+) R$62.7 million EBITDA increase, due to higher revenues and margins in the Car Rental and Fleet Rental divisions, partially offset by the lower Seminovos EBITDA. (-) R$28.5 million increase in depreciation, due to 22.3% increase in the average operating fleet and higher average depreciation per car; (-) R$13.9 million increase in net financial expenses due to higher average debt balance, partially offset by the lower interest rate; and (-) R$12.8 million increase in income tax due to higher taxable income and increase in the effective income tax and social contribution rate from 20.7% to 24.4%. The higher tax rate is due to the lower representativeness of interest on capital in relation to net income. In 2018, the Company recorded an accumulated net income of R$659.2 million, representing an increase of 17.0% compared with the same period of the previous year.
One-time costs incurred - Hertz Brasil acquisition and Franchisees incorporation, after taxes
10 - Consolidated net income
Reconciliation EBITDA x Net income 2013 2014 2015 2016 2017* 2018 Var. R$ Var. % 4Q17* 4Q18Var. R$
Var. %
Consolidated EBITDA 916.5 969.8 934.8 1,015.6 1,314.2 1,590.1 275.9 21.0% 386.3 449.0 62.7 16.2%
Cars depreciation (229.0) (207.4) (163.6) (206.3) (232.0) (291.6) (59.6) 25.7% (61.8) (90.3) (28.5) 46.1%
Other property depreciation and amortization (35.4) (35.7) (35.7) (38.2) (39.1) (43.9) (4.8) 12.3% (10.8) (11.4) (0.6) 5.6%
EBIT 652.1 726.7 735.5 771.1 1,043.1 1,254.6 211.5 20.3% 313.7 347.3 33.6 10.7%
Financial expenses, net (110.6) (151.1) (202.7) (243.5) (315.0) (368.9) (53.9) 17.1% (93.6) (107.5) (13.9) 14.9%
Income tax and social contribution (157.2) (165.0) (130.4) (118.3) (164.7) (226.5) (61.8) 37.5% (45.6) (58.4) (12.8) 28.1%
Net income of the period 384.3 410.6 402.4 409.3 563.4 659.2 95.8 17.0% 174.5 181.4 6.9 4.0%
384.3 410.6 402.4 409.3
563.4659.2
174.5 181.4
2013 2014 2015 2016 2017 adjusted 2018 4Q17 adjusted 4Q18
57.7
41.5
15
15
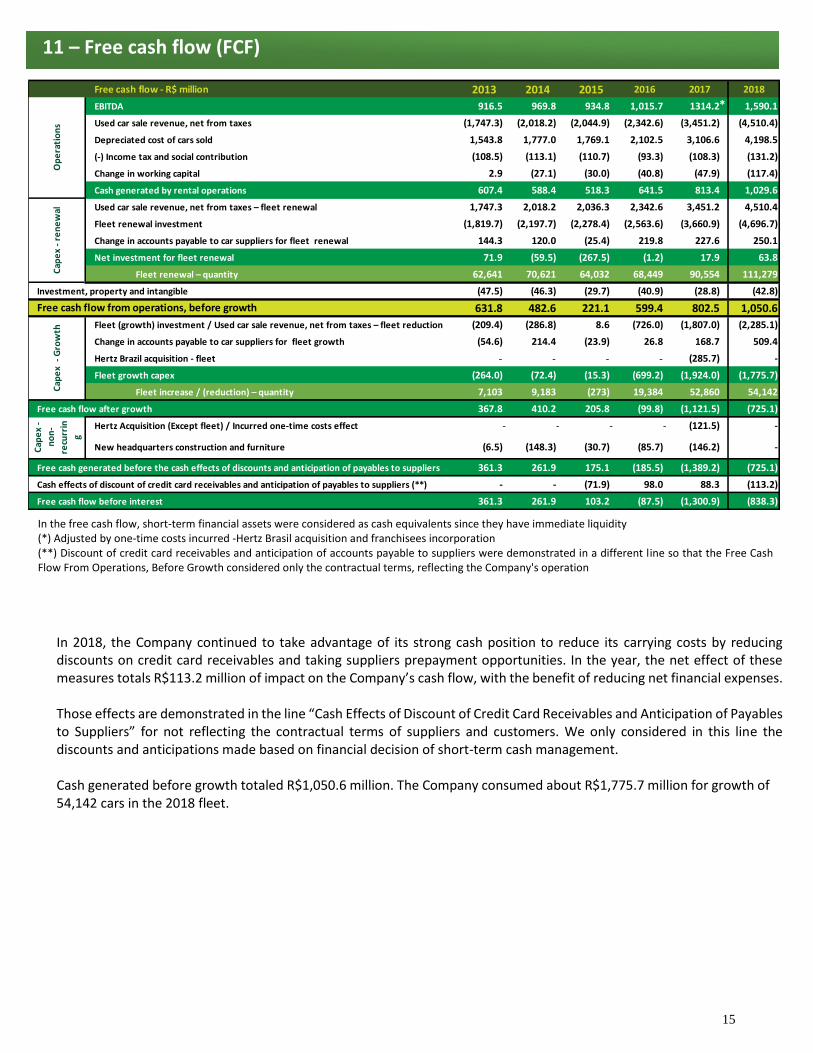
In the free cash flow, short-term financial assets were considered as cash equivalents since they have immediate liquidity (*) Adjusted by one-time costs incurred -Hertz Brasil acquisition and franchisees incorporation (**) Discount of credit card receivables and anticipation of accounts payable to suppliers were demonstrated in a different line so that the Free Cash Flow From Operations, Before Growth considered only the contractual terms, reflecting the Company's operation
In 2018, the Company continued to take advantage of its strong cash position to reduce its carrying costs by reducing discounts on credit card receivables and taking suppliers prepayment opportunities. In the year, the net effect of these measures totals R$113.2 million of impact on the Company’s cash flow, with the benefit of reducing net financial expenses. Those effects are demonstrated in the line “Cash Effects of Discount of Credit Card Receivables and Anticipation of Payables to Suppliers” for not reflecting the contractual terms of suppliers and customers. We only considered in this line the discounts and anticipations made based on financial decision of short-term cash management. Cash generated before growth totaled R$1,050.6 million. The Company consumed about R$1,775.7 million for growth of 54,142 cars in the 2018 fleet.
11 – Free cash flow (FCF)
Free cash flow - R$ million 2013 2014 2015 2016 2017 2018
EBITDA 916.5 969.8 934.8 1,015.7 1314.2 1,590.1
Used car sale revenue, net from taxes (1,747.3) (2,018.2) (2,044.9) (2,342.6) (3,451.2) (4,510.4)
Depreciated cost of cars sold 1,543.8 1,777.0 1,769.1 2,102.5 3,106.6 4,198.5
(-) Income tax and social contribution (108.5) (113.1) (110.7) (93.3) (108.3) (131.2)
Change in working capital 2.9 (27.1) (30.0) (40.8) (47.9) (117.4)
Cash generated by rental operations 607.4 588.4 518.3 641.5 813.4 1,029.6
Used car sale revenue, net from taxes – fleet renewal 1,747.3 2,018.2 2,036.3 2,342.6 3,451.2 4,510.4
Fleet renewal investment (1,819.7) (2,197.7) (2,278.4) (2,563.6) (3,660.9) (4,696.7)
Change in accounts payable to car suppliers for fleet renewal 144.3 120.0 (25.4) 219.8 227.6 250.1
Net investment for fleet renewal 71.9 (59.5) (267.5) (1.2) 17.9 63.8
Fleet renewal – quantity 62,641 70,621 64,032 68,449 90,554 111,279
(47.5) (46.3) (29.7) (40.9) (28.8) (42.8)
631.8 482.6 221.1 599.4 802.5 1,050.6
Fleet (growth) investment / Used car sale revenue, net from taxes – fleet reduction (209.4) (286.8) 8.6 (726.0) (1,807.0) (2,285.1)
Change in accounts payable to car suppliers for fleet growth (54.6) 214.4 (23.9) 26.8 168.7 509.4
Hertz Brazil acquisition - fleet - - - - (285.7) -
Fleet growth capex (264.0) (72.4) (15.3) (699.2) (1,924.0) (1,775.7)
Fleet increase / (reduction) – quantity 7,103 9,183 (273) 19,384 52,860 54,142
367.8 410.2 205.8 (99.8) (1,121.5) (725.1)
Hertz Acquisition (Except fleet) / Incurred one-time costs effect - - - - (121.5) -
New headquarters construction and furniture (6.5) (148.3) (30.7) (85.7) (146.2) -
361.3 261.9 175.1 (185.5) (1,389.2) (725.1)
- - (71.9) 98.0 88.3 (113.2)
361.3 261.9 103.2 (87.5) (1,300.9) (838.3)
Op
era
tio
ns
Cap
ex
- re
ne
wal
Investment, property and intangible
Free cash flow from operations, before growth
Cap
ex
- G
row
th
Cap
ex
-
no
n-
recu
rrin
g
Free cash generated before the cash effects of discounts and anticipation of payables to suppliers
Free cash flow after growth
Cash effects of discount of credit card receivables and anticipation of payables to suppliers (**)
Free cash flow before interest
*
16
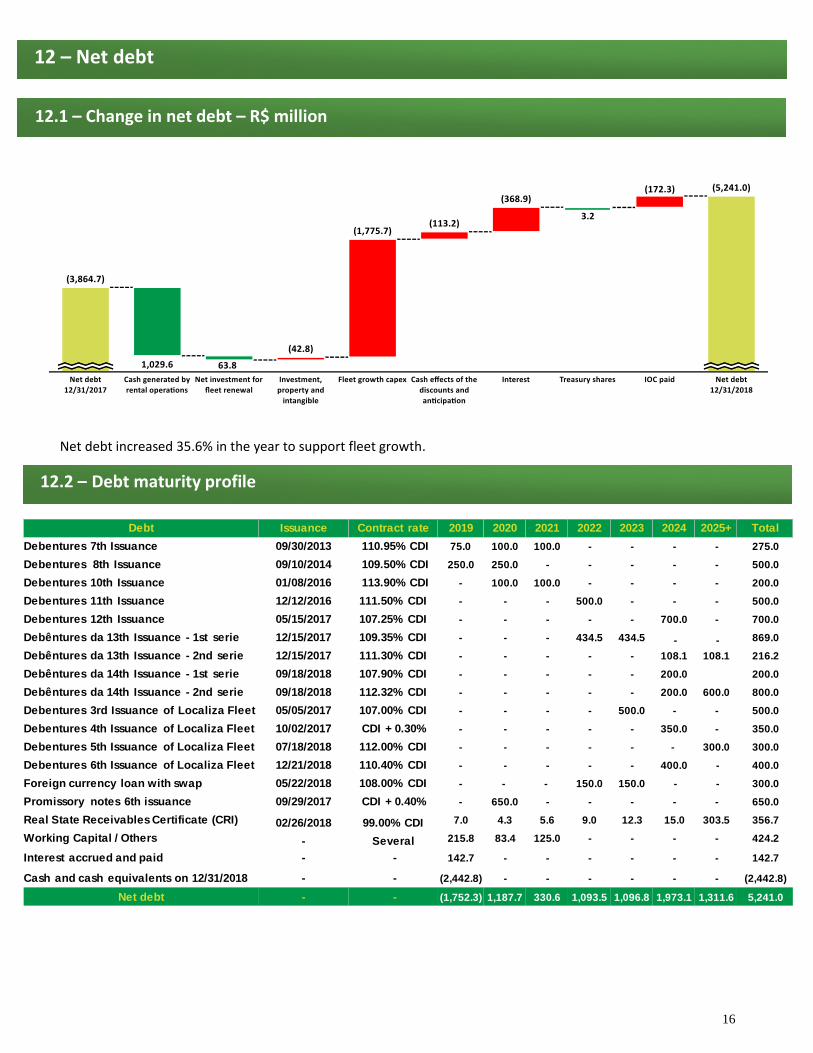
Net debt increased 35.6% in the year to support fleet growth.
12.2 – Debt maturity profile
12 – Net debt
12.1 – Change in net debt – R$ million
Debt Issuance Contract rate 2019 2020 2021 2022 2023 2024 2025+ Total
Debentures 7th Issuance 09/30/2013 110.95% CDI 75.0 100.0 100.0 - - - - 275.0
Debentures 8th Issuance 09/10/2014 109.50% CDI 250.0 250.0 - - - - - 500.0
Debentures 10th Issuance 01/08/2016 113.90% CDI - 100.0 100.0 - - - - 200.0
Debentures 11th Issuance 12/12/2016 111.50% CDI - - - 500.0 - - - 500.0
Debentures 12th Issuance 05/15/2017 107.25% CDI - - - - - 700.0 - 700.0
Debêntures da 13th Issuance - 1st serie 12/15/2017 109.35% CDI - - - 434.5 434.5 - - 869.0
Debêntures da 13th Issuance - 2nd serie 12/15/2017 111.30% CDI - - - - - 108.1 108.1 216.2
Debêntures da 14th Issuance - 1st serie 09/18/2018 107.90% CDI - - - - - 200.0 200.0
Debêntures da 14th Issuance - 2nd serie 09/18/2018 112.32% CDI - - - - - 200.0 600.0 800.0
Debentures 3rd Issuance of Localiza Fleet 05/05/2017 107.00% CDI - - - - 500.0 - - 500.0
Debentures 4th Issuance of Localiza Fleet 10/02/2017 CDI + 0.30% - - - - - 350.0 - 350.0
Debentures 5th Issuance of Localiza Fleet 07/18/2018 112.00% CDI - - - - - - 300.0 300.0
Debentures 6th Issuance of Localiza Fleet 12/21/2018 110.40% CDI - - - - - 400.0 - 400.0
Foreign currency loan with swap 05/22/2018 108.00% CDI - - - 150.0 150.0 - - 300.0
Promissory notes 6th issuance 09/29/2017 CDI + 0.40% - 650.0 - - - - - 650.0
Real State Receivables Certificate (CRI) 02/26/2018 99.00% CDI 7.0 4.3 5.6 9.0 12.3 15.0 303.5 356.7
Working Capital / Others - Several 215.8 83.4 125.0 - - - - 424.2
Interest accrued and paid - - 142.7 - - - - - - 142.7
Cash and cash equivalents on 12/31/2018 - - (2,442.8) - - - - - - (2,442.8)
Net debt - - (1,752.3) 1,187.7 330.6 1,093.5 1,096.8 1,973.1 1,311.6 5,241.0
24,
17
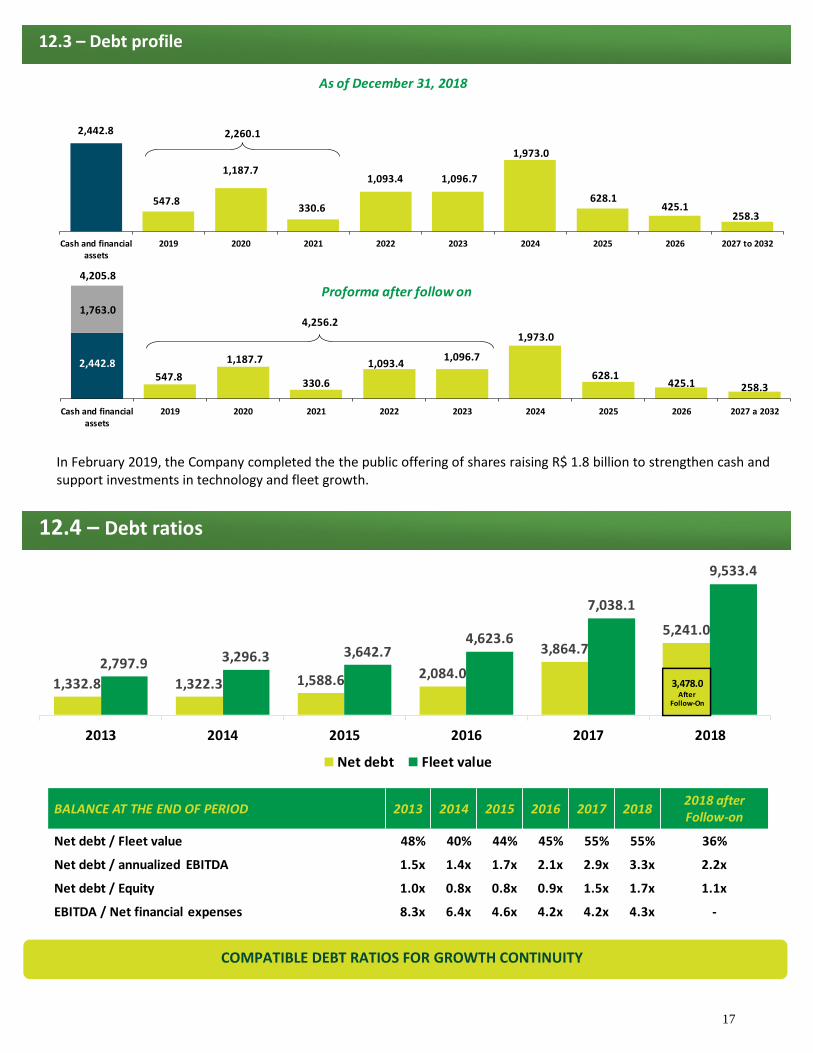
In February 2019, the Company completed the the public offering of shares raising R$ 1.8 billion to strengthen cash and support investments in technology and fleet growth.
2,442.8547.8
1,187.7
330.6
1,093.41,096.7
1,973.0
628.1425.1 258.3
1,763.0
4,205.8
Cash and financialassets
2019 2020 2021 2022 2023 2024 2025 2026 2027 a 2032
Proforma after follow on
4,256.2
As of December 31, 2018
2,442.8
547.8
1,187.7
330.6
1,093.4 1,096.7
1,973.0
628.1425.1
258.3
Cash and financialassets
2019 2020 2021 2022 2023 2024 2025 2026 2027 to 2032
2,260.1
COMPATIBLE DEBT RATIOS FOR GROWTH CONTINUITY
12.3 – Debt profile
12.4 – Debt ratios
1,332.8 1,322.3 1,588.6 2,084.0
3,864.75,241.0
2,797.9 3,296.3 3,642.74,623.6
7,038.1
9,533.4
2013 2014 2015 2016 2017 2018
Net debt Fleet value
3,478.0After
Follow-On
BALANCE AT THE END OF PERIOD 2013 2014 2015 2016 2017 20182018 afterFollow-on
Net debt / Fleet value 48% 40% 44% 45% 55% 55% 36%
Net debt / annualized EBITDA 1.5x 1.4x 1.7x 2.1x 2.9x 3.3x 2.2x
Net debt / Equity 1.0x 0.8x 0.8x 0.9x 1.5x 1.7x 1.1x
EBITDA / Net financial expenses 8.3x 6.4x 4.6x 4.2x 4.2x 4.3x -
18
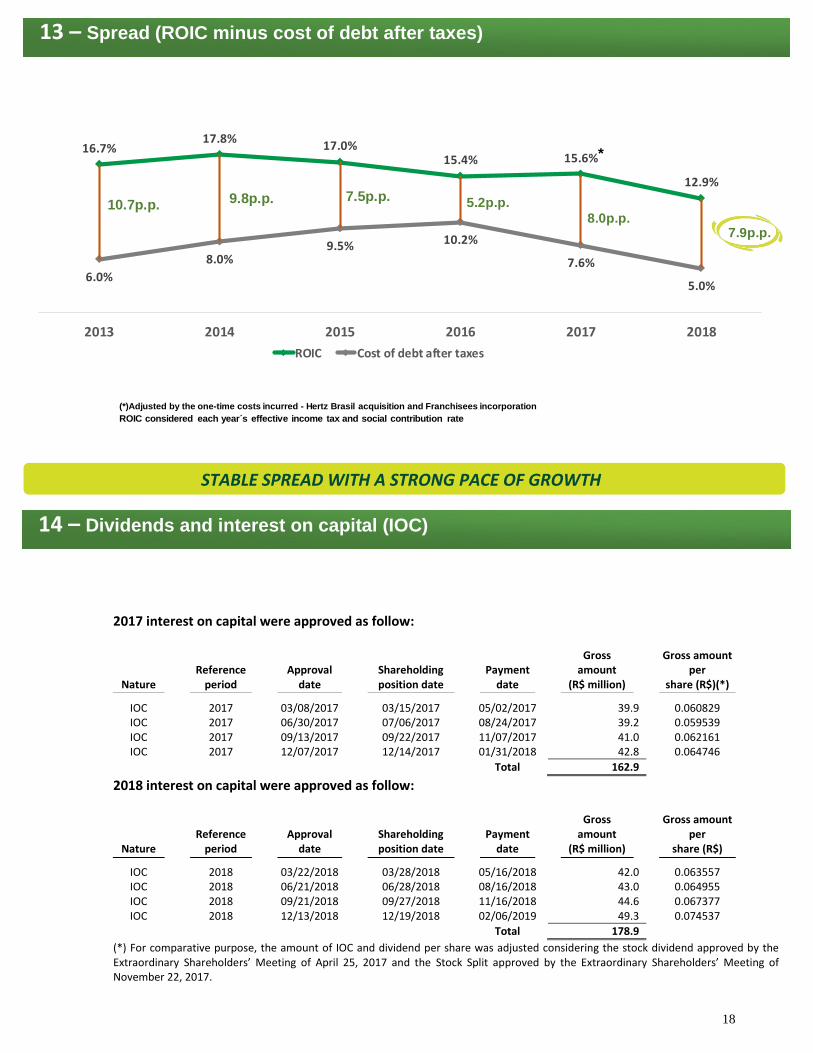
2017 interest on capital were approved as follow:
Nature
Reference
period Approval
date Shareholding position date
Payment date
Gross amount
(R$ million)
Gross amount per
share (R$)(*)
IOC 2017 03/08/2017 03/15/2017 05/02/2017 39.9 0.060829 IOC 2017 06/30/2017 07/06/2017 08/24/2017 39.2 0.059539 IOC 2017 09/13/2017 09/22/2017 11/07/2017 41.0 0.062161 IOC 2017 12/07/2017 12/14/2017 01/31/2018 42.8 0.064746
Total 162.9
2018 interest on capital were approved as follow:
Nature
Reference
period Approval
date Shareholding position date
Payment date
Gross amount
(R$ million)
Gross amount per
share (R$)
IOC 2018 03/22/2018 03/28/2018 05/16/2018 42.0 0.063557 IOC 2018 06/21/2018 06/28/2018 08/16/2018 43.0 0.064955 IOC 2018 09/21/2018 09/27/2018 11/16/2018 44.6 0.067377 IOC 2018 12/13/2018 12/19/2018 02/06/2019 49.3 0.074537
Total 178.9
(*) For comparative purpose, the amount of IOC and dividend per share was adjusted considering the stock dividend approved by the Extraordinary Shareholders’ Meeting of April 25, 2017 and the Stock Split approved by the Extraordinary Shareholders’ Meeting of November 22, 2017.
14 – Dividends and interest on capital (IOC)
13 – Spread (ROIC minus cost of debt after taxes)
STABLE SPREAD WITH A STRONG PACE OF GROWTH
ROIC considered each year s effective income tax and social contribution rate
(*)Adjusted by the one-time costs incurred - Hertz Brasil acquisition and Franchisees incorporation
16.7%17.8%
17.0%15.4% 15.6%
12.9%
6.0%
8.0%9.5% 10.2%
7.6%
5.0%
2013 2014 2015 2016 2017 2018
ROIC Cost of debt after taxes
9.8p.p.10.7p.p.7.5p.p. 5.2p.p.
8.0p.p.
*
7.9p.p.
19
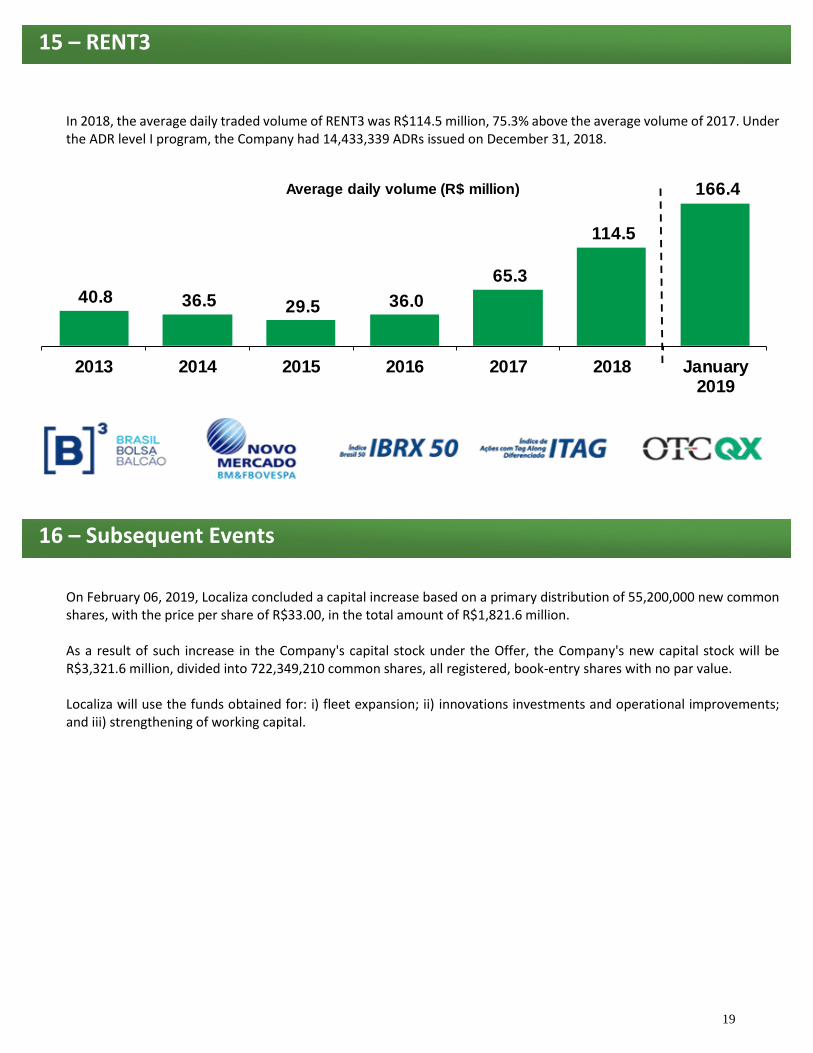
In 2018, the average daily traded volume of RENT3 was R$114.5 million, 75.3% above the average volume of 2017. Under the ADR level I program, the Company had 14,433,339 ADRs issued on December 31, 2018.
On February 06, 2019, Localiza concluded a capital increase based on a primary distribution of 55,200,000 new common shares, with the price per share of R$33.00, in the total amount of R$1,821.6 million. As a result of such increase in the Company's capital stock under the Offer, the Company's new capital stock will be R$3,321.6 million, divided into 722,349,210 common shares, all registered, book-entry shares with no par value. Localiza will use the funds obtained for: i) fleet expansion; ii) innovations investments and operational improvements; and iii) strengthening of working capital.
15 – RENT3
16 – Subsequent Events
40.8 36.5 29.5 36.0
65.3
114.5
166.4
0
1
2
3
4
5
6
7
8
9
10
-
25.4
50.8
76.2
101.7
127.1
152.5
177.9
2013 2014 2015 2016 2017 2018 January2019
Average daily volume (R$ million)
20
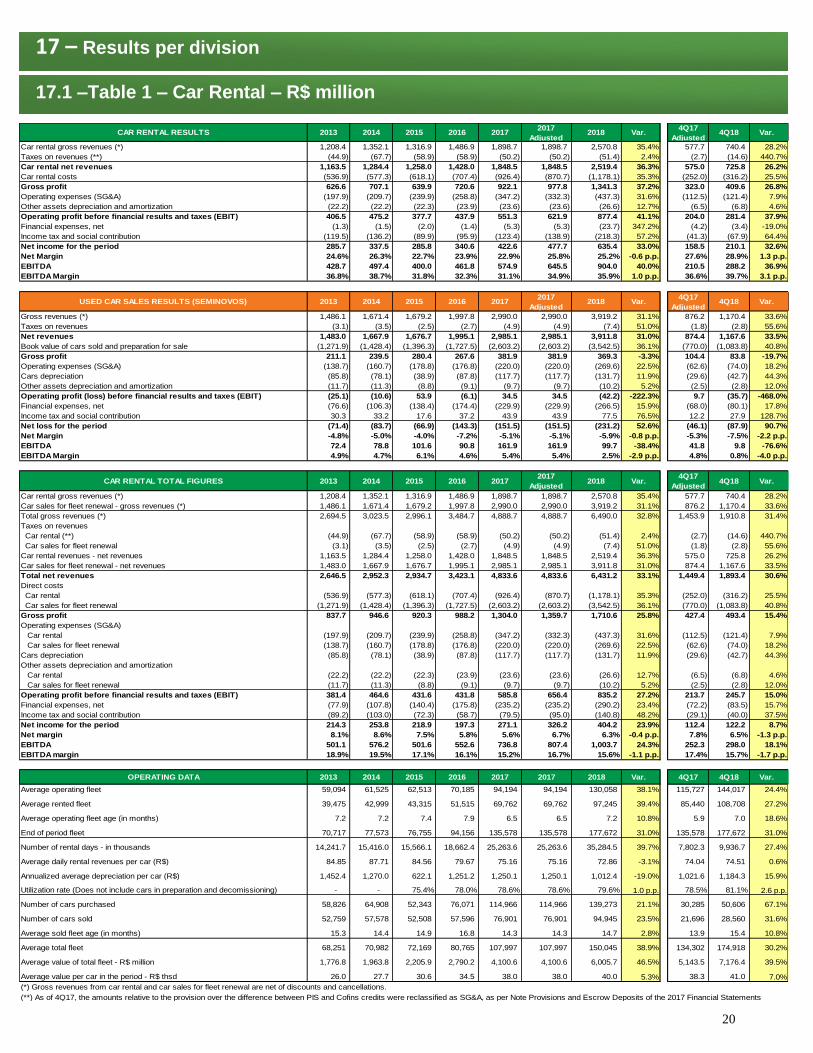
17 – Results per division
17.1 –Table 1 – Car Rental – R$ million
CAR RENTAL RESULTS 2013 2014 2015 2016 20172017
Adjusted2018 Var.
4Q17
Adjusted4Q18 Var.
Car rental gross revenues (*) 1,208.4 1,352.1 1,316.9 1,486.9 1,898.7 1,898.7 2,570.8 35.4% 577.7 740.4 28.2%
Taxes on revenues (**) (44.9) (67.7) (58.9) (58.9) (50.2) (50.2) (51.4) 2.4% (2.7) (14.6) 440.7%
Car rental net revenues 1,163.5 1,284.4 1,258.0 1,428.0 1,848.5 1,848.5 2,519.4 36.3% 575.0 725.8 26.2%
Car rental costs (536.9) (577.3) (618.1) (707.4) (926.4) (870.7) (1,178.1) 35.3% (252.0) (316.2) 25.5%
Gross profit 626.6 707.1 639.9 720.6 922.1 977.8 1,341.3 37.2% 323.0 409.6 26.8%
Operating expenses (SG&A) (197.9) (209.7) (239.9) (258.8) (347.2) (332.3) (437.3) 31.6% (112.5) (121.4) 7.9%
Other assets depreciation and amortization (22.2) (22.2) (22.3) (23.9) (23.6) (23.6) (26.6) 12.7% (6.5) (6.8) 4.6%
Operating profit before financial results and taxes (EBIT) 406.5 475.2 377.7 437.9 551.3 621.9 877.4 41.1% 204.0 281.4 37.9%
Financial expenses, net (1.3) (1.5) (2.0) (1.4) (5.3) (5.3) (23.7) 347.2% (4.2) (3.4) -19.0%
Income tax and social contribution (119.5) (136.2) (89.9) (95.9) (123.4) (138.9) (218.3) 57.2% (41.3) (67.9) 64.4%
Net income for the period 285.7 337.5 285.8 340.6 422.6 477.7 635.4 33.0% 158.5 210.1 32.6%
Net Margin 24.6% 26.3% 22.7% 23.9% 22.9% 25.8% 25.2% -0.6 p.p. 27.6% 28.9% 1.3 p.p.
EBITDA 428.7 497.4 400.0 461.8 574.9 645.5 904.0 40.0% 210.5 288.2 36.9%
EBITDA Margin 36.8% 38.7% 31.8% 32.3% 31.1% 34.9% 35.9% 1.0 p.p. 36.6% 39.7% 3.1 p.p.
USED CAR SALES RESULTS (SEMINOVOS) 2013 2014 2015 2016 20172017
Adjusted2018 Var.
4Q17
Adjusted4Q18 Var.
Gross revenues (*) 1,486.1 1,671.4 1,679.2 1,997.8 2,990.0 2,990.0 3,919.2 31.1% 876.2 1,170.4 33.6%
Taxes on revenues (3.1) (3.5) (2.5) (2.7) (4.9) (4.9) (7.4) 51.0% (1.8) (2.8) 55.6%
Net revenues 1,483.0 1,667.9 1,676.7 1,995.1 2,985.1 2,985.1 3,911.8 31.0% 874.4 1,167.6 33.5%
Book value of cars sold and preparation for sale (1,271.9) (1,428.4) (1,396.3) (1,727.5) (2,603.2) (2,603.2) (3,542.5) 36.1% (770.0) (1,083.8) 40.8%
Gross profit 211.1 239.5 280.4 267.6 381.9 381.9 369.3 -3.3% 104.4 83.8 -19.7%
Operating expenses (SG&A) (138.7) (160.7) (178.8) (176.8) (220.0) (220.0) (269.6) 22.5% (62.6) (74.0) 18.2%
Cars depreciation (85.8) (78.1) (38.9) (87.8) (117.7) (117.7) (131.7) 11.9% (29.6) (42.7) 44.3%
Other assets depreciation and amortization (11.7) (11.3) (8.8) (9.1) (9.7) (9.7) (10.2) 5.2% (2.5) (2.8) 12.0%
Operating profit (loss) before financial results and taxes (EBIT) (25.1) (10.6) 53.9 (6.1) 34.5 34.5 (42.2) -222.3% 9.7 (35.7) -468.0%
Financial expenses, net (76.6) (106.3) (138.4) (174.4) (229.9) (229.9) (266.5) 15.9% (68.0) (80.1) 17.8%
Income tax and social contribution 30.3 33.2 17.6 37.2 43.9 43.9 77.5 76.5% 12.2 27.9 128.7%
Net loss for the period (71.4) (83.7) (66.9) (143.3) (151.5) (151.5) (231.2) 52.6% (46.1) (87.9) 90.7%
Net Margin -4.8% -5.0% -4.0% -7.2% -5.1% -5.1% -5.9% -0.8 p.p. -5.3% -7.5% -2.2 p.p.
EBITDA 72.4 78.8 101.6 90.8 161.9 161.9 99.7 -38.4% 41.8 9.8 -76.6%
EBITDA Margin 4.9% 4.7% 6.1% 4.6% 5.4% 5.4% 2.5% -2.9 p.p. 4.8% 0.8% -4.0 p.p.
CAR RENTAL TOTAL FIGURES 2013 2014 2015 2016 20172017
Adjusted2018 Var.
4Q17
Adjusted4Q18 Var.
Car rental gross revenues (*) 1,208.4 1,352.1 1,316.9 1,486.9 1,898.7 1,898.7 2,570.8 35.4% 577.7 740.4 28.2%
Car sales for fleet renewal - gross revenues (*) 1,486.1 1,671.4 1,679.2 1,997.8 2,990.0 2,990.0 3,919.2 31.1% 876.2 1,170.4 33.6%
Total gross revenues (*) 2,694.5 3,023.5 2,996.1 3,484.7 4,888.7 4,888.7 6,490.0 32.8% 1,453.9 1,910.8 31.4%
Taxes on revenues
Car rental (**) (44.9) (67.7) (58.9) (58.9) (50.2) (50.2) (51.4) 2.4% (2.7) (14.6) 440.7%
Car sales for fleet renewal (3.1) (3.5) (2.5) (2.7) (4.9) (4.9) (7.4) 51.0% (1.8) (2.8) 55.6%
Car rental revenues - net revenues 1,163.5 1,284.4 1,258.0 1,428.0 1,848.5 1,848.5 2,519.4 36.3% 575.0 725.8 26.2%
Car sales for fleet renewal - net revenues 1,483.0 1,667.9 1,676.7 1,995.1 2,985.1 2,985.1 3,911.8 31.0% 874.4 1,167.6 33.5%
Total net revenues 2,646.5 2,952.3 2,934.7 3,423.1 4,833.6 4,833.6 6,431.2 33.1% 1,449.4 1,893.4 30.6%
Direct costs
Car rental (536.9) (577.3) (618.1) (707.4) (926.4) (870.7) (1,178.1) 35.3% (252.0) (316.2) 25.5%
Car sales for fleet renewal (1,271.9) (1,428.4) (1,396.3) (1,727.5) (2,603.2) (2,603.2) (3,542.5) 36.1% (770.0) (1,083.8) 40.8%
Gross profit 837.7 946.6 920.3 988.2 1,304.0 1,359.7 1,710.6 25.8% 427.4 493.4 15.4%
Operating expenses (SG&A)
Car rental (197.9) (209.7) (239.9) (258.8) (347.2) (332.3) (437.3) 31.6% (112.5) (121.4) 7.9%
Car sales for fleet renewal (138.7) (160.7) (178.8) (176.8) (220.0) (220.0) (269.6) 22.5% (62.6) (74.0) 18.2%
Cars depreciation (85.8) (78.1) (38.9) (87.8) (117.7) (117.7) (131.7) 11.9% (29.6) (42.7) 44.3%
Other assets depreciation and amortization
Car rental (22.2) (22.2) (22.3) (23.9) (23.6) (23.6) (26.6) 12.7% (6.5) (6.8) 4.6%
Car sales for fleet renewal (11.7) (11.3) (8.8) (9.1) (9.7) (9.7) (10.2) 5.2% (2.5) (2.8) 12.0%
Operating profit before financial results and taxes (EBIT) 381.4 464.6 431.6 431.8 585.8 656.4 835.2 27.2% 213.7 245.7 15.0%
Financial expenses, net (77.9) (107.8) (140.4) (175.8) (235.2) (235.2) (290.2) 23.4% (72.2) (83.5) 15.7%
Income tax and social contribution (89.2) (103.0) (72.3) (58.7) (79.5) (95.0) (140.8) 48.2% (29.1) (40.0) 37.5%
Net income for the period 214.3 253.8 218.9 197.3 271.1 326.2 404.2 23.9% 112.4 122.2 8.7%
Net margin 8.1% 8.6% 7.5% 5.8% 5.6% 6.7% 6.3% -0.4 p.p. 7.8% 6.5% -1.3 p.p.
EBITDA 501.1 576.2 501.6 552.6 736.8 807.4 1,003.7 24.3% 252.3 298.0 18.1%
EBITDA margin 18.9% 19.5% 17.1% 16.1% 15.2% 16.7% 15.6% -1.1 p.p. 17.4% 15.7% -1.7 p.p.
OPERATING DATA 2013 2014 2015 2016 2017 2017 2018 Var. 4Q17 4Q18 Var.
Average operating fleet 59,094 61,525 62,513 70,185 94,194 94,194 130,058 38.1% 115,727 144,017 24.4%
Average rented fleet 39,475 42,999 43,315 51,515 69,762 69,762 97,245 39.4% 85,440 108,708 27.2%
Average operating fleet age (in months) 7.2 7.2 7.4 7.9 6.5 6.5 7.2 10.8% 5.9 7.0 18.6%
End of period fleet 70,717 77,573 76,755 94,156 135,578 135,578 177,672 31.0% 135,578 177,672 31.0%
Number of rental days - in thousands 14,241.7 15,416.0 15,566.1 18,662.4 25,263.6 25,263.6 35,284.5 39.7% 7,802.3 9,936.7 27.4%
Average daily rental revenues per car (R$) 84.85 87.71 84.56 79.67 75.16 75.16 72.86 -3.1% 74.04 74.51 0.6%
Annualized average depreciation per car (R$) 1,452.4 1,270.0 622.1 1,251.2 1,250.1 1,250.1 1,012.4 -19.0% 1,021.6 1,184.3 15.9%
Utilization rate (Does not include cars in preparation and decomissioning) - - 75.4% 78.0% 78.6% 78.6% 79.6% 1.0 p.p. 78.5% 81.1% 2.6 p.p.
Number of cars purchased 58,826 64,908 52,343 76,071 114,966 114,966 139,273 21.1% 30,285 50,606 67.1%
Number of cars sold 52,759 57,578 52,508 57,596 76,901 76,901 94,945 23.5% 21,696 28,560 31.6%
Average sold fleet age (in months) 15.3 14.4 14.9 16.8 14.3 14.3 14.7 2.8% 13.9 15.4 10.8%
Average total fleet 68,251 70,982 72,169 80,765 107,997 107,997 150,045 38.9% 134,302 174,918 30.2%
Average value of total fleet - R$ million 1,776.8 1,963.8 2,205.9 2,790.2 4,100.6 4,100.6 6,005.7 46.5% 5,143.5 7,176.4 39.5%
Average value per car in the period - R$ thsd 26.0 27.7 30.6 34.5 38.0 38.0 40.0 5.3% 38.3 41.0 7.0%
(*) Gross revenues from car rental and car sales for fleet renewal are net of discounts and cancellations.
(**) As of 4Q17, the amounts relative to the provision over the difference between PIS and Cofins credits were reclassified as SG&A, as per Note Provisions and Escrow Deposits of the 2017 Financial Statements
21
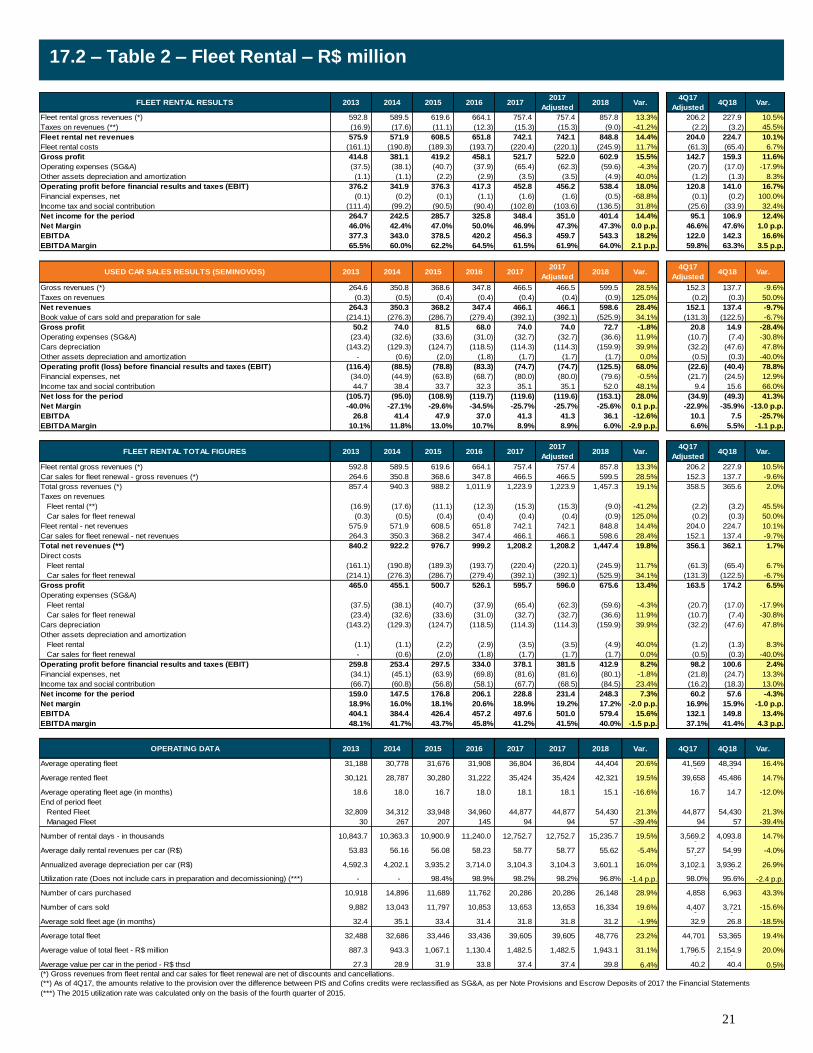
17.2 – Table 2 – Fleet Rental – R$ million
FLEET RENTAL RESULTS 2013 2014 2015 2016 20172017
Adjusted2018 Var.
4Q17
Adjusted4Q18 Var.
Fleet rental gross revenues (*) 592.8 589.5 619.6 664.1 757.4 757.4 857.8 13.3% 206.2 227.9 10.5%
Taxes on revenues (**) (16.9) (17.6) (11.1) (12.3) (15.3) (15.3) (9.0) -41.2% (2.2) (3.2) 45.5%
Fleet rental net revenues 575.9 571.9 608.5 651.8 742.1 742.1 848.8 14.4% 204.0 224.7 10.1%
Fleet rental costs (161.1) (190.8) (189.3) (193.7) (220.4) (220.1) (245.9) 11.7% (61.3) (65.4) 6.7%
Gross profit 414.8 381.1 419.2 458.1 521.7 522.0 602.9 15.5% 142.7 159.3 11.6%
Operating expenses (SG&A) (37.5) (38.1) (40.7) (37.9) (65.4) (62.3) (59.6) -4.3% (20.7) (17.0) -17.9%
Other assets depreciation and amortization (1.1) (1.1) (2.2) (2.9) (3.5) (3.5) (4.9) 40.0% (1.2) (1.3) 8.3%
Operating profit before financial results and taxes (EBIT) 376.2 341.9 376.3 417.3 452.8 456.2 538.4 18.0% 120.8 141.0 16.7%
Financial expenses, net (0.1) (0.2) (0.1) (1.1) (1.6) (1.6) (0.5) -68.8% (0.1) (0.2) 100.0%
Income tax and social contribution (111.4) (99.2) (90.5) (90.4) (102.8) (103.6) (136.5) 31.8% (25.6) (33.9) 32.4%
Net income for the period 264.7 242.5 285.7 325.8 348.4 351.0 401.4 14.4% 95.1 106.9 12.4%
Net Margin 46.0% 42.4% 47.0% 50.0% 46.9% 47.3% 47.3% 0.0 p.p. 46.6% 47.6% 1.0 p.p.
EBITDA 377.3 343.0 378.5 420.2 456.3 459.7 543.3 18.2% 122.0 142.3 16.6%
EBITDA Margin 65.5% 60.0% 62.2% 64.5% 61.5% 61.9% 64.0% 2.1 p.p. 59.8% 63.3% 3.5 p.p.
USED CAR SALES RESULTS (SEMINOVOS) 2013 2014 2015 2016 20172017
Adjusted2018 Var.
4Q17
Adjusted4Q18 Var.
Gross revenues (*) 264.6 350.8 368.6 347.8 466.5 466.5 599.5 28.5% 152.3 137.7 -9.6%
Taxes on revenues (0.3) (0.5) (0.4) (0.4) (0.4) (0.4) (0.9) 125.0% (0.2) (0.3) 50.0%
Net revenues 264.3 350.3 368.2 347.4 466.1 466.1 598.6 28.4% 152.1 137.4 -9.7%
Book value of cars sold and preparation for sale (214.1) (276.3) (286.7) (279.4) (392.1) (392.1) (525.9) 34.1% (131.3) (122.5) -6.7%
Gross profit 50.2 74.0 81.5 68.0 74.0 74.0 72.7 -1.8% 20.8 14.9 -28.4%
Operating expenses (SG&A) (23.4) (32.6) (33.6) (31.0) (32.7) (32.7) (36.6) 11.9% (10.7) (7.4) -30.8%
Cars depreciation (143.2) (129.3) (124.7) (118.5) (114.3) (114.3) (159.9) 39.9% (32.2) (47.6) 47.8%
Other assets depreciation and amortization - (0.6) (2.0) (1.8) (1.7) (1.7) (1.7) 0.0% (0.5) (0.3) -40.0%
Operating profit (loss) before financial results and taxes (EBIT) (116.4) (88.5) (78.8) (83.3) (74.7) (74.7) (125.5) 68.0% (22.6) (40.4) 78.8%
Financial expenses, net (34.0) (44.9) (63.8) (68.7) (80.0) (80.0) (79.6) -0.5% (21.7) (24.5) 12.9%
Income tax and social contribution 44.7 38.4 33.7 32.3 35.1 35.1 52.0 48.1% 9.4 15.6 66.0%
Net loss for the period (105.7) (95.0) (108.9) (119.7) (119.6) (119.6) (153.1) 28.0% (34.9) (49.3) 41.3%
Net Margin -40.0% -27.1% -29.6% -34.5% -25.7% -25.7% -25.6% 0.1 p.p. -22.9% -35.9% -13.0 p.p.
EBITDA 26.8 41.4 47.9 37.0 41.3 41.3 36.1 -12.6% 10.1 7.5 -25.7%
EBITDA Margin 10.1% 11.8% 13.0% 10.7% 8.9% 8.9% 6.0% -2.9 p.p. 6.6% 5.5% -1.1 p.p.
FLEET RENTAL TOTAL FIGURES 2013 2014 2015 2016 20172017
Adjusted2018 Var.
4Q17
Adjusted4Q18 Var.
Fleet rental gross revenues (*) 592.8 589.5 619.6 664.1 757.4 757.4 857.8 13.3% 206.2 227.9 10.5%
Car sales for fleet renewal - gross revenues (*) 264.6 350.8 368.6 347.8 466.5 466.5 599.5 28.5% 152.3 137.7 -9.6%
Total gross revenues (*) 857.4 940.3 988.2 1,011.9 1,223.9 1,223.9 1,457.3 19.1% 358.5 365.6 2.0%
Taxes on revenues
Fleet rental (**) (16.9) (17.6) (11.1) (12.3) (15.3) (15.3) (9.0) -41.2% (2.2) (3.2) 45.5%
Car sales for fleet renewal (0.3) (0.5) (0.4) (0.4) (0.4) (0.4) (0.9) 125.0% (0.2) (0.3) 50.0%
Fleet rental - net revenues 575.9 571.9 608.5 651.8 742.1 742.1 848.8 14.4% 204.0 224.7 10.1%
Car sales for fleet renewal - net revenues 264.3 350.3 368.2 347.4 466.1 466.1 598.6 28.4% 152.1 137.4 -9.7%
Total net revenues (**) 840.2 922.2 976.7 999.2 1,208.2 1,208.2 1,447.4 19.8% 356.1 362.1 1.7%
Direct costs
Fleet rental (161.1) (190.8) (189.3) (193.7) (220.4) (220.1) (245.9) 11.7% (61.3) (65.4) 6.7%
Car sales for fleet renewal (214.1) (276.3) (286.7) (279.4) (392.1) (392.1) (525.9) 34.1% (131.3) (122.5) -6.7%
Gross profit 465.0 455.1 500.7 526.1 595.7 596.0 675.6 13.4% 163.5 174.2 6.5%
Operating expenses (SG&A)
Fleet rental (37.5) (38.1) (40.7) (37.9) (65.4) (62.3) (59.6) -4.3% (20.7) (17.0) -17.9%
Car sales for fleet renewal (23.4) (32.6) (33.6) (31.0) (32.7) (32.7) (36.6) 11.9% (10.7) (7.4) -30.8%
Cars depreciation (143.2) (129.3) (124.7) (118.5) (114.3) (114.3) (159.9) 39.9% (32.2) (47.6) 47.8%
Other assets depreciation and amortization
Fleet rental (1.1) (1.1) (2.2) (2.9) (3.5) (3.5) (4.9) 40.0% (1.2) (1.3) 8.3%
Car sales for fleet renewal - (0.6) (2.0) (1.8) (1.7) (1.7) (1.7) 0.0% (0.5) (0.3) -40.0%
Operating profit before financial results and taxes (EBIT) 259.8 253.4 297.5 334.0 378.1 381.5 412.9 8.2% 98.2 100.6 2.4%
Financial expenses, net (34.1) (45.1) (63.9) (69.8) (81.6) (81.6) (80.1) -1.8% (21.8) (24.7) 13.3%
Income tax and social contribution (66.7) (60.8) (56.8) (58.1) (67.7) (68.5) (84.5) 23.4% (16.2) (18.3) 13.0%
Net income for the period 159.0 147.5 176.8 206.1 228.8 231.4 248.3 7.3% 60.2 57.6 -4.3%
Net margin 18.9% 16.0% 18.1% 20.6% 18.9% 19.2% 17.2% -2.0 p.p. 16.9% 15.9% -1.0 p.p.
EBITDA 404.1 384.4 426.4 457.2 497.6 501.0 579.4 15.6% 132.1 149.8 13.4%
EBITDA margin 48.1% 41.7% 43.7% 45.8% 41.2% 41.5% 40.0% -1.5 p.p. 37.1% 41.4% 4.3 p.p.
OPERATING DATA 2013 2014 2015 2016 2017 2017 2018 Var. 4Q17 4Q18 Var.
Average operating fleet 31,188 30,778 31,676 31,908 36,804 36,804 44,404 20.6% 41,569 48,394 16.4%- -
Average rented fleet 30,121 28,787 30,280 31,222 35,424 35,424 42,321 19.5% 39,658 45,486 14.7%- -
Average operating fleet age (in months) 18.6 18.0 16.7 18.0 18.1 18.1 15.1 -16.6% 16.7 14.7 -12.0%
End of period fleet
Rented Fleet 32,809 34,312 33,948 34,960 44,877 44,877 54,430 21.3% 44,877 54,430 21.3%
Managed Fleet 30 267 207 145 94 94 57 -39.4% 94 57 -39.4%- -
Number of rental days - in thousands 10,843.7 10,363.3 10,900.9 11,240.0 12,752.7 12,752.7 15,235.7 19.5% 3,569.2 4,093.8 14.7%- -
Average daily rental revenues per car (R$) 53.83 56.16 56.08 58.23 58.77 58.77 55.62 -5.4% 57.27 54.99 -4.0%- -
Annualized average depreciation per car (R$) 4,592.3 4,202.1 3,935.2 3,714.0 3,104.3 3,104.3 3,601.1 16.0% 3,102.1 3,936.2 26.9%- -
Utilization rate (Does not include cars in preparation and decomissioning) (***) - - 98.4% 98.9% 98.2% 98.2% 96.8% -1.4 p.p. 98.0% 95.6% -2.4 p.p.
Number of cars purchased 10,918 14,896 11,689 11,762 20,286 20,286 26,148 28.9% 4,858 6,963 43.3%- -
Number of cars sold 9,882 13,043 11,797 10,853 13,653 13,653 16,334 19.6% 4,407 3,721 -15.6%- -
Average sold fleet age (in months) 32.4 35.1 33.4 31.4 31.8 31.8 31.2 -1.9% 32.9 26.8 -18.5%
Average total fleet 32,488 32,686 33,446 33,436 39,605 39,605 48,776 23.2% 44,701 53,365 19.4%- -
Average value of total fleet - R$ million 887.3 943.3 1,067.1 1,130.4 1,482.5 1,482.5 1,943.1 31.1% 1,796.5 2,154.9 20.0%- -
Average value per car in the period - R$ thsd 27.3 28.9 31.9 33.8 37.4 37.4 39.8 6.4% 40.2 40.4 0.5%
(*) Gross revenues from fleet rental and car sales for fleet renewal are net of discounts and cancellations.
(***) The 2015 utilization rate was calculated only on the basis of the fourth quarter of 2015.
(**) As of 4Q17, the amounts relative to the provision over the difference between PIS and Cofins credits were reclassified as SG&A, as per Note Provisions and Escrow Deposits of 2017 the Financial Statements
22
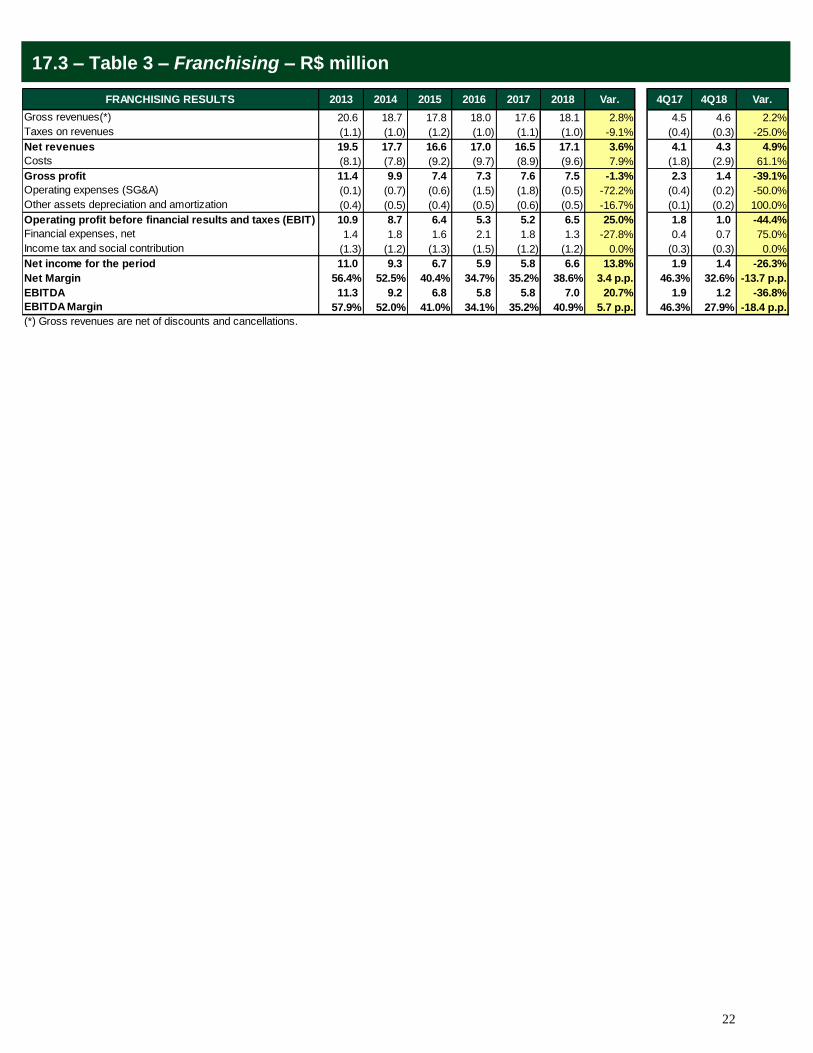
17.3 – Table 3 – Franchising – R$ million
FRANCHISING RESULTS 2013 2014 2015 2016 2017 2018 Var. 4Q17 4Q18 Var.
Gross revenues(*) 20.6 18.7 17.8 18.0 17.6 18.1 2.8% 4.5 4.6 2.2%
Taxes on revenues (1.1) (1.0) (1.2) (1.0) (1.1) (1.0) -9.1% (0.4) (0.3) -25.0%
Net revenues 19.5 17.7 16.6 17.0 16.5 17.1 3.6% 4.1 4.3 4.9%
Costs (8.1) (7.8) (9.2) (9.7) (8.9) (9.6) 7.9% (1.8) (2.9) 61.1%
Gross profit 11.4 9.9 7.4 7.3 7.6 7.5 -1.3% 2.3 1.4 -39.1%
Operating expenses (SG&A) (0.1) (0.7) (0.6) (1.5) (1.8) (0.5) -72.2% (0.4) (0.2) -50.0%
Other assets depreciation and amortization (0.4) (0.5) (0.4) (0.5) (0.6) (0.5) -16.7% (0.1) (0.2) 100.0%
Operating profit before financial results and taxes (EBIT) 10.9 8.7 6.4 5.3 5.2 6.5 25.0% 1.8 1.0 -44.4%
Financial expenses, net 1.4 1.8 1.6 2.1 1.8 1.3 -27.8% 0.4 0.7 75.0%
Income tax and social contribution (1.3) (1.2) (1.3) (1.5) (1.2) (1.2) 0.0% (0.3) (0.3) 0.0%
Net income for the period 11.0 9.3 6.7 5.9 5.8 6.6 13.8% 1.9 1.4 -26.3%
Net Margin 56.4% 52.5% 40.4% 34.7% 35.2% 38.6% 3.4 p.p. 46.3% 32.6% -13.7 p.p.
EBITDA 11.3 9.2 6.8 5.8 5.8 7.0 20.7% 1.9 1.2 -36.8%
EBITDA Margin 57.9% 52.0% 41.0% 34.1% 35.2% 40.9% 5.7 p.p. 46.3% 27.9% -18.4 p.p.
(*) Gross revenues are net of discounts and cancellations.
23
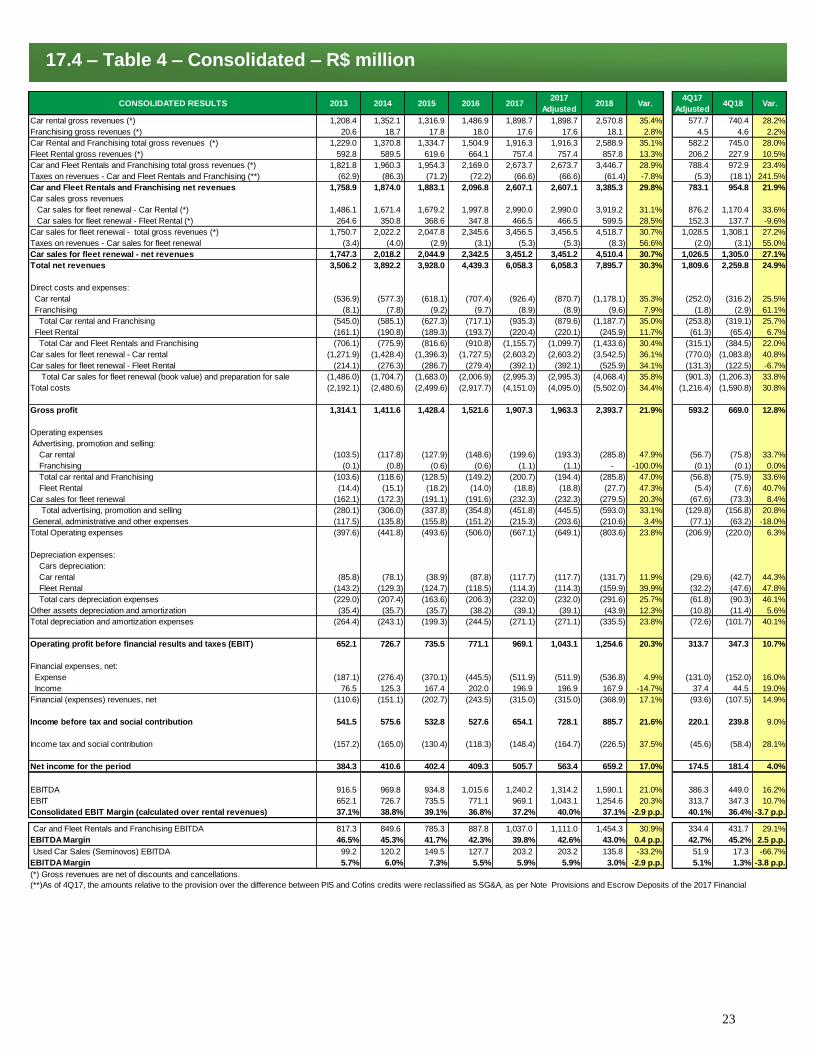
17.4 – Table 4 – Consolidated – R$ million
CONSOLIDATED RESULTS 2013 2014 2015 2016 20172017
Adjusted2018 Var.
4Q17
Adjusted4Q18 Var.
Car rental gross revenues (*) 1,208.4 1,352.1 1,316.9 1,486.9 1,898.7 1,898.7 2,570.8 35.4% 577.7 740.4 28.2%
Franchising gross revenues (*) 20.6 18.7 17.8 18.0 17.6 17.6 18.1 2.8% 4.5 4.6 2.2%
Car Rental and Franchising total gross revenues (*) 1,229.0 1,370.8 1,334.7 1,504.9 1,916.3 1,916.3 2,588.9 35.1% 582.2 745.0 28.0%
Fleet Rental gross revenues (*) 592.8 589.5 619.6 664.1 757.4 757.4 857.8 13.3% 206.2 227.9 10.5%
Car and Fleet Rentals and Franchising total gross revenues (*) 1,821.8 1,960.3 1,954.3 2,169.0 2,673.7 2,673.7 3,446.7 28.9% 788.4 972.9 23.4%
Taxes on revenues - Car and Fleet Rentals and Franchising (**) (62.9) (86.3) (71.2) (72.2) (66.6) (66.6) (61.4) -7.8% (5.3) (18.1) 241.5%
Car and Fleet Rentals and Franchising net revenues 1,758.9 1,874.0 1,883.1 2,096.8 2,607.1 2,607.1 3,385.3 29.8% 783.1 954.8 21.9%
Car sales gross revenues
Car sales for fleet renewal - Car Rental (*) 1,486.1 1,671.4 1,679.2 1,997.8 2,990.0 2,990.0 3,919.2 31.1% 876.2 1,170.4 33.6%
Car sales for fleet renewal - Fleet Rental (*) 264.6 350.8 368.6 347.8 466.5 466.5 599.5 28.5% 152.3 137.7 -9.6%
Car sales for fleet renewal - total gross revenues (*) 1,750.7 2,022.2 2,047.8 2,345.6 3,456.5 3,456.5 4,518.7 30.7% 1,028.5 1,308.1 27.2%
Taxes on revenues - Car sales for fleet renewal (3.4) (4.0) (2.9) (3.1) (5.3) (5.3) (8.3) 56.6% (2.0) (3.1) 55.0%
Car sales for fleet renewal - net revenues 1,747.3 2,018.2 2,044.9 2,342.5 3,451.2 3,451.2 4,510.4 30.7% 1,026.5 1,305.0 27.1%
Total net revenues 3,506.2 3,892.2 3,928.0 4,439.3 6,058.3 6,058.3 7,895.7 30.3% 1,809.6 2,259.8 24.9%
Direct costs and expenses:
Car rental (536.9) (577.3) (618.1) (707.4) (926.4) (870.7) (1,178.1) 35.3% (252.0) (316.2) 25.5%
Franchising (8.1) (7.8) (9.2) (9.7) (8.9) (8.9) (9.6) 7.9% (1.8) (2.9) 61.1%
Total Car rental and Franchising (545.0) (585.1) (627.3) (717.1) (935.3) (879.6) (1,187.7) 35.0% (253.8) (319.1) 25.7%
Fleet Rental (161.1) (190.8) (189.3) (193.7) (220.4) (220.1) (245.9) 11.7% (61.3) (65.4) 6.7%
Total Car and Fleet Rentals and Franchising (706.1) (775.9) (816.6) (910.8) (1,155.7) (1,099.7) (1,433.6) 30.4% (315.1) (384.5) 22.0%
Car sales for fleet renewal - Car rental (1,271.9) (1,428.4) (1,396.3) (1,727.5) (2,603.2) (2,603.2) (3,542.5) 36.1% (770.0) (1,083.8) 40.8%
Car sales for fleet renewal - Fleet Rental (214.1) (276.3) (286.7) (279.4) (392.1) (392.1) (525.9) 34.1% (131.3) (122.5) -6.7%
Total Car sales for fleet renewal (book value) and preparation for sale (1,486.0) (1,704.7) (1,683.0) (2,006.9) (2,995.3) (2,995.3) (4,068.4) 35.8% (901.3) (1,206.3) 33.8%
Total costs (2,192.1) (2,480.6) (2,499.6) (2,917.7) (4,151.0) (4,095.0) (5,502.0) 34.4% (1,216.4) (1,590.8) 30.8%
Gross profit 1,314.1 1,411.6 1,428.4 1,521.6 1,907.3 1,963.3 2,393.7 21.9% 593.2 669.0 12.8%
Operating expenses
Advertising, promotion and selling:
Car rental (103.5) (117.8) (127.9) (148.6) (199.6) (193.3) (285.8) 47.9% (56.7) (75.8) 33.7%
Franchising (0.1) (0.8) (0.6) (0.6) (1.1) (1.1) - -100.0% (0.1) (0.1) 0.0%
Total car rental and Franchising (103.6) (118.6) (128.5) (149.2) (200.7) (194.4) (285.8) 47.0% (56.8) (75.9) 33.6%
Fleet Rental (14.4) (15.1) (18.2) (14.0) (18.8) (18.8) (27.7) 47.3% (5.4) (7.6) 40.7%
Car sales for fleet renewal (162.1) (172.3) (191.1) (191.6) (232.3) (232.3) (279.5) 20.3% (67.6) (73.3) 8.4%
Total advertising, promotion and selling (280.1) (306.0) (337.8) (354.8) (451.8) (445.5) (593.0) 33.1% (129.8) (156.8) 20.8%
General, administrative and other expenses (117.5) (135.8) (155.8) (151.2) (215.3) (203.6) (210.6) 3.4% (77.1) (63.2) -18.0%
Total Operating expenses (397.6) (441.8) (493.6) (506.0) (667.1) (649.1) (803.6) 23.8% (206.9) (220.0) 6.3%
Depreciation expenses:
Cars depreciation:
Car rental (85.8) (78.1) (38.9) (87.8) (117.7) (117.7) (131.7) 11.9% (29.6) (42.7) 44.3%
Fleet Rental (143.2) (129.3) (124.7) (118.5) (114.3) (114.3) (159.9) 39.9% (32.2) (47.6) 47.8%
Total cars depreciation expenses (229.0) (207.4) (163.6) (206.3) (232.0) (232.0) (291.6) 25.7% (61.8) (90.3) 46.1%
Other assets depreciation and amortization (35.4) (35.7) (35.7) (38.2) (39.1) (39.1) (43.9) 12.3% (10.8) (11.4) 5.6%
Total depreciation and amortization expenses (264.4) (243.1) (199.3) (244.5) (271.1) (271.1) (335.5) 23.8% (72.6) (101.7) 40.1%
Operating profit before financial results and taxes (EBIT) 652.1 726.7 735.5 771.1 969.1 1,043.1 1,254.6 20.3% 313.7 347.3 10.7%
Financial expenses, net:
Expense (187.1) (276.4) (370.1) (445.5) (511.9) (511.9) (536.8) 4.9% (131.0) (152.0) 16.0%
Income 76.5 125.3 167.4 202.0 196.9 196.9 167.9 -14.7% 37.4 44.5 19.0%
Financial (expenses) revenues, net (110.6) (151.1) (202.7) (243.5) (315.0) (315.0) (368.9) 17.1% (93.6) (107.5) 14.9%
Income before tax and social contribution 541.5 575.6 532.8 527.6 654.1 728.1 885.7 21.6% 220.1 239.8 9.0%
Income tax and social contribution (157.2) (165.0) (130.4) (118.3) (148.4) (164.7) (226.5) 37.5% (45.6) (58.4) 28.1%
Net income for the period 384.3 410.6 402.4 409.3 505.7 563.4 659.2 17.0% 174.5 181.4 4.0%
EBITDA 916.5 969.8 934.8 1,015.6 1,240.2 1,314.2 1,590.1 21.0% 386.3 449.0 16.2%
EBIT 652.1 726.7 735.5 771.1 969.1 1,043.1 1,254.6 20.3% 313.7 347.3 10.7%
Consolidated EBIT Margin (calculated over rental revenues) 37.1% 38.8% 39.1% 36.8% 37.2% 40.0% 37.1% -2.9 p.p. 40.1% 36.4% -3.7 p.p.
Car and Fleet Rentals and Franchising EBITDA 817.3 849.6 785.3 887.8 1,037.0 1,111.0 1,454.3 30.9% 334.4 431.7 29.1%
EBITDA Margin 46.5% 45.3% 41.7% 42.3% 39.8% 42.6% 43.0% 0.4 p.p. 42.7% 45.2% 2.5 p.p.
Used Car Sales (Seminovos) EBITDA 99.2 120.2 149.5 127.7 203.2 203.2 135.8 -33.2% 51.9 17.3 -66.7%
EBITDA Margin 5.7% 6.0% 7.3% 5.5% 5.9% 5.9% 3.0% -2.9 p.p. 5.1% 1.3% -3.8 p.p.
(*) Gross revenues are net of discounts and cancellations.
(**)As of 4Q17, the amounts relative to the provision over the difference between PIS and Cofins credits were reclassified as SG&A, as per Note Provisions and Escrow Deposits of the 2017 Financial
24
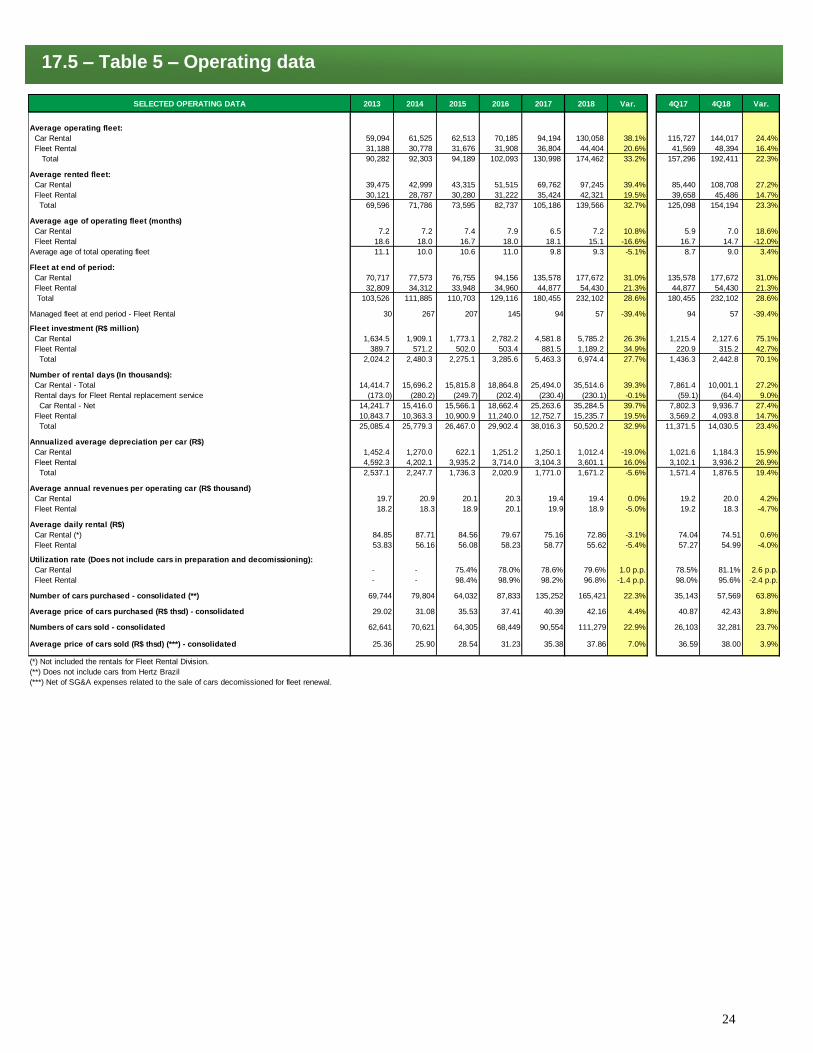
17.5 – Table 5 – Operating data
SELECTED OPERATING DATA 2013 2014 2015 2016 2017 2018 Var. 4Q17 4Q18 Var.
Average operating fleet:
Car Rental 59,094 61,525 62,513 70,185 94,194 130,058 38.1% 115,727 144,017 24.4%
Fleet Rental 31,188 30,778 31,676 31,908 36,804 44,404 20.6% 41,569 48,394 16.4%
Total 90,282 92,303 94,189 102,093 130,998 174,462 33.2% 157,296 192,411 22.3%
Average rented fleet:
Car Rental 39,475 42,999 43,315 51,515 69,762 97,245 39.4% 85,440 108,708 27.2%
Fleet Rental 30,121 28,787 30,280 31,222 35,424 42,321 19.5% 39,658 45,486 14.7%
Total 69,596 71,786 73,595 82,737 105,186 139,566 32.7% 125,098 154,194 23.3%
Average age of operating fleet (months)
Car Rental 7.2 7.2 7.4 7.9 6.5 7.2 10.8% 5.9 7.0 18.6%
Fleet Rental 18.6 18.0 16.7 18.0 18.1 15.1 -16.6% 16.7 14.7 -12.0%
Average age of total operating fleet 11.1 10.0 10.6 11.0 9.8 9.3 -5.1% 8.7 9.0 3.4%
Fleet at end of period:
Car Rental 70,717 77,573 76,755 94,156 135,578 177,672 31.0% 135,578 177,672 31.0%
Fleet Rental 32,809 34,312 33,948 34,960 44,877 54,430 21.3% 44,877 54,430 21.3%
Total 103,526 111,885 110,703 129,116 180,455 232,102 28.6% 180,455 232,102 28.6%
Managed fleet at end period - Fleet Rental 30 267 207 145 94 57 -39.4% 94 57 -39.4%
Fleet investment (R$ million)
Car Rental 1,634.5 1,909.1 1,773.1 2,782.2 4,581.8 5,785.2 26.3% 1,215.4 2,127.6 75.1%
Fleet Rental 389.7 571.2 502.0 503.4 881.5 1,189.2 34.9% 220.9 315.2 42.7%
Total 2,024.2 2,480.3 2,275.1 3,285.6 5,463.3 6,974.4 27.7% 1,436.3 2,442.8 70.1%
Number of rental days (In thousands):
Car Rental - Total 14,414.7 15,696.2 15,815.8 18,864.8 25,494.0 35,514.6 39.3% 7,861.4 10,001.1 27.2%
Rental days for Fleet Rental replacement service (173.0) (280.2) (249.7) (202.4) (230.4) (230.1) -0.1% (59.1) (64.4) 9.0%
Car Rental - Net 14,241.7 15,416.0 15,566.1 18,662.4 25,263.6 35,284.5 39.7% 7,802.3 9,936.7 27.4%
Fleet Rental 10,843.7 10,363.3 10,900.9 11,240.0 12,752.7 15,235.7 19.5% 3,569.2 4,093.8 14.7%
Total 25,085.4 25,779.3 26,467.0 29,902.4 38,016.3 50,520.2 32.9% 11,371.5 14,030.5 23.4%
Annualized average depreciation per car (R$)
Car Rental 1,452.4 1,270.0 622.1 1,251.2 1,250.1 1,012.4 -19.0% 1,021.6 1,184.3 15.9%
Fleet Rental 4,592.3 4,202.1 3,935.2 3,714.0 3,104.3 3,601.1 16.0% 3,102.1 3,936.2 26.9%
Total 2,537.1 2,247.7 1,736.3 2,020.9 1,771.0 1,671.2 -5.6% 1,571.4 1,876.5 19.4%
Average annual revenues per operating car (R$ thousand)
Car Rental 19.7 20.9 20.1 20.3 19.4 19.4 0.0% 19.2 20.0 4.2%
Fleet Rental 18.2 18.3 18.9 20.1 19.9 18.9 -5.0% 19.2 18.3 -4.7%
Average daily rental (R$)
Car Rental (*) 84.85 87.71 84.56 79.67 75.16 72.86 -3.1% 74.04 74.51 0.6%
Fleet Rental 53.83 56.16 56.08 58.23 58.77 55.62 -5.4% 57.27 54.99 -4.0%
Utilization rate (Does not include cars in preparation and decomissioning):
Car Rental - - 75.4% 78.0% 78.6% 79.6% 1.0 p.p. 78.5% 81.1% 2.6 p.p.
Fleet Rental - - 98.4% 98.9% 98.2% 96.8% -1.4 p.p. 98.0% 95.6% -2.4 p.p.
Number of cars purchased - consolidated (**) 69,744 79,804 64,032 87,833 135,252 165,421 22.3% 35,143 57,569 63.8%
Average price of cars purchased (R$ thsd) - consolidated 29.02 31.08 35.53 37.41 40.39 42.16 4.4% 40.87 42.43 3.8%
Numbers of cars sold - consolidated 62,641 70,621 64,305 68,449 90,554 111,279 22.9% 26,103 32,281 23.7%
Average price of cars sold (R$ thsd) (***) - consolidated 25.36 25.90 28.54 31.23 35.38 37.86 7.0% 36.59 38.00 3.9%
(**) Does not include cars from Hertz Brazil
(***) Net of SG&A expenses related to the sale of cars decomissioned for fleet renewal.
(*) Not included the rentals for Fleet Rental Division.
25
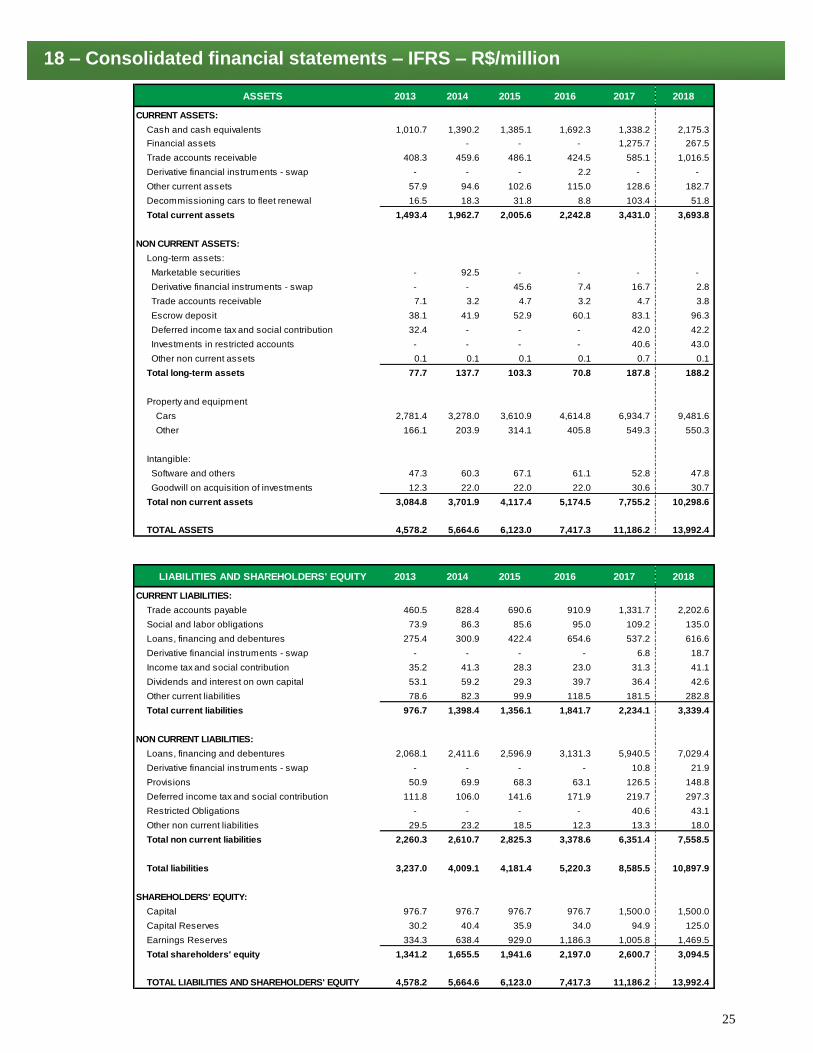
18 – Consolidated financial statements – IFRS – R$/million
ASSETS 2013 2014 2015 2016 2017 2018
CURRENT ASSETS:
Cash and cash equivalents 1,010.7 1,390.2 1,385.1 1,692.3 1,338.2 2,175.3
Financial assets - - - 1,275.7 267.5
Trade accounts receivable 408.3 459.6 486.1 424.5 585.1 1,016.5
Derivative financial instruments - swap - - - 2.2 - -
Other current assets 57.9 94.6 102.6 115.0 128.6 182.7
Decommissioning cars to fleet renewal 16.5 18.3 31.8 8.8 103.4 51.8
Total current assets 1,493.4 1,962.7 2,005.6 2,242.8 3,431.0 3,693.8
NON CURRENT ASSETS:
Long-term assets:
Marketable securities - 92.5 - - - -
Derivative financial instruments - swap - - 45.6 7.4 16.7 2.8
Trade accounts receivable 7.1 3.2 4.7 3.2 4.7 3.8
Escrow deposit 38.1 41.9 52.9 60.1 83.1 96.3
Deferred income tax and social contribution 32.4 - - - 42.0 42.2
Investments in restricted accounts - - - - 40.6 43.0
Other non current assets 0.1 0.1 0.1 0.1 0.7 0.1
Total long-term assets 77.7 137.7 103.3 70.8 187.8 188.2
Property and equipment
Cars 2,781.4 3,278.0 3,610.9 4,614.8 6,934.7 9,481.6
Other 166.1 203.9 314.1 405.8 549.3 550.3
Intangible:
Software and others 47.3 60.3 67.1 61.1 52.8 47.8
Goodwill on acquisition of investments 12.3 22.0 22.0 22.0 30.6 30.7
Total non current assets 3,084.8 3,701.9 4,117.4 5,174.5 7,755.2 10,298.6
TOTAL ASSETS 4,578.2 5,664.6 6,123.0 7,417.3 11,186.2 13,992.4
LIABILITIES AND SHAREHOLDERS' EQUITY 2013 2014 2015 2016 2017 2018
CURRENT LIABILITIES:
Trade accounts payable 460.5 828.4 690.6 910.9 1,331.7 2,202.6
Social and labor obligations 73.9 86.3 85.6 95.0 109.2 135.0
Loans, financing and debentures 275.4 300.9 422.4 654.6 537.2 616.6
Derivative financial instruments - swap - - - - 6.8 18.7
Income tax and social contribution 35.2 41.3 28.3 23.0 31.3 41.1
Dividends and interest on own capital 53.1 59.2 29.3 39.7 36.4 42.6
Other current liabilities 78.6 82.3 99.9 118.5 181.5 282.8
Total current liabilities 976.7 1,398.4 1,356.1 1,841.7 2,234.1 3,339.4
NON CURRENT LIABILITIES:
Loans, financing and debentures 2,068.1 2,411.6 2,596.9 3,131.3 5,940.5 7,029.4
Derivative financial instruments - swap - - - - 10.8 21.9
Provisions 50.9 69.9 68.3 63.1 126.5 148.8
Deferred income tax and social contribution 111.8 106.0 141.6 171.9 219.7 297.3
Restricted Obligations - - - - 40.6 43.1
Other non current liabilities 29.5 23.2 18.5 12.3 13.3 18.0
Total non current liabilities 2,260.3 2,610.7 2,825.3 3,378.6 6,351.4 7,558.5
Total liabilities 3,237.0 4,009.1 4,181.4 5,220.3 8,585.5 10,897.9
SHAREHOLDERS' EQUITY:
Capital 976.7 976.7 976.7 976.7 1,500.0 1,500.0
Capital Reserves 30.2 40.4 35.9 34.0 94.9 125.0
Earnings Reserves 334.3 638.4 929.0 1,186.3 1,005.8 1,469.5
Total shareholders' equity 1,341.2 1,655.5 1,941.6 2,197.0 2,600.7 3,094.5
TOTAL LIABILITIES AND SHAREHOLDERS' EQUITY 4,578.2 5,664.6 6,123.0 7,417.3 11,186.2 13,992.4
26
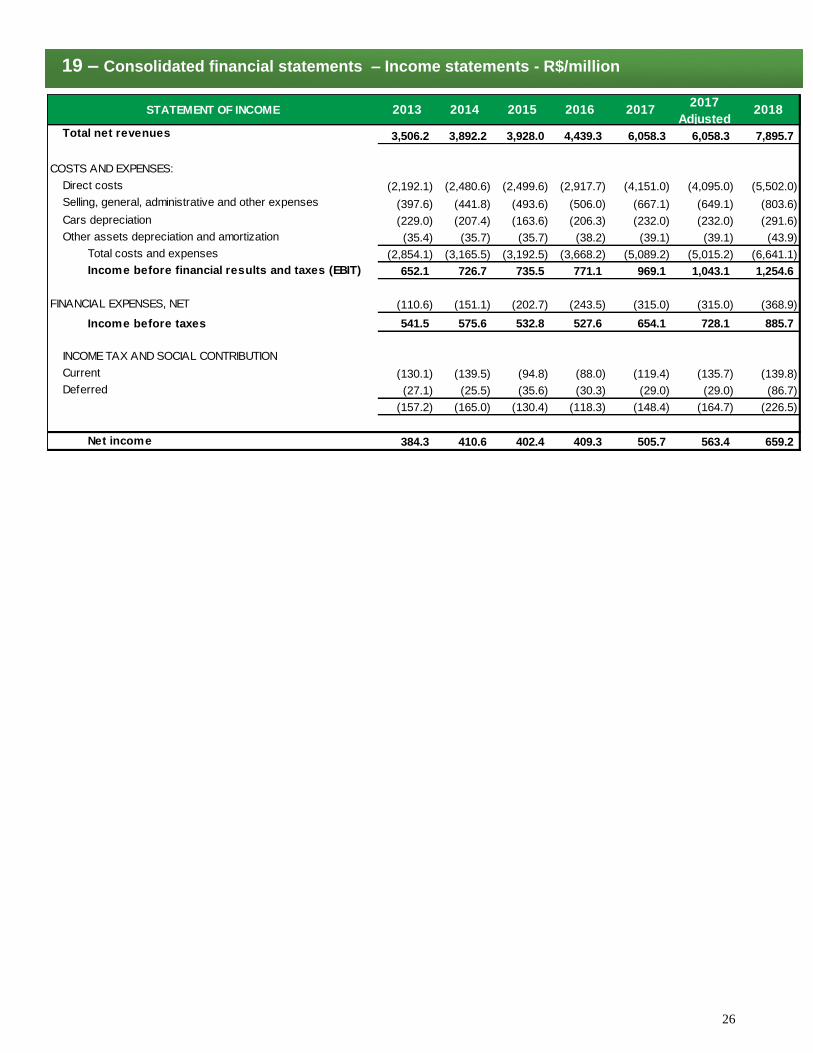
19 – Consolidated financial statements – Income statements - R$/million
STATEMENT OF INCOME 2013 2014 2015 2016 2017 2017
Adjusted2018
Total net revenues 3,506.2 3,892.2 3,928.0 4,439.3 6,058.3 6,058.3 7,895.7
COSTS AND EXPENSES:
Direct costs (2,192.1) (2,480.6) (2,499.6) (2,917.7) (4,151.0) (4,095.0) (5,502.0)
Selling, general, administrative and other expenses (397.6) (441.8) (493.6) (506.0) (667.1) (649.1) (803.6)
Cars depreciation (229.0) (207.4) (163.6) (206.3) (232.0) (232.0) (291.6)
Other assets depreciation and amortization (35.4) (35.7) (35.7) (38.2) (39.1) (39.1) (43.9)
Total costs and expenses (2,854.1) (3,165.5) (3,192.5) (3,668.2) (5,089.2) (5,015.2) (6,641.1)
Income before financial results and taxes (EBIT) 652.1 726.7 735.5 771.1 969.1 1,043.1 1,254.6
FINANCIAL EXPENSES, NET (110.6) (151.1) (202.7) (243.5) (315.0) (315.0) (368.9)
Income before taxes 541.5 575.6 532.8 527.6 654.1 728.1 885.7
INCOME TAX AND SOCIAL CONTRIBUTION
Current (130.1) (139.5) (94.8) (88.0) (119.4) (135.7) (139.8)
Deferred (27.1) (25.5) (35.6) (30.3) (29.0) (29.0) (86.7)
(157.2) (165.0) (130.4) (118.3) (148.4) (164.7) (226.5)
Net income 384.3 410.6 402.4 409.3 505.7 563.4 659.2
27
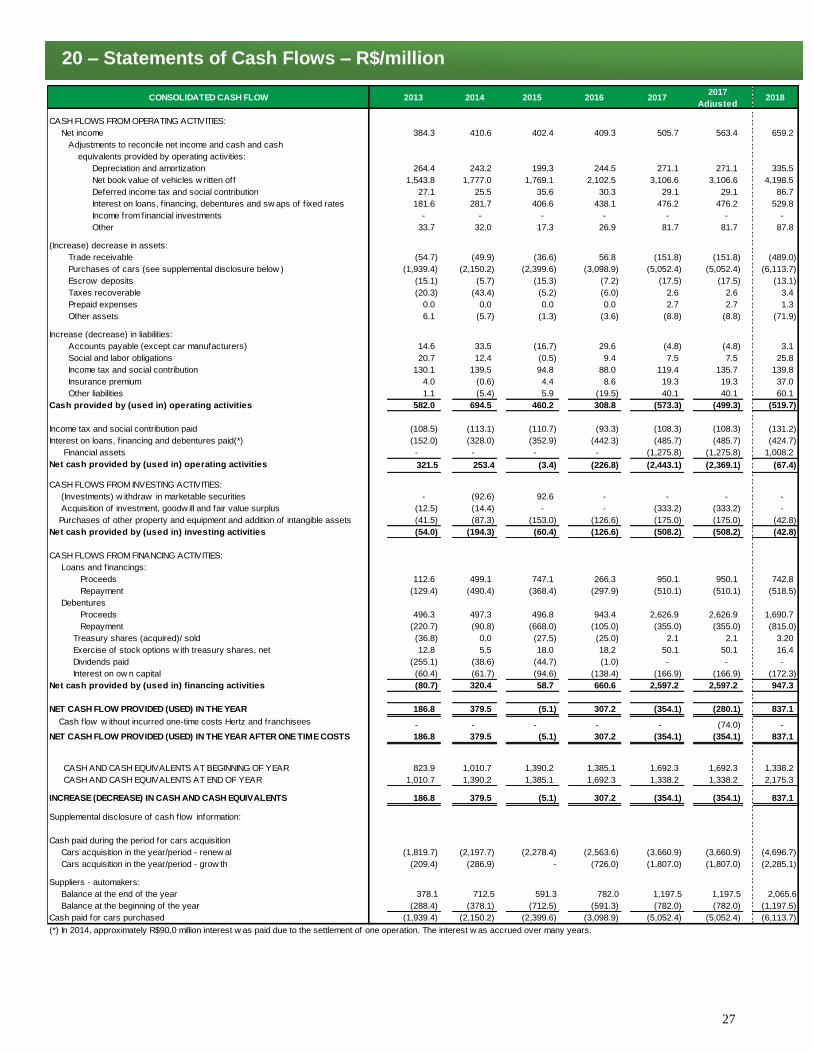
20 – Statements of Cash Flows – R$/million
CONSOLIDATED CASH FLOW 2013 2014 2015 2016 2017 2017
Adjusted2018
CASH FLOWS FROM OPERATING ACTIVITIES:
Net income 384.3 410.6 402.4 409.3 505.7 563.4 659.2
Adjustments to reconcile net income and cash and cash
equivalents provided by operating activities:
Depreciation and amortization 264.4 243.2 199.3 244.5 271.1 271.1 335.5
Net book value of vehicles w ritten off 1,543.8 1,777.0 1,769.1 2,102.5 3,106.6 3,106.6 4,198.5
Deferred income tax and social contribution 27.1 25.5 35.6 30.3 29.1 29.1 86.7
Interest on loans, f inancing, debentures and sw aps of f ixed rates 181.6 281.7 406.6 438.1 476.2 476.2 529.8
Income from financial investments - - - - - - -
Other 33.7 32.0 17.3 26.9 81.7 81.7 87.8
(Increase) decrease in assets:
Trade receivable (54.7) (49.9) (36.6) 56.8 (151.8) (151.8) (489.0)
Purchases of cars (see supplemental disclosure below ) (1,939.4) (2,150.2) (2,399.6) (3,098.9) (5,052.4) (5,052.4) (6,113.7)
Escrow deposits (15.1) (5.7) (15.3) (7.2) (17.5) (17.5) (13.1)
Taxes recoverable (20.3) (43.4) (5.2) (6.0) 2.6 2.6 3.4
Prepaid expenses 0.0 0.0 0.0 0.0 2.7 2.7 1.3
Other assets 6.1 (5.7) (1.3) (3.6) (8.8) (8.8) (71.9)
Increase (decrease) in liabilities:
Accounts payable (except car manufacturers) 14.6 33.5 (16.7) 29.6 (4.8) (4.8) 3.1
Social and labor obligations 20.7 12.4 (0.5) 9.4 7.5 7.5 25.8
Income tax and social contribution 130.1 139.5 94.8 88.0 119.4 135.7 139.8
Insurance premium 4.0 (0.6) 4.4 8.6 19.3 19.3 37.0
Other liabilities 1.1 (5.4) 5.9 (19.5) 40.1 40.1 60.1
Cash provided by (used in) operating activities 582.0 694.5 460.2 308.8 (573.3) (499.3) (519.7)
Income tax and social contribution paid (108.5) (113.1) (110.7) (93.3) (108.3) (108.3) (131.2)
Interest on loans, f inancing and debentures paid(*) (152.0) (328.0) (352.9) (442.3) (485.7) (485.7) (424.7)
Financial assets - - - - (1,275.8) (1,275.8) 1,008.2
Net cash provided by (used in) operating activities 321.5 253.4 (3.4) (226.8) (2,443.1) (2,369.1) (67.4)
CASH FLOWS FROM INVESTING ACTIVITIES:
(Investments) w ithdraw in marketable securities - (92.6) 92.6 - - - -
Acquisition of investment, goodw ill and fair value surplus (12.5) (14.4) - - (333.2) (333.2) -
Purchases of other property and equipment and addition of intangible assets (41.5) (87.3) (153.0) (126.6) (175.0) (175.0) (42.8)
Net cash provided by (used in) investing activities (54.0) (194.3) (60.4) (126.6) (508.2) (508.2) (42.8)
CASH FLOWS FROM FINANCING ACTIVITIES:
Loans and f inancings:
Proceeds 112.6 499.1 747.1 266.3 950.1 950.1 742.8
Repayment (129.4) (490.4) (368.4) (297.9) (510.1) (510.1) (518.5)
Debentures
Proceeds 496.3 497.3 496.8 943.4 2,626.9 2,626.9 1,690.7
Repayment (220.7) (90.8) (668.0) (105.0) (355.0) (355.0) (815.0)
Treasury shares (acquired)/ sold (36.8) 0.0 (27.5) (25.0) 2.1 2.1 3.20
Exercise of stock options w ith treasury shares, net 12.8 5.5 18.0 18.2 50.1 50.1 16.4
Dividends paid (255.1) (38.6) (44.7) (1.0) - - -
Interest on ow n capital (60.4) (61.7) (94.6) (138.4) (166.9) (166.9) (172.3)
Net cash provided by (used in) financing activities (80.7) 320.4 58.7 660.6 2,597.2 2,597.2 947.3
NET CASH FLOW PROVIDED (USED) IN THE YEAR 186.8 379.5 (5.1) 307.2 (354.1) (280.1) 837.1
Cash flow w ithout incurred one-time costs Hertz and franchisees - - - - - (74.0) -
NET CASH FLOW PROVIDED (USED) IN THE YEAR AFTER ONE TIME COSTS 186.8 379.5 (5.1) 307.2 (354.1) (354.1) 837.1
CASH AND CASH EQUIVALENTS AT BEGINNING OF YEAR 823.9 1,010.7 1,390.2 1,385.1 1,692.3 1,692.3 1,338.2
CASH AND CASH EQUIVALENTS AT END OF YEAR 1,010.7 1,390.2 1,385.1 1,692.3 1,338.2 1,338.2 2,175.3
INCREASE (DECREASE) IN CASH AND CASH EQUIVALENTS 186.8 379.5 (5.1) 307.2 (354.1) (354.1) 837.1
Supplemental disclosure of cash f low information:
Cash paid during the period for cars acquisition
Cars acquisition in the year/period - renew al (1,819.7) (2,197.7) (2,278.4) (2,563.6) (3,660.9) (3,660.9) (4,696.7)
Cars acquisition in the year/period - grow th (209.4) (286.9) - (726.0) (1,807.0) (1,807.0) (2,285.1)
Suppliers - automakers:
Balance at the end of the year 378.1 712.5 591.3 782.0 1,197.5 1,197.5 2,065.6
Balance at the beginning of the year (288.4) (378.1) (712.5) (591.3) (782.0) (782.0) (1,197.5)
Cash paid for cars purchased (1,939.4) (2,150.2) (2,399.6) (3,098.9) (5,052.4) (5,052.4) (6,113.7)
(*) In 2014, approximately R$90.0 million interest w as paid due to the settlement of one operation. The interest w as accrued over many years.
28
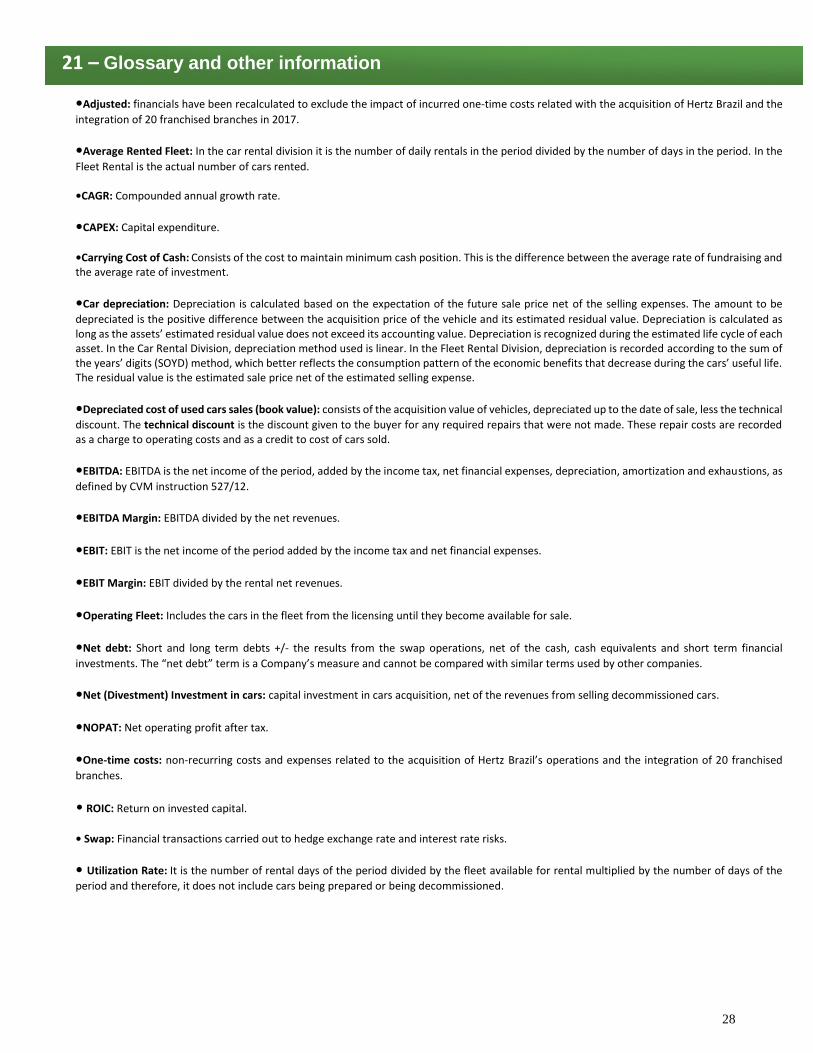
•Adjusted: financials have been recalculated to exclude the impact of incurred one-time costs related with the acquisition of Hertz Brazil and the
integration of 20 franchised branches in 2017.
•Average Rented Fleet: In the car rental division it is the number of daily rentals in the period divided by the number of days in the period. In the
Fleet Rental is the actual number of cars rented. •CAGR: Compounded annual growth rate.
•CAPEX: Capital expenditure.
•Carrying Cost of Cash: Consists of the cost to maintain minimum cash position. This is the difference between the average rate of fundraising and the average rate of investment.
•Car depreciation: Depreciation is calculated based on the expectation of the future sale price net of the selling expenses. The amount to be
depreciated is the positive difference between the acquisition price of the vehicle and its estimated residual value. Depreciation is calculated as long as the assets’ estimated residual value does not exceed its accounting value. Depreciation is recognized during the estimated life cycle of each asset. In the Car Rental Division, depreciation method used is linear. In the Fleet Rental Division, depreciation is recorded according to the sum of the years’ digits (SOYD) method, which better reflects the consumption pattern of the economic benefits that decrease during the cars’ useful life. The residual value is the estimated sale price net of the estimated selling expense.
•Depreciated cost of used cars sales (book value): consists of the acquisition value of vehicles, depreciated up to the date of sale, less the technical
discount. The technical discount is the discount given to the buyer for any required repairs that were not made. These repair costs are recorded as a charge to operating costs and as a credit to cost of cars sold.
•EBITDA: EBITDA is the net income of the period, added by the income tax, net financial expenses, depreciation, amortization and exhaustions, as
defined by CVM instruction 527/12.
•EBITDA Margin: EBITDA divided by the net revenues.
•EBIT: EBIT is the net income of the period added by the income tax and net financial expenses.
•EBIT Margin: EBIT divided by the rental net revenues.
•Operating Fleet: Includes the cars in the fleet from the licensing until they become available for sale.
•Net debt: Short and long term debts +/- the results from the swap operations, net of the cash, cash equivalents and short term financial
investments. The “net debt” term is a Company’s measure and cannot be compared with similar terms used by other companies.
•Net (Divestment) Investment in cars: capital investment in cars acquisition, net of the revenues from selling decommissioned cars.
•NOPAT: Net operating profit after tax.
•One-time costs: non-recurring costs and expenses related to the acquisition of Hertz Brazil’s operations and the integration of 20 franchised
branches.
• ROIC: Return on invested capital.
• Swap: Financial transactions carried out to hedge exchange rate and interest rate risks.
• Utilization Rate: It is the number of rental days of the period divided by the fleet available for rental multiplied by the number of days of the
period and therefore, it does not include cars being prepared or being decommissioned.
21 – Glossary and other information
29
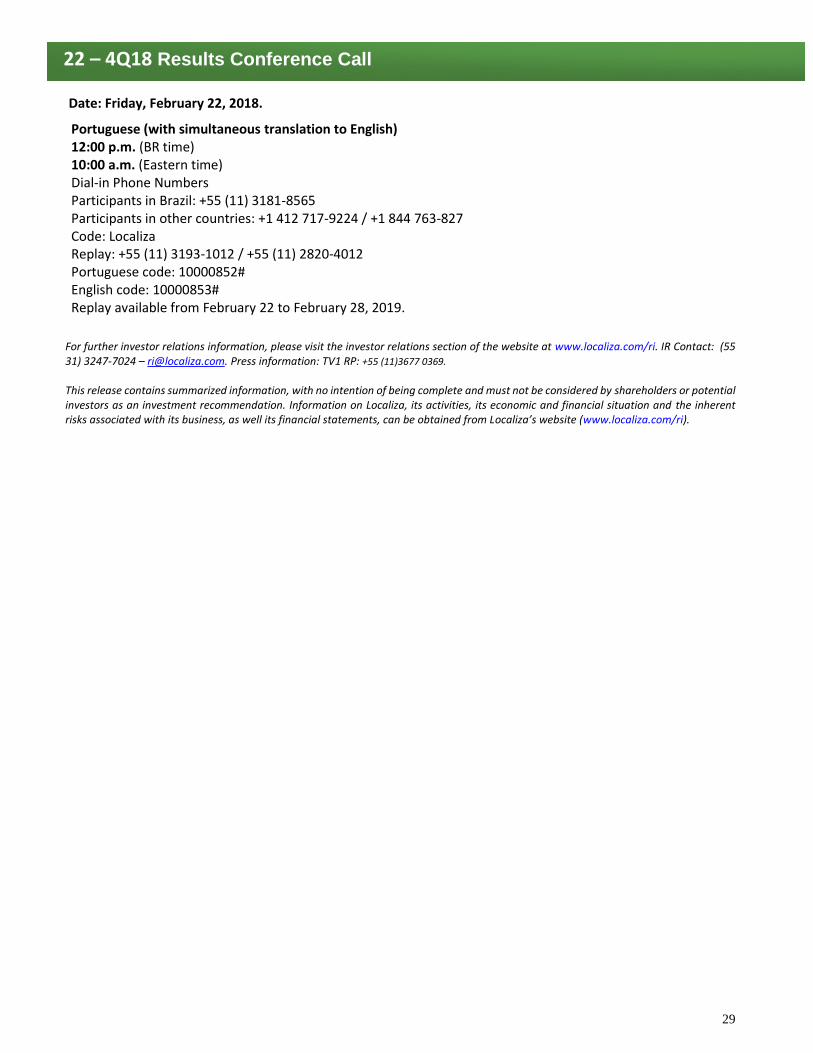
Date: Friday, February 22, 2018.
Portuguese (with simultaneous translation to English) 12:00 p.m. (BR time) 10:00 a.m. (Eastern time) Dial-in Phone Numbers Participants in Brazil: +55 (11) 3181-8565 Participants in other countries: +1 412 717-9224 / +1 844 763-827 Code: Localiza Replay: +55 (11) 3193-1012 / +55 (11) 2820-4012 Portuguese code: 10000852# English code: 10000853# Replay available from February 22 to February 28, 2019.
For further investor relations information, please visit the investor relations section of the website at www.localiza.com/ri. IR Contact: (55 31) 3247-7024 – [email protected]. Press information: TV1 RP: +55 (11)3677 0369. This release contains summarized information, with no intention of being complete and must not be considered by shareholders or potential investors as an investment recommendation. Information on Localiza, its activities, its economic and financial situation and the inherent risks associated with its business, as well its financial statements, can be obtained from Localiza’s website (www.localiza.com/ri).
22 – 4Q18 Results Conference Call