4q'18 earnings release - lg.com 4q_earning release.pdf · all information regarding management...
TRANSCRIPT

4Q'18 Earnings Release
LG Electronics
January 31, 2019

All information regarding management performance and financial results of LG Electronics (the “Company”) during the 4th quarter of 2018
as contained herein has been prepared on a consolidated basis in accordance with International Financial Reporting Standards (“IFRS”).
The information regarding results of 4th quarter of 2018 has been prepared in advance, prior to being audited by outside auditors,
solely for the convenience of investors of the Company, and is subject to change in the process of final audit by external auditors.
The information contained herein includes forward-looking statements in respect to future plans, prospects, and performances of the Company
as well as the Company’s projected sales plan for year of 2019.
These forward-looking statements also refer to the Company’s performance on consolidated base, as indicated.
The aforementioned forward-looking statements are influenced by changes in the management environment and relative events, and by their nature,
these statements refer to uncertain circumstances. Consequently, due to these uncertainties, the Company’s actual future results may differ
materially from those expressed or implied by such statements.
Please note that as the forward-looking statements contained herein are based on the current market situation and the Company’s management
direction, they are subject to change according to the changes in future market environment and business strategy.
The information contained herein should not be utilized for any legal purposes in regards to investors’ investment results. The Company hereby
expressly disclaims any and all liability for any loss or damage resulting from the investors’ reliance on the information contained herein.

Table of Contents
Consolidated Earnings and OutlookⅠ
Performance and Outlook by DivisionⅡ

Ⅰ Consolidated Earnings and Outlook

1
*1) LG Innotek is included, and from 3Q'18 ZKW which was acquired in August is included
*2) From 1Q'18, Energy Management Solution, Energy Storage System has been restated to ‘H&A division’
from ‘Others’ and ID division has been restated to ‘B2B division’ from ‘HE division’
*3) From 3Q'18, ZKW which was acquired in August is included
*4) From 1Q'18, B2B division has been newly established. ID(Information Display) business has been restated
to B2B from ‘HE division’ and solar panel business
has been restated to B2B from ‘Others’
Consolidated Earnings and Outlook Sales / Profits
Sales / Profits
(Unit : KRW tn)
Performance by Division
(Unit : KRW bn)
Operating
Income
(%)
3Q’18 QoQ 4Q’18 YoY 4Q’17
Sales 15,427.0 2.2% 15,772.3 -7.0% 16,963.6
Consolidated *1) O.I 748.8 -673.1 75.7 -291.1 366.8
(%) 4.9% -4.4%p 0.5% -1.7%p 2.2%
H&A*2)
Home Appliance
& Air Solution
Sales 4,852.1 -10.8% 4,327.9 3.3% 4,189.5
O.I 409.7 -304.9 104.8 28.2 76.6
(%) 8.4% -6.0%p 2.4% 0.6%p 1.8%
HE *2)
Home Entertainment
Sales 3,711.1 22.8% 4,557.2 -6.4% 4,868.0
O.I 325.1 -116.0 209.1 -127.2 336.3
(%) 8.8% -4.2%p 4.6% -2.3%p 6.9%
MC
Mobile Communications
Sales 2,041.0 -16.3% 1,708.2 -41.6% 2,923.0
O.I -146.3 -176.0 -322.3 -106.0 -216.3
(%) -7.2% -11.7%p -18.9% -11.5%p -7.4%
VC *3)
Vehicle Components
Sales 1,176.0 18.9% 1,398.8 71.0% 818.0
O.I -42.9 15.5 -27.4 14.6 -42.0
(%) -3.6% 1.6%p -2.0% 3.1%p -5.1%
B2B *4)
Business to Business
Sales 576.7 3.7% 597.8 -10.6% 668.7
O.I 35.1 -20.2 14.9 -32.9 47.8
(%) 6.1% -3.6%p 2.5% -4.6%p 7.1%
Sales
4.9%
0.5%2.2%
15.43 15.77
16.96 QoQ
2.2% ↑
YoY
7.0%↓
3Q’18 4Q’18 4Q’17

2
Income Trend / Cash FlowConsolidated Earnings and Outlook
Cash Flow
(Unit : KRW bn)
Income Trend
(Unit : KRW bn)
3Q'18 4Q'18
Cash at the beginning of period 4,659.6 4,538.3
• Cash flow from operating activities 1,269.2 1,356.6
Net income/loss 497.1 -80.7
Depreciation 506.3 549.5
Gain/Loss on equity method investment -5.2 -51.3
• Cash flow from investing activities *1) -1,690.2 -994.4
Increase in tangible assets -788.6 -785.7
Increase in intangible assets -152.5 -208.0
• Cash flow from financing activities 356.6 -644.7
Dividend paid, etc - -17.1
Increase/Decrease in debt 356.6 -627.6
• Effects of exchange rate changes
on cash and cash equivalents-56.9 14.6
Net changes in cash -121.3 -267.9
Cash at the end of period 4,538.3 4,270.4
EBITDA 625.2 834.51,255.1
3Q'18 QoQ 4Q'18 YoY 4Q'17
Operating
Income748.8 -673.1 75.7 -291.1 366.8
Net financial
income/expense -91.1 +16.9 -74.2 +48.8 -123.0
Gain/Loss on
equity method 5.2 +46.1 51.3 +37.6 13.7
Other non-operating
income/expense -47.4 -129.7 -177.1 -127.9 -49.2
Income
Before Tax615.5 -739.8 -124.3 -332.6 208.3
Corporate
income tax 118.4 -162.0 -43.6 -69.1 25.5
Net
Income497.1 -577.8 -80.7 -263.5 182.8
Net C/F -477.9 376.8*1) The amount paid for acquisition of ZKW is included in 3Q’18

3
Leverage Ratio / Financial PositionConsolidated Earnings and Outlook
Financial PositionLeverage Ratio
(Unit: %) (Unit : KRW tn)
Liabilities
to Equity
Debt to
Equity
Net Debt to
Equity
4Q'17 3Q'18 4Q'18
Assets 41.22 45.07 44.33
Current Assets 19.20 20.70 19.36
Cash 3.35 4.54 4.27
Inventory 5.91 6.56 6.02
Non-Current Assets 22.02 24.37 24.97
Liabilities 26.55 28.62 28.02
Current Liabilities 17.54 17.83 17.13
Non-Current Liabilities 9.01 10.79 10.89
Equity 14.67 16.45 16.31
4Q’184Q’17 3Q’18
181
174 172
64
70
67
42 4241
Debt 9.45 11.51 10.90
Net Debt 6.10 6.97 6.63

4
`19 OutlookConsolidated Earnings and Outlook
Business
Environment
(Y2019)
Sales & Profits
Outlook
(Y2019,1Q’19)
Maintain growth in sales and generate solid profits in 2019
Anticipate consolidated sales to increase and operating profit to significantly improve QoQ
Global economy continues to slow down
Intensifying competition among industries to take initiative
Key
Strategies
Profitable growth driven strategy to strengthen market dominance
Allocate resources into strategic and new businesses to accelerate future growth

Ⅱ Performance and Outlook by Division
4.194.92
5.264.85
4.33
5
H&A (Home Appliance and Air Solution)
4Q’18 Performance
Y2019 Outlook
Sales :
Profitability :
LGE :
Market :
TWINWashInstaView DID LG Styler
*1) From 1Q'18, Energy Management Solution, Energy Storage System has been restated
to ‘H&A division’ from ‘Others’
Performance and Outlook by Division
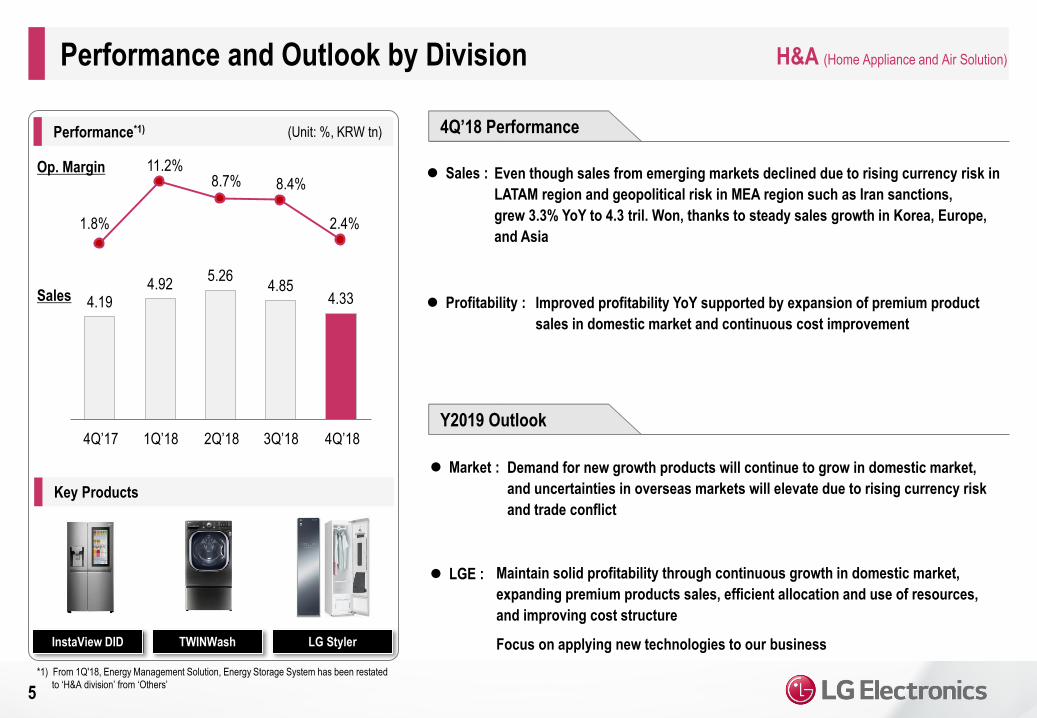
Performance*1) (Unit: %, KRW tn)
Key Products
Op. Margin
Sales
Even though sales from emerging markets declined due to rising currency risk in
LATAM region and geopolitical risk in MEA region such as Iran sanctions,
grew 3.3% YoY to 4.3 tril. Won, thanks to steady sales growth in Korea, Europe,
and Asia
Improved profitability YoY supported by expansion of premium product
sales in domestic market and continuous cost improvement
Demand for new growth products will continue to grow in domestic market,
and uncertainties in overseas markets will elevate due to rising currency risk
and trade conflict
Maintain solid profitability through continuous growth in domestic market,
expanding premium products sales, efficient allocation and use of resources,
and improving cost structure
Focus on applying new technologies to our business
4Q’184Q’17 1Q’18 2Q’18 3Q’18
1.8%
11.2%8.7% 8.4%
2.4%

6
HE (Home Entertainment)
LG Super UHD TV (Nano Cell TV)LG SIGNATURE OLED TV W
Profitability :
LGE :
Market :
Sales :
Performance and Outlook by Division
(Unit: %, KRW tn)
Key Products
Op. Margin
SalesDown QoQ due to increasing marketing expenses from intensifying
competition during peak season, and down YoY from sales decline and
currency headwinds from emerging markets
Grew QoQ led by year-end peak season in developed markets such as
North America and Europe, but declined YoY due to economic slowdown in
LATAM and MEA regions
*1) From 1Q'18, ID division has been restated to ‘B2B division’ from ‘HE division’
Performance*1) 4Q’18 Performance
Y2019 Outlook
6.9%
14.0%10.6%
8.8%
4.6%
4.87
4.123.82 3.71
4.56
4Q’184Q’17 1Q’18 2Q’18 3Q’18
Global TV demand will be flat YoY, but growth trend will continue in premium
TV market with OLED TVs and Ultra HD TVs
Constantly expand premium TV portion through strengthening sales of OLED TVs
and large screen Ultra HD TVs, and create virtuous cycle of simultaneous growth
of revenue and profits

7
MC (Mobile Communications)
Despite the launch of new competitive premium product, sales came down
16% QoQ from sluggish smartphone market and intensifying competition in
mass-tier products
Market :
Performance and Outlook by Division
Performance (Unit: %, KRW tn)
Key Products
Op. Margin
Sales
Profitability :
Sales :
Focus on operator-driven market such as North America and Korea to secure
stable sales, and preoccupy 5G and new form factor device markets to capture
additional sales opportunities
Expand sales and improve cost efficiency to enhance profit structure,
and secure mid to long-term growth momentum and achieve meaningful
improvement in profitability
G7ThinQV40ThinQ Q9
LGE :
4Q’18 Performance
Y2019 Outlook
2.92
2.16 2.07 2.041.71
Δ7.4% Δ6.3%Δ8.9%
Δ7.2%
Δ18.9%
4Q’184Q’17 1Q’18 2Q’18 3Q’18
Even though business structure was meaningfully improved, impact on
profitability was offset by smartphone sales decline
Loss widened as marketing expense increased in order to support launch
of new product during peak season and reduce channel inventories
5G network is expected to be commercialized in major markets and devices with
new form factors will be launched
Smartphone demand will continue to fall and price competition will intensify
8
VC (Vehicle Components)
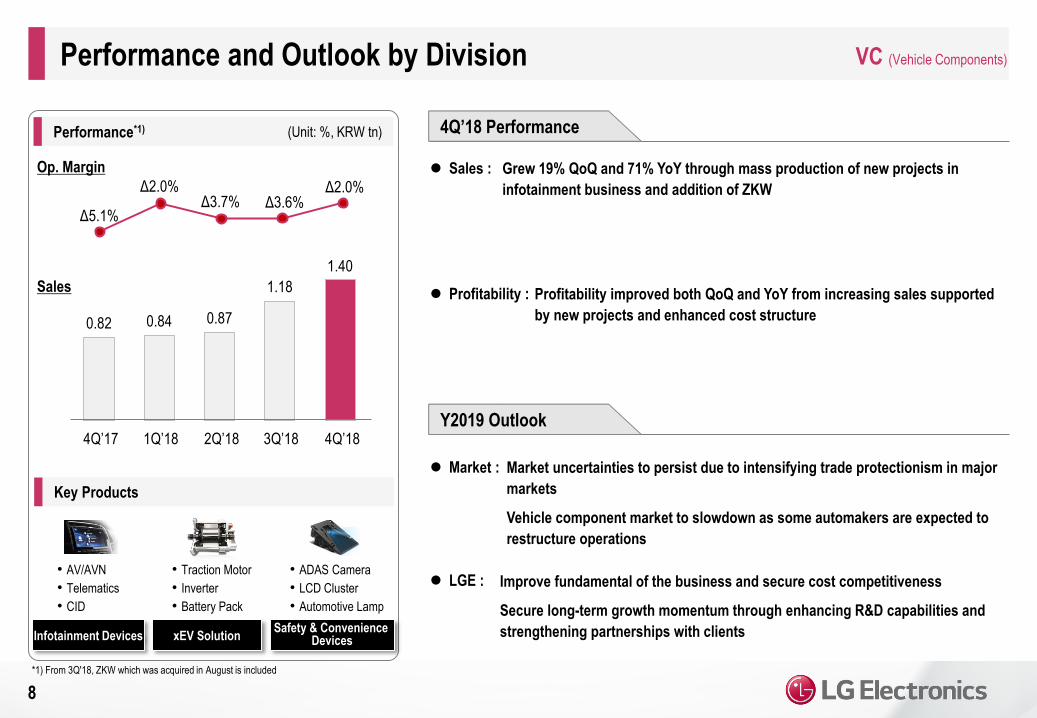
• AV/AVN
• Telematics
• CID
Performance and Outlook by Division
(Unit: %, KRW tn)
Key Products
Op. Margin
Sales
LGE :
Market :
Profitability :
Sales :
Profitability improved both QoQ and YoY from increasing sales supported
by new projects and enhanced cost structure
• Traction Motor
• Inverter
• Battery Pack
• ADAS Camera
• LCD Cluster
• Automotive Lamp
Improve fundamental of the business and secure cost competitiveness
Secure long-term growth momentum through enhancing R&D capabilities and
strengthening partnerships with clients
Market uncertainties to persist due to intensifying trade protectionism in major
markets
Vehicle component market to slowdown as some automakers are expected to
restructure operations
Grew 19% QoQ and 71% YoY through mass production of new projects in
infotainment business and addition of ZKW
Infotainment Devices xEV SolutionSafety & Convenience
Devices
*1) From 3Q'18, ZKW which was acquired in August is included
Performance*1) 4Q’18 Performance
Y2019 Outlook
0.82 0.84 0.87
1.18
1.40
Δ5.1%
Δ2.0%Δ3.7% Δ3.6%
Δ2.0%
4Q’184Q’17 1Q’18 2Q’18 3Q’18

*1) From 1Q'18, B2B division has been newly established. ID(Information Display) business
has been restated to B2B from ‘HE division’ and solar panel business has been restated
to B2B from ‘Others’ 9
B2B (Business to Business)Performance and Outlook by Division
Performance*1) (Unit: %, KRW tn)
Key Products
Op. Margin
Sales
LGE :
Market :
Profitability :
Sales :
For Information Display business, plan to enhance sales capabilities, target
new growing areas to expand sales, and improve profitability
For Solar business, expand sales through market diversification and stable
operation of US solar factory
Information Display market is expected to grow mainly in premium products
Global demand for solar products will recover relative to last year but
risk of supply-demand imbalance exists
Declined YoY due to weak performance in Information Display business in MEA
and LATAM regions, and sales decline in solar product in U.S market, but
grew slightly QoQ
Solar PanelInformation Display
4Q’18 Performance
Y2019 Outlook
7.1%
12.3%
6.6% 6.1%
2.5%
0.67 0.640.59 0.58 0.60
4Q’184Q’17 1Q’18 2Q’18 3Q’18
Though cost improvement trend continued, profit came down due to
investment for global business expansion, solar safeguard duty, and
declining solar panel prices

http://www.lg.com/global

Appendix
*1) Since the information regarding results of 4Q'18 has been prepared in advance, it is subject to change in the process of final audit by external auditors
Summarized Financial Statements (Consolidated)
Income Statement
10
(Unit: KRW bn, %)
2017 2018
1Q 2Q 3Q 4Q Total 1Q 2Q 3Q 4Q Total
Sales 14,657.2 100.0% 14,551.4 100.0% 15,224.1 100.0% 16,963.6 100.0% 61,396.3 100.0% 15,123.0 100.0% 15,019.4 100.0% 15,427.0 100.0% 15,772.3 100.0% 61,341.7 100.0%
Cost of goods sold 10,963.0 74.8% 10,830.0 74.4% 11,619.9 76.3% 13,324.7 78.5% 46,737.6 76.1% 11,313.4 74.8% 11,101.5 73.9% 11,560.7 74.9% 12,285.1 77.9% 46,260.7 75.4%
Gross profit 3,694.2 25.2% 3,721.4 25.6% 3,604.2 23.7% 3,638.9 21.5% 14,658.7 23.9% 3,809.6 25.2% 3,917.9 26.1% 3,866.3 25.1% 3,487.2 22.1% 15,081.0 24.6%
Selling & admin expense 2,772.7 18.9% 3,057.3 21.0% 3,088.1 20.3% 3,272.1 19.3% 12,190.2 19.9% 2,701.8 17.9% 3,146.9 21.0% 3,117.5 20.2% 3,411.5 21.6% 12,377.7 20.2%
Operating income (Loss) 921.5 6.3% 664.1 4.6% 516.1 3.4% 366.8 2.2% 2,468.5 4.0% 1,107.8 7.3% 771.0 5.1% 748.8 4.9% 75.7 0.5% 2,703.3 4.4%
Financial income (Expense) -109.2 -0.7% -53.1 -0.4% -62.1 -0.4% -123.0 -0.7% -347.4 -0.6% -80.5 -0.5% -63.4 -0.4% -91.1 -0.6% -74.2 -0.5% -309.2 -0.5%
Gains (loss) on
equity method investment230.1 1.6% 258.1 1.8% 165.6 1.1% 13.7 0.1% 667.5 1.1% -27.9 -0.2% -105.8 -0.7% 5.2 0.0% 51.3 0.3% -77.2 -0.1%
Other non operating
income (Loss)49.5 0.3% -126.9 -0.9% -103.9 -0.7% -49.2 -0.3% -230.5 -0.4% -30.4 -0.2% -53.4 -0.4% -47.4 -0.3% -177.1 -1.1% -308.3 -0.5%
Net income before tax 1,091.9 7.4% 742.2 5.1% 515.7 3.4% 208.3 1.2% 2,558.1 4.2% 969.0 6.4% 548.4 3.7% 615.5 4.0% -124.3 -0.8% 2,008.6 3.3%
Corporate Income Tax 256.2 1.7% 227.3 1.6% 179.6 1.2% 25.5 0.2% 688.6 1.1% 239.1 1.6% 221.9 1.5% 118.4 0.8% -43.6 -0.3% 535.8 0.9%
Net Income 835.7 5.7% 514.9 3.5% 336.1 2.2% 182.8 1.1% 1,869.5 3.0% 729.9 4.8% 326.5 2.2% 497.1 3.2% -80.7 -0.5% 1,472.8 2.4%
Controlled shares 795.3 497.5 318.1 114.9 1,725.8 716.7 283.3 410.4 -170.3 1,240.1
Non-controlled shares 40.4 17.4 18.0 67.9 143.7 13.2 43.2 86.7 89.6 232.7

Appendix
*1) Since the information regarding results of 4Q'18 has been prepared in advance, it is subject to change in the process of final audit by external auditors
Summarized Financial Statements (Consolidated)
Statements of Financial Position
11
(Unit: KRW bn)
2017 2018
1Q 2Q 3Q 4Q 1Q 2Q 3Q 4Q
Assets 38,124.5 39,342.4 41,127.2 41,221.0 41,222.0 42,924.8 45,068.3 44,328.4
Current Assets 17,474.9 18,275.2 19,597.9 19,195.0 19,072.9 20,540.2 20,695.2 19,362.9
Cash and cash equivalents 3,031.9 3,604.4 3,486.5 3,350.6 3,753.1 4,659.6 4,538.3 4,270.4
Accounts receivable 7,360.1 7,344.6 7,737.6 8,178.2 7,144.8 7,701.6 7,068.7 6,371.6
Inventory 5,392.0 5,620.2 6,358.0 5,908.4 5,872.7 5,975.5 6,561.6 6,021.4
Others 1,690.9 1,706.0 2,015.8 1,757.8 2,302.3 2,203.5 2,526.6 2,699.5
Non-current Assets 20,649.6 21,067.2 21,529.3 22,026.0 22,149.1 22,384.6 24,373.1 24,965.5
Investment 5,175.0 5,503.8 5,695.8 5,620.3 5,571.0 5,465.4 5,487.7 5,537.6
PP&E 11,086.9 11,171.4 11,385.1 11,800.8 12,000.1 12,337.4 13,162.8 13,334.0
Intangible assets 1,610.4 1,703.6 1,778.0 1,854.6 1,920.7 1,997.6 2,925.7 3,001.1
Others 2,777.3 2,688.4 2,670.4 2,750.3 2,657.3 2,584.2 2,796.9 3,092.8
Liabilities 24,432.9 24,934.3 26,202.3 26,547.3 25,766.0 27,165.4 28,622.3 28,021.5
Accounts payable 7,613.2 7,116.9 8,127.2 8,137.5 7,243.0 7,533.6 7,926.2 7,216.7
Debt 8,629.2 8,956.5 9,163.7 9,450.5 9,622.2 10,690.6 11,503.9 10,901.2
Others 8,190.5 8,860.9 8,911.4 8,959.3 8,900.8 8,941.2 9,192.2 9,903.6
Equity 13,691.6 14,408.1 14,924.9 14,673.7 15,456.0 15,759.4 16,446.0 16,306.9

Appendix
*2) From 1Q'18, Energy Management Solution, Energy Storage System has been restated to ‘H&A division’ from ‘Others’ and ID division has been restated to ‘B2B division’ from ‘HE division’
*1) Since the information regarding results of 4Q'18 has been prepared in advance, it is subject to change in the process of final audit by external auditors
Sales / Profits by Division (Consolidated)
(Unit: KRW bn)
12*4) From 3Q'18, ZKW is included in VC
1Q'17 2Q'17 3Q'17 4Q'17 '17 Total 1Q'18 2Q'18 3Q'18 4Q'18 '18 TotalQoQ YoY
H&A Sales 4,504.5 5,040.3 4,780.7 4,189.5 18,515.0 4,923.9 5,258.1 4,852.1 4,327.9 -11% 3% 19,362.0
(Home Appliance & Air Solution) Op. Income 511.4 449.4 411.4 76.6 1,448.8 553.1 457.2 409.7 104.8 1,524.8
(%) 11.4% 8.9% 8.6% 1.8% 7.8% 11.2% 8.7% 8.4% 2.4% 7.9%
HE Sales 3,835.5 3,670.4 4,059.2 4,868.0 16,433.1 4,117.8 3,822.2 3,711.1 4,557.2 23% -6% 16,208.3
(Home Entertainment) Op. Income 327.0 282.4 390.8 336.3 1,336.5 577.3 407.0 325.1 209.1 1,518.5
(%) 8.5% 7.7% 9.6% 6.9% 8.1% 14.0% 10.6% 8.8% 4.6% 9.4%
MC Sales 2,986.4 2,564.7 2,684.2 2,923.0 11,158.3 2,158.5 2,072.3 2,041.0 1,708.2 -16% -42% 7,980.0
(Mobile Communications) Op. Income 0.1 -139.7 -380.9 -216.3 -736.8 -136.1 -185.4 -146.3 -322.3 -790.1
(%) 0.0% -5.4% -14.2% -7.4% -6.6% -6.3% -8.9% -7.2% -18.9% -9.9%
VC Sales 847.2 840.4 833.0 818.0 3,338.6 840.0 872.8 1,176.0 1,398.8 19% 71% 4,287.6
(Vehicle Components) Op. Income -15.5 -18.6 -30.8 -42.0 -106.9 -17.0 -32.5 -42.9 -27.4 -119.8
(%) -1.8% -2.2% -3.7% -5.1% -3.2% -2.0% -3.7% -3.6% -2.0% -2.8%
B2B Sales 519.4 531.6 642.0 668.7 2,361.7 642.7 588.5 576.7 597.8 4% -11% 2,405.7
(Business to Business) Op. Income 27.0 22.5 54.6 47.8 151.9 78.8 39.0 35.1 14.9 167.8
(%) 5.2% 4.2% 8.5% 7.1% 6.4% 12.3% 6.6% 6.1% 2.5% 7.0%
Others Sales 588.9 839.8 915.2 928.3 3,272.2 979.5 1,200.3 1,010.5 961.8 -5% 4% 4,152.1
Op. Income 6.4 46.8 40.1 28.6 121.9 43.4 85.4 51.0 -9.6 170.2
LGE Consolidated
Excluding
LG Innotek (①)
Sales 13,281.9 13,487.2 13,914.3 14,395.5 55,078.9 13,662.4 13,814.2 13,367.4 13,551.7 1% -6% 54,395.7
Op. Income 856.4 642.8 485.2 231.0 2,215.4 1,099.5 770.7 631.7 -30.5 2,471.4
(%) 6.4% 4.8% 3.5% 1.6% 4.0% 8.0% 5.6% 4.7% -0.2% 4.5%
LG Innotek (②)Sales 1,644.7 1,339.6 1,787.3 2,869.8 7,641.4 1,720.5 1,517.9 2,313.2 2,430.5 5% -15% 7,982.1
Op. Income 66.8 32.6 55.9 141.2 296.5 16.8 13.4 129.7 103.6 263.5
LGE-LG Innotek
Inter-company Transaction (③)
Sales 269.4 275.4 477.5 301.7 1,324.0 259.9 312.7 253.6 209.9 1,036.1
Op. Income 1.7 11.3 25.0 5.4 43.4 8.5 13.1 12.6 -2.6 31.6
LGE Consolidated (①+②-③)
Sales 14,657.2 14,551.4 15,224.1 16,963.6 61,396.3 15,123.0 15,019.4 15,427.0 15,772.3 2% -7% 61,341.7
Op. Income 921.5 664.1 516.1 366.8 2,468.5 1,107.8 771.0 748.8 75.7 2,703.3
(%) 6.3% 4.6% 3.4% 2.2% 4.0% 7.3% 5.1% 4.9% 0.5% 4.4%
*3) From 1Q'18, B2B division has been newly established. ID(Information Display) business has been restated to B2B from ‘HE division’ and solar panel business has been restated
to B2B from ‘Others’