4q20 earnings slides - seeking alpha
TRANSCRIPT

BusinessUseOnly|1
Alcon 4Q20 Earnings PresentationFebruary 24, 2021
2
Legal DisclaimersForward-Looking StatementsThis document contains, and our officers and representatives may from time to time make, certain “forward-looking statements” within the meaning of the safe harbor provisions of the US Private Securities Litigation Reform Act of 1995. Forward-looking statements can be identified by words such as “anticipate,” “intend,” “commitment,” “look forward,” “maintain,” “plan,” “goal,” “seek,” “target,” “assume,” “believe,” “project,” “estimate,” “expect,” “strategy,” “future,” “likely,” “may,” “should,” “will” and similar references to future periods. Examples of forward-looking statements include, among others, statements Alcon makes regarding its liquidity, revenue, gross margin, effective tax rate, foreign currency exchange movements, earnings per share, its plans and decisions relating to various capital expenditures, capital allocation priorities and other discretionary items, market growth assumptions, and generally, its expectations concerning its future performance and the effects of the COVID-19 pandemic on its businesses.Forward-looking statements are neither historical facts nor assurances of future performance. Instead, they are based only on Alcon’s current beliefs, expectations and assumptions regarding the future of its business, future plans and strategies, and other future conditions. Because forward-looking statements relate to the future, they are subject to inherent uncertainties and risks that are difficult to predict. Such forward-looking statements are subject to various risks and uncertainties facing Alcon, including: the effect of the COVID-19 pandemic as well as other viral or disease outbreaks; the commercial success of its products and its ability to maintain and strengthen its position in its markets; the success of its research and development efforts, including its ability to innovate to compete effectively; its success in completing and integrating strategic acquisitions; pricing pressure from changes in third party payor coverage and reimbursement methodologies; global and regional economic, financial, legal, tax, political, and social change; data breaches or other disruptions of its information technology systems; ongoing industry consolidation; its ability to properly educate and train healthcare providers on its products; changes in inventory levels or buying patterns of its customers; the impact of a disruption in its global supply chain or important facilities; ability to service its debt obligations; its ability to comply with the US Foreign Corrupt Practices Act of 1977 and other applicable anti-corruption laws, particularly given that it has entered into a three-year Deferred Prosecution Agreement with the US Department of Justice; uncertainty and impact relating to the potential phasing out of LIBOR and transition to alternative reference rates; the need for additional financing through the issuance of debt or equity; its reliance on outsourcing key business functions; its ability to protect its intellectual property; the impact on unauthorized importation of its products from countries with lower prices to countries with higher prices; uncertainties regarding the success of Alcon’s separation and Spin-off from Novartis and the subsequent transformation program, including the expected separation and transformation costs, as well as any potential savings, incurred or realized by Alcon; the effects of litigation, including product liability lawsuits and government investigations; its ability to comply with all laws to which it may be subject; effect of product recalls or voluntary market withdrawals; the implementation of its enterprise resource planning system; its ability to attract and retain qualified personnel; the accuracy of its accounting estimates and assumptions, including pension plan obligations and the carrying value of intangible assets; the ability to obtain regulatory clearance and approval of its products as well as compliance with any post-approval obligations, including quality control of its manufacturing; legislative and regulatory reform; the ability of Alcon Pharmaceuticals Ltd. to comply with its investment tax incentive agreement with the Swiss State Secretariat for Economic Affairs in Switzerland and the Canton of Fribourg, Switzerland; its ability to manage environmental, social and governance matters to the satisfaction of its many stakeholders, some of which may have competing interests; its ability to operate as a stand-alone company; whether the transitional services Novartis has agreed to provide Alcon are sufficient; the impact of the spin-off from Novartis on Alcon’s shareholder base; the impact of being listed on two stock exchanges; the ability to declare and pay dividends; the different rights afforded to its shareholders as a Swiss corporation compared to a US corporation; and the effect of maintaining or losing its foreign private issuer status under US securities laws. Additional factors are discussed in Alcon’s filings with the United States Securities and Exchange Commission, including its Form 20-F. Should one or more of these uncertainties or risks materialize, or should underlying assumptions prove incorrect, actual results may vary materially from those anticipated. Therefore, you should not rely on any of these forward-looking statements.Forward-looking statements in this document speak only as of the date of its filing, and Alcon assumes no obligation to update forward-looking statements as a result of new information, future events or otherwise.
Intellectual propertyThis report may contain references to our proprietary intellectual property. All product names appearing in italics or ALL CAPS are trademarks owned by or licensed to Alcon Inc.
Non-IFRS measuresAlcon uses certain non-IFRS metrics when measuring performance, including when measuring current period results against prior periods, including core results, percentage changes measured in constant currencies, and free cash flow. Because of their non-standardized definitions, the non-IFRS measures (unlike IFRS measures) may not be comparable to the calculation of similar measures of other companies. These non-IFRS measures are presented solely to permit investors to more fully understand how Alcon management assesses underlying performance. These non-IFRS measures are not, and should not be viewed as, a substitute for IFRS measures.

3
Agenda
Key Topics
Financial Results
Outlook

Key Topics
5
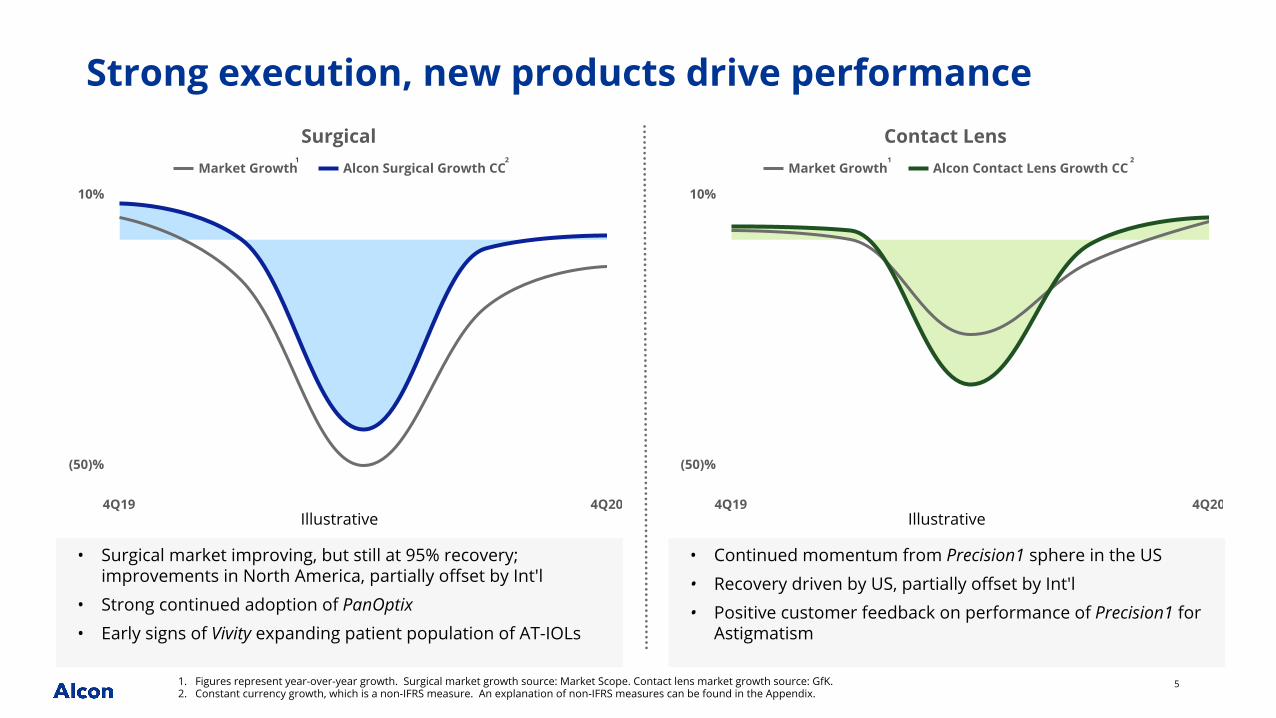
Strong execution, new products drive performanceSurgical
Market Growth Alcon Surgical Growth CC
4Q19 1Q20 2Q20 3Q20 4Q20
(50)%
(40)%
(30)%
(20)%
(10)%
—%
10%
Contact LensMarket Growth Alcon Contact Lens Growth CC
4Q19 1Q20 2Q20 3Q20 4Q20
(50)%
(40)%
(30)%
(20)%
(10)%
—%
10%
1 2 1 2
• Surgical market improving, but still at 95% recovery; improvements in North America, partially offset by Int'l
• Strong continued adoption of PanOptix
• Early signs of Vivity expanding patient population of AT-IOLs
• Continued momentum from Precision1 sphere in the US
• Recovery driven by US, partially offset by Int'l
• Positive customer feedback on performance of Precision1 for Astigmatism
1. Figures represent year-over-year growth. Surgical market growth source: Market Scope. Contact lens market growth source: GfK.2. Constant currency growth, which is a non-IFRS measure. An explanation of non-IFRS measures can be found in the Appendix.
Illustrative Illustrative
6
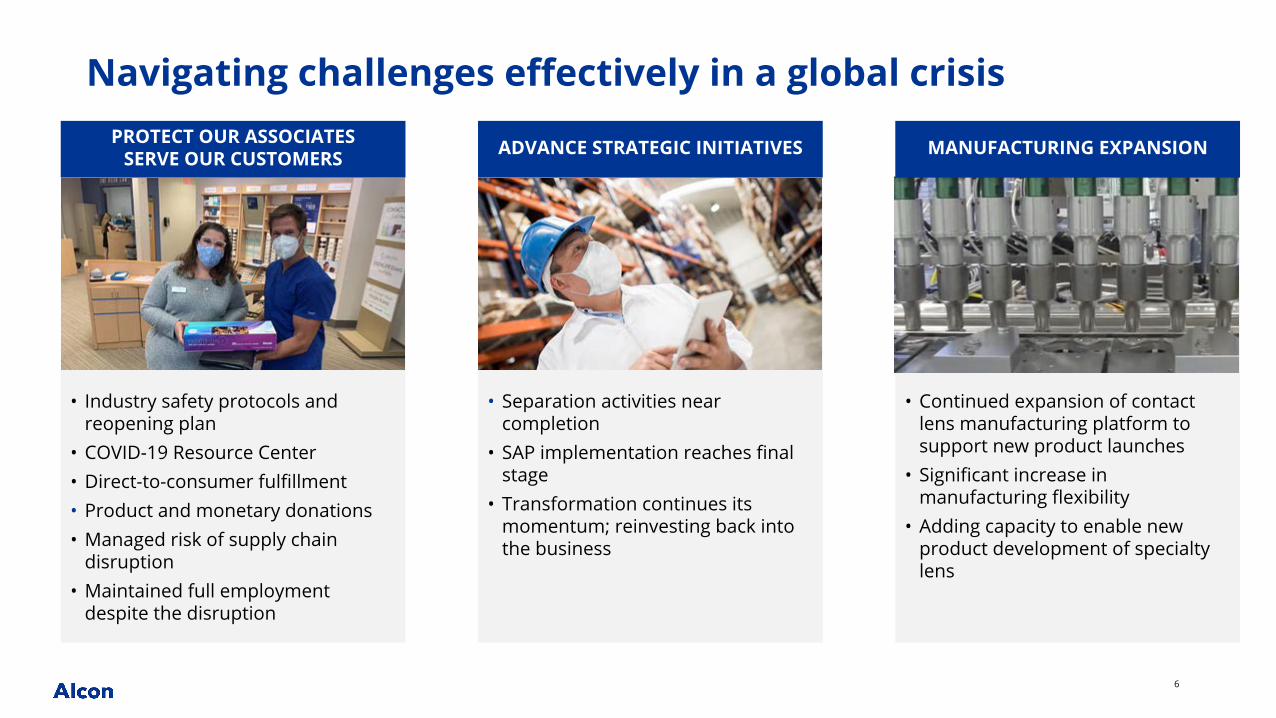
Navigating challenges effectively in a global crisisPROTECT OUR ASSOCIATES
SERVE OUR CUSTOMERS ADVANCE STRATEGIC INITIATIVES
• Separation activities near completion
• SAP implementation reaches final stage
• Transformation continues its momentum; reinvesting back into the business
• Industry safety protocols and reopening plan
• COVID-19 Resource Center• Direct-to-consumer fulfillment• Product and monetary donations• Managed risk of supply chain
disruption• Maintained full employment
despite the disruption
• Continued expansion of contact lens manufacturing platform to support new product launches
• Significant increase in manufacturing flexibility
• Adding capacity to enable new product development of specialty lens
MANUFACTURING EXPANSION
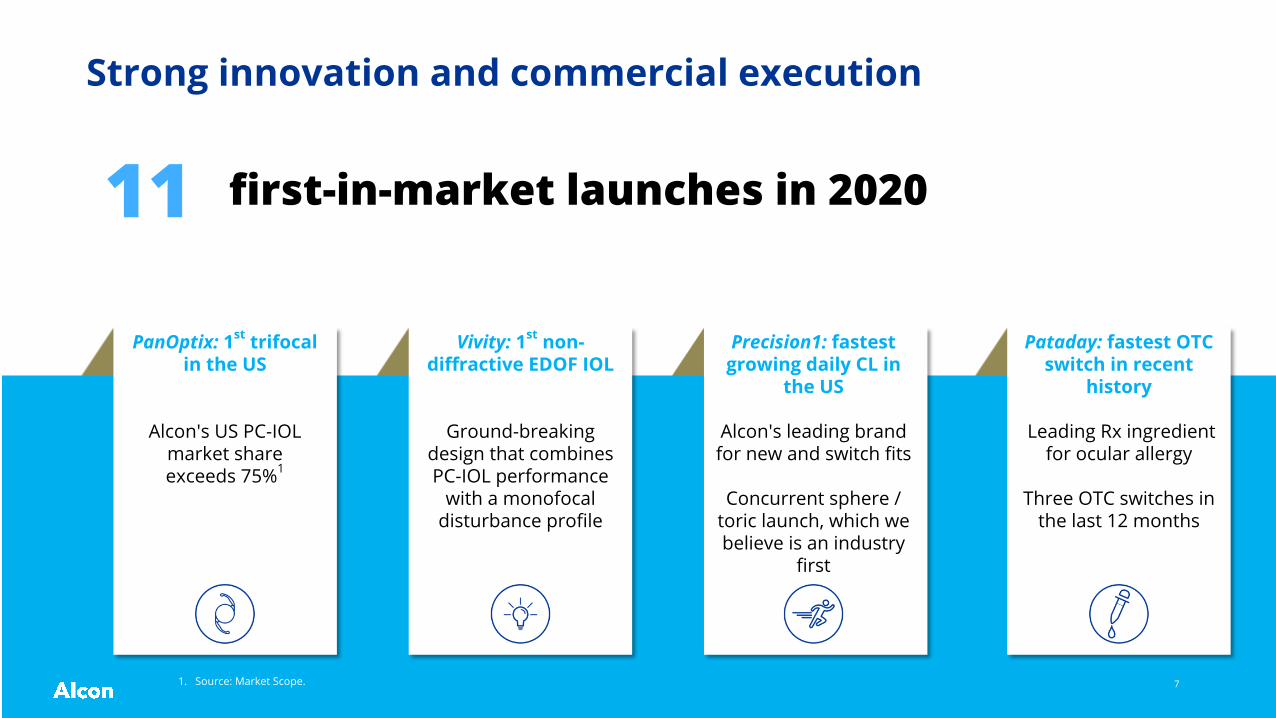
Vivity: 1st non-diffractive EDOF IOL
Ground-breaking design that combines PC-IOL performance
with a monofocal disturbance profile
Strong innovation and commercial execution
11 first-in-market launches in 2020
PanOptix: 1st trifocal in the US
Alcon's US PC-IOL market share exceeds 75%1
Precision1: fastest growing daily CL in
the US
Alcon's leading brand for new and switch fits
Concurrent sphere /toric launch, which we believe is an industry
first
Pataday: fastest OTC switch in recent
history
Leading Rx ingredient for ocular allergy
Three OTC switches in the last 12 months
7 1. Source: Market Scope.
8
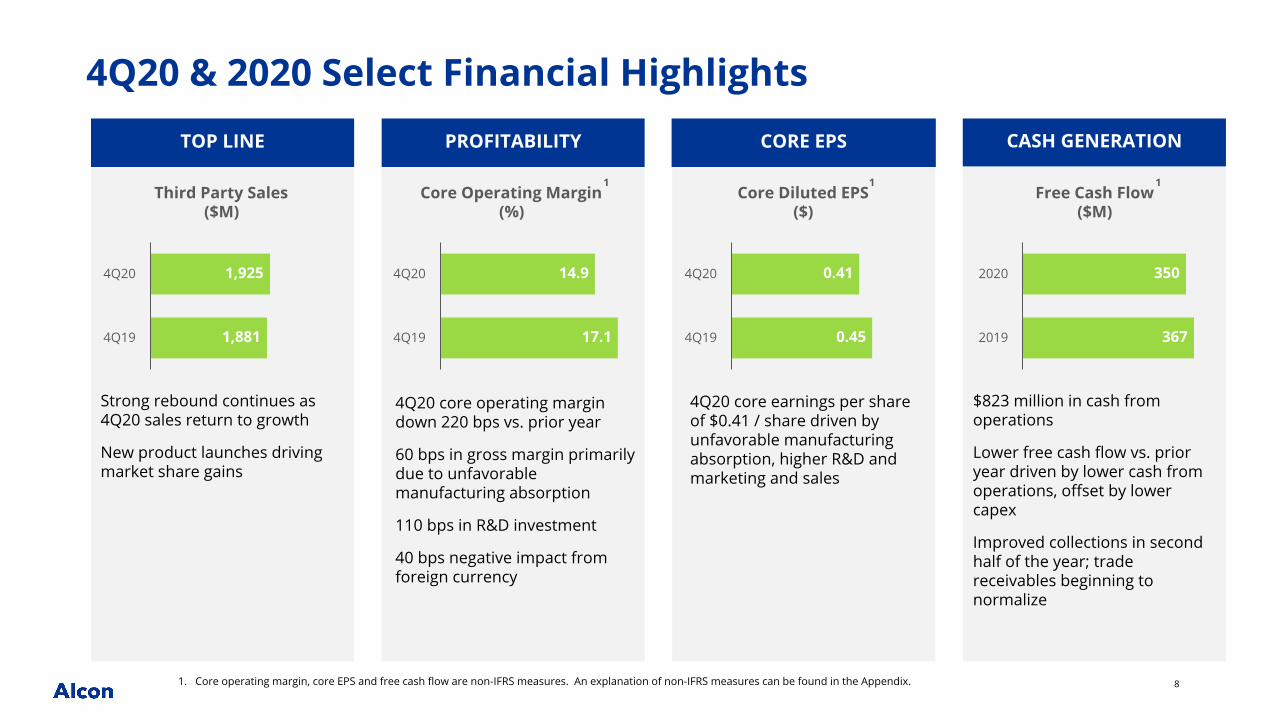
4Q20 core operating margin down 220 bps vs. prior year
60 bps in gross margin primarily due to unfavorable manufacturing absorption
110 bps in R&D investment
40 bps negative impact from foreign currency
4Q20 core earnings per share of $0.41 / share driven by unfavorable manufacturing absorption, higher R&D and marketing and sales
1. Core operating margin, core EPS and free cash flow are non-IFRS measures. An explanation of non-IFRS measures can be found in the Appendix.
4Q20 & 2020 Select Financial HighlightsTOP LINE PROFITABILITY CORE EPS CASH GENERATION
Third Party Sales($M)
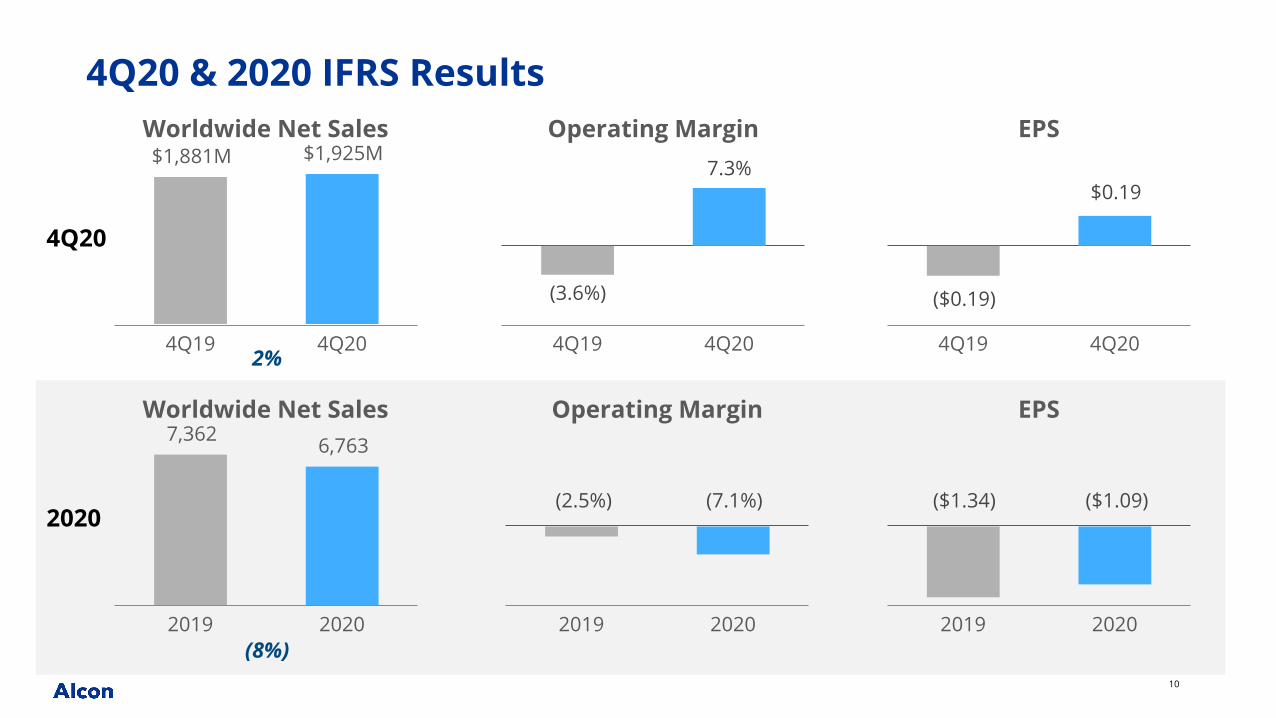
1,925
1,881
4Q20
4Q19
Core Operating Margin(%)
14.9
17.1
4Q20
4Q19
Core Diluted EPS($)
0.41
0.45
4Q20
4Q19
Free Cash Flow($M)
350
367
2020
2019
111
(1)
Strong rebound continues as 4Q20 sales return to growth
New product launches driving market share gains
$823 million in cash from operations
Lower free cash flow vs. prior year driven by lower cash from operations, offset by lower capex
Improved collections in second half of the year; trade receivables beginning to normalize

IFRS Results
10
Operating Margin
4Q19 4Q20
4Q20 & 2020 IFRS ResultsWorldwide Net Sales$1,881M $1,925M
4Q19 4Q20
EPS
4Q19 4Q20
$0.19
($0.19)
7.3%
(3.6%)
2%
Operating Margin
2019 2020
Worldwide Net Sales7,362 6,763
2019 2020
EPS
2019 2020
($1.09)(7.1%)(2.5%)
4Q20
2020($1.34)
(8%)
11
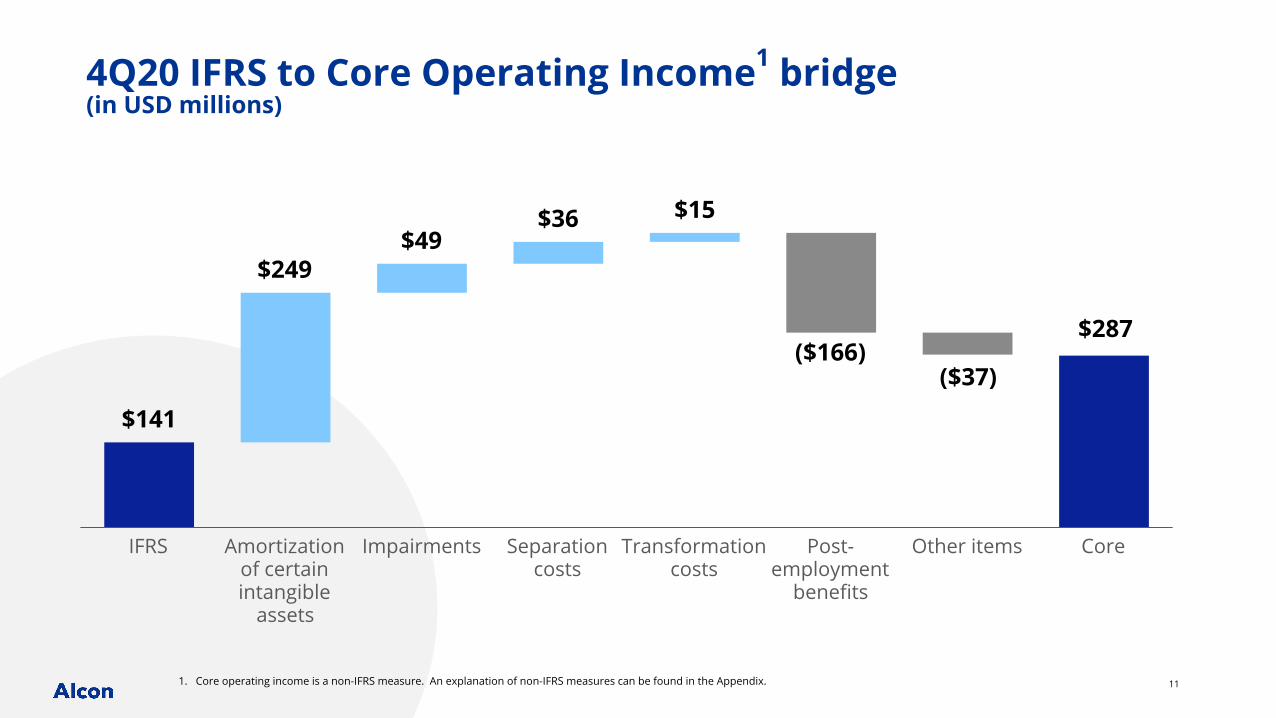
4Q20 IFRS to Core Operating Income1 bridge (in USD millions)
1. Core operating income is a non-IFRS measure. An explanation of non-IFRS measures can be found in the Appendix.
$141
$249$49
$36 $15
($166)
IFRS Amortizationof certainintangible
assets
Impairments Separationcosts
Transformationcosts
Post-employment
benefits
Other items Core
$287
($37)
12
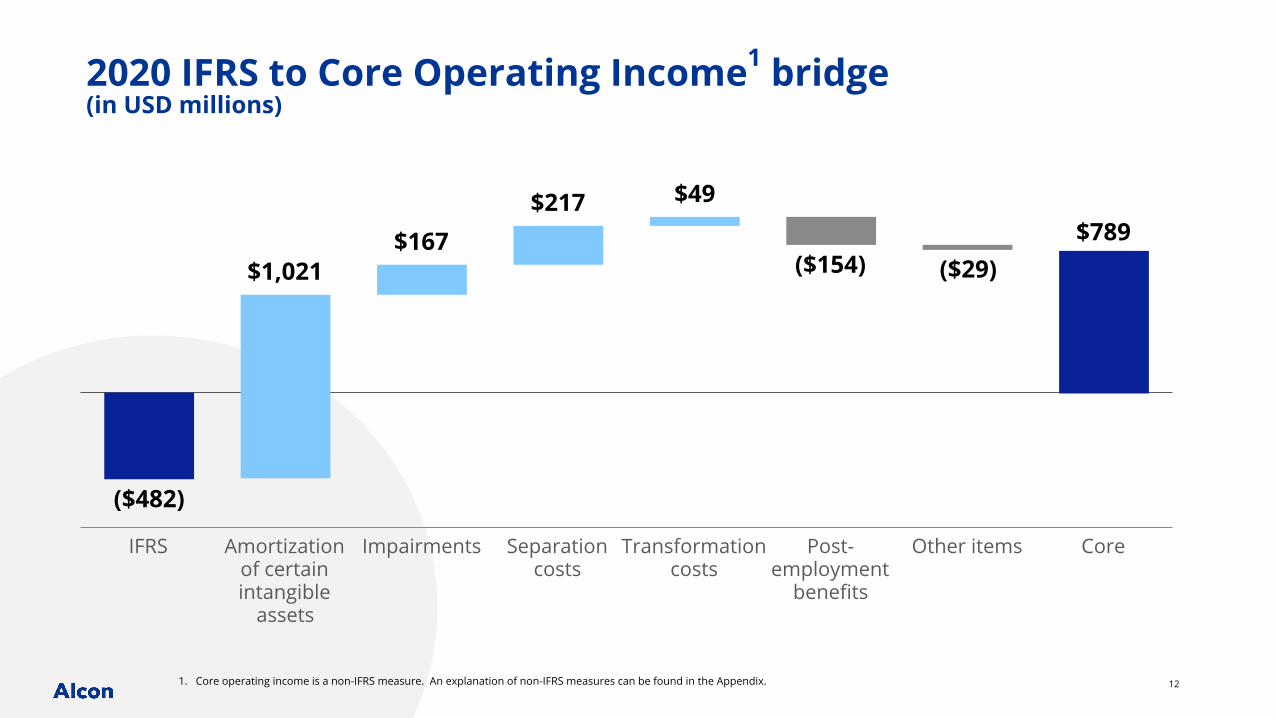
2020 IFRS to Core Operating Income1 bridge (in USD millions)
1. Core operating income is a non-IFRS measure. An explanation of non-IFRS measures can be found in the Appendix.
($482)
$1,021$167
$217 $49
($154)
IFRS Amortizationof certainintangible
assets
Impairments Separationcosts
Transformationcosts
Post-employment
benefits
Other items Core
$789($29)

CoreResults
14
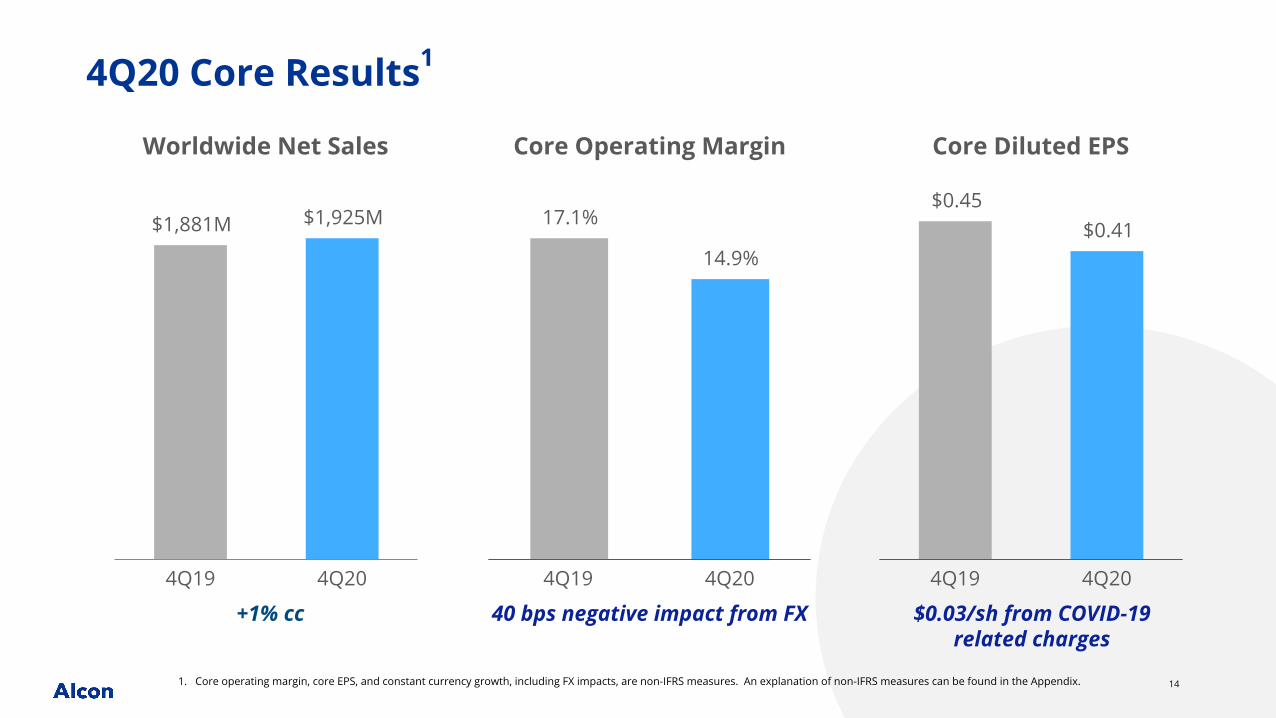
Core Operating Margin
17.1%
14.9%
4Q19 4Q20
Core Diluted EPS
$0.45$0.41
4Q19 4Q20
Worldwide Net Sales
$1,881M $1,925M
4Q19 4Q20
+1% cc
4Q20 Core Results1
1. Core operating margin, core EPS, and constant currency growth, including FX impacts, are non-IFRS measures. An explanation of non-IFRS measures can be found in the Appendix.
40 bps negative impact from FX $0.03/sh from COVID-19 related charges
15
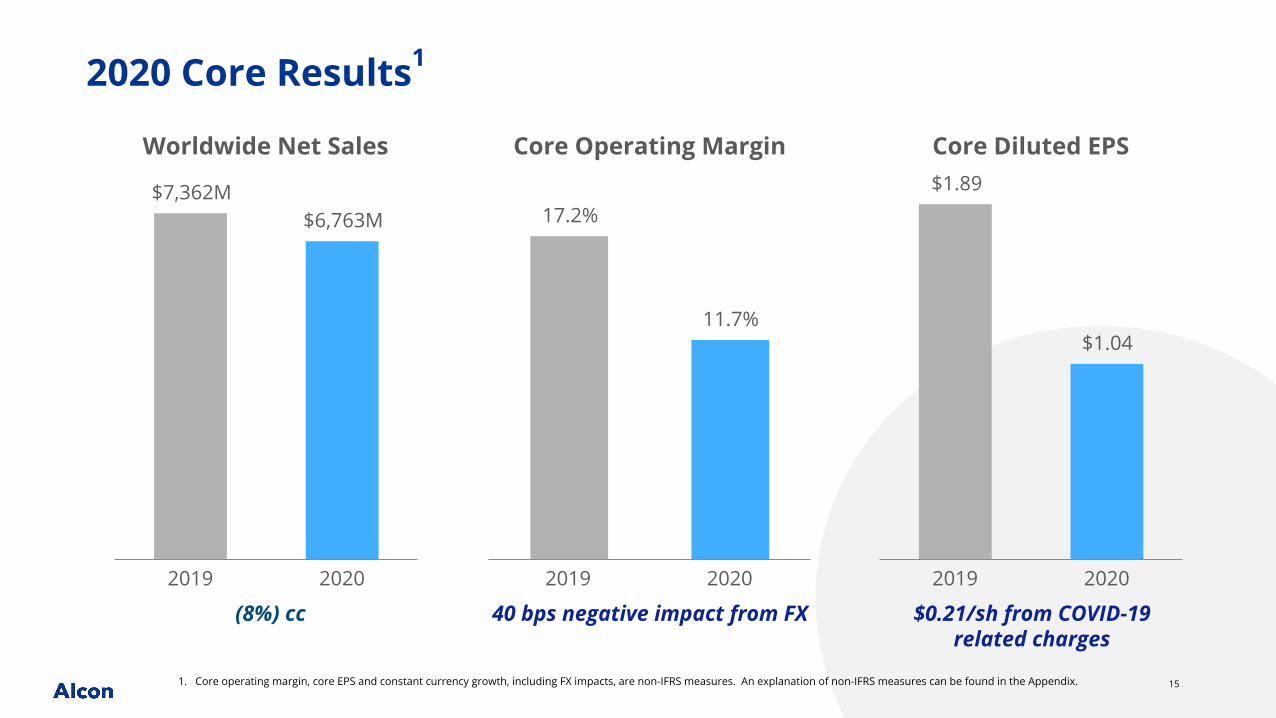
Core Operating Margin
17.2%
11.7%
2019 2020
Core Diluted EPS$1.89
$1.04
2019 2020
Worldwide Net Sales
$7,362M$6,763M
2019 2020
(8%) cc
2020 Core Results1
1. Core operating margin, core EPS and constant currency growth, including FX impacts, are non-IFRS measures. An explanation of non-IFRS measures can be found in the Appendix.
40 bps negative impact from FX $0.21/sh from COVID-19 related charges
16
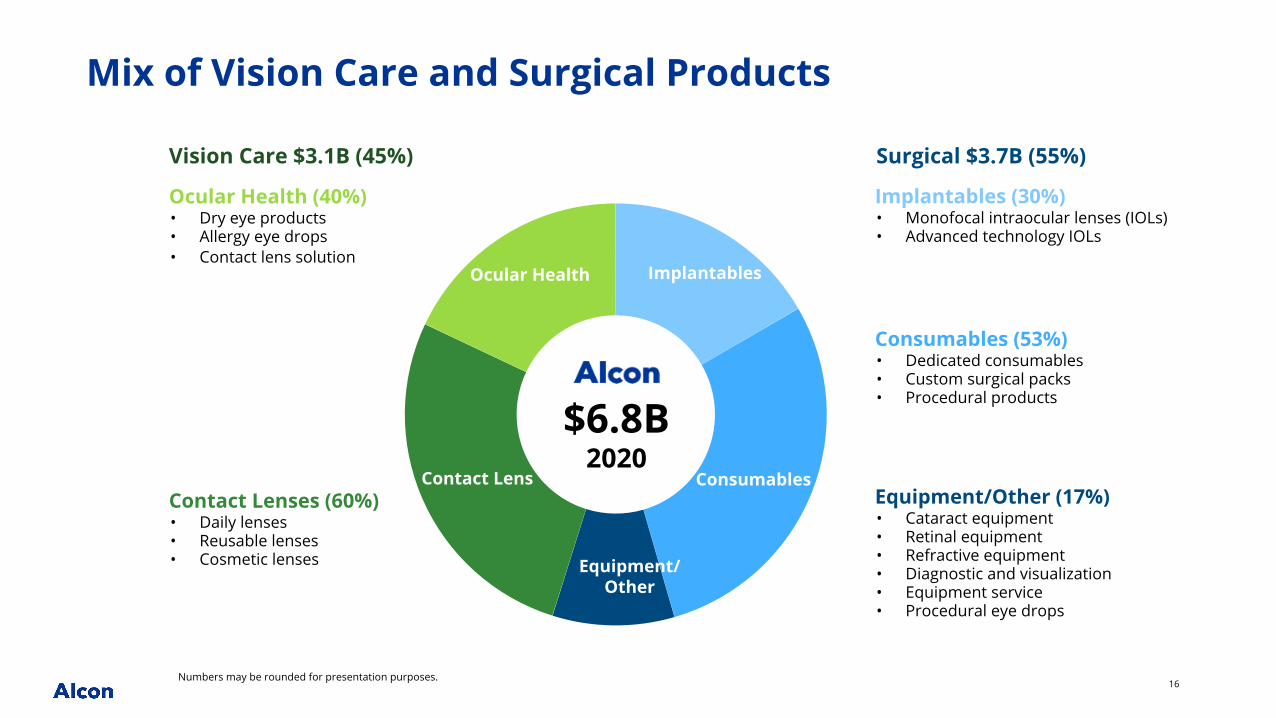
Diversified portfolio across businesses and geographies
Surgical $3.7B (55%)
Mix of Vision Care and Surgical Products
Implantables
Consumables
Equipment/Others
Contact Lens
Ocular Health
Equipment/Other
Implantables (30%)• Monofocal intraocular lenses (IOLs)• Advanced technology IOLs
Consumables (53%)• Dedicated consumables• Custom surgical packs• Procedural products
Equipment/Other (17%)• Cataract equipment • Retinal equipment• Refractive equipment• Diagnostic and visualization• Equipment service• Procedural eye drops
Contact Lenses (60%)• Daily lenses• Reusable lenses • Cosmetic lenses
Ocular Health (40%)• Dry eye products• Allergy eye drops• Contact lens solution
Numbers may be rounded for presentation purposes.
$6.8B2020
Vision Care $3.1B (45%)
17
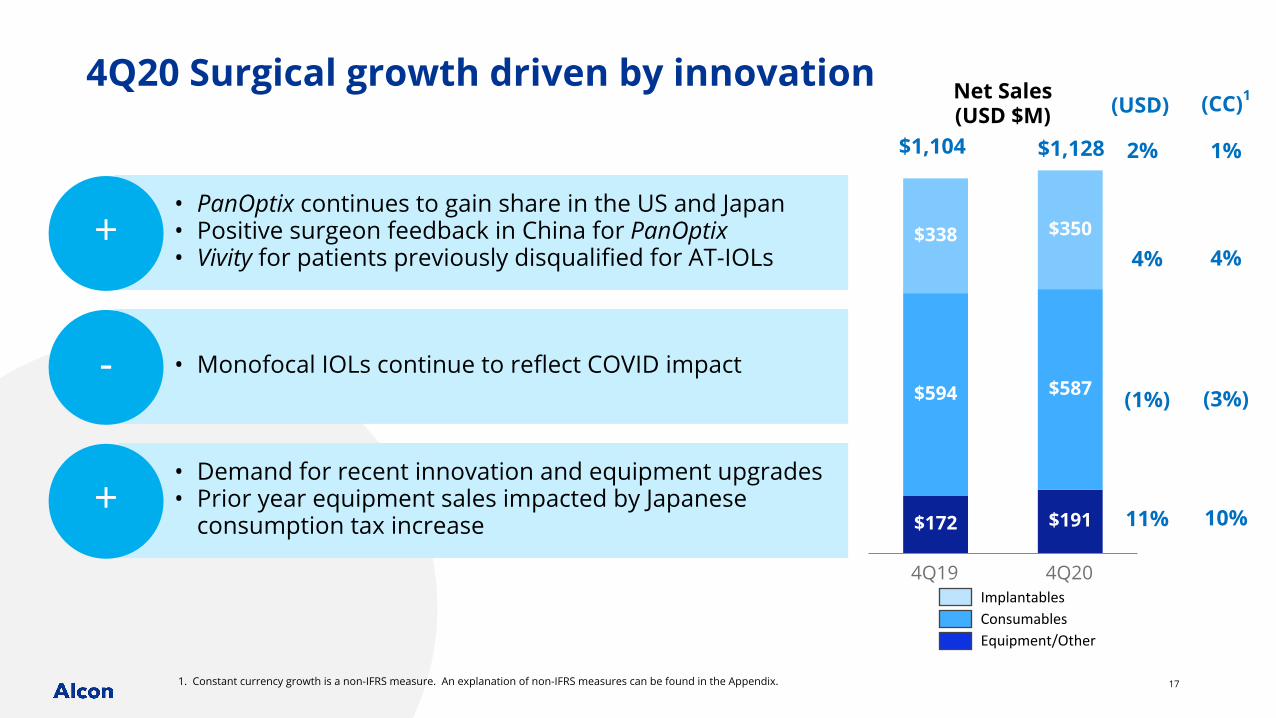
• Monofocal IOLs continue to reflect COVID impact
Implantables
4Q20 Surgical growth driven by innovation
+
(3%)
(CC)1
4%
1%
(1%)
(USD)
4%
1. Constant currency growth is a non-IFRS measure. An explanation of non-IFRS measures can be found in the Appendix.
10%
Net Sales (USD $M)
$172 $191
$594 $587
$338 $350
4Q19 4Q20
11%
2%$1,104 $1,128
-
ConsumablesEquipment/Other
• PanOptix continues to gain share in the US and Japan• Positive surgeon feedback in China for PanOptix• Vivity for patients previously disqualified for AT-IOLs
+• Demand for recent innovation and equipment upgrades• Prior year equipment sales impacted by Japanese
consumption tax increase
18
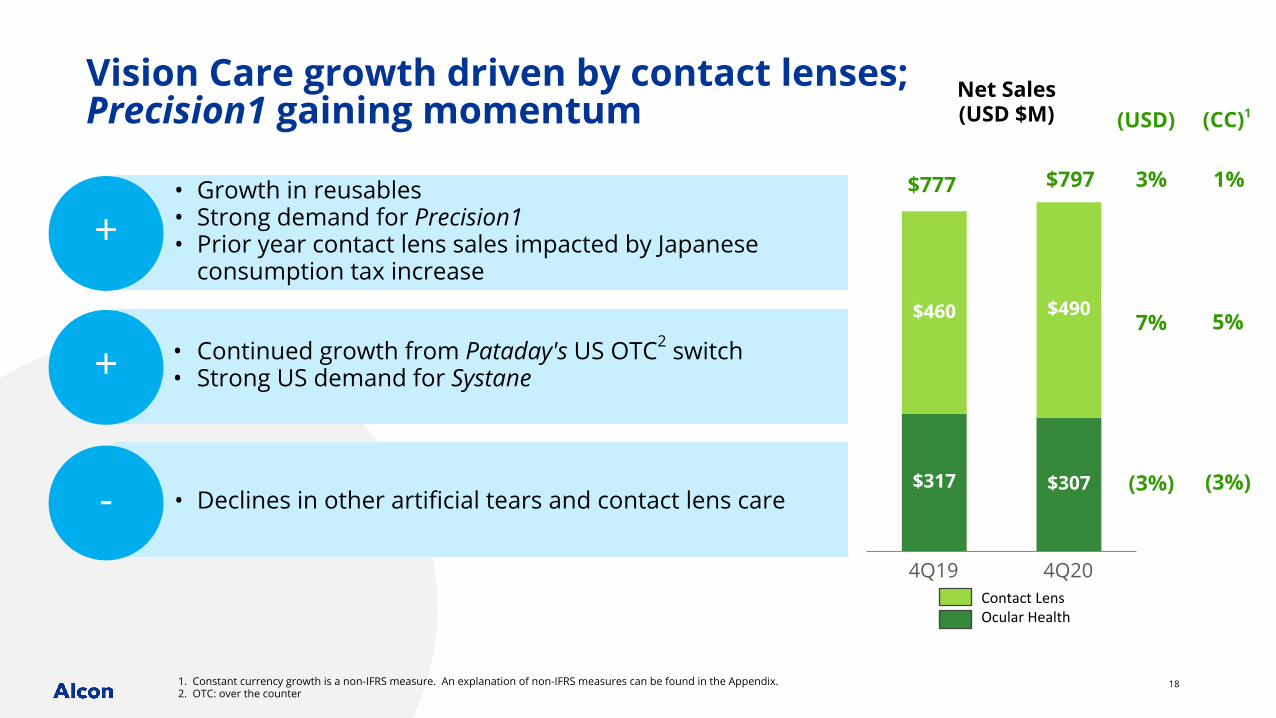
• Growth in reusables • Strong demand for Precision1• Prior year contact lens sales impacted by Japanese
consumption tax increase
$317 $307
$460 $490
4Q19 4Q20
Vision Care growth driven by contact lenses;Precision1 gaining momentum
Net Sales (USD $M)
5%
(CC)1
(3%)
7%
(USD)
(3%)
1%3%$777 $797
ContactLensOcularHealth
+
+
1. Constant currency growth is a non-IFRS measure. An explanation of non-IFRS measures can be found in the Appendix.2. OTC: over the counter
- • Declines in other artificial tears and contact lens care
• Continued growth from Pataday's US OTC2 switch • Strong US demand for Systane
19
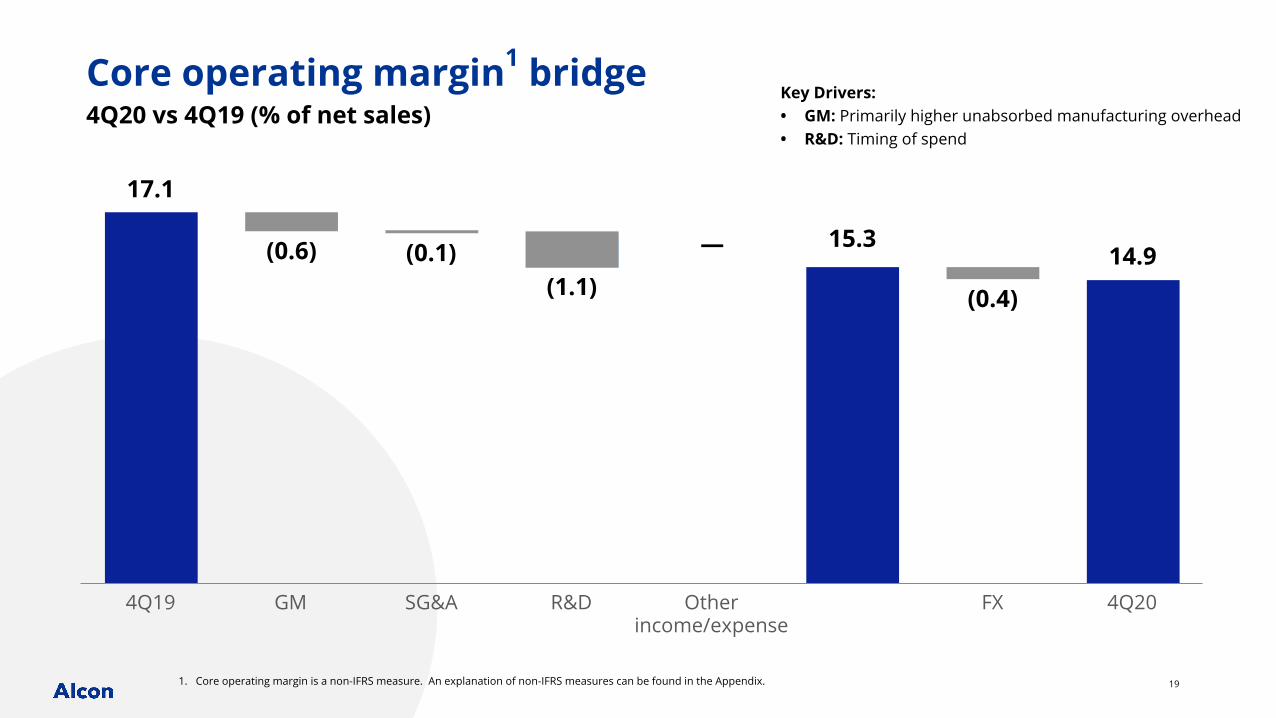
17.1
(0.6) (0.1)(1.1)
—
(0.4)
4Q19 GM SG&A R&D Otherincome/expense
FX 4Q20
Core operating margin1 bridge4Q20 vs 4Q19 (% of net sales)
1. Core operating margin is a non-IFRS measure. An explanation of non-IFRS measures can be found in the Appendix.
15.314.9
Key Drivers:• GM: Primarily higher unabsorbed manufacturing overhead• R&D: Timing of spend
201. Core operating margin is a non-IFRS measure. An explanation of non-IFRS measures can be found in the Appendix.
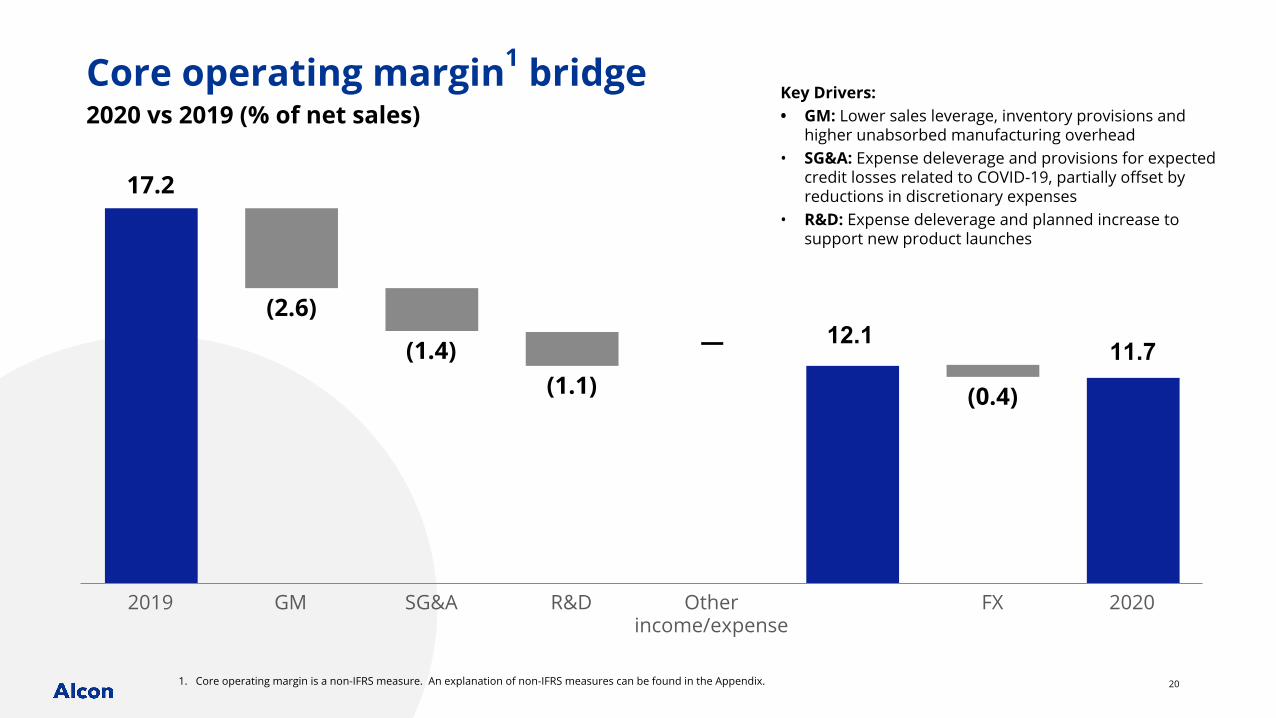
17.2
(2.6)
(1.4)(1.1)
—
(0.4)
2019 GM SG&A R&D Otherincome/expense
FX 2020
12.111.7
Core operating margin1 bridge2020 vs 2019 (% of net sales) Key Drivers:
• GM: Lower sales leverage, inventory provisions and higher unabsorbed manufacturing overhead
• SG&A: Expense deleverage and provisions for expected credit losses related to COVID-19, partially offset by reductions in discretionary expenses
• R&D: Expense deleverage and planned increase to support new product launches
21
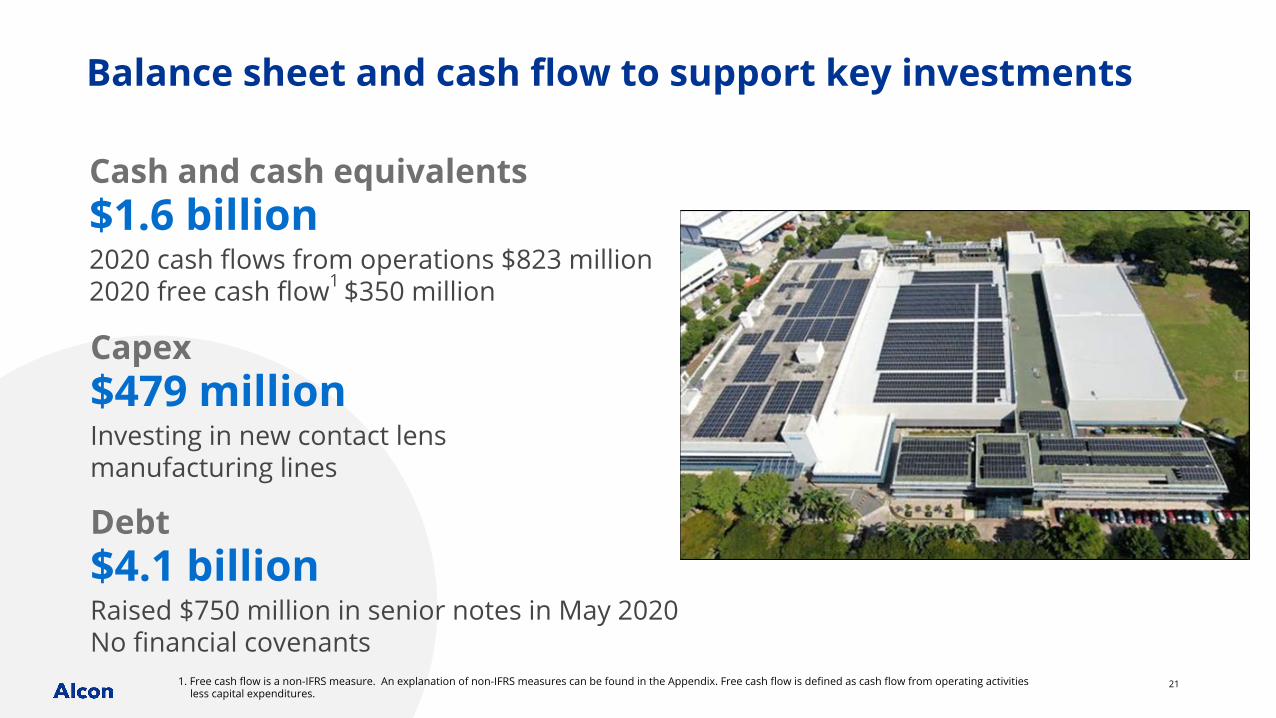
Debt$4.1 billionRaised $750 million in senior notes in May 2020No financial covenants
Balance sheet and cash flow to support key investments
Cash and cash equivalents$1.6 billion2020 cash flows from operations $823 million 2020 free cash flow1 $350 million
Capex$479 millionInvesting in new contact lens manufacturing lines
1. Free cash flow is a non-IFRS measure. An explanation of non-IFRS measures can be found in the Appendix. Free cash flow is defined as cash flow from operating activities less capital expenditures.

22
Serving customers, doctors and patients
See Brilliantly

Appendix
24
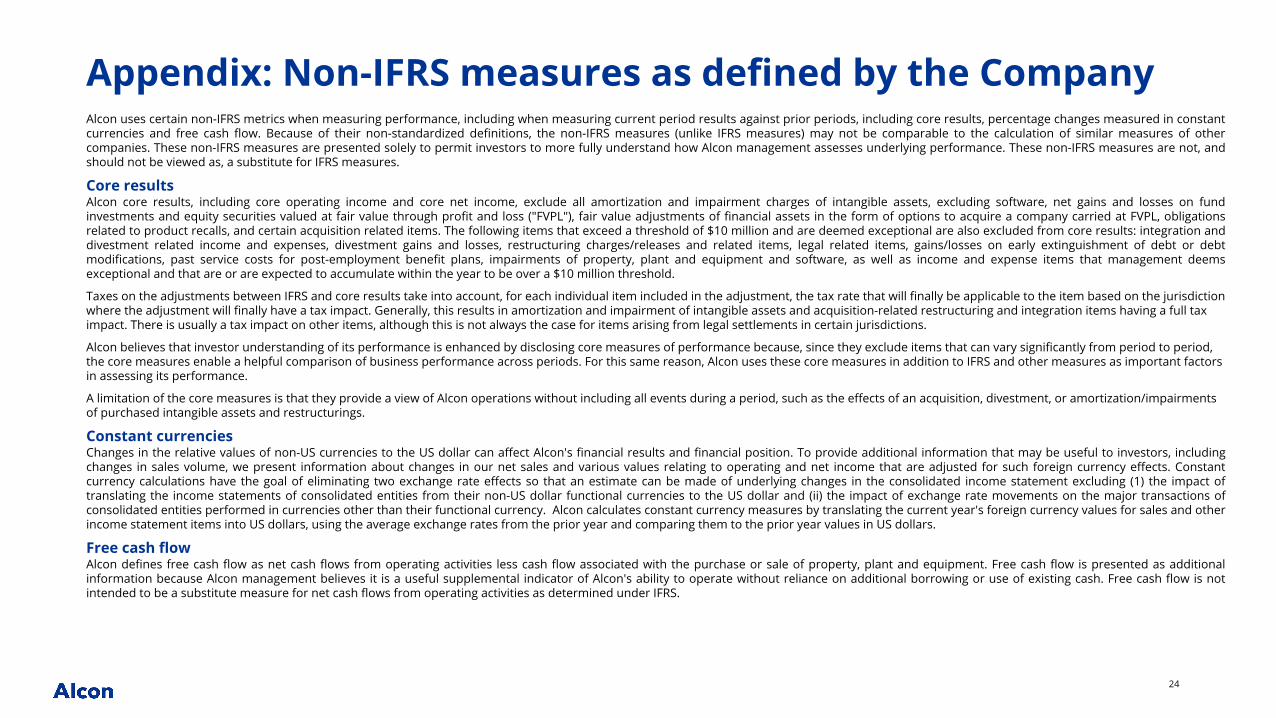
Alcon uses certain non-IFRS metrics when measuring performance, including when measuring current period results against prior periods, including core results, percentage changes measured in constant currencies and free cash flow. Because of their non-standardized definitions, the non-IFRS measures (unlike IFRS measures) may not be comparable to the calculation of similar measures of other companies. These non-IFRS measures are presented solely to permit investors to more fully understand how Alcon management assesses underlying performance. These non-IFRS measures are not, and should not be viewed as, a substitute for IFRS measures.
Core resultsAlcon core results, including core operating income and core net income, exclude all amortization and impairment charges of intangible assets, excluding software, net gains and losses on fund investments and equity securities valued at fair value through profit and loss ("FVPL"), fair value adjustments of financial assets in the form of options to acquire a company carried at FVPL, obligations related to product recalls, and certain acquisition related items. The following items that exceed a threshold of $10 million and are deemed exceptional are also excluded from core results: integration and divestment related income and expenses, divestment gains and losses, restructuring charges/releases and related items, legal related items, gains/losses on early extinguishment of debt or debt modifications, past service costs for post-employment benefit plans, impairments of property, plant and equipment and software, as well as income and expense items that management deems exceptional and that are or are expected to accumulate within the year to be over a $10 million threshold.
Taxes on the adjustments between IFRS and core results take into account, for each individual item included in the adjustment, the tax rate that will finally be applicable to the item based on the jurisdiction where the adjustment will finally have a tax impact. Generally, this results in amortization and impairment of intangible assets and acquisition-related restructuring and integration items having a full tax impact. There is usually a tax impact on other items, although this is not always the case for items arising from legal settlements in certain jurisdictions.
Alcon believes that investor understanding of its performance is enhanced by disclosing core measures of performance because, since they exclude items that can vary significantly from period to period, the core measures enable a helpful comparison of business performance across periods. For this same reason, Alcon uses these core measures in addition to IFRS and other measures as important factors in assessing its performance.
A limitation of the core measures is that they provide a view of Alcon operations without including all events during a period, such as the effects of an acquisition, divestment, or amortization/impairments of purchased intangible assets and restructurings.
Constant currenciesChanges in the relative values of non-US currencies to the US dollar can affect Alcon's financial results and financial position. To provide additional information that may be useful to investors, including changes in sales volume, we present information about changes in our net sales and various values relating to operating and net income that are adjusted for such foreign currency effects. Constant currency calculations have the goal of eliminating two exchange rate effects so that an estimate can be made of underlying changes in the consolidated income statement excluding (1) the impact of translating the income statements of consolidated entities from their non-US dollar functional currencies to the US dollar and (ii) the impact of exchange rate movements on the major transactions of consolidated entities performed in currencies other than their functional currency. Alcon calculates constant currency measures by translating the current year's foreign currency values for sales and other income statement items into US dollars, using the average exchange rates from the prior year and comparing them to the prior year values in US dollars.
Free cash flowAlcon defines free cash flow as net cash flows from operating activities less cash flow associated with the purchase or sale of property, plant and equipment. Free cash flow is presented as additional information because Alcon management believes it is a useful supplemental indicator of Alcon's ability to operate without reliance on additional borrowing or use of existing cash. Free cash flow is not intended to be a substitute measure for net cash flows from operating activities as determined under IFRS.
Appendix: Non-IFRS measures as defined by the Company
25
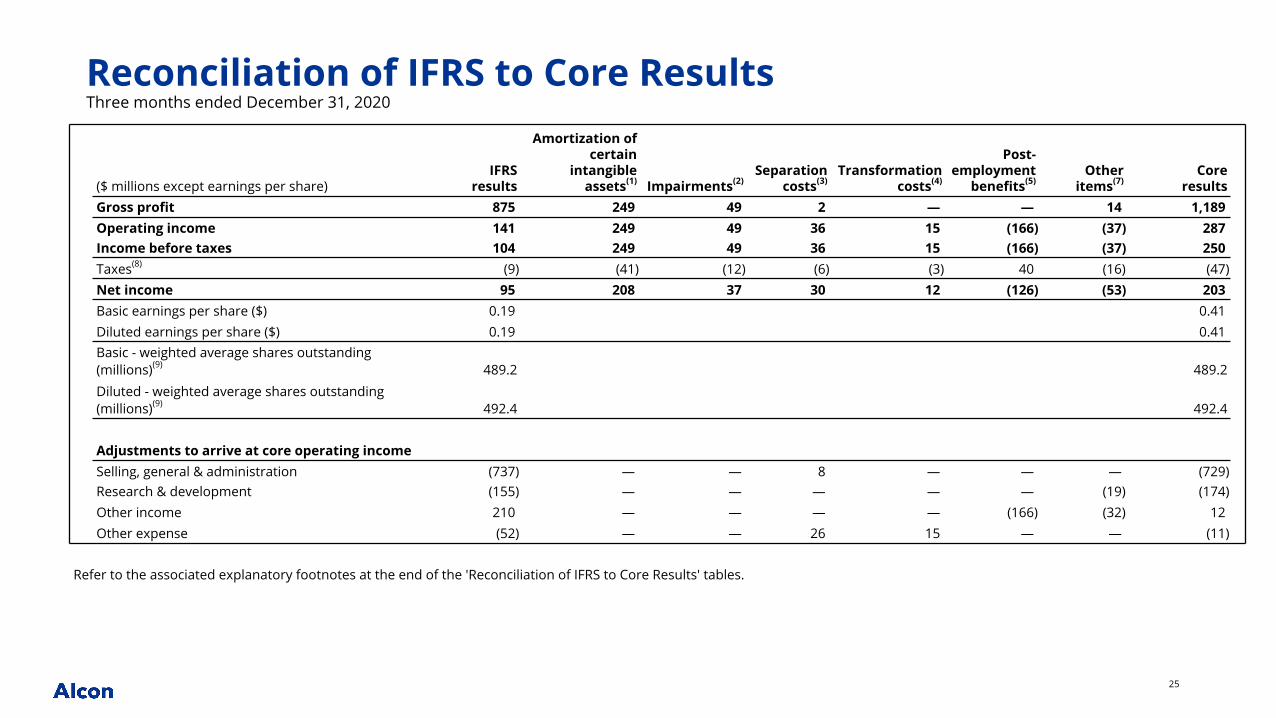
($ millions except earnings per share)IFRS
results
Amortization of certain
intangible assets(1) Impairments(2)
Separation costs(3)
Transformation costs(4)
Post-employment
benefits(5)Other
items(7)Core
resultsGross profit 875 249 49 2 — — 14 1,189 Operating income 141 249 49 36 15 (166) (37) 287 Income before taxes 104 249 49 36 15 (166) (37) 250 Taxes(8) (9) (41) (12) (6) (3) 40 (16) (47) Net income 95 208 37 30 12 (126) (53) 203 Basic earnings per share ($) 0.19 0.41 Diluted earnings per share ($) 0.19 0.41 Basic - weighted average shares outstanding (millions)(9) 489.2 489.2Diluted - weighted average shares outstanding (millions)(9) 492.4 492.4
Adjustments to arrive at core operating incomeSelling, general & administration (737) — — 8 — — — (729) Research & development (155) — — — — — (19) (174) Other income 210 — — — — (166) (32) 12 Other expense (52) — — 26 15 — — (11)
Refer to the associated explanatory footnotes at the end of the 'Reconciliation of IFRS to Core Results' tables.
Reconciliation of IFRS to Core ResultsThree months ended December 31, 2020
26
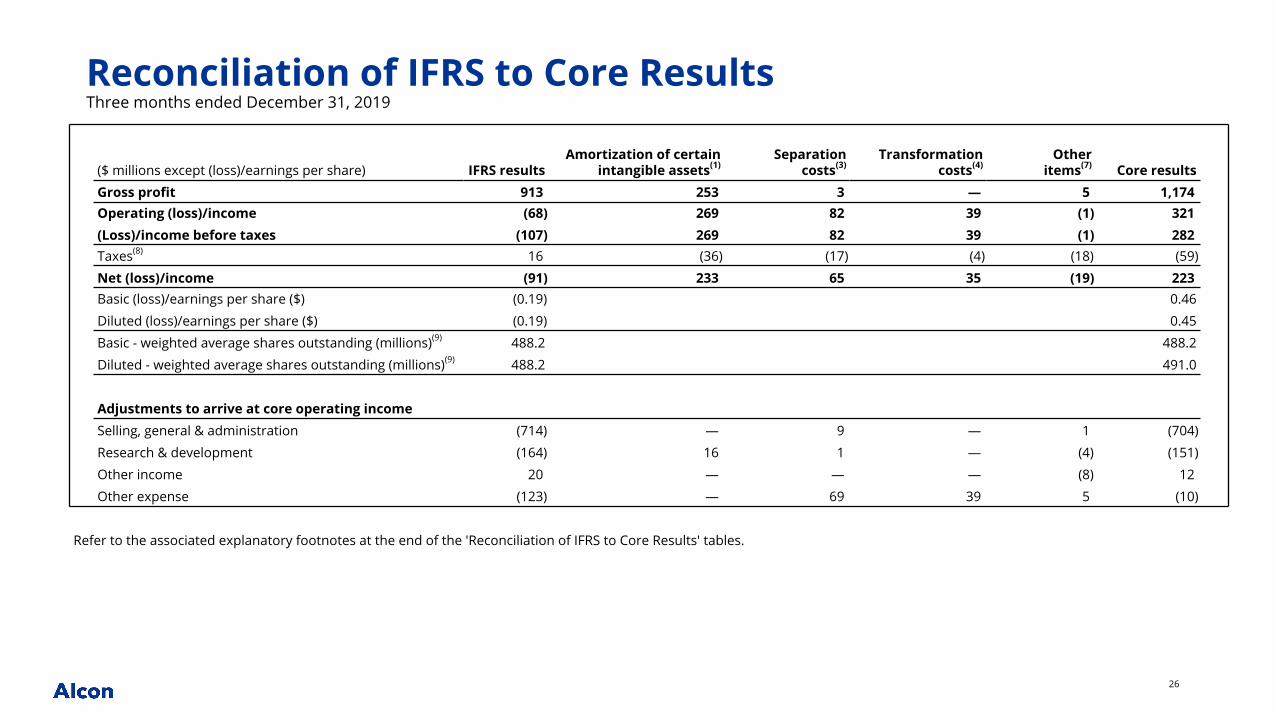
Reconciliation of IFRS to Core Results
($ millions except (loss)/earnings per share) IFRS resultsAmortization of certain
intangible assets(1)Separation
costs(3)Transformation
costs(4)Other
items(7) Core resultsGross profit 913 253 3 — 5 1,174 Operating (loss)/income (68) 269 82 39 (1) 321 (Loss)/income before taxes (107) 269 82 39 (1) 282 Taxes(8) 16 (36) (17) (4) (18) (59)
Net (loss)/income (91) 233 65 35 (19) 223 Basic (loss)/earnings per share ($) (0.19) 0.46
Diluted (loss)/earnings per share ($) (0.19) 0.45
Basic - weighted average shares outstanding (millions)(9) 488.2 488.2
Diluted - weighted average shares outstanding (millions)(9) 488.2 491.0
Adjustments to arrive at core operating incomeSelling, general & administration (714) — 9 — 1 (704)
Research & development (164) 16 1 — (4) (151)
Other income 20 — — — (8) 12
Other expense (123) — 69 39 5 (10)
Refer to the associated explanatory footnotes at the end of the 'Reconciliation of IFRS to Core Results' tables.
Three months ended December 31, 2019
27
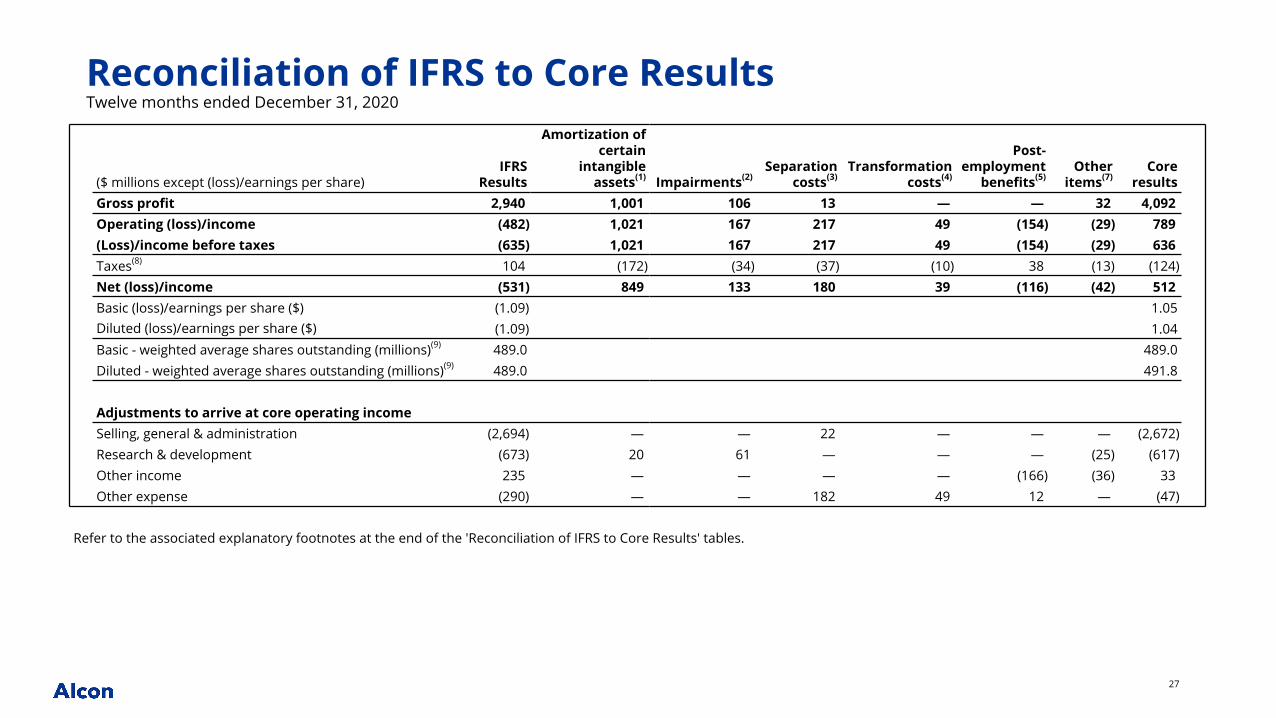
Reconciliation of IFRS to Core ResultsTwelve months ended December 31, 2020
($ millions except (loss)/earnings per share)IFRS
Results
Amortization of certain
intangible assets(1) Impairments(2)
Separation costs(3)
Transformation costs(4)
Post-employment
benefits(5)Other
items(7)Core
resultsGross profit 2,940 1,001 106 13 — — 32 4,092 Operating (loss)/income (482) 1,021 167 217 49 (154) (29) 789 (Loss)/income before taxes (635) 1,021 167 217 49 (154) (29) 636 Taxes(8) 104 (172) (34) (37) (10) 38 (13) (124) Net (loss)/income (531) 849 133 180 39 (116) (42) 512 Basic (loss)/earnings per share ($) (1.09) 1.05Diluted (loss)/earnings per share ($) (1.09) 1.04Basic - weighted average shares outstanding (millions)(9) 489.0 489.0Diluted - weighted average shares outstanding (millions)(9) 489.0 491.8
Adjustments to arrive at core operating incomeSelling, general & administration (2,694) — — 22 — — — (2,672) Research & development (673) 20 61 — — — (25) (617) Other income 235 — — — — (166) (36) 33 Other expense (290) — — 182 49 12 — (47)
Refer to the associated explanatory footnotes at the end of the 'Reconciliation of IFRS to Core Results' tables.
28
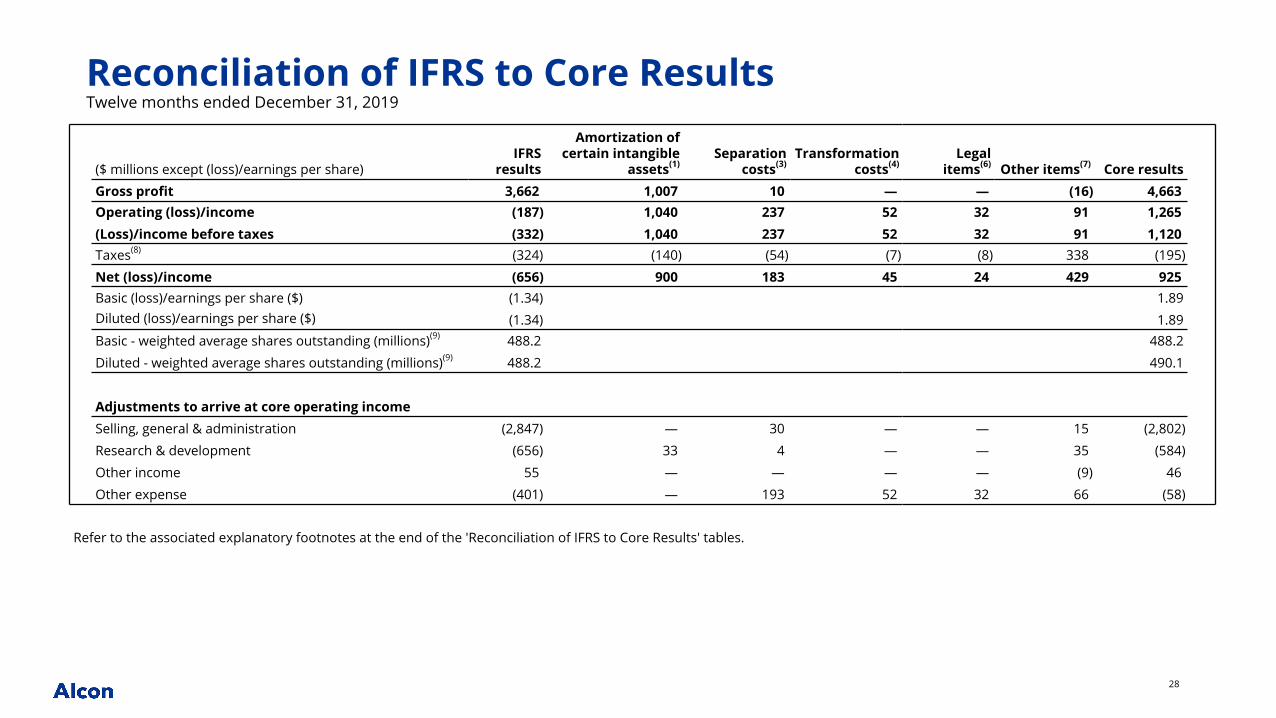
Reconciliation of IFRS to Core ResultsTwelve months ended December 31, 2019
($ millions except (loss)/earnings per share)IFRS
results
Amortization of certain intangible
assets(1)Separation
costs(3)Transformation
costs(4)Legal
items(6) Other items(7) Core resultsGross profit 3,662 1,007 10 — — (16) 4,663 Operating (loss)/income (187) 1,040 237 52 32 91 1,265 (Loss)/income before taxes (332) 1,040 237 52 32 91 1,120 Taxes(8) (324) (140) (54) (7) (8) 338 (195)
Net (loss)/income (656) 900 183 45 24 429 925 Basic (loss)/earnings per share ($) (1.34) 1.89Diluted (loss)/earnings per share ($) (1.34) 1.89Basic - weighted average shares outstanding (millions)(9) 488.2 488.2
Diluted - weighted average shares outstanding (millions)(9) 488.2 490.1
Adjustments to arrive at core operating incomeSelling, general & administration (2,847) — 30 — — 15 (2,802)
Research & development (656) 33 4 — — 35 (584)
Other income 55 — — — — (9) 46
Other expense (401) — 193 52 32 66 (58)
Refer to the associated explanatory footnotes at the end of the 'Reconciliation of IFRS to Core Results' tables.
29
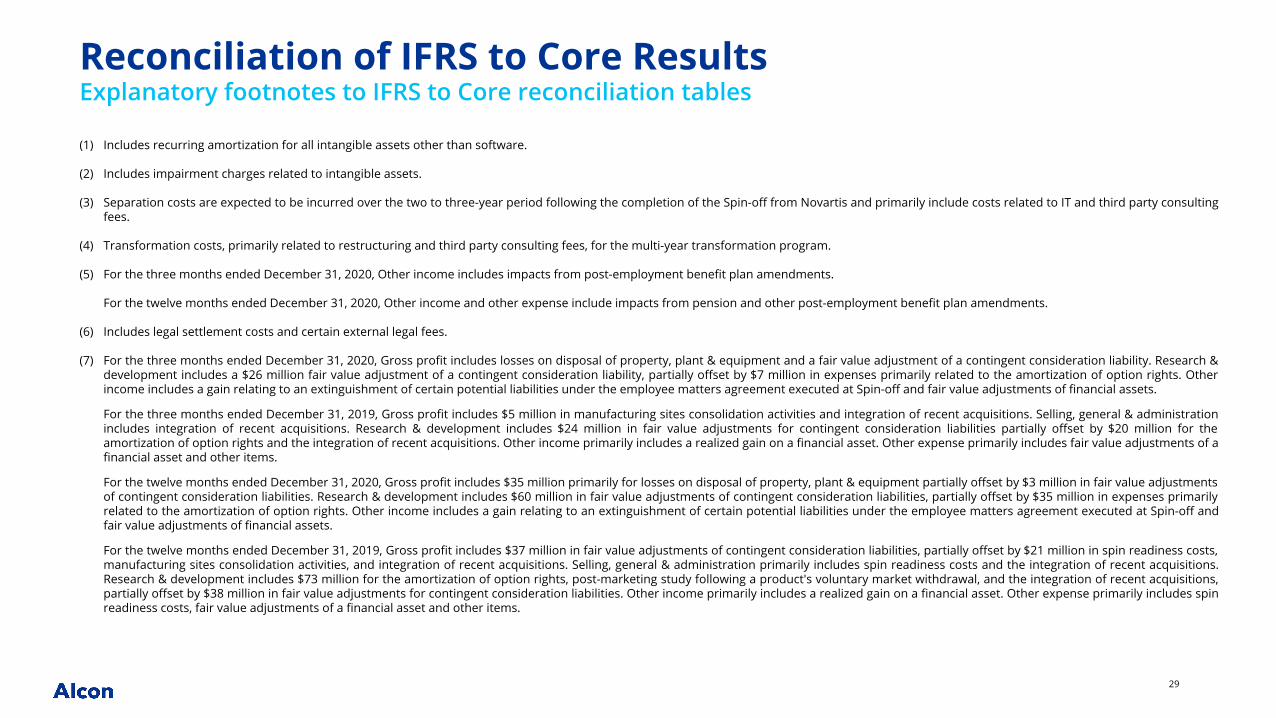
Reconciliation of IFRS to Core ResultsExplanatory footnotes to IFRS to Core reconciliation tables
(1) Includes recurring amortization for all intangible assets other than software.
(2) Includes impairment charges related to intangible assets.
(3) Separation costs are expected to be incurred over the two to three-year period following the completion of the Spin-off from Novartis and primarily include costs related to IT and third party consulting fees.
(4) Transformation costs, primarily related to restructuring and third party consulting fees, for the multi-year transformation program.
(5) For the three months ended December 31, 2020, Other income includes impacts from post-employment benefit plan amendments.
For the twelve months ended December 31, 2020, Other income and other expense include impacts from pension and other post-employment benefit plan amendments.
(6) Includes legal settlement costs and certain external legal fees.
(7) For the three months ended December 31, 2020, Gross profit includes losses on disposal of property, plant & equipment and a fair value adjustment of a contingent consideration liability. Research & development includes a $26 million fair value adjustment of a contingent consideration liability, partially offset by $7 million in expenses primarily related to the amortization of option rights. Other income includes a gain relating to an extinguishment of certain potential liabilities under the employee matters agreement executed at Spin-off and fair value adjustments of financial assets.
For the three months ended December 31, 2019, Gross profit includes $5 million in manufacturing sites consolidation activities and integration of recent acquisitions. Selling, general & administration includes integration of recent acquisitions. Research & development includes $24 million in fair value adjustments for contingent consideration liabilities partially offset by $20 million for the amortization of option rights and the integration of recent acquisitions. Other income primarily includes a realized gain on a financial asset. Other expense primarily includes fair value adjustments of a financial asset and other items.
For the twelve months ended December 31, 2020, Gross profit includes $35 million primarily for losses on disposal of property, plant & equipment partially offset by $3 million in fair value adjustments of contingent consideration liabilities. Research & development includes $60 million in fair value adjustments of contingent consideration liabilities, partially offset by $35 million in expenses primarily related to the amortization of option rights. Other income includes a gain relating to an extinguishment of certain potential liabilities under the employee matters agreement executed at Spin-off and fair value adjustments of financial assets.
For the twelve months ended December 31, 2019, Gross profit includes $37 million in fair value adjustments of contingent consideration liabilities, partially offset by $21 million in spin readiness costs, manufacturing sites consolidation activities, and integration of recent acquisitions. Selling, general & administration primarily includes spin readiness costs and the integration of recent acquisitions. Research & development includes $73 million for the amortization of option rights, post-marketing study following a product's voluntary market withdrawal, and the integration of recent acquisitions, partially offset by $38 million in fair value adjustments for contingent consideration liabilities. Other income primarily includes a realized gain on a financial asset. Other expense primarily includes spin readiness costs, fair value adjustments of a financial asset and other items.
8
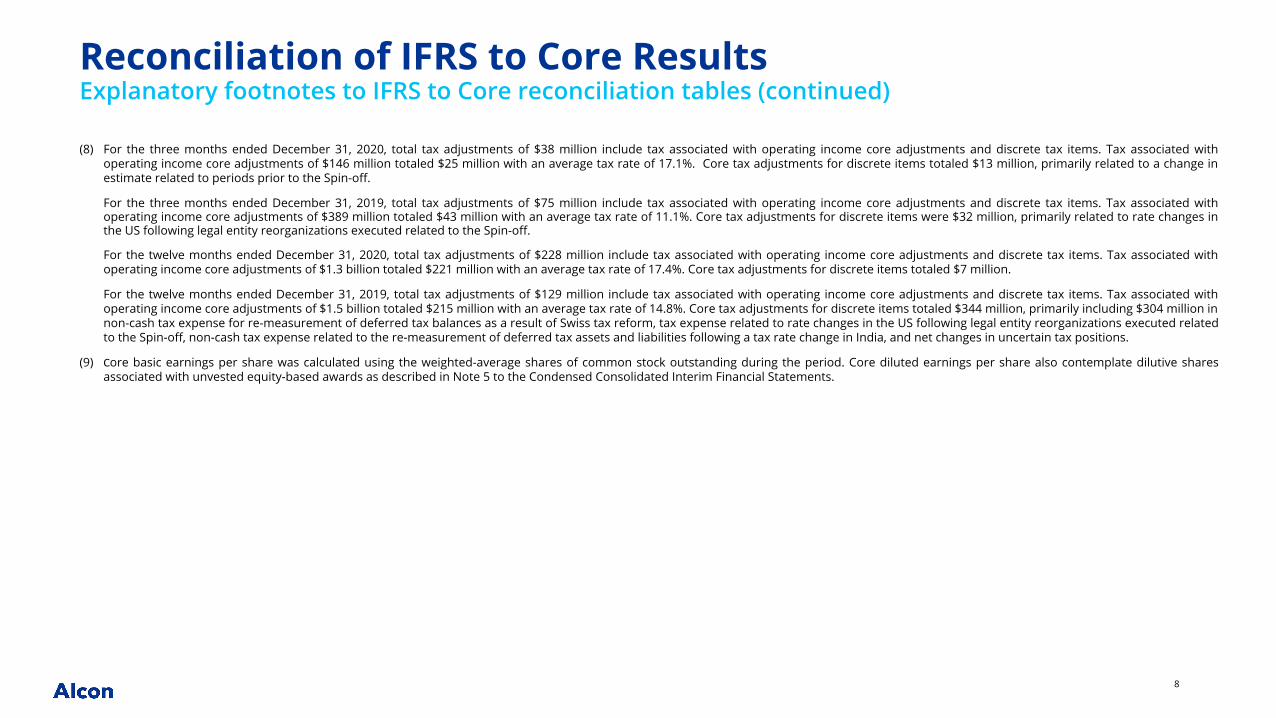
Reconciliation of IFRS to Core ResultsExplanatory footnotes to IFRS to Core reconciliation tables (continued)
(8) For the three months ended December 31, 2020, total tax adjustments of $38 million include tax associated with operating income core adjustments and discrete tax items. Tax associated with operating income core adjustments of $146 million totaled $25 million with an average tax rate of 17.1%. Core tax adjustments for discrete items totaled $13 million, primarily related to a change in estimate related to periods prior to the Spin-off.
For the three months ended December 31, 2019, total tax adjustments of $75 million include tax associated with operating income core adjustments and discrete tax items. Tax associated with operating income core adjustments of $389 million totaled $43 million with an average tax rate of 11.1%. Core tax adjustments for discrete items were $32 million, primarily related to rate changes in the US following legal entity reorganizations executed related to the Spin-off.
For the twelve months ended December 31, 2020, total tax adjustments of $228 million include tax associated with operating income core adjustments and discrete tax items. Tax associated with operating income core adjustments of $1.3 billion totaled $221 million with an average tax rate of 17.4%. Core tax adjustments for discrete items totaled $7 million.
For the twelve months ended December 31, 2019, total tax adjustments of $129 million include tax associated with operating income core adjustments and discrete tax items. Tax associated with operating income core adjustments of $1.5 billion totaled $215 million with an average tax rate of 14.8%. Core tax adjustments for discrete items totaled $344 million, primarily including $304 million in non-cash tax expense for re-measurement of deferred tax balances as a result of Swiss tax reform, tax expense related to rate changes in the US following legal entity reorganizations executed related to the Spin-off, non-cash tax expense related to the re-measurement of deferred tax assets and liabilities following a tax rate change in India, and net changes in uncertain tax positions.
(9) Core basic earnings per share was calculated using the weighted-average shares of common stock outstanding during the period. Core diluted earnings per share also contemplate dilutive shares associated with unvested equity-based awards as described in Note 5 to the Condensed Consolidated Interim Financial Statements.
9
Reconciliation of Free Cash Flow
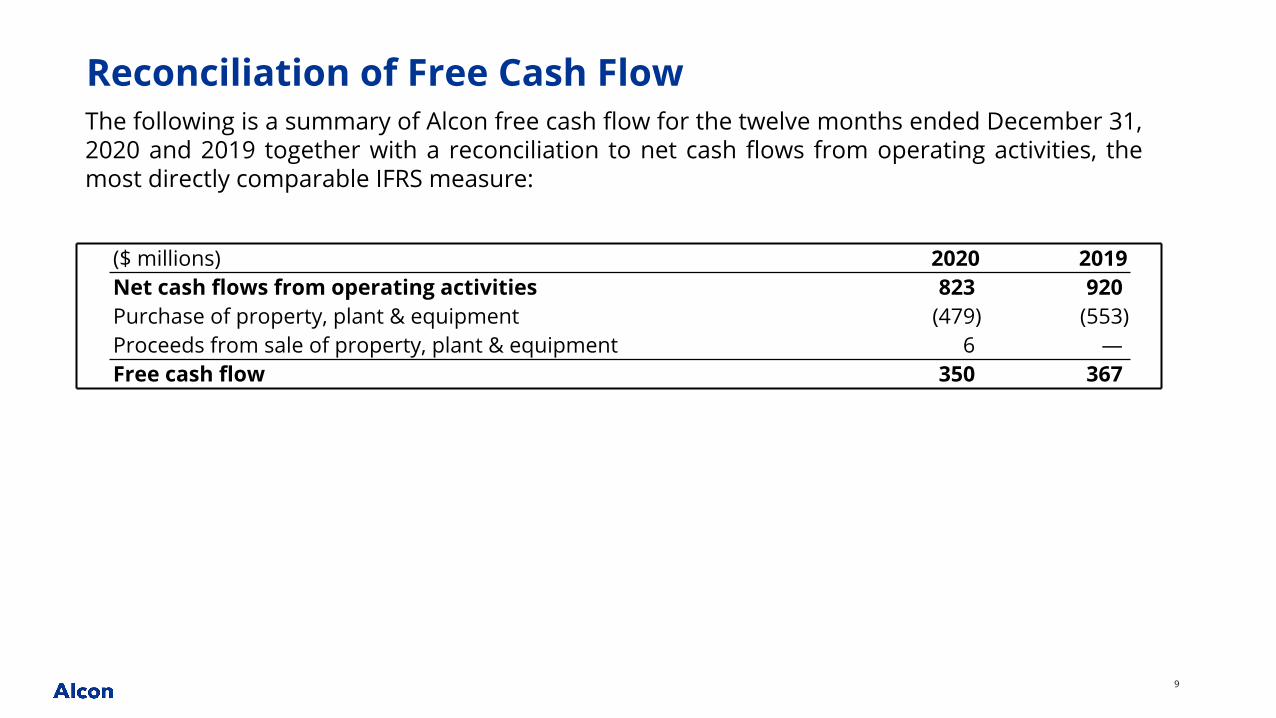
($ millions) 2020 2019Net cash flows from operating activities 823 920 Purchase of property, plant & equipment (479) (553) Proceeds from sale of property, plant & equipment 6 — Free cash flow 350 367
The following is a summary of Alcon free cash flow for the twelve months ended December 31, 2020 and 2019 together with a reconciliation to net cash flows from operating activities, the most directly comparable IFRS measure: