4q20 results
TRANSCRIPT

4Q20 RESULTS
MARKET CAP CONFERENCE CALL INVESTOR RELATIONS
12/30/2020 02/12/2021 | 10:00 AM (BRT)BRL 8.2 bill ion
SAPR4: BRL 5.10
SAPR11: BRL 26.00 ir.sanepar.com.br
Abel Demetrio
Fabiane Queiroz Santos Heinisch
Jamile G. Oliveira
Ricardo Garcia Gonçalves
SAPR3: BRL 6.00Brasil: (11) 3137-8038
US (+1) 786 209 1795
UK (+44) 20 3769 3830
Curitiba, February 11th, 2021.
Companhia de Saneamento do Paraná – SANEPAR (SAPR3 - ON; SAPR4 - PN; SAPR11 - UNITS) presents the financial and operating results regarding the fourth quarter of 2020 (4Q20). The economic information was prepared in accordance with accounting practices adopted in Brazil, including Brazilian corporate law, pronouncements, guidelines and interpretations issued by the Accounting Pronouncements Committee (Comitê de Pronunciamentos Contábeis – CPC), also based on the accounting standards and procedures established by the Brazilian Securities and Exchange Commission (Comissão de Valores Mobiliários- CVM).
Highlights
4Q20 RESULTS
2
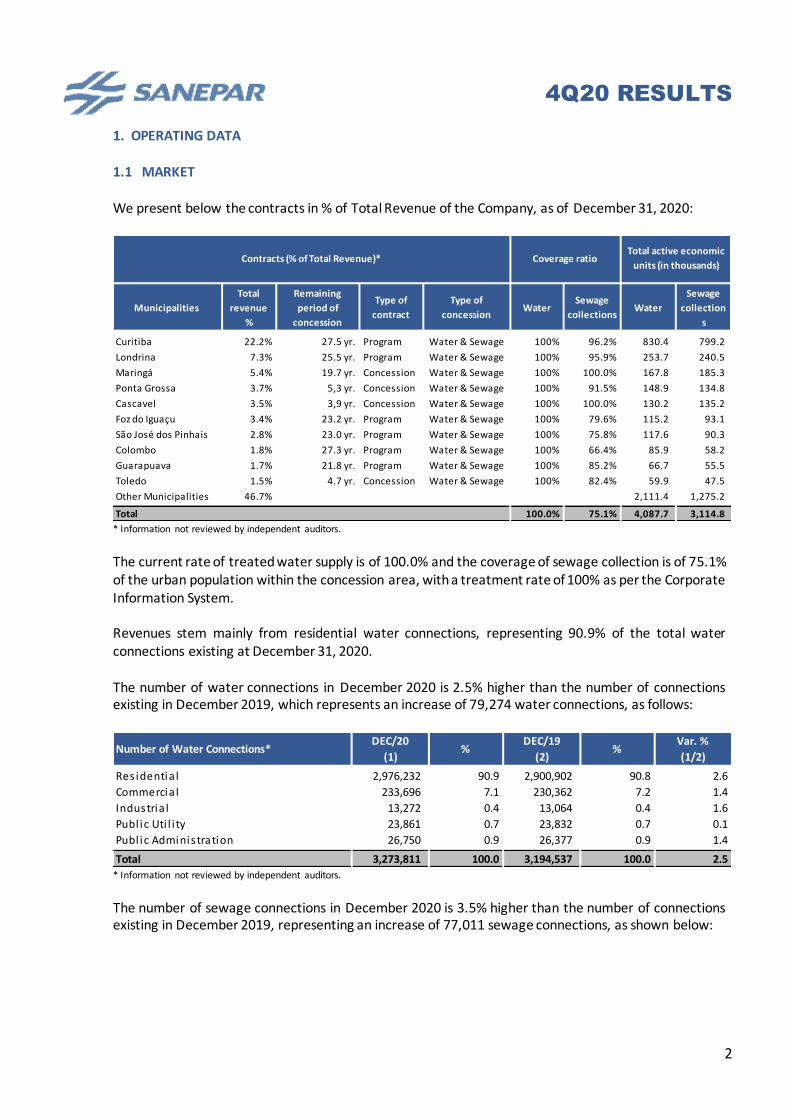
1. OPERATING DATA 1.1 MARKET We present below the contracts in % of Total Revenue of the Company, as of December 31, 2020:
* Information not reviewed by independent auditors.
The current rate of treated water supply is of 100.0% and the coverage of sewage collection is of 75.1% of the urban population within the concession area, with a treatment rate of 100% as per the Corporate Information System. Revenues stem mainly from residential water connections, representing 90.9% of the total water connections existing at December 31, 2020. The number of water connections in December 2020 is 2.5% higher than the number of connections existing in December 2019, which represents an increase of 79,274 water connections, as follows:
* Information not reviewed by independent auditors.
The number of sewage connections in December 2020 is 3.5% higher than the number of connections existing in December 2019, representing an increase of 77,011 sewage connections, as shown below:
Municipalities
Total
revenue
%
Remaining
period of
concession
Type of
contract
Type of
concessionWater
Sewage
collectionsWater
Sewage
collection
s
Curitiba 22.2% 27.5 yr. Program Water & Sewage 100% 96.2% 830.4 799.2
Londrina 7.3% 25.5 yr. Program Water & Sewage 100% 95.9% 253.7 240.5
Maringá 5.4% 19.7 yr. Concession Water & Sewage 100% 100.0% 167.8 185.3
Ponta Grossa 3.7% 5,3 yr. Concession Water & Sewage 100% 91.5% 148.9 134.8
Cascavel 3.5% 3,9 yr. Concession Water & Sewage 100% 100.0% 130.2 135.2
Foz do Iguaçu 3.4% 23.2 yr. Program Water & Sewage 100% 79.6% 115.2 93.1
São José dos Pinhais 2.8% 23.0 yr. Program Water & Sewage 100% 75.8% 117.6 90.3
Colombo 1.8% 27.3 yr. Program Water & Sewage 100% 66.4% 85.9 58.2
Guarapuava 1.7% 21.8 yr. Program Water & Sewage 100% 85.2% 66.7 55.5
Toledo 1.5% 4.7 yr. Concession Water & Sewage 100% 82.4% 59.9 47.5
Other Municipalities 46.7% 2,111.4 1,275.2
Total 100.0% 75.1% 4,087.7 3,114.8
Coverage ratioTotal active economic
units (in thousands)Contracts (% of Total Revenue)*
Number of Water Connections*DEC/20
(1)%
DEC/19
(2)%
Var. %
(1/2)
Res identia l 2,976,232 90.9 2,900,902 90.8 2.6
Commercia l 233,696 7.1 230,362 7.2 1.4
Industria l 13,272 0.4 13,064 0.4 1.6
Publ ic Uti l i ty 23,861 0.7 23,832 0.7 0.1
Publ ic Administration 26,750 0.9 26,377 0.9 1.4
Total 3,273,811 100.0 3,194,537 100.0 2.5

4Q20 RESULTS
3
* Information not reviewed by independent auditors.
1.2 PRODUCTIVITY In 4Q20, the measured volume of treated water was 127.3 million m³ against 132.1 million m³ in 4Q19, representing a decrease of 3.6%, as shown below:
* Information not reviewed by independent auditors.
In 4Q20, the volume of treated water billed was 132.9 million m³, against to 137.0 million m³ in 4Q19, representing a decrease of 3.2%, as shown below:
* Information not reviewed by independent auditors.
The volume of sewage billed in 4Q20 decreased by 3.7% compared to 4Q19, as shown below:
* Information not reviewed by independent auditors.
Number of Sewage Connections*DEC/20
(1)%
DEC/19
(2)%
Var. %
(1/2)
Res identia l 2,088,213 90.5 2,015,360 90.3 3.6
Commercia l 184,259 8.0 180,757 8.1 1.9
Industria l 5,599 0.2 5,458 0.2 2.6
Publ ic Uti l i ty 15,467 0.7 15,317 0.7 1.0
Publ ic Administration 14,600 0.6 14,235 0.7 2.6
Total 2,308,138 100.0 2,231,127 100.0 3.5
Measured Water Volume - million m³ *4Q20
(1)
4Q19
(2)
Var. %
(1/2)
2020
(3)
2019
(4)
Var. %
(3/4)
Res identia l 109.7 111.1 -1.3 435.9 432.4 0.8
Commercia l 9.4 11.1 -15.3 36.3 42.3 -14.2
Industria l 3.6 3.3 9.1 11.6 11.8 -1.7
Publ ic Uti l i ty 1.1 1.4 -21.4 4.5 5.4 -16.7
Publ ic Administration 3.5 5.2 -32.7 15.0 19.8 -24.2
Total 127.3 132.1 -3.6 503.3 511.7 -1.6
Invoiced Water Volume - million m³ *4Q20
(1)
4Q19
(2)
Var. %
(1/2)
2020
(3)
2019
(4)
Var. %
(3/4)
Res identia l 114.2 115.0 -0.7 453.6 448.5 1.1
Commercia l 10.2 11.8 -13.6 39.8 45.3 -12.1
Industria l 3.7 3.8 -2.6 13.3 14.4 -7.6
Publ ic Uti l i ty 1.0 1.1 -9.1 3.8 4.5 -15.6
Publ ic Administration 3.5 5.3 -34.0 15.3 20.1 -23.9
Total 132.6 137.0 -3.2 525.8 532.8 -1.3
Invoiced Sewage Volume - million m³ * 4Q20
(1)
4Q19
(2)
Var. %
(1/2)
2020
(3)
2019
(4)
Var. %
(3/4)
Res identia l 86.1 86.5 -0.5 342.9 335.2 2.3
Commercia l 9.1 10.8 -15.7 35.5 41.5 -14.5
Industria l 0.7 0.9 -22.2 2.9 3.5 -17.1
Publ ic Uti l i ty 0.8 1.0 -20.0 3.2 3.8 -15.8
Publ ic Administration 2.7 4.0 -32.5 11.7 15.2 -23.0
Total 99.4 103.2 -3.7 396.2 399.2 -0.8

4Q20 RESULTS
4
DEMONSTRATIVE OF THE LOSS BY CONNECTION*
* Information not reviewed by independent auditors.
* Information not reviewed by independent auditors.
* Information not reviewed by independent auditors.
Water*2020
(1)
2019
(2)
Var.
(1/2)
2018
(3)
Var. %
(2/3)
Units served by the dis tribution network 4,087,719 4,001,074 2,2 % 3,923,428 2,0 %
Number of treatment s tations 168 168 0,0 % 168 0,0 %
Number of wel ls 1,154 1,104 4,5 % 1,103 0,1 %
Number of surface catchment 232 232 0,0 % 230 -0,9 %
Km of la id network 57,503 55,359 3,9 % 54,103 2,3 %
Volume produced (m³) 766,106,638 780,632,413 -1,9 % 761,996,211 2,4 %
Loss rate:
In dis tribution system - % 34.34 34.45 -0,11 p.p. 35.22 -0,78 p.p.
In bi l l ings - % 31.41 31.74 -0,33 p.p. 32.57 -0,83 p.p.
Revenues del inquency rate % 2.80 1.65 1,15 p.p. 0.97 0,68 p.p.
Sewage*2020
(1)2019 (2)
Var.
(1/2)
2018
(3)
Var. %
(2/3)
Units served by the col lection network 3,114,750 3,019,303 3,2 % 2,896,583 4,2 %
Number of treatment stations 255 249 2,4 % 246 1,2 %
Km of la id network 38,464 36,754 4,7 % 35,982 2,1 %
Volume col lected in m³ 377,326,945 382,115,054 -1,3 % 362,380,051 5,4 %

4Q20 RESULTS
5
WATER CRISIS AND AVAILABLE VOLUMES On 05/07/2020, State Decree nº 4,626 was published, recognizing the water emergency situation in the State of Paraná, for a period of 180 days. Subsequently, on 10/29/2020, this Decree was extended for another 180 days. Due to the low volume of reserves and the scarcity of rain, the Company is practicing as a mitigating action, rotation of 36 hours by 36 hours. The water supply is for 36 hours, with interruption of 24 hours and a period of 12 hours for normalization, although the Water Emergency Decree allows up to 24 hours for normalization. The average volume available of the Integrated Supply System of Curitiba (SAIC) is formed by the dams Piraquara I, Piraquara II, Iraí and Passaúna. In the Municipality of Foz do Iguaçu, Sanepar uses water from the dam of the hydroelectric power plant Itaipu Binacional, of Itaipu lake, in Paraná River. The dams of Sanepar are considered of medium size in relation to storage volume, but large due to height/depth of more than 15 meters. At the end of the quarter, the average reserve volume was 40.95%.
RESERVOIR LEVELS – 12/31/2020

4Q20 RESULTS
6
2. FINANCIAL DATA
2.1 ECONOMIC PERFORMANCE
Net operating revenue decreased by 7.7%, from BRL 1,339.6 million in 4Q19 to BRL 1,236.9 million in 4Q20. This reduction is due to the decrease of 3.2% in billed water volumes and 3.7% in billed sewage volumes, resulting from the current water emergency situation in the State of Paraná, which required mitigating actions due to the low volume of reserves and the scarcity of rain and also due to the postponement of the 2020 tariff readjustment.
Operating costs and expenses in 4Q20 decreased 1.3% when compared to 4Q19:
Operating revenue - In BRL million4Q20
(1)
4Q19
(2)
Var. %
(1/2)
2020
(3)
2019
(4)
Var. %
(3/4)
Revenues from water 807.7 872.1 -7.4 3,124.1 3,068.7 1.8
Revenues from sewage 475.8 518.0 -8.1 1,856.0 1,811.9 2.4
Revenues from services 30.5 36.5 -16.4 119.3 143.1 -16.6
Revenues from sol id waste 3.0 3.0 - 11.9 11.7 1.7
Services provided to Municipal i ties 5.3 4.9 8.2 20.4 18.4 10.9
Donations made by cl ients 6.0 5.5 9.1 21.7 18.8 15.4
Other revenues 1.8 1.7 5.9 7.3 5.5 32.7
Total Operating Revenue 1,330.1 1,441.7 -7.7 5,160.7 5,078.1 1.6
COFINS -76.6 -83.9 -8.7 -296.7 -292.0 1.6
PASEP -16.6 -18.2 -8.8 -64.3 -63.3 1.6
Total of Deductions -93.2 -102.1 -8.7 -361.0 -355.3 1.6
Total of Operationg Revenue, net 1,236.9 1,339.6 -7.7 4,799.7 4,722.8 1.6
Operating costs and expenses
In BRL million
4Q20
(1)
4Q19
(2)
Var. %
(1/2)
2020
(3)
2019
(4)
Var. %
(3/4)
Personnel -258.8 -290.8 -11.0 -1,212.2 -1,094.8 10.7
Materia ls -58.9 -61.1 -3.6 -216.9 -204.0 6.3
Electrici ty -103.7 -121.4 -14.6 -443.0 -467.5 -5.2
Third-party services -172.1 -175.1 -1.7 -655.9 -629.2 4.2
Depreciation and amortization -94.0 -86.0 9.3 -361.9 -337.4 7.3
Losses in Real ization of Credits -34.7 -6.1 468.9 -91.0 -20.9 335.4
Net Real izable Value of Inventory 0.7 -1.3 -153.8 -1.4 -1.3 7.7
Municipal Sanitation and Environmental Funds -16.6 -16.4 1.2 -65.9 -63.2 4.3
Regulatory fee -6.4 -5.6 14.3 -25.4 -22.4 13.4
Indemnifications for damages to third parties -2.7 -2.2 22.7 -13.1 -15.3 -14.4
Expenses capita l i zed 22.2 25.5 -12.9 82.9 103.4 -19.8
Impairment Losses 1.1 -19.4 -105.7 1.1 -19.4 -105.7
Provis ion for contingencies 8.4 0.3 2,700.0 2.0 -84.9 -102.4
Pens ion plan and medica l insurance -10.7 -15.2 -29.6 -60.8 -60.1 1.2
Profi t sharing program -31.9 -0.2 15,850.0 -74.4 -76.6 -2.9
Eventual and extraordinary losses 0.0 0.0 - -37.2 -28.7 29.6
Convers ion of Environmental Fines -19.4 -0.1 19,300.0 -19.4 -0.9 2,055.6
Net assets wri te-off 3.0 -2.7 -211.1 6.2 -9.2 -167.4
Adjustment to Fa ir Value - Investments 0.2 0.4 -50.0 -0.2 0.6 -133.3
Equity in earnings (losses) 0.1 -1.2 -108.3 -1.9 -5.7 -66.7
Other costs and expenses -9.5 -15.8 -39.9 -40.8 -51.0 -20.00.0
Total -783.7 -794.4 -1.3 -3,229.2 -3,088.5 4.6

4Q20 RESULTS
7
The main changes resulted from: • Personnel:
Reduction of 11.0% due to the 8.6% decrease in the number of employees (from 6,985 to 6,382 employees in 2019 and 2020, respectively) reflecting in all severance payments and employee benefits. In 4Q20, the Company recorded the impact of BRL 5.0 million regarding the Incentive Retirement Program (“PAI”). At the end of the program, 565 employees joined it with an impact of BRL 132.8 million in severance pay;
• Materials:
Reduction of 3.6% mainly in expedient material, use and consumption, maintenance of conservation and
maintenance of administrative goods, electromechanical maintenance material, cut and rewire material,
fuels and lubricants and network maintenance material. In 2020 there was an increase of 6.3%, mainly in
treatment material with a positive variation of 19.9%, influenced by the increase in the amount of
chemicals used in the sewage treatment process;
• Electricity
Reduction of 14.6% mainly due to the decrease in electricity consumption due to the implementation of
water rotation due to the water crisis;
• Third Party Services:
Decrease of 1.7% mainly in operation and building maintenance services and systems, conservation and
maintenance services for administrative assets, placement services, advertising, communication and data
transmission services, surveillance services, collection services, graphic services, copies and binding,
interns and contractors, electromechanical maintenance services and network maintenance services. In
2020, there was an accumulated growth of 4.2%, mainly in sewage removal services with a variation of
22.2% and freight and reels with a variation of 39.7%;
• Depreciation and amortization:
Increase of 9.3% mainly due to the operation start of intangible and / or fixed assets, in fiscal year 2020,
in the amount of BRL 985.3 million (net of amortizations and write-offs);
• Losses on Credit Realization:
Increase of 468.9% mainly influenced by the increase in the loss provisions of accounts receivable from
private customers in the amount of BRL 28.3 million and also by the accounting of the amount of BRL 5.3
million referring to the estimated losses on credits due, according to studies on the drop in revenue
caused by the current economic scenario, caused by the COVID-19 pandemic;
• Conversion of Environmental Fines
Growth mainly influenced by the environmental provision in the amount of BRL 19.0 million, due to an
IBAMA appeal decision that consolidated the amount of debt of the Environmental Infraction Notice,
which established a fine for exploitation of underground water in the Karst Aquifer, without the proper
environmental license. This amount was provisioned in 3Q20, so there was a decrease in the provision
account in this quarter.
4Q20 RESULTS
8
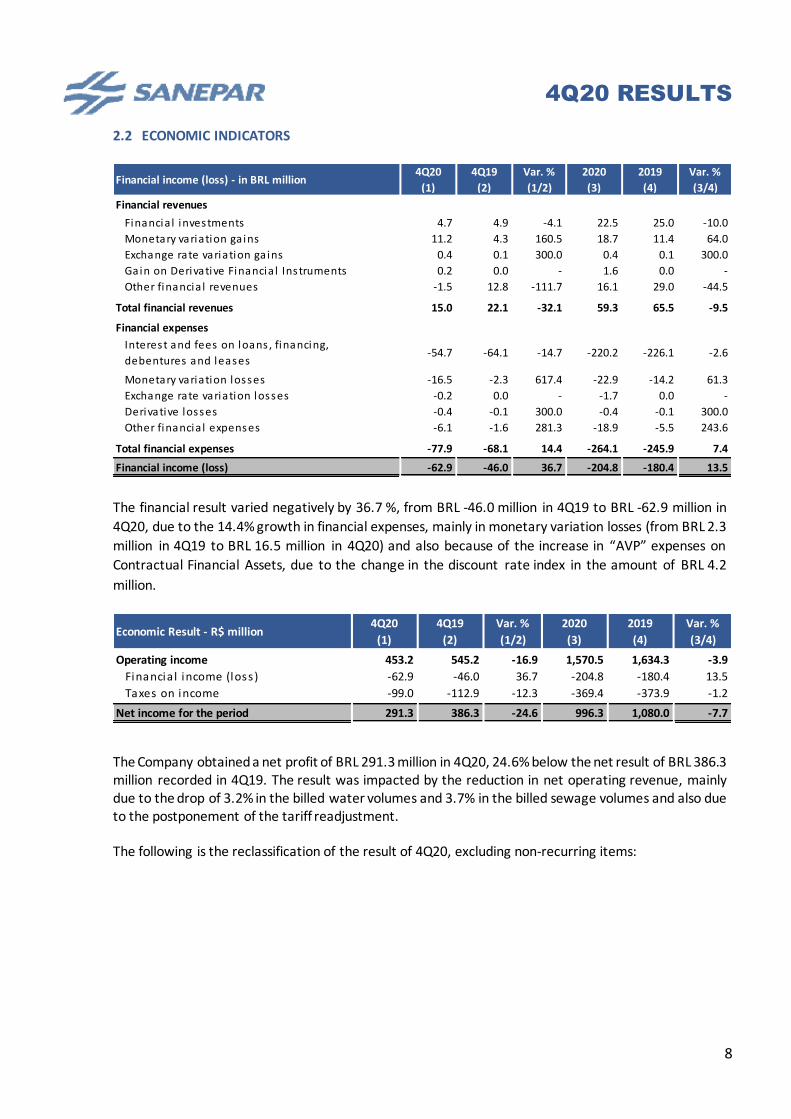
2.2 ECONOMIC INDICATORS
The financial result varied negatively by 36.7 %, from BRL -46.0 million in 4Q19 to BRL -62.9 million in
4Q20, due to the 14.4% growth in financial expenses, mainly in monetary variation losses (from BRL 2.3
million in 4Q19 to BRL 16.5 million in 4Q20) and also because of the increase in “AVP” expenses on
Contractual Financial Assets, due to the change in the discount rate index in the amount of BRL 4.2
million.
The Company obtained a net profit of BRL 291.3 million in 4Q20, 24.6% below the net result of BRL 386.3 million recorded in 4Q19. The result was impacted by the reduction in net operating revenue, mainly due to the drop of 3.2% in the billed water volumes and 3.7% in the billed sewage volumes and also due to the postponement of the tariff readjustment. The following is the reclassification of the result of 4Q20, excluding non-recurring items:
Financial income (loss) - in BRL million4Q20
(1)
4Q19
(2)
Var. %
(1/2)
2020
(3)
2019
(4)
Var. %
(3/4)
Financial revenues
Financia l investments 4.7 4.9 -4.1 22.5 25.0 -10.0
Monetary variation ga ins 11.2 4.3 160.5 18.7 11.4 64.0
Exchange rate variation ga ins 0.4 0.1 300.0 0.4 0.1 300.0
Gain on Derivative Financia l Instruments 0.2 0.0 - 1.6 0.0 -
Other financia l revenues -1.5 12.8 -111.7 16.1 29.0 -44.5
Total financial revenues 15.0 22.1 -32.1 59.3 65.5 -9.5
Financial expenses
Monetary variation losses -16.5 -2.3 617.4 -22.9 -14.2 61.3
Exchange rate variation losses -0.2 0.0 - -1.7 0.0 -
Derivative losses -0.4 -0.1 300.0 -0.4 -0.1 300.0
Other financia l expenses -6.1 -1.6 281.3 -18.9 -5.5 243.6
Total financial expenses -77.9 -68.1 14.4 -264.1 -245.9 7.4
Financial income (loss) -62.9 -46.0 36.7 -204.8 -180.4 13.5
Interest and fees on loans , financing,
debentures and leases-2.6-54.7 -64.1 -14.7 -220.2 -226.1
Economic Result - R$ million4Q20
(1)
4Q19
(2)
Var. %
(1/2)
2020
(3)
2019
(4)
Var. %
(3/4)
Operating income 453.2 545.2 -16.9 1,570.5 1,634.3 -3.9
Financia l income (loss) -62.9 -46.0 36.7 -204.8 -180.4 13.5
Taxes on income -99.0 -112.9 -12.3 -369.4 -373.9 -1.2
Net income for the period 291.3 386.3 -24.6 996.3 1,080.0 -7.7

4Q20 RESULTS
9
* Information not reviewed by independent auditors.
Sanepar’s growth and development strategy to operate on a public utility service market, also open to the private initiative, is based on the search for effective results, commitment to the quality of services provided and, in particular to addressing the needs of the granting power and shareholders. The figures below display the economic-financial results achieved by the Company in supporting the investment programs, providing adequate conditions for the delivery of future demands.
* CVM Instruction 527/12 - Information not reviewed by independent auditors.
At the close of 4Q20, the Company's total assets reached BRL 13,190.9 million (BRL 11,939.6 million at 12/31/2019), while total debt at the end of 4Q20 was BRL 6,247.7 million (BRL 5,765.7 million. million on 12/31/2019). Of the total debt, BRL 3,647.6 million (BRL 3,080.4 million at 12/31/2019) refer to loans, financing, debentures and leases, an increase of 18.4% compared to the end of the year of 2019.
Non-recurrent items - In BRL million * 4Q20 4Q19 2020 2019
Net income 291.3 386.3 996.3 1,080.0
PAI - Incentive Reti rement Program 5.0 - 132.8 -
NPV expenses on contractual financia l assets - - 11.1 -
Provis ion - Consortium DM/LFM/SEF - - 15.2 -
IBAMA Insta l lments 19.0 - 19.0 -
Compensation to the ci ty of Maringá - - - 28.7
Impairment - CS Bioenergia S/A -0.7 17.3 -0.7 17.3
Tax effects -7.9 -5.9 -60.3 9.2
Pro forma net income 306.7 397.7 1,113.4 1,135.2
Net margin of non-recurrent i tems 24.8 29.7 23.2 23.6
Adjusted EBITDA of non-recurrent i tems 570.5 648.5 2,109.8 2,017.7
Adjusted EBITDA margin of non-recurrent i tems 46.1 48.4 44.0 42.7
Distribution of the Economic Wealth Generated - In
BRL million
4QT20
(1)
4Q19
(2)
Var. %
(1/2)
2020
(3)
2019
(4)
Var. %
(3/4)
Personnel remuneration 252.9 247.9 2.0 1,123.8 1,002.2 12.1
Government Compensation (Taxes) 231.2 260.0 -11.1 901.0 906.7 -0.6
Third-party compensation (Rents) 1.2 1.3 -7.7 4.3 4.5 -4.4
Return on debt capita l (interest and monetary
variations)77.9 68.1 14.4 264.1 245.9 7.4
Interest on Equity and dividends 145.7 156.2 -6.7 296.4 330.4 -10.3
Net income for the period not dis tributed 145.6 230.0 -36.7 699.9 749.6 -6.6
Total Economic Wealth 854.5 963.5 -11.3 3,289.5 3,239.3 1.5
Economic Indicators - In BRL million4Q20
(1)
4Q19
(2)
Var. %
(1/2)
2020
(3)
2019
(4)
Var. %
(3/4)
Net operating revenue 1,236.9 1,339.6 -7,7 % 4,799.7 4,722.8 1,6 %
Operating profi t 453.2 545.2 -16,9 % 1,570.5 1,634.3 -3,9 %
Net income 291.3 386.3 -24,6 % 996.3 1,080.0 -7,7 %
% Operating margin 29.3 34.6 -5,3 p.p. 26.5 28.6 -2,1 p.p.
% Net margin 23.6 28.8 -5,2 p.p. 20.8 22.9 -2,1 p.p.
% Return on average shareholders ' equity 4.4 6.3 -1,9 p.p. 15.2 18.2 -3,0 p.p.
Net debt/ EBITDA (Accumulated 12 month) * - - - 1.4 1.4 -

4Q20 RESULTS
10
* BRL 12.26 in December of 2019. Values adjusted to the split occurred on 03/30/2020.
** CVM Instruction No. 527 / 12 - Information not reviewed by independent auditors.
EBITDA and Generation of Operating Cash EBITDA in 4Q20, which represents the Company's operating result, was BRL 547.2 million, against BRL 631.2 million in 4Q19. The EBITDA margin went from 47.1% to 44.2%. This drop in performance was due to the 7.7% decrease in net revenue. However, there was also a 2.6% reduction in costs and expenses that impact EBITDA. Operating cash flow in 4Q20 was BRL 270.6 million, a 33.2% reduction compared to 4Q19. The EBITDA Conversion into Operating Cash was of 49.4%, due to the postponed taxes payment effect, and due to to the Incentive Retirement Program payment, that is, the effect of Cash only.
* CVM Instruction No. 527 / 12 - Information not reviewed by independent auditors.
2.3 INVESTMENTS
The investments made in the 4Q20 totaled BRL 263.5 million (BRL 274.6 million in 4Q19), as shown below:
2.4 INDEBTEDNESS Gross debt increased from BRL 3,080.4 million in December 2019 to BRL 3,647.6 in December 2020, representing an increase of BRL 567.2 million. Net debt went from BRL 2,806.3 million in December 2019 to BRL 2,773.3 million in December 2020. In 2020, BRL 350.0 million was released referring to the 10th Debentures Issuance and BRL 200.0 million was raised through the issuance of Bank Credit Card - CCB from Banco BTG Pactual S.A.
Reference DEC/20 DEC/19 Var.
Equity BRL million 6,943.2 6,173.9 12,5 %
Share value * BRL 4.59 4.09 12,2 %
Indebtedness level ** % 47.4 48.3 -0,9 p.p.
Current ratio ** BRL 1.21 0.91 33,0 %
Quick ratio ** BRL 1.17 0.87 34,5 %
EBITDA - R$ Million *4Q20
(1)
4Q19
(2)
Var. %
(1/2)
2020
(3)
2019
(4)
Var. %
(3/4)
Net income for the period 291.3 386.3 -24,6 % 996.3 1,080.0 -7,7 %
(+) Taxes on Income 99.0 112.9 -12,3 % 369.4 373.9 -1,2 %
(+) Financia l income (loss ) 62.9 46.0 36,7 % 204.8 180.4 13,5 %
(+) Depreciation and amortization 94.0 86.0 9,3 % 361.9 337.4 7,3 %
EBITDA 547.2 631.2 -13,3 % 1,932.4 1,971.7 -2,0 %
% EBITDA Margin 44.2 47.1 -2,9 p.p. 40.3 41.7 -1,4 p.p.
% EBITDA convers ion into cash 49.4 64.1 -14,7 p.p. 82.6 74.1 8,5 p.p.
Investments – R$ Million4Q20
(1)
4Q19
(2)
Var. %
(1/2)
2020
(3)
2019
(4)
Var. %
(3/4)
Water 139.6 126.7 10.2 472.7 459.7 2.8
Sewage 102.4 121.7 -15.9 419.7 454.2 -7.6
Other investments 21.5 26.2 -17.9 76.5 113.2 -32.4
Total 263.5 274.6 -4.0 968.9 1,027.1 -5.7
4Q20 RESULTS
11
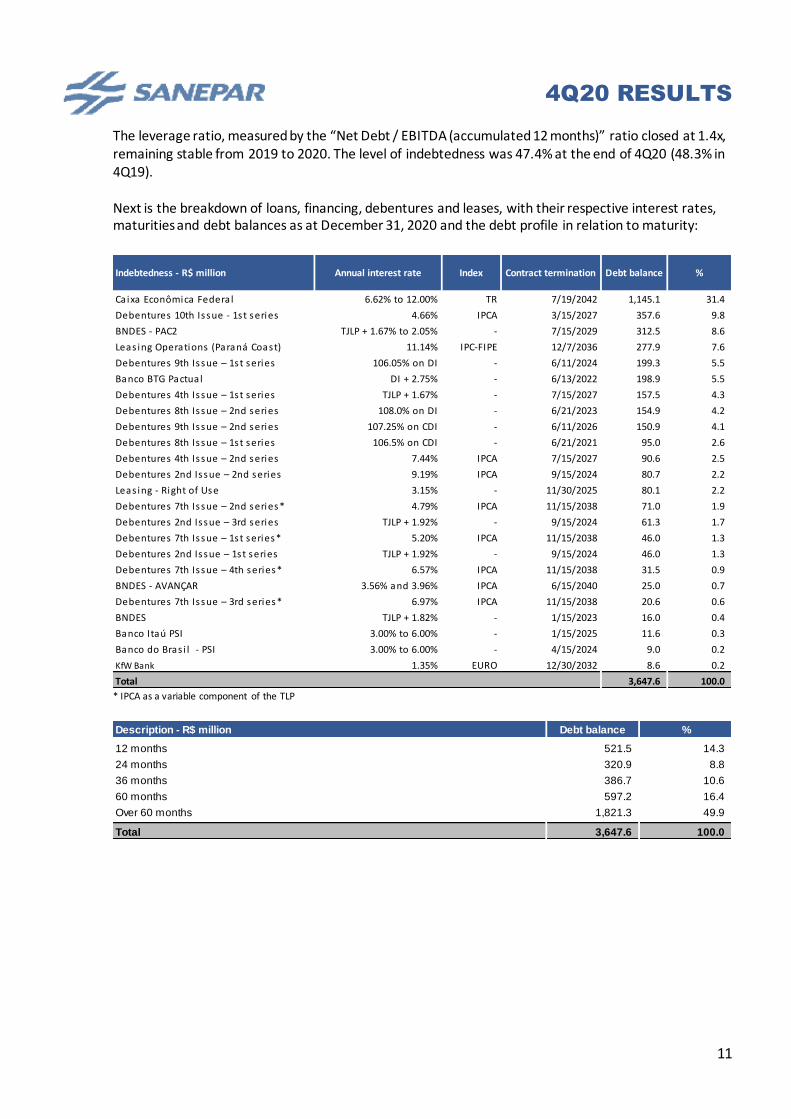
The leverage ratio, measured by the “Net Debt / EBITDA (accumulated 12 months)” ratio closed at 1.4x, remaining stable from 2019 to 2020. The level of indebtedness was 47.4% at the end of 4Q20 (48.3% in 4Q19). Next is the breakdown of loans, financing, debentures and leases, with their respective interest rates, maturities and debt balances as at December 31, 2020 and the debt profile in relation to maturity:
* IPCA as a variable component of the TLP
Indebtedness - R$ million Annual interest rate Index Contract termination Debt balance %
Caixa Econômica Federa l 6.62% to 12.00% TR 7/19/2042 1,145.1 31.4
Debentures 10th Issue - 1st series 4.66% IPCA 3/15/2027 357.6 9.8
BNDES - PAC2 TJLP + 1.67% to 2.05% - 7/15/2029 312.5 8.6
Leas ing Operations (Paraná Coast) 11.14% IPC-FIPE 12/7/2036 277.9 7.6
Debentures 9th Issue – 1st series 106.05% on DI - 6/11/2024 199.3 5.5
Banco BTG Pactual DI + 2.75% - 6/13/2022 198.9 5.5
Debentures 4th Issue – 1st series TJLP + 1.67% - 7/15/2027 157.5 4.3
Debentures 8th Issue – 2nd series 108.0% on DI - 6/21/2023 154.9 4.2
Debentures 9th Issue – 2nd series 107.25% on CDI - 6/11/2026 150.9 4.1
Debentures 8th Issue – 1st series 106.5% on CDI - 6/21/2021 95.0 2.6
Debentures 4th Issue – 2nd series 7.44% IPCA 7/15/2027 90.6 2.5
Debentures 2nd Issue – 2nd series 9.19% IPCA 9/15/2024 80.7 2.2
Leas ing - Right of Use 3.15% - 11/30/2025 80.1 2.2
Debentures 7th Issue – 2nd series* 4.79% IPCA 11/15/2038 71.0 1.9
Debentures 2nd Issue – 3rd series TJLP + 1.92% - 9/15/2024 61.3 1.7
Debentures 7th Issue – 1st series* 5.20% IPCA 11/15/2038 46.0 1.3
Debentures 2nd Issue – 1st series TJLP + 1.92% - 9/15/2024 46.0 1.3
Debentures 7th Issue – 4th series* 6.57% IPCA 11/15/2038 31.5 0.9
BNDES - AVANÇAR 3.56% and 3.96% IPCA 6/15/2040 25.0 0.7
Debentures 7th Issue – 3rd series* 6.97% IPCA 11/15/2038 20.6 0.6
BNDES TJLP + 1.82% - 1/15/2023 16.0 0.4
Banco Itaú PSI 3.00% to 6.00% - 1/15/2025 11.6 0.3
Banco do Bras i l - PSI 3.00% to 6.00% - 4/15/2024 9.0 0.2
KfW Bank 1.35% EURO 12/30/2032 8.6 0.2
Total 3,647.6 100.0
Description - R$ million Debt balance %
12 months 521.5 14.3
24 months 320.9 8.8
36 months 386.7 10.6
60 months 597.2 16.4
Over 60 months 1,821.3 49.9
Total 3,647.6 100.0
4Q20 RESULTS
12
3. REGULATIONS The Company was authorized by AGEPAR - Agência Reguladora de Serviços Públicos Delegados do Paraná (Delegated Public Infrastructure Utility Services Regulatory Agency of the State of Paraná) by means of Ratifying Resolution No. 003. of April 17 to apply a rate adjustment of 25.63% as provided for in article 3: “Article 3 – Define that the application of the tariff revision approved pursuant to Article 2 of this Resolution will be deferred in 8 (eight) years, with the first installment corresponding in the year 2017 to an average repositioning of 8.53% (eight point fifty three percent), and the others in 7 (seven) installments of 2.11% (two point eleven percent), plus the corresponding financial correction and economic correction, which will be applied by applying the weighted average rate of daily financing as established in the Special System of Settlement and Custody (SELIC), in the terms defined in the Technical Note approved in Article 1 of this Resolution.” In accordance with Technical Orientation OCPC 08 – Recognition of Certain Assets and Liabilities in Financial Reporting of Energy Distributors issued pursuant to Brazilian and International Accounting Standards. the Company does not record in its Financial Statements the amounts receivable resulting from deferral. considering that: (i) the realization or payment of these amounts depend of a future event not fully under the control of the entity – future billing of water and sewage services; (ii) it is not possible to know. when the receivables are generated. which are the debtors of these amounts; and (iii) the actual receipt of these amounts shall only occur if the concession is maintained. The estimate of the amount receivable resulting from the difference between the Required Revenue and Verified Revenue will be measured and disclosed throughout the period of the deferral, and until December 30, 2020, the best estimate, represents BRL 1.583 billion. In real terms, from the 25.63% index to be repositioned in 2017, the Company's tariff was 13.16%, with 11.02% still to be deferred until 2024 Agepar published the Technical Notes referring to the 1st phase of the 2nd RTP Periodic Tariff Review (“2nd
RTP”), which is in public consultation until 02/17/2020.
Portion A Cost Variation Account (CVA) Portion A cost variation offsetting account corresponds to the offset of the monthly differences, whether gains or losses, calculated as a result of the variations in the costs of electricity, chemical products and segment charges, adjusted by IPCA. The CVA is determined from the historical cost verified in the period t – 1 for the three components referred to above and passed by means of adjustments in the t period. However, the basic formulation of the tariff adjustment does not guarantee the perfect pass through of non-manageable costs to consumers, given that it does not consider, for example. the differences between reference and application markets. As the calculation of the tariff adjustment assumes that exactly the same volume (m3) verified upon the calculation of the adjustment will happen in the following period, by the end of t period the balance of CVA would be zero. Up to December 2020, the Company’s CVA ascertained in a managerial way a positive balance of BRL 45.6 million that Sanepar shall recover.

4Q20 RESULTS
13
Adjusted EBTIDA with non-manageable items - Information not reviewed by independent auditors The Company is announcing pro forma adjusted EBITDA with non-manageable items as a metric to analyze the impacts of the offsetting of the "A" portion (electrical energy, treatment material, fees and charges) of the tariff model. Adjusted EBITDA with non-manageable items is a non-accounting measurement and should not be considered in isolation as an operating indicator or cash flow or to measure the Company's liquidity or debt capacity. Below we present the calculation of Adjusted EBITDA based on EBITDA, which follows ICVM 527/12, considering the estimated values of non-manageable items, accumulated up to December 30, 2020:
* Information not reviewed by the independent auditors
Tariff Adjustment On February 18, 2020, the Company filed the request for Tariff Adjustment Index - IRT 2020 with the Regulatory Agency for Public Services Delegates of Paraná - AGEPAR, with the approval expected until April 17, 2020 and application from 17 May 2020, however, the Board of Directors of AGEPAR approved on April 17, 2020, through Extraordinary Meeting No. 009 / 2020 / RCDE, the suspension of the application of tariff adjustments for 60 (sixty) days, due to the pandemic of COVID-19. On July 9, 2020, through Ordinance 017/2020, AGEPAR extended the suspension for a further 60 days, starting on June 17, 2020. At a meeting held on August 25, 2020, AGEPAR decided to approve the percentage of the annual tariff readjustment of 9.6299%, according to resolution No. 19 / 2020, whose application would take place as of October 31, 2020. However, in September 1st, 2020, AGEPAR decided, in an extraordinary meeting, to suspend the effects of resolution No. 19 / 2020, due to the mediation procedure established by AGEPAR between the Government of the State of Paraná and the Company. The form of recomposition of the values resulting from the suspension of the adjustment will be defined in due course by AGEPAR.
On December 29, 2020, at its Ordinary Meeting No. 29 / 2020, AGEPAR declared the mediation process
closed. It also decided to revoke Resolution No. 19 / 2020 and partially approve Sanepar's readjustment
request for 2020, approving the index of 5.11%, which according to Resolution No. 040 / 2020 will be
applied from February 5, 2021. The new index was the result of the provisional suspension of the 4 th
installment of the tariff deferral, originating from 1st RTP / 2017 and the replacement of the IGP-M
inflations index by the IPCA inflation index in the index basket.
The agency also defined that the compensation for the delay in granting the tariff adjustment, in the
period between May 2020 and February 2021, should be considered in the 2nd RTP. On 01/25/2021, the
Company forwarded to AGEPAR a request for compensation of the amounts arising from the replacement
of the IGP-M inflation index by the IPCA inflation index in the Tariff Adjustment Index “IRT” of 2020.
EBITDA - R$ million * 2020
EBITDA 1,932.4
(+) Non-manageable items 45.6
Electrici ty (8.9)
Treatment materia l 40.9
Fee and charges 13.6
(=) Adjusted EBITDA with non-manageable items 1,978.0
% EBITDA Margin with non-manageable i tems 41.2

4Q20 RESULTS
14
4. CAPITAL MARKET
4.1. SHAREHOLDING COMPOSITION OF CAPITAL
The Share Capital is composed of 1,511,205,519 shares, of which 503,735,259 are common stocks and
1,007,470,260 are preferred stocks without par value, fully paid up by natural persons and legal entities
resident and domiciled in Brazil and abroad.
The subscribed and paid up share capital in December 2020 is R$ 4,000.0 million with its shareholding
composition, as at 12/31/2020, represented below.
Ownership Breakdown – 12/31/2020
ON PN Total ON PN Total Voting
Capital
Total
Capital
ESTADO DO PARANA 302,658,716 3 302,658,719 801,105 0 801,105 60.08% 20.03%
LETKO BROSSEAU EMERG MKTS EQT FUND 5,421,500 21,686,000 27,107,500 14,422 57,559 71,981 1.08% 1.79%
MORGAN STANLEY URUGUAY LTDA 4,552,065 19,672,861 24,224,926 13,265 53,060 66,325 0.90% 1.60%
WELLINGTON TRUST COMPANY N.A. 3,908,704 15,634,816 19,543,520 9,585 38,338 47,923 0.78% 1.29%
VANGUARD EMERGING MARKETS STOCK
INDEX FUND 3,306,464 13,225,856 16,532,320 9,139 36,556 45,695 0.66% 1.09%
MUNICIPALITIES (71) - 5,572,423 5,572,423 - 14,750 14,750 0.00% 0.37%
OTHER NAT'L SHAREHOLDERS (292.549) 111,462,693 547,882,430 659,345,123 260,086 1,269,811 1,529,897 22.12% 43.64%
OTHER FOREIGN SHAREHOLDERS (392) 72,425,117 383,795,871 456,220,988 225,732 1,196,592 1,422,324 14.38% 30.19%
TOTAL 503,735,259 1,007,470,260 1,511,205,519 1,333,334 2,666,666 4,000,000 100.00% 100.00%
SHAREHOLDERS
% of shareholdingShare Capital - BRL thousandsShares

4Q20 RESULTS
15
4.2. SECURITIES
* Adjusted to the split occurred on 03/30/2020
The equity value of each share in 4Q20 was R$ 4.59, while in 4Q19, R$ 4.09 was recorded (adjusted due
to the stock split event).
Comparison between equity value and market value (in BRL)*
* Adjusted to the split occurred on 03/30/2020
Common Shares SAPR3 R$ 17.40 R$ 5.80 R$ 6.00 3.45%
Preferred Shares SAPR4 R$ 21.08 R$ 7.03 R$ 5.10 -27.42%
Units SAPR11 R$ 101.42 R$ 33.81 R$ 26.00 -23.09%
Variation between
4Q19 and 4Q20*Securities Ticker Closing Value 4Q20
Adjusted Closing
Value 4Q19*Closing Value 4Q19

4Q20 RESULTS
16
Evolution of Units (in BRL)*
* Adjusted to the split occurred on 03/30/2020
4.3 PAYOUT According to the Bylaws, the portion referring to the mandatory dividend may not be less than 25% of adjusted net profit, pursuant to article 202 of Law 6.404/76. Under the current dividend policy, Management may, in addition to the mandatory annual dividend, observing the financial health and public interest that motivated the incorporation of the Company, approve the distribution as an additional Dividend and / or Interest on Capital (“IoC”) of up to 25% of net profit. For shareholders of preferred stocks, Dividend / Interest on Capital per share 10% higher than that assigned to common stocks, was assigned. The remuneration credit to the Company's shareholders is assigned based on the shareholding position on the last working day of June and December of each financial year. And any negotiations subsequent to the credit are considered as ex-dividends (interest on shareholders' equity and dividends). For the first half of 2020, the calculated (gross) value of Interest on Capital, observing the legal limit of
the TJLP variation in the period, was BRL 150,687,449.07. This amount is in lieu of Mandatory
Dividends, according to the statutory forecast and based on the income calculated in the first half of
2020. The Interest on Capital was resolved by the Board of Directors at its 6th/2020 Ordinary Meeting of
June 25, 2020 and informed to the market in the Notice to Shareholders of the same date, considering
the shareholding position of June 30, 2020.
For the second half of 2020, the calculated (gross) value of Interest on Capital, observing the legal limit
of the TJLP variation in the period, was BRL 145,740,318.85. This amount is in lieu of Mandatory
Dividends, according to the statutory forecast and based on the income calculated in the second half of
2020. The Interest on Capital was resolved by the Board of Directors at its 12th/2020 Ordinary Meeting
of December 18, 2020 and informed to the market in the Notice to Shareholders of the same date,
considering the shareholding position of December 30, 2020.

4Q20 RESULTS
17
Interest on Capital is subject to the incidence of Income Tax, except for shareholders who declare
themselves immune or exempt.
Earnings per Share:
* Adjusted to the split occurred on 03/30/2020
Remuneration to shareholders:
5. OTHER INFORMATION
5.1 CORONAVIRUS (COVID-19) IMPACT The Company disclosed the impacts of the new coronavirus pandemic (COVID-19) in Explanatory Note No. 31 to the Interim Financial Statements for the 4Q20.
Common Shares R$ 0,20498 R$ 0,09348 R$ 0,09041
Preferred Shares R$ 0,22547 R$ 0,10283 R$ 0,09945
Units R$ 1,10687 R$ 0,50480 R$ 0,48823
Total per Share
2019*IoC 1st Half 2020 IoC 2nd Half 2020Security

4Q20 RESULTS
18
Income Statement 4Q20 4Q19 4Q18
Net Operating Revenue 1,236.9 1,339.6 1,097.9
Costs of Services Provided -476.3 -501.2 -442.7
Gross Profit 760.6 838.4 655.2
Operating Expenses -307.4 -293.2 -249.8
Commercial -116.1 -92.3 -86.4
Administrative -142.1 -162.8 -161.0
Losses due to non-recoverability of assets 1.1 -19.4 -1.4
Civil, Labor, Tax & Environmental Provisions 8.4 0.3 56.2
Retirement and Health Care Plan Provisions -10.7 -15.2 -11.6
Profit Sharing Program -31.9 -0.2 -39.9
Other Operating Expenses (Revenues) -16.2 -2.4 -4.8
Equity Results Method 0.1 -1.2 -0.9
Income Before Financial Result and Taxes 453.2 545.2 405.4
Financial Result -62.9 -46.0 -48.4
Financial Revenues 15.0 22.1 13.0
Financial Expenses -77.9 -68.1 -61.4
Result before taxes on the profit 390.3 499.2 357.0
Income Tax and Social Contribution on the Profit -99.0 -112.9 -37.0
Net Profit in the Period 291.3 386.3 320.0

4Q20 RESULTS
19
Balance Sheet - Assets DEC/20 DEC/19 DEC/18
Current Assets
Cash & Cash Equivalent 874.3 274.1 326.6
Accounts Receivable from Customers 779.4 809.7 639.1
Stocks 53.9 46.1 39.1
Taxes to Recover 6.8 0.3 15.4
Linked Deposits 4.7 2.9 6.7
Derivative Financial Instruments 9.5 - -
Other Accounts Receivable 27.7 37.6 37.6
Total Current Assets 1,756.3 1,170.7 1,064.5
Non-current Assets
Accounts Receivable from Customers 20.2 19.8 22.1
Deferred Income Tax & Social Contribution 656.5 629.1 490.9
Linked Deposits 56.9 55.7 52.9
Judicial Deposits 320.5 297.8 203.5
Derivative Financial Instruments - 2.0 -
Contractual Financial Assets 490.1 435.2 375.9
Contracts Assets 1,634.8 1,756.7 1,393.2
Other Accounts Receivable 45.9 48.6 50.6
Investments 2.4 2.7 22.6
Fixed Asset 286.0 297.7 168.8
Intangible Asset 7,921.3 7,223.6 6,936.3
Total Non-current Assets 11,434.6 10,768.9 9,716.8
Total Assets 13,190.9 11,939.6 10,781.3

4Q20 RESULTS
20
Balance Sheet - Liabilities DEC/20 MAR DEC/19 DEC/18
Current Liabilities
Labor Obligations 181.4 119.5 151.4
Suppliers 209.4 214.5 190.7
Tax Obligations 72.7 100.8 68.1
Loans & Financing 521.5 357.2 478.8
Dividends & IoC - Payable 206.2 229.3 183.7
Concession Contracts - 31.4 60.5
Contractual Collateral and Withholding 2.3 2.2 2.5
Revenue to be Appropriated 4.2 4.2 4.2
Derivative Financial Instruments 8.2 - -
Other Bills to Pay 77.3 56.5 68.2
Retirement and Health Care Plan Provisions 78.1 82.4 62.8
Labor Provisions 87.6 93.4 87.9
Total Current Liabilities 1,448.9 1,291.4 1,358.8
Non-current Liabilities
Suppliers 4.4 - -
Loans & Financing 3,126.1 2,723.2 2,292.5
Taxes and Contributions 0.1 0.6 1.0
Revenue to be Appropriated 0.7 4.9 9.1
Derivative Financial Instruments - 2.0 -
Other Bills to Pay 29.6 42.7 61.9
Retirement and Health Care Plan Provisions 1,093.2 1,154.2 879.0
Provisions 544.7 546.7 461.8
Total Non-current Liabilities 4,798.8 4,474.3 3,705.3
Total Liabilities 6,247.7 5,765.7 5,064.1
Equity
Issued Capital Share 3,996.1 2,851.1 2,851.1
Revaluation Reserve 64.3 69.5 75.1
Profit Reserve 2,853.6 3,306.8 2,689.1
Equity Valuation Adjustments 4.7 5.2 5.7
Other Statements of Comprehensive Income 24.5 -58.7 96.2
Total Shareholders' Equity 6,943.2 6,173.9 5,717.2
Total Liabilities and Shareholders' Equity 13,190.9 11,939.6 10,781.3

4Q20 RESULTS
21
Cash Flow Statement 4Q20 4Q19 4Q18
Cash Flow From Operating Activities
Net Profit in the Period 291.3 386.3 320.0
Adjustments to reconcile net profit and net cash Depreciation & Amortization 94.0 86.0 70.3 Costs of wri te-offs in fixed and intangible assets 3.9 3.4 2.6 Adjustment to Recoverable Value of Assets -1.1 19.2 1.2 Adjustment to Present Value - Financia l Assets 0.9 -10.9 3.1 Provis ion for Losses in credit rea l i zations 34.7 6.1 2.3 Deferred Income Tax & Socia l Contribution, net -5.9 -16.2 -29.8 Civi l , Labor, Tax and Environmental Provis ions -8.4 -0.3 -56.2 Reti rement & Health Care Plan 10.7 15.2 11.6 Interest of Financing 50.5 49.3 55.1 Monetary Variations on Financing 17.0 2.4 6.3
Interest and Monetary Updates on Leas ing 8.4 19.8 0.0
Exchange Variations , net -0.2 0.0 0.0
Financia l Derivatives Variation 0.1 0.0 0.0
Result of Equity Method -0.1 1.2 0.9 Appropriation of costs on the third parties fundra is ing 0.8 0.1 0.2 Fa i r Va lue Adjustment - Investments -0.2 -0.3 -0.1
496.4 561.3 387.5
Variation in Assets & Liabilities Accounts Receivable from Customers -60.4 -103.1 -21.2 Taxes and Contributions to recover -0.4 0.0 -14.8 Stocks -5.2 -2.3 -1.2 Judicia l Depos i ts -16.9 -4.0 -4.8 Other Credits and Accounts Receivable 21.8 22.8 23.2 Suppl iers 21.4 20.2 27.5 Concess ion Contracts 0.0 0.4 0.2 Taxes and Contributions 57.4 144.9 88.3 Sa laries and Charges Payable -118.2 -69.9 -19.2 Contractual Col latera l and Withholding 0.1 0.0 -0.3 Revenues to be Appropriated -1.1 -1.1 -1.0 Income Tax and Socia l Contribution, pa id -144.8 -147.0 -109.4 Other Accounts to pay 20.5 -17.5 1.0
-225.8 -156.6 -31.7
Cash Generated by Operating Activities 270.6 404.7 355.8
Cash Flow from Investments Investment in Fixed & Intagible Assets -263.5 -274.6 -281.4 Investments Appl ication - -2.5 -3.7
Cash Generated by Investment Activities -263.5 -277.1 -285.1
Cash Flow from Financing Activities Financing Obtained 98.7 93.2 111.9 Amortization on Financing -125.2 -123.7 -116.8 Interest Payments on Financing -48.6 -60.1 -58.2 Leas ing Payments -20.0 -20.4 -1.8 Costs in the Third Parties Fundra is ing -1.1 0.0 0.8
Linked Depos i ts 0.2 0.3 -2.7
Payment of Interest on Equity (IoE) -0.2 -0.3 0.0
Cash Generated by Financing Activities -96.2 -111.0 -66.8
Variation in Cash and Cash Equivalent Balance -89.1 16.6 3.9
Cash and Cash Equiva lent Ini tia l Ba lance 963.4 257.5 322.7
Cash and Cash Equivalent Final Balance 874.3 274.1 326.6