4th quarter 2012 | sacramento office market update
DESCRIPTION
Overall performance during 4th Quarter 2012 in the Sacramento o ffice market was the strongest in seven years.TRANSCRIPT
Sacramento Office Insights | Volume 4 | 4th Quarter 2012
Accelerating success.
Office Report
Overall performance during 4th Quarter 2012 in the Sacramento o�ce market was the strongest in seven years:
Sacramento O�ce Market
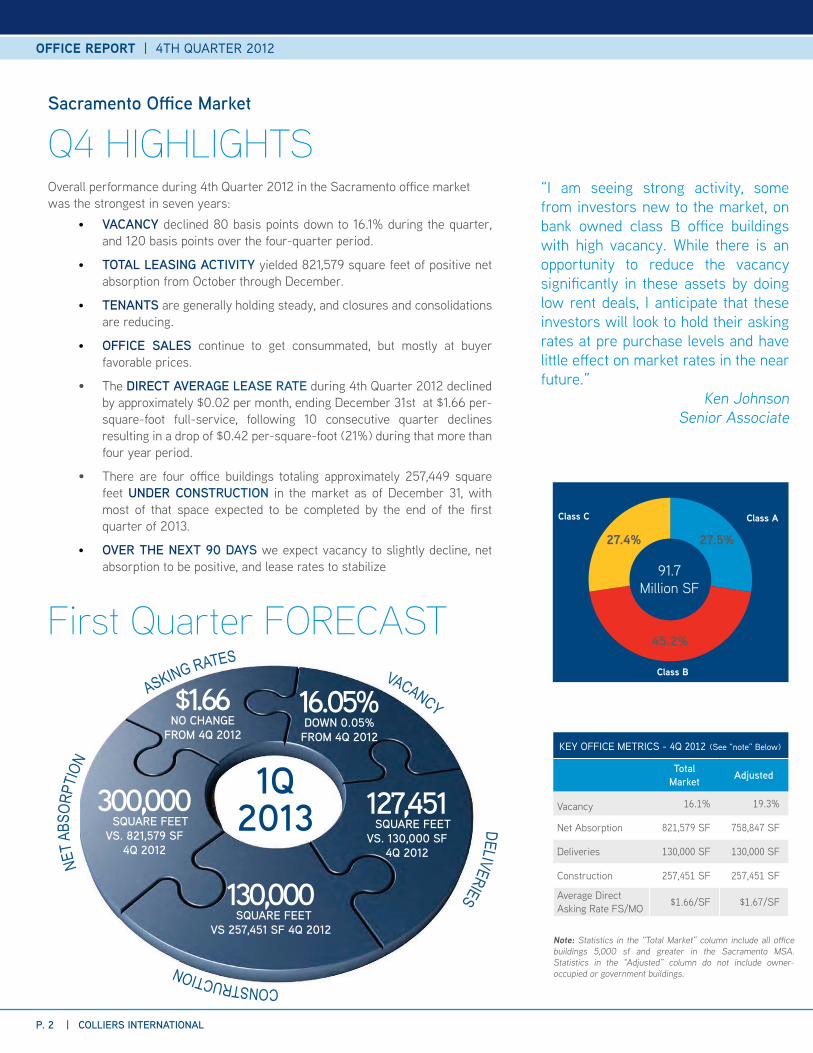
Q4 HIGHLIGHTS
KEY OFFICE METRICS - 4Q 2012 (See “note” Below)
Total Market Adjusted
Vacancy 16.1% 19.3%
Net Absorption 821,579 SF 758,847 SF
Deliveries 130,000 SF 130,000 SF
Construction 257,451 SF 257,451 SF
Average Direct Asking Rate FS/MO $1.66/SF $1.67/SF
• VACANCY declined 80 basis points down to 16.1% during the quarter, and 120 basis points over the four-quarter period.
• TOTAL LEASING ACTIVITY yielded 821,579 square feet of positive net absorption from October through December.
• TENANTS are generally holding steady, and closures and consolidations are reducing.
• OFFICE SALES continue to get consummated, but mostly at buyer favorable prices.
• The DIRECT AVERAGE LEASE RATE during 4th Quarter 2012 declined by approximately $0.02 per month, ending December 31st at $1.66 per-square-foot full-service, following 10 consecutive quarter declines resulting in a drop of $0.42 per-square-foot (21%) during that more than four year period.
• There are four o�ce buildings totaling approximately 257,449 square feet UNDER CONSTRUCTION in the market as of December 31, with most of that space expected to be completed by the end of the ¤rst quarter of 2013.
• OVER THE NEXT 90 DAYS we expect vacancy to slightly decline, net absorption to be positive, and lease rates to stabilize
Note: Statistics in the “Total Market” column include all o�ce buildings 5,000 sf and greater in the Sacramento MSA. Statistics in the “Adjusted” column do not include owner-occupied or government buildings.
“I am seeing strong activity, some from investors new to the market, on bank owned class B o�ce buildings with high vacancy. While there is an opportunity to reduce the vacancy signi¤cantly in these assets by doing low rent deals, I anticipate that these investors will look to hold their asking rates at pre purchase levels and have little e¬ect on market rates in the near future.”
Ken JohnsonSenior Associate
27.5%
45.2%
27.4%
Class B
Class C Class A
91.7 Million SF
P. 2 | COLLIERS INTERNATIONAL
OFFICE REPORT | 4TH QUARTER 2012
First Quarter FORECASTVACANCY
DELIVERIES
CONSTRUCTION
NETA
BSOR
PTION
ASKING RATES
300,000SQUARE FEET
VS. 821,579 SF 4Q 2012
$1.66NO CHANGE
FROM 4Q 2012
16.05%DOWN 0.05%
FROM 4Q 2012
127,451SQUARE FEET
VS. 130,000 SF 4Q 2012
130,000SQUARE FEET
VS 257,451 SF 4Q 2012
1Q2013
VACANCYHEADED IN THE RIGHT DIRECTION Overall o�ce vacancy in the Sacramento region, including owner-occupied and government owned buildings, continues along a positive trajectory. During 4th Quarter 2012, the metro vacancy rate dropped another 80 basis points, ending the three-month period at 16.1%. Additionally, the current vacancy rate is 120 basis points lower than the 4th Quarter 2011 level of 17.4%.
MOVING ON UP Metro wide, the Class C sub-sector continues to hold the lowest vacancy level at 14.7%, followed by Class A at 16.4%, and then Class B at 16.9%. Much of this performance is the result of no new Class C inventory being delivered to the market since 1st Quarter 2007, while Class A deliveries since that time have totaled more than 3.4 million square feet and Class B product completions have reached 2.5 million square feet. Class B & C users continue to secure Class A space to take advantage of today’s competitive lease rate environment. Vacancy among downtown product compared to suburban inventory continues to show the desire of o�ce users to be located in, or near, the CBD, close to the large government presence operating near the State Capitol.
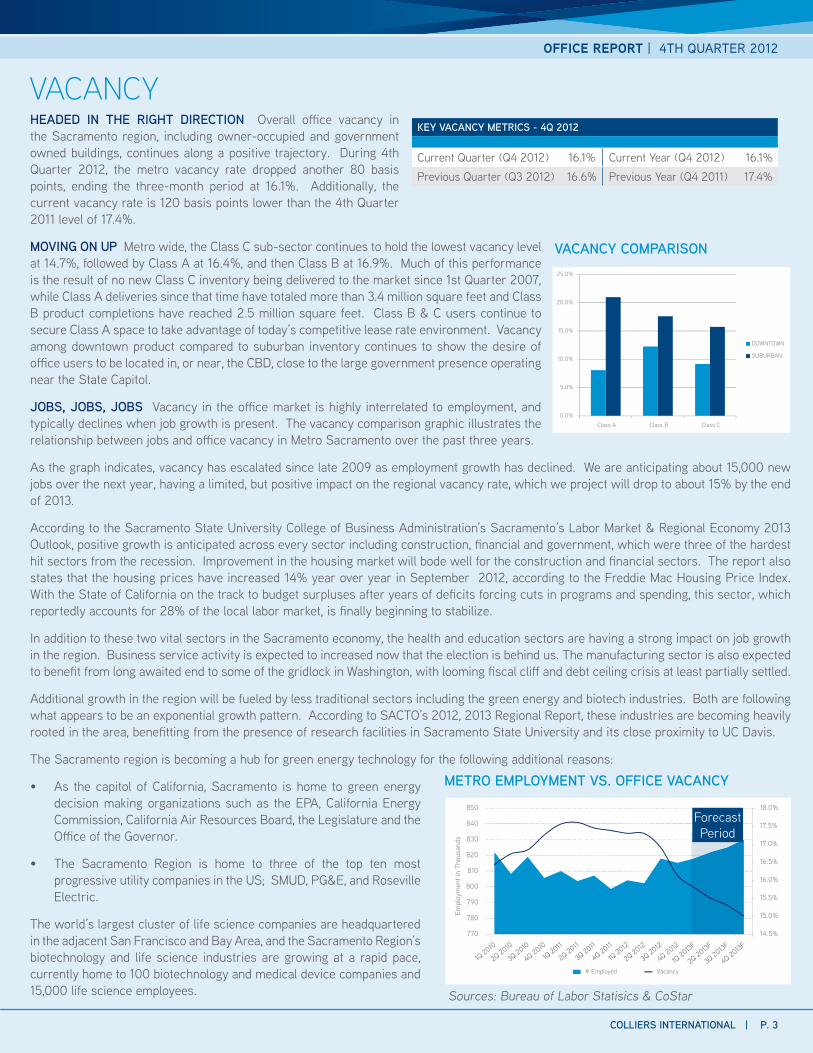
JOBS, JOBS, JOBS Vacancy in the o�ce market is highly interrelated to employment, and typically declines when job growth is present. The vacancy comparison graphic illustrates the relationship between jobs and o�ce vacancy in Metro Sacramento over the past three years.
As the graph indicates, vacancy has escalated since late 2009 as employment growth has declined. We are anticipating about 15,000 new jobs over the next year, having a limited, but positive impact on the regional vacancy rate, which we project will drop to about 15% by the end of 2013.
According to the Sacramento State University College of Business Administration’s Sacramento’s Labor Market & Regional Economy 2013 Outlook, positive growth is anticipated across every sector including construction, ¤nancial and government, which were three of the hardest hit sectors from the recession. Improvement in the housing market will bode well for the construction and ¤nancial sectors. The report also states that the housing prices have increased 14% year over year in September 2012, according to the Freddie Mac Housing Price Index. With the State of California on the track to budget surpluses after years of de¤cits forcing cuts in programs and spending, this sector, which reportedly accounts for 28% of the local labor market, is ¤nally beginning to stabilize.
In addition to these two vital sectors in the Sacramento economy, the health and education sectors are having a strong impact on job growth in the region. Business service activity is expected to increased now that the election is behind us. The manufacturing sector is also expected to bene¤t from long awaited end to some of the gridlock in Washington, with looming ¤scal cli¬ and debt ceiling crisis at least partially settled.
Additional growth in the region will be fueled by less traditional sectors including the green energy and biotech industries. Both are following what appears to be an exponential growth pattern. According to SACTO’s 2012, 2013 Regional Report, these industries are becoming heavily rooted in the area, bene¤tting from the presence of research facilities in Sacramento State University and its close proximity to UC Davis.
The Sacramento region is becoming a hub for green energy technology for the following additional reasons:
• As the capitol of California, Sacramento is home to green energy decision making organizations such as the EPA, California Energy Commission, California Air Resources Board, the Legislature and the O�ce of the Governor.
• The Sacramento Region is home to three of the top ten most progressive utility companies in the US; SMUD, PG&E, and Roseville Electric.
The world’s largest cluster of life science companies are headquartered in the adjacent San Francisco and Bay Area, and the Sacramento Region’s biotechnology and life science industries are growing at a rapid pace, currently home to 100 biotechnology and medical device companies and 15,000 life science employees.
14.5%
15.0%
15.5%
16.0%
16.5%
17.0%
17.5%
18.0%
770
780
790
800
810
820
830
840
850
Empl
oym
ent i
n Th
ousa
nds
# Employed Vacancy
METRO EMPLOYMENT VS. OFFICE VACANCY
Sources: Bureau of Labor Statisics & CoStar
Forecast Period
0.0%
5.0%
10.0%
15.0%
20.0%
25.0%
Class A Class B Class C
DOWNTOWN
SUBURBAN
VACANCY COMPARISON
KEY VACANCY METRICS - 4Q 2012
Current Quarter (Q4 2012) 16.1% Current Year (Q4 2012) 16.1%
Previous Quarter (Q3 2012) 16.6% Previous Year (Q4 2011) 17.4%
OFFICE REPORT | 4TH QUARTER 2012
COLLIERS INTERNATIONAL | P. 3
P. 4 | COLLIERS INTERNATIONAL
OFFICE REPORT | 4TH QUARTER 2012
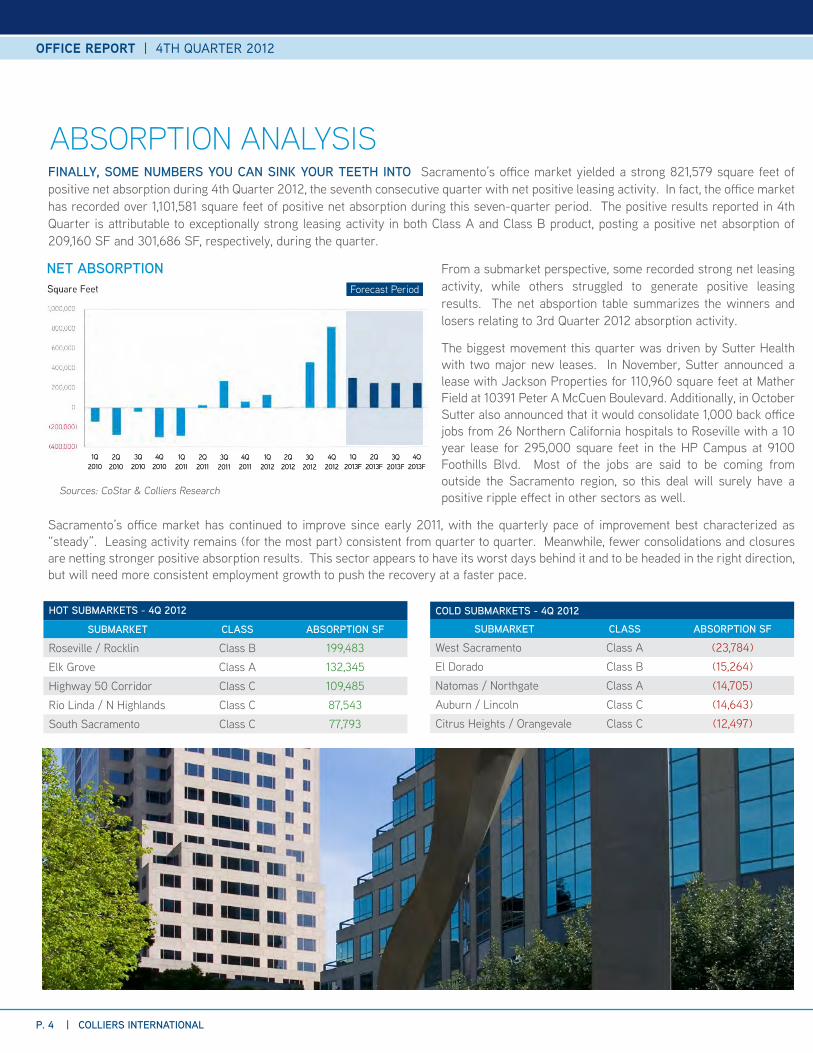
FINALLY, SOME NUMBERS YOU CAN SINK YOUR TEETH INTO Sacramento’s o�ce market yielded a strong 821,579 square feet of positive net absorption during 4th Quarter 2012, the seventh consecutive quarter with net positive leasing activity. In fact, the o�ce market has recorded over 1,101,581 square feet of positive net absorption during this seven-quarter period. The positive results reported in 4th Quarter is attributable to exceptionally strong leasing activity in both Class A and Class B product, posting a positive net absorption of 209,160 SF and 301,686 SF, respectively, during the quarter.
From a submarket perspective, some recorded strong net leasing activity, while others struggled to generate positive leasing results. The net absportion table summarizes the winners and losers relating to 3rd Quarter 2012 absorption activity.
The biggest movement this quarter was driven by Sutter Health with two major new leases. In November, Sutter announced a lease with Jackson Properties for 110,960 square feet at Mather Field at 10391 Peter A McCuen Boulevard. Additionally, in October Sutter also announced that it would consolidate 1,000 back o�ce jobs from 26 Northern California hospitals to Roseville with a 10 year lease for 295,000 square feet in the HP Campus at 9100 Foothills Blvd. Most of the jobs are said to be coming from outside the Sacramento region, so this deal will surely have a positive ripple e¬ect in other sectors as well.
Sacramento’s o�ce market has continued to improve since early 2011, with the quarterly pace of improvement best characterized as “steady”. Leasing activity remains (for the most part) consistent from quarter to quarter. Meanwhile, fewer consolidations and closures are netting stronger positive absorption results. This sector appears to have its worst days behind it and to be headed in the right direction, but will need more consistent employment growth to push the recovery at a faster pace.
NET ABSORPTION
1Q2011
4Q2010
3Q2010
2Q2010
1Q2010
4Q2011
3Q2011
2Q2011
1Q2012
4Q2012
3Q2012
2Q2012
1Q2013F
4Q2013F
3Q2013F
2Q2013F
Sources: CoStar & Colliers Research
Forecast Period
ABSORPTION ANALYSIS
HOT SUBMARKETS - 4Q 2012
SUBMARKET CLASS ABSORPTION SF
Roseville / Rocklin Class B 199,483Elk Grove Class A 132,345Highway 50 Corridor Class C 109,485Rio Linda / N Highlands Class C 87,543South Sacramento Class C 77,793
COLD SUBMARKETS - 4Q 2012
SUBMARKET CLASS ABSORPTION SF
West Sacramento Class A (23,784)El Dorado Class B (15,264)Natomas / Northgate Class A (14,705)Auburn / Lincoln Class C (14,643)Citrus Heights / Orangevale Class C (12,497)
OFFICE REPORT | 4TH QUARTER 2012
COLLIERS INTERNATIONAL | P. 5
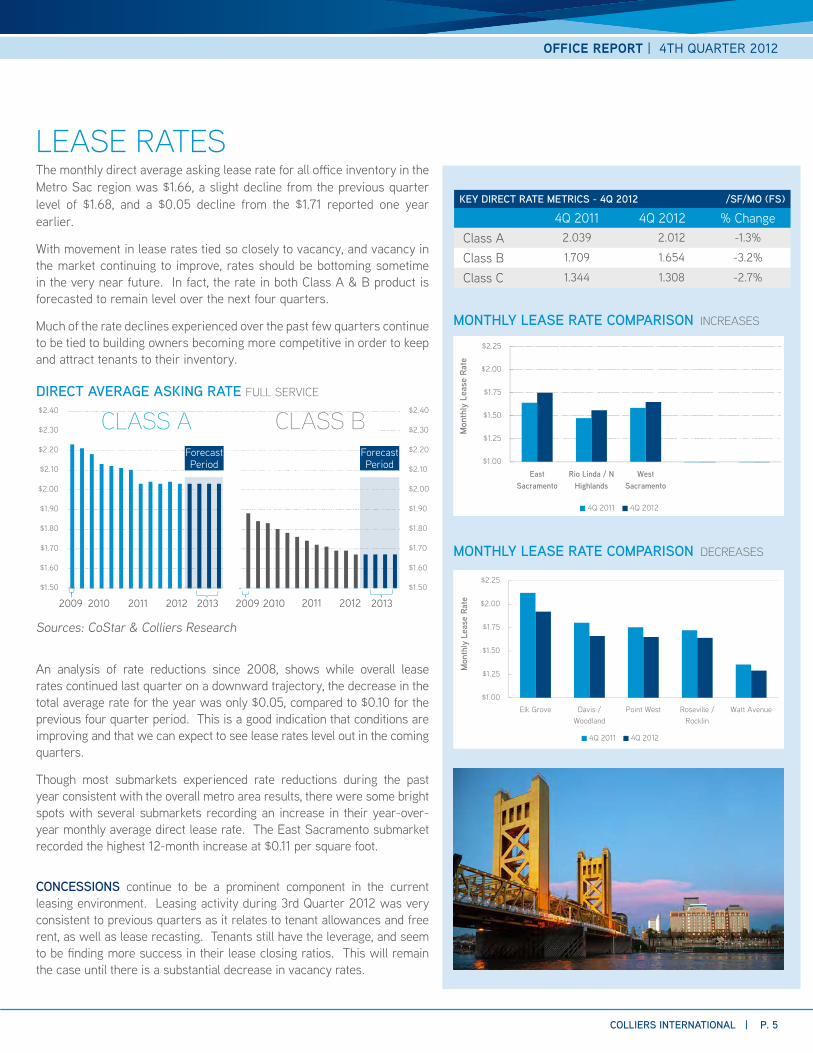
The monthly direct average asking lease rate for all o�ce inventory in the Metro Sac region was $1.66, a slight decline from the previous quarter level of $1.68, and a $0.05 decline from the $1.71 reported one year earlier.
With movement in lease rates tied so closely to vacancy, and vacancy in the market continuing to improve, rates should be bottoming sometime in the very near future. In fact, the rate in both Class A & B product is forecasted to remain level over the next four quarters.
Much of the rate declines experienced over the past few quarters continue to be tied to building owners becoming more competitive in order to keep and attract tenants to their inventory.
An analysis of rate reductions since 2008, shows while overall lease rates continued last quarter on a downward trajectory, the decrease in the total average rate for the year was only $0.05, compared to $0.10 for the previous four quarter period. This is a good indication that conditions are improving and that we can expect to see lease rates level out in the coming quarters.
Though most submarkets experienced rate reductions during the past year consistent with the overall metro area results, there were some bright spots with several submarkets recording an increase in their year-over-year monthly average direct lease rate. The East Sacramento submarket recorded the highest 12-month increase at $0.11 per square foot.
CONCESSIONS continue to be a prominent component in the current leasing environment. Leasing activity during 3rd Quarter 2012 was very consistent to previous quarters as it relates to tenant allowances and free rent, as well as lease recasting. Tenants still have the leverage, and seem to be ¤nding more success in their lease closing ratios. This will remain the case until there is a substantial decrease in vacancy rates.
LEASE RATES
KEY DIRECT RATE METRICS - 4Q 2012 /SF/MO (FS)
4Q 2011 4Q 2012 % Change Class A 2.039 2.012 -1.3%
Class B 1.709 1.654 -3.2%
Class C 1.344 1.308 -2.7%
$1.00
$1.25
$1.50
$1.75
$2.00
$2.25
EastSacramento
Rio Linda / NHighlands
WestSacramento
Mon
thly
Lea
se R
ate
4Q 2011 4Q 2012
MONTHLY LEASE RATE COMPARISON INCREASES
$1.00
$1.25
$1.50
$1.75
$2.00
$2.25
Elk Grove Davis /Woodland
Point West Roseville /Rocklin
Watt Avenue
Mon
thly
Lea
se R
ate
4Q 2011 4Q 2012
MONTHLY LEASE RATE COMPARISON DECREASES
$1.50
$1.60
$1.70
$1.80
$1.90
$2.00
$2.10
$2.20
$2.30
$2.40
$2.50
$1.50
$1.60
$1.70
$1.80
$1.90
$2.00
$2.10
$2.20
$2.30
$2.40
$2.50
2009 2010 2011 2012 2009 2010 2011 20122013 2013
DIRECT AVERAGE ASKING RATE FULL SERVICE
Sources: CoStar & Colliers Research
Forecast Period
CLASS A CLASS B
2009 2010 2011 20122009 2010 2011 2012
Forecast Period
2013 2013
P. 6 | COLLIERS INTERNATIONAL
OFFICE REPORT | 4TH QUARTER 2012
P. 6 | COLLIERS INTERNATIONAL
CONSTRUCTION SUMMARYAs of December 31, 2013, the ¤rst of two 130,000 square-foot Class A, build-to-suit, o�ce buildings to house CA Correctional Healthcare employees, was delivered to the market at the end of the quarter, the second is due to be completed in 3rd Quarter 2013.
Meanwhile, work continued on three additional new o�ce buildings in the Sacramento region:
• a 19,311 square-foot, Class B o�ce building located on Fulton Avenue, scheduled for completion in February, 2013
• a 55,140 square-foot, four-story, Class B o�ce building located in Roseville, purchased as a shell at auction in November 2011 and is expected to be delivered to the market in March of 2013
• a 53,000 square-foot, Class A o�ce building located in Roseville, scheduled for completion in February of 2013
INVESTMENT CLIMATEThe biggest news of the quarter for the o�ce investment market was the Hines Roseville Portfolio sale to Ellis Partners. Located along the Douglas Boulevard Corridor, the o¬ering was initially introduced to the market as a 63.3% occupied portfolio including 887,779 square feet with national tenants such as: AT&T, Bank of America, City Financial, JP Morgan Chase, Texas Instruments, Merrill Lynch and New York Life . Ultimately, two buildings (214,779 square feet) were dropped from the sale and the deal closed at $108.00 per square foot including the following assets:
• The Two Summit at Douglas Ridge Buildings
• Four of the Five Buildings at Olympus Corporate Centre
• Two Buildings at Johnson Ranch Corporate Center
• One Building at Roseville Corporate Center
The company had the following quote from a recent article posted to its website: “We have been seeking investment opportunities in this region for some time and are excited to be entering the Roseville market,” said James F. Ellis, Co-Managing Principal of Ellis Partners. “We hope that our investment in these properties can play an important role in accommodating private industry and bringing more jobs to the community. We look forward to applying our expertise and resources to rapidly accommodate the needs of our current and future tenants.”
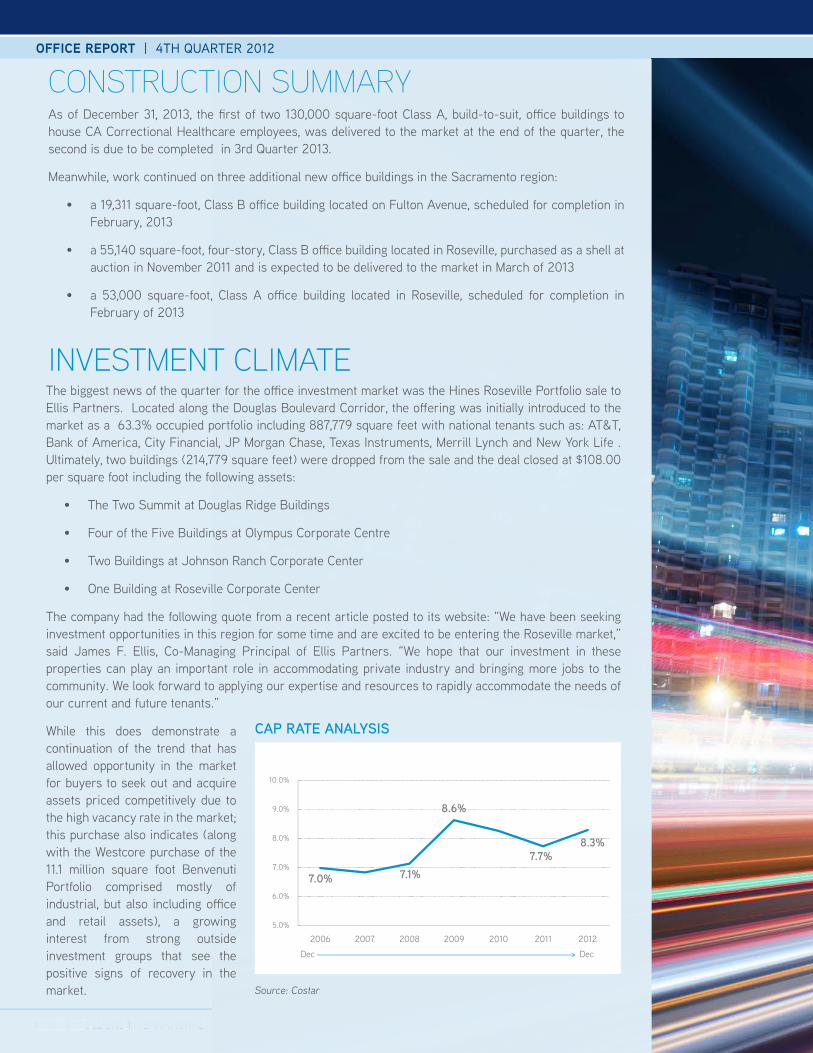
While this does demonstrate a continuation of the trend that has allowed opportunity in the market for buyers to seek out and acquire assets priced competitively due to the high vacancy rate in the market; this purchase also indicates (along with the Westcore purchase of the 11.1 million square foot Benvenuti Portfolio comprised mostly of industrial, but also including o�ce and retail assets), a growing interest from strong outside investment groups that see the positive signs of recovery in the market.
7.0% 7.1%
8.6%
7.7%8.3%
5.0%
6.0%
7.0%
8.0%
9.0%
10.0%
2006 2007 2008 2009 2010 2011 2012
Dec Dec
Source: CoStar
CAP RATE ANALYSIS
Source: Costar
OFFICE REPORT | 4TH QUARTER 2012
COLLIERS INTERNATIONAL | P. 7
IN SACRAMENTO IN SACRAMENTO IN SACRAM
ENTO
CertifiedHOT
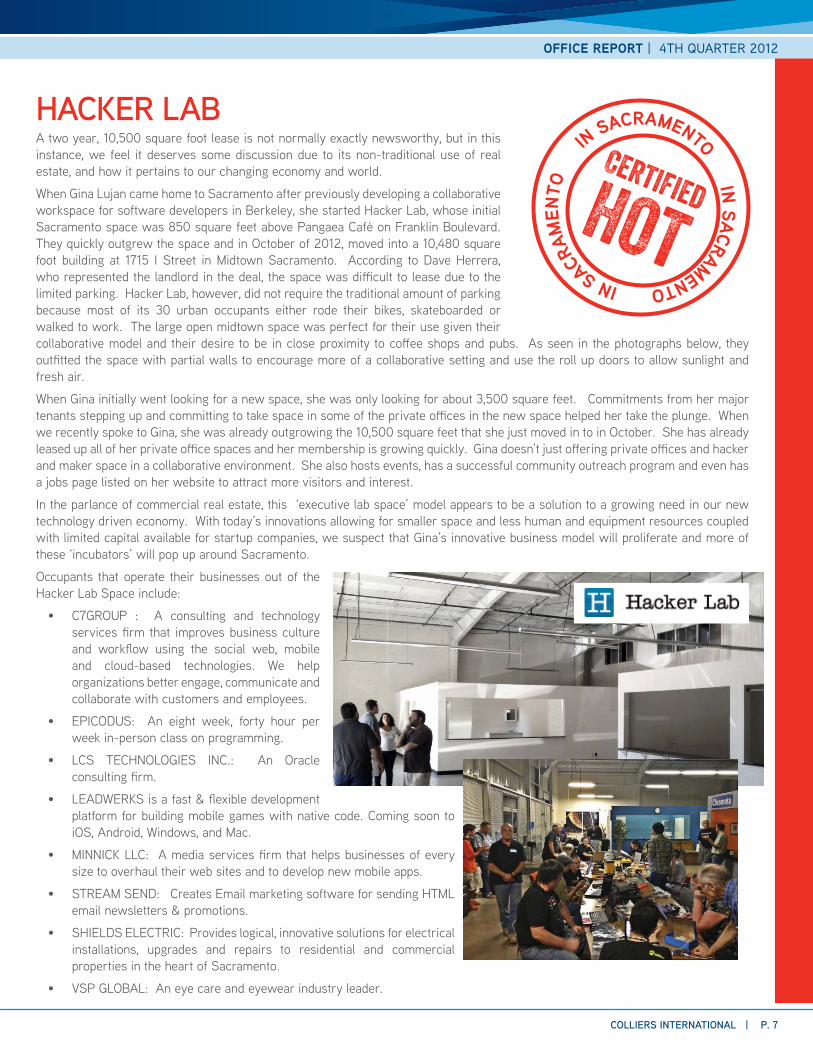
HACKER LABA two year, 10,500 square foot lease is not normally exactly newsworthy, but in this instance, we feel it deserves some discussion due to its non-traditional use of real estate, and how it pertains to our changing economy and world.
When Gina Lujan came home to Sacramento after previously developing a collaborative workspace for software developers in Berkeley, she started Hacker Lab, whose initial Sacramento space was 850 square feet above Pangaea Café on Franklin Boulevard. They quickly outgrew the space and in October of 2012, moved into a 10,480 square foot building at 1715 I Street in Midtown Sacramento. According to Dave Herrera, who represented the landlord in the deal, the space was di�cult to lease due to the limited parking. Hacker Lab, however, did not require the traditional amount of parking because most of its 30 urban occupants either rode their bikes, skateboarded or walked to work. The large open midtown space was perfect for their use given their collaborative model and their desire to be in close proximity to co¬ee shops and pubs. As seen in the photographs below, they out¤tted the space with partial walls to encourage more of a collaborative setting and use the roll up doors to allow sunlight and fresh air.
When Gina initially went looking for a new space, she was only looking for about 3,500 square feet. Commitments from her major tenants stepping up and committing to take space in some of the private o�ces in the new space helped her take the plunge. When we recently spoke to Gina, she was already outgrowing the 10,500 square feet that she just moved in to in October. She has already leased up all of her private o�ce spaces and her membership is growing quickly. Gina doesn’t just o¬ering private o�ces and hacker and maker space in a collaborative environment. She also hosts events, has a successful community outreach program and even has a jobs page listed on her website to attract more visitors and interest.
In the parlance of commercial real estate, this ‘executive lab space’ model appears to be a solution to a growing need in our new technology driven economy. With today’s innovations allowing for smaller space and less human and equipment resources coupled with limited capital available for startup companies, we suspect that Gina’s innovative business model will proliferate and more of these ‘incubators’ will pop up around Sacramento.
Occupants that operate their businesses out of the Hacker Lab Space include:
• C7GROUP : A consulting and technology services ¤rm that improves business culture and work¼ow using the social web, mobile and cloud-based technologies. We help organizations better engage, communicate and collaborate with customers and employees.
• EPICODUS: An eight week, forty hour per week in-person class on programming.
• LCS TECHNOLOGIES INC.: An Oracle consulting ¤rm.
• LEADWERKS is a fast & ¼exible development platform for building mobile games with native code. Coming soon to iOS, Android, Windows, and Mac.
• MINNICK LLC: A media services ¤rm that helps businesses of every size to overhaul their web sites and to develop new mobile apps.
• STREAM SEND: Creates Email marketing software for sending HTML email newsletters & promotions.
• SHIELDS ELECTRIC: Provides logical, innovative solutions for electrical installations, upgrades and repairs to residential and commercial properties in the heart of Sacramento.
• VSP GLOBAL: An eye care and eyewear industry leader.
P. 8 | COLLIERS INTERNATIONAL
OFFICE REPORT | 4TH QUARTER 2012
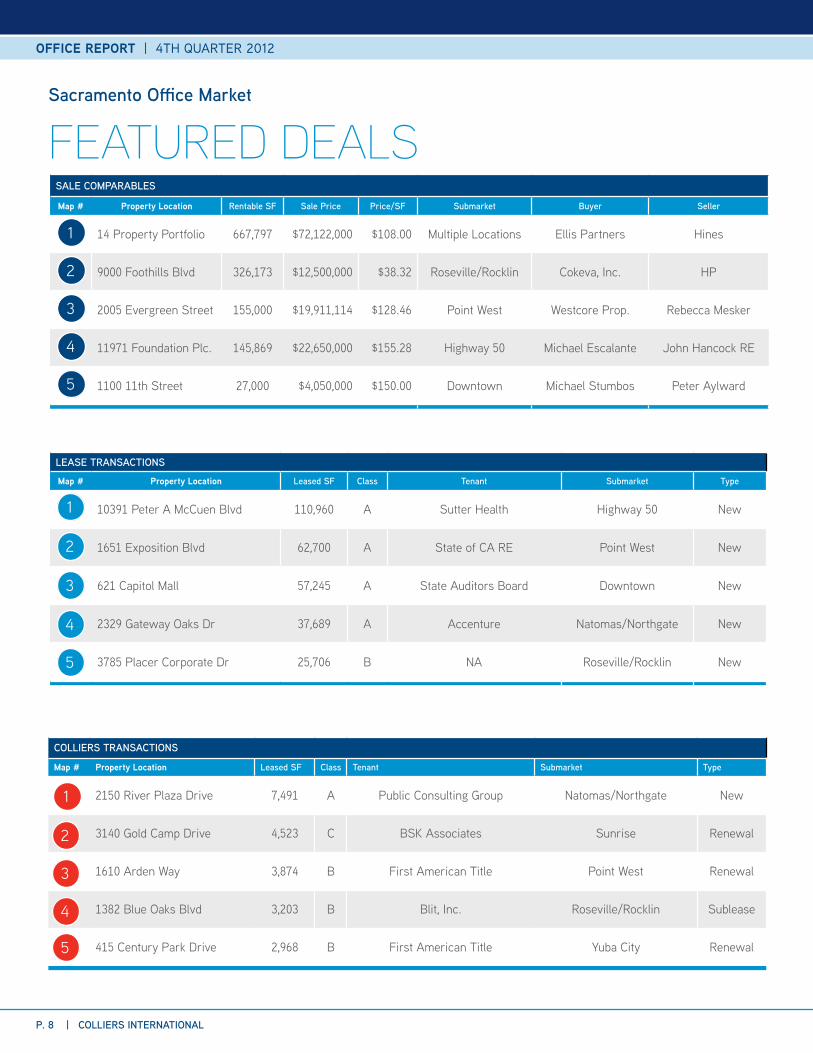
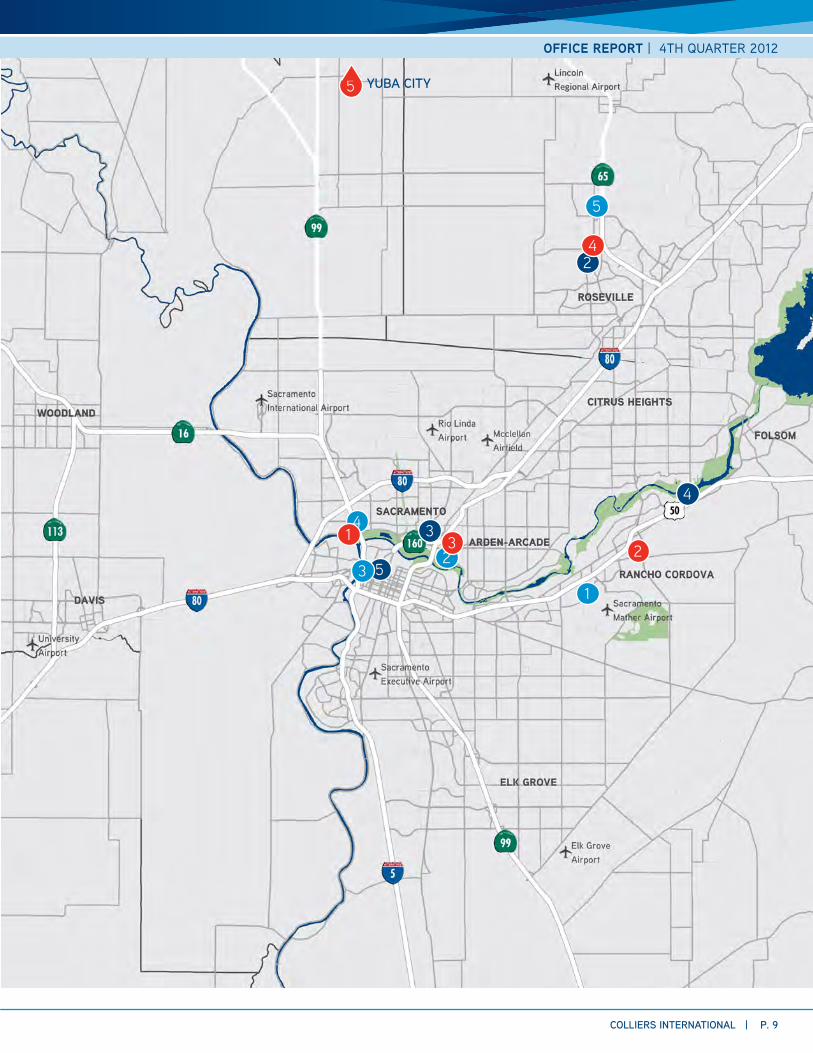
LEASE TRANSACTIONS
Map # Property Location Leased SF Class Tenant Submarket Type
1 10391 Peter A McCuen Blvd 110,960 A Sutter Health Highway 50 New
2 1651 Exposition Blvd 62,700 A State of CA RE Point West New
3 621 Capitol Mall 57,245 A State Auditors Board Downtown New
4 2329 Gateway Oaks Dr 37,689 A Accenture Natomas/Northgate New
5 3785 Placer Corporate Dr 25,706 B NA Roseville/Rocklin New
SALE COMPARABLES
Map # Property Location Rentable SF Sale Price Price/SF Submarket Buyer Seller
1 14 Property Portfolio 667,797 $72,122,000 $108.00 Multiple Locations Ellis Partners Hines
2 9000 Foothills Blvd 326,173 $12,500,000 $38.32 Roseville/Rocklin Cokeva, Inc. HP
3 2005 Evergreen Street 155,000 $19,911,114 $128.46 Point West Westcore Prop. Rebecca Mesker
4 11971 Foundation Plc. 145,869 $22,650,000 $155.28 Highway 50 Michael Escalante John Hancock RE
1100 11th Street 27,000 $4,050,000 $150.00 Downtown Michael Stumbos Peter Aylward
COLLIERS TRANSACTIONS
Map # Property Location Leased SF Class Tenant Submarket Type
2150 River Plaza Drive 7,491 A Public Consulting Group Natomas/Northgate New
3140 Gold Camp Drive 4,523 C BSK Associates Sunrise Renewal
1610 Arden Way 3,874 B First American Title Point West Renewal
1382 Blue Oaks Blvd 3,203 B Blit, Inc. Roseville/Rocklin Sublease
415 Century Park Drive 2,968 B First American Title Yuba City Renewal
Sacramento O�ce Market
FEATURED DEALS
1
2
3
4
1
2
3
4
5
2
3
4
5
5
1
Office RePORt | 4th Quarter 2012
COLLIERS INTERNATIONAL | p. 9
2
3
4
5
5
23
4
5
1
31
YUBA CITY
2
4
p. 10 | COLLIERS INTERNATIONAL
Office RepORt | 4th quarter 2012
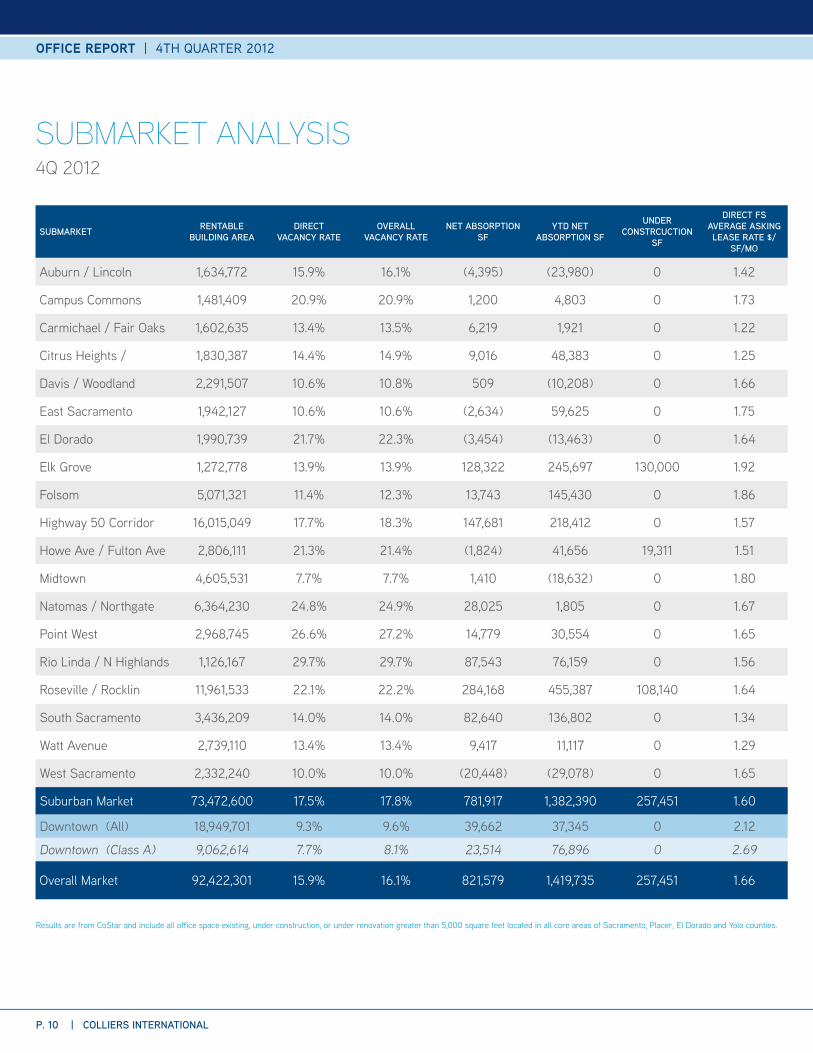
SUBMARKET RENTABLE BUILDING AREA
DIRECT VACANCY RATE
OVERALL VACANCY RATE
NET ABSORpTION SF
YTD NET ABSORpTION SF
UNDER CONSTRCUCTION
SF
DIRECT FS AVERAGE ASKING LEASE RATE $/
SF/MO
Auburn / Lincoln 1,634,772 15.9% 16.1% (4,395) (23,980) 0 1.42
Campus Commons 1,481,409 20.9% 20.9% 1,200 4,803 0 1.73
Carmichael / Fair Oaks 1,602,635 13.4% 13.5% 6,219 1,921 0 1.22
Citrus Heights / 1,830,387 14.4% 14.9% 9,016 48,383 0 1.25
Davis / Woodland 2,291,507 10.6% 10.8% 509 (10,208) 0 1.66
East Sacramento 1,942,127 10.6% 10.6% (2,634) 59,625 0 1.75
El Dorado 1,990,739 21.7% 22.3% (3,454) (13,463) 0 1.64
Elk Grove 1,272,778 13.9% 13.9% 128,322 245,697 130,000 1.92
Folsom 5,071,321 11.4% 12.3% 13,743 145,430 0 1.86
Highway 50 Corridor 16,015,049 17.7% 18.3% 147,681 218,412 0 1.57
Howe Ave / Fulton Ave 2,806,111 21.3% 21.4% (1,824) 41,656 19,311 1.51
Midtown 4,605,531 7.7% 7.7% 1,410 (18,632) 0 1.80
Natomas / Northgate 6,364,230 24.8% 24.9% 28,025 1,805 0 1.67
Point West 2,968,745 26.6% 27.2% 14,779 30,554 0 1.65
Rio Linda / N Highlands 1,126,167 29.7% 29.7% 87,543 76,159 0 1.56
Roseville / Rocklin 11,961,533 22.1% 22.2% 284,168 455,387 108,140 1.64
South Sacramento 3,436,209 14.0% 14.0% 82,640 136,802 0 1.34
Watt Avenue 2,739,110 13.4% 13.4% 9,417 11,117 0 1.29
West Sacramento 2,332,240 10.0% 10.0% (20,448) (29,078) 0 1.65
Suburban Market 73,472,600 17.5% 17.8% 781,917 1,382,390 257,451 1.60
Downtown (All) 18,949,701 9.3% 9.6% 39,662 37,345 0 2.12
Downtown (Class A) 9,062,614 7.7% 8.1% 23,514 76,896 0 2.69
Overall Market 92,422,301 15.9% 16.1% 821,579 1,419,735 257,451 1.66
Results are from CoStar and include all office space existing, under construction, or under renovation greater than 5,000 square feet located in all core areas of Sacramento, Placer, El Dorado and Yolo counties.
suBmarket analysis 4Q 2012
Office RePORt | 4th Quarter 2012
COLLIERS INTERNATIONAL | p. 11
Brokerage services
kevin [email protected]+1 916 563 3038Office Sales & Leasing
scott BennettSenior Vice [email protected]+1 916 563 3013Office Sales & Leasing
norah BrennanSr. project Coord.| Bus. [email protected]+1 916 563 3028Office Sales & Leasing
ken JohnsonSenior [email protected]+1 916 563 3065Office Sales & Leasing
eric ortizSenior [email protected]+1 916 563 3095Office Sales & Leasing
Jason rutherfordSenior Vice [email protected]+1 916 563 3059Office Sales & Leasing
tom Walcott, siorSenior Vice [email protected]+1 916 563 3002Office Sales & Leasing
kris reillySenior Vice [email protected]+1 916 563 3016Office Sales & Leasing
John BancheroSenior Vice [email protected]+1 916 563 3050Investment Sales
steve chamberlainSenior Vice [email protected]+1 916 563 3006Investment Sales
Heath charamugaSenior Vice [email protected]+1 916 563 3094Investment Sales
John JacksonVice [email protected]+1 916 563 3033Investment Sales
Ben PraterInvestment [email protected]+1 916 563 3060Investment Sales
randy dixonManaging Director [email protected]+1 916 563 3023
John shafferSenior Research [email protected]+1 916 563 3035
Office Specialists
Investment Specialists
Colliers Management
dave HerreraVice [email protected]+1 916 563 3032Office Sales & Leasing
gretchen BeckerSr. Analyst & Transaction [email protected]+1 916 563 3041Investment Sales
Colliers International301 University Avenue, Suite 100Sacramento, CA 95825www.colliers.com/sacramento
AuthorGretchen BeckerSr. Analyst & Transaction Manager+1 916 563 3041 | [email protected]