5 agronomy and physiology report-agm095 agronomy and p hysiology report -agm09.doc page 1 of 25 5....
TRANSCRIPT
5 Agronomy and P hysiology report-agm09.doc Page 1 of 25
5. Sorghum Agronomy and Physiology
SS Rao,JS Mishra, MS Raut, SM Nemada, Ponnuswamy, SS Angadi, OG Lonkhande, RS Thakur, ZN Patel, Pushpendra Singh, YK Singh, JP Singh, Kewalanand, NS Thakur, NV Patel, A
Krishna, SV Nirmal, Aswathama, N Nimbkar, UD Chavan DC S Reddy, and BS Vijay Kumar
Contents Executive summary............................................................................................. 2
A. Kharif Agronomy........................................................................................................................................................2 B. Kharif Physiology ......................................................................................................................................................4
Sorghum Agronomy and Physiology - Detailed Report ...................................................... 5 Agro-climatic situation at different kharif sorghum centers...............................................................................5 A. Kharif Agronomy........................................................................................................................................................6
I. Kharif grain sorghum ............................................................................................................................................6 Trail 1KB: Agronomic investigation of advanced / pre released kharif grain sorghum genotypes for their yield potential under rainfed conditions, Kharif 2008 (Zone II)............................................................6 Trail 1KC: Agronomic investigation of advanced/ pre released kharif grain sorghum genotypes for their yield potential under rainfed conditions, Kharif 2008 (Zone-II I)..........................................................8
II. Kharif dual-purpose sorghum ...........................................................................................................................9 Trial 1 KE: Agronomic investigations of advanced/ pre-released sorghum genotypes (dual -purpose) for their yield potential under rainfed conditions............................................................................................9
III. Kharif sweet sorghum.........................................................................................................................................9 Trial 1.1. Agronomic Investigation of advanced –prerelease sweet sorghum genotypes for their yield potential ...................................................................................................................................................................9 Trial 2.1. Integrated nutrients & moisture conservation in kharif sorghum ..............................................11 Trail 3.1.Evaluation of public and private sector kharif grain sorghum cultiva rs sold in the market for yield potential ...................................................................................................................................12 Trial 4.1. Maximization of kharif sorghum yield..............................................................................................13
IV. Forage sorghum................................................................................................................................................. 14 Trial 6. Response of single cut forage sorghum genotypes to different nitrogen levels.........................14 Trial 7. Effect of integrated nutrient management (INM) on yield and quality of single cut forage sorghum (mean of Hisar, Pantnagar and Udaipur).........................................................................................15 Trial 8. Inter cropping studies on single cut forage sorghum (Pantnagar) .................................................16 Trial 9. Response of multi cut forage sorghum genotypes to different nitrogen levels ..........................16 Trial: 10. INM studies in forage sorghm -based cropping systems..............................................................17
B. Kharif Physiology .................................................................................................................................................... 18 Table 2K: Evaluation of sweet sorghum germplasm for high sugar content, stalk yields and biomass ...................................................................................................................................................................... 18 Trial 4K. Influence of stage of harvesting of sweet sorghum on changes in juice quality, stalk yield and biomass in sweet sorghum, Kharif 2008................................................................................................... 18 Trial 5K. Assessment of sweet sorghum for post-harvest deterioration of stalks and juice quality...................................................................................................................................................................................... 19
Annexure 1: Particulars of sowing and crop management followed at different centers - Agronomy and Physiology Trials, Kharif 2008 .....................................................................................................................21 Annexure II: Weekly weather data at different centres, Kharif 2008........................................................22 Annexure III: Compliance report on grain, dual-purpose and forage sorghum agronomy.....................25
5 Agronomy and P hysiology report-agm09.doc Page 2 of 25
Executive summary
A. Kharif Agronomy In All India Coordinated Sorghum Improvement Project (AICSIP), Agronomic research was conducted on mandatory and eco-region specific trials in kharif 2008. In mandatory trials, pre-released genotypes that were promoted to the second year of testing in AVHT by the breeding programme have been evaluated for their fertility response and yield potential across different sorghum zones of the country. The eco-region specific research was emphasized on improv ing productivity and profitability of sorghum, maximization of kharif sorghum yield, integrated nutrient management (INM ) in sorghum based cropping systems. The details of AICSIP Agronomy technical programme with summary of promising treatments and entries are listed in Table 1. Table.1: Summary of results of AICSIP Sorghum Agronomy, kharif - 2008
S. No Trial Experiment na me Test entries Checks Locations Promising treatments / entries A. Mandatory Trials 1. Grain sorghum
1(K)B
Response of advanced (pre-released) sorghum genotypes to different fertility levels under rainfed condition
SPV 1786 CSV 17, SPV 1616, CSV-15, CSH-16
Dharwad, Parbhani, Akola, Indore, Surat (Zone-II)
Responded up to 120 Kg N+60 P2 O5 + 60 K2 O / ha and SPV 1786 produced higher yield than checks CSV 15 and CSV 17
2. Grain sorghum
1(K)C
--do- SPH 1596 CSV 17, SPV 1616, SPV-462
Udaipur, Mauranipur, Deesa and Pantnagar (Zone-III)
Responded up to 80 Kg N + 40 Kg P2 O5 +40 K2 O and SPH 1596 was at par with other checks in grain yield, but superior to CSV17.
3.Dual-purpose
1(K)E
--do- SPV1779, SPV 1781, SPV 1782
CSV-15 Coimbatore, Palem, Surat, Udaipur, Indore, Mauranipur
Responded up to 120 Kg N+60 P2 O5 + 60 K2 O / ha and SPV 1779 and SPV 1782 were at par with CSV 15 for grain yield
4. Sweet sorghum
1.1 -do- SPSSV-11, SPSSV 6
SSV-84, CSH 22SS & CSV-19SS
Akola, Dharwad, Indore, solapur and Coimbatore
Responded up to 120 kg N + 60 Kg P2O5 + 60 K2O/ ha and SPSSV 11 and SPSSV 6 were at par with check varieties.
B. Location specific trials 5.Grain sorghum
2.1 Integrated nutrients & moisture conservation in kharif sorghum
CSH-23 Parbhani, Dharwad, Akola, Udaipur
Sowing in rows at 45cm and opening furrows 3 weeks after sowing along with 80 Kg N + 40 Kg P2 O5 / ha was found optimum
6.Grain sorghum
3.1 Evaluation of public-private sector seeds sold in the market
CSH 23,CSH 16,SPV 1616
MSH 51,Glow ,PJH 65,MRS 4094,GK 4013,GK 4009, Ajeet 997, Bhagyalakshmi & 296,Mahabeej 7
Palem, Dharwad, Parbhani, Akola, Indore, Surat, Udaipur, Mauranipur
GK 4009 produced 14.1% and 37.2% more grain yield than CSH 16 and CSH 23, respectively.
7.Grain sorghum
4.1 Maximization of kharif sorghum yield
CSH 23, CSH 16, SPV1616 and local
- Dharwad, Parbhani, Akola, Indore, Surat, Deesa, Udaipur, and Mauranipur
CSH 16 sown in 45 x 15 cm spacing with 150% RDF + 5t FYM produced maximum yield, but 100% RDF was more economical.
C. Forage sorghum 8 6 Response of single cut forage
sorghum genotypes to different nitrogen levels.
SRF 305, UTFS 49, SU 1211, NFS 2, S 541
HC 308 Hisar,Pantnagar,Udaipur,Mauranipur,Dharwad
Application of 80 to 120 kg N/ha increased the green fodder yield from 23.9 to 28.8 t/ha, but the rate of response decreased from 0.30 t to 0.24 t/kg N. UTFS 49 and S 541 were superior
9 7 Effect of integrated nutrient management (INM) on yield and quality of single cut forage sorghum
Local - Hisar, Pantnagar and Udaipur
80 Kg N + 40 Kg P2 O5 +40 Kg K2 O (RDF) + 15 kg Zn SO4 / ha was optimum.
10 8 Inter cropping studies on single cut forage sorghum.
Local - Pantnagar Sorghum+Phillipesara (2:2) intercropping produced higher green and dry fodder yields.
11 9 Response of multi- cut forage sorghum genotypes to different nitrogen levels
UTMC 534, CSH 20MF,UTMCH 1304, GK 909
SSG 59-3 (Local)
Pantnagar, Hisar, Dharwad and Udaipur
Forage sorghum cv. GK 909 with 150kg N/ha was superior for fodder yields
12 10. INM studies in forage sorghm -based cropping systems
Local (Multicut)
- Hisar, Pantnagar and Udaipur
Combination of 75% RDF and Azospirillum was promising

5 Agronomy and P hysiology report-agm09.doc Page 3 of 25
I. Kharif grain sorghum Trail 1KB: Agronomic investigation of advanced / pre released kharif grain sorghum genotypes for their yield potential under rainfed conditions, Kharif 2008 (Zone II): Increasing fertility levels upto 150% of RDF significantly increased the grain yield dry fodder and at all the centres, and the magnitude of response was maximum at Surat. In general, the test entry gave 8.3% and 38.3 % higher grain yield over CSV 15 and CSV 17, respectively, but at par with SPV 1616. On an average, the test genotype produced 24.7% and 9.2% higher fodder yield over CSH 16 and SPV 1616 respectively. Trail 1KC: Agronomic investigation of advanced/ pre released kharif grain sorghum genotypes for their yield potential under rainfed conditions, Kharif 2008 (Zone-III) Increasing fertility levels from native to 150% RDF has increased the grain yield from 2078 kg to 2924 kg/ha, respectively, which was on par with 100% RDF (2681 kg/ha). There was 13% and 24% increase in grain yield with 100 and 150% RDF as compared to 50% RDF (2369 kg/ha). The test genotype SPH 1596 (2634 kg/ ha) was on par with SPV 1616 (2709 kg/ha) and SPV 462 (2633 kg/ha) bur superior to CSV 17 in grain yield. II. Kharif dual-purpose sorghum Trial 1 KE: Agronomic investigations of advanced/ pre-released sorghum genotypes (dual-purpose) for their yield potential under rainfed conditions. Increasing levels fertility up to 150% RDF significantly increased the grain yield by 20.0% (3607 kg/ha) and stover yield by 15.8 % (15.38 t/ha) as compared to 100% RDF (2986 kg and 13.28 t/ha, respectively). Among the genotypes, the grain yield produced by SPV 1779 (2751 kg/ha) and SPV 1782 (2854 kg/ha) was at par with check CSV 15 (2776 kg/ha). III. Kharif sweet sorghum Trial 1.1: Agronomic Investigation of advanced –prerelease sweet sorghum genotypes for their yield potential Increasing fertility levels from 50% to 150% of recommended dose of fertilizer (RDF) significantly increased the stalk yield (33.1 to 41.4 t/ha), Juice yield (3261 liters to 5605 liters/ha), dry fodder yield (26.6 tones to 36.0 tones/ha) and grain yield (2443 kg to 3080 kg/ha). Stalk yield of the test genotypes SPSSV 11 and SPSSV 6 was at par with SSV84 and CSV 19SS but significantly lower than the hybrid check CSH 22SS. Grain yield of SPSSV 11 (3336 kg/ha) was significantly higher than SPSSV 6 (2576kg/ha), SSV 84 (2252 kg/ha) and CSV 19SS (1999 Kg) but was at par with CSH22SS (3567 kg). The test entries responded more to high fertility (150 %RDF) than checks as compared to 100 % RDF. At Akola, response of fertility was significant up to 150% RDF over 50 %RDF in SSV 84 (27.8 t/ha) and CSH 22SS (29.7 t/ha) as compared to CSV 19SS (28.4 t/ha) in dry fodder yield. Trial 2.1: Integrated nutrient and moisture conservation in kharif sorghum Sowing sorghum at 45 cm rows and opening furrows 3 weeks after sowing (WAS) produced the highest grain yield (3597 kg/ha) and was at par with paired row planting at 30:60 cm and opening furrows at 3 WAS (3491 Kg/ha) ( Table 2.1-1). However, the mean stover yield did not vary significantly due to moisture conservation practices. The grain yield (3626 Kg/ha) with recommended dose of fertilizer (80:40:40 kg NPK/ha) was on par with that of 50% RDF + 2.5t FYM + Azotobacter (3607 Kg/ha), but significantly superior to FYM@5t/ha + Azotobacter + PSB (2927 Kg/ha)(Tabl e 2.1-1). Similar trend was observed with stover yield. Trail 3.1: Evaluation of public and private sector kharif grain sorghum cultivars sold in the market for yield potential. Private sector entry GK 4009 produced 14.1% and 37.2% more grain yield than CSH 16 and CSH 23, respectively. While it produced 24.2% more grain yield than variety SPV 1616. Grain yield across the locations ranged from 3297 (Palem) to 6998 kg/ha (Indore). GK 4009 produced 16.6% and 8.3% more stover yield than CSH 16 and SPV 1616, respectively.
5 Agronomy and P hysiology report-agm09.doc Page 4 of 25
Trial 4.1: Maximization of kharif sorghum yield Different planting geometries did not effect the grain yield except at Udaipur, where 45 x 15 cm spacing produced (10.3%) higher yield (4620 Kg/ha) than that of 45 x 10 cm (4188 Kg/ha). CSH 16 being at par with SPV 1616 produced the maximum grain yield (3851 kg/ha) as compared to local checks (3166 Kg/ha). Increasing levels of fertility from 100% RDF to 150% RDF + 5t FYM/ha significantly increased the grain yield at Coimbatore, Parbhani, Akola and Dharwad. There was no response of adding 5t FYM/ha at Indore and Udaipur centres. Application of 150% RDF and 150% RDF + 5t FYM/ ha increased the grain yield of sorghum by 12.6% and 19.8% respectively as compared to 100% RDF alone. Among different genotypes, SPV 1616 produced the maximum dry fodder yield (13.22 t/ha), which was 31% and 17% higher than CSH 23 and CSH 16, respectively. Maximum B:C ratio (2.31) was obtained from 100% RDF followed by 150%RDF (2.24) and least with addition of 5t FYM + 150% RDF (1.9). IV. Forage sorghum Trial 6: Response of single cut forage sorghum genotypes to different nitrogen levels. Increase in nitrogen levels from 80 to 120 kg/ha increased the green and dry fodder yields from 23.9 to 28.8 t/ha, 9.0 to 11.8 t/ha, respectively. On the other hand, the rate of response decreased from 0.30 t to 0.24 t/kg N in green fodder yields and from 0.11 to 0.09 t/Kg N in dry fodder yields. Forage sorghum cultivars UTFS 49 and S 541 were superior for green fodder (31.9 and 32.2 t/ha) and dry fodder (13.4 and 13.0 t/ha) yields. Trial 7: Effect of integrated nutrient management (INM) on yield and quality of single cut forage sorghum Maximum green fodder yield (52.9 t/ha) was obtained from 100% RDF+25kg Zn SO4 /ha which was at par with 100% RDF+15kg Zn SO4 /ha, but significantly superior to 100 RDF alone, indicating the positive response of Zn in forage sorghum. Dry fodder yield also showed the similar response to fertility levels. Trial 8: Inter cropping studies on single cut forage sorghum Sorghum+Phillipesara intercropping was slightly better than sorghum + Cowpea intercropping in terms of total green fodder productivity. Sorghum + Phillipesara (2:1) produced equal amount of dry fodder of sorghum as sorghum alone in addition to 5.4 t/ha fodder yield of Phillipesara. Trial 9: Response of multi-cut forage sorghum genotypes to different nitrogen levels Increasing levels of N from 0 to 150 kg/ha significantly increased the green and dry fodder yields, but response of N declined. Maximum green fodder (100.8 t/ha) and dry fodder yield (45.4 t/ha) was obtained with 150kg N/ha. Among different genotypes, GK 909 (89.3t/ha) being at par with Local (87.5t) highest green fodder yield than others. Similar trend was observed with dry fodder yield too. At Hisar, the green fodder yields obtained from CSH 20MF (82.9), GK 909 (82.9) and Local (81.9) at 100 kg N/ha was as high as that of UTMC 534 (82.3t/ha) at 150kg/ha. Trial 10: INM studies in forage sorghm -based cropping systems Application of 75% RDF+ 25%N through FYM produced maximum green fodder yield (60.3 t/ha) at Hisar, while that of 75% RDF+Azospirillum at Pantnagar (93t/ha) and 100% RDF through inorganic fertilizer (49.2t/ha) at Udaipur. Overall, 75% RDF+Azospirillum produced the highest green fodder yield (64.8t/ha) but was at par with rest of the combinations and 100% RDF through inorganic fertilizer (63.8t/ha). B. Kharif Physiology Table 2K: Evaluation of sweet sorghum germplasm for high sugar content, stalk yields and biomass Fifty six sweet sorghum promising germplasm along with 2 checks (CSV 19SS and SSV 84) were evaluated in augmented design at Parbhani, Rahuri and Hyderabad. 13 lines i.e., IS 5352, IS 5353, IS 5356, IS 5360, IS 5362, IS 7541, IS 7543, IS 11152, ICSV 25274, SPV 422, IS 5357, IS 7555 and IS 9609 produced higher stalk yield and biomass than check SSV 84 (534 g). In stalk sugar content (brix %) content, none were superior to check SSV 84 (19.7%), however, SPV 422 (20.8%) showed marginal superiority in stalk sugar content than checks. The detailed centre wise data are presented in tables 2k-1 to 2 K-5.

5 Agronomy and P hysiology report-agm09.doc Page 5 of 25
Table 2: Promising sweet sorghum germplasm for stalk yield, brix content and biomass, Kharif 2008 (Mean of 3 locations)
S. No.
Trait Mean Min Max. Range SSV 84 (Check)
CD(0.05) Promising entries superior to check
2 Fresh stalk yield (g/plant)
479 125 897 772 534 39.7 IS-5352, IS-5353, IS-5356, IS-5360, IS-5362, IS-7541, IS-7543 ,IS-11152, ICSV -25274, SPV-422 etc
3 Total fresh biomass (g/plant)
670 186 1260 1074 781 54.8 IS-5352, IS-5353, IS-5356, IS-5360, IS-5362, IS-7541, IS-7543 ,IS-11152, ICSV -25274, SPV-422 etc
4 Juice brix at mat. (%)
18 14.0 22.0 8.0 19.7 0.4 IS-5352, IS-5353, IS-5356, IS-5360, IS-5362, IS-7541, IS-7543 ,IS-11152, ICSV -25274, SPV-422 etc
Trial 4K: Influence of stage of harvesting of sweet sorghum on changes in juice quality, stalk yield and biomass in sweet sorghum, Kharif 2008. Fresh stalk yield varied from 34.0 to 47.6 t/ha across cultivars and harvesting treatments with a mean of 41.0 t/ha. Stalk yield increased from 15 days after flowering (DAF) to 45 DAF and declined subsequently. Brix value increased significantly from 15 DAF to 60 DAF. Maximum brix value recorded at physiological maturity (45 DAF) was 17 % higher by than at 15 DAF. Sugar yields ranged from 1.44 to 2.80 t/ha across cultivars and treatments. It increased from 15 DAF to 30 DAF, while both 45 DAF and 60DAF treatments were at par. Sugar yields declined by 22 % when sweet sorghum crop harvested at 45 DAF (phy mat) than at 30 DAF (hard dough stage). Mean computed bioethanol yields varied from 725 to 1906 L/ha across cultivars and treatments. Bioethanol yields increased from 15 DAF to 30 DAF, while, it declined at subsequent stages (45 DAF & 60 DAF). Harvesting at 45 DAF decresed the bioethanol yield by 20% as compared to that of 30 DAF. Trial 5K: Assessment of sweet sorghum for post-harvest deterioration of stalks and juice quality. As the days from storage increases, there was an increase in brix content from 18 to 24 % mainly because of concentration of sugars. Stalk yield declined by 15.0% after two days of storage. The total sugars marginally increased from 15 to 17% after four days of storage, while reducing sugars (RS) had markedly increased from 1.27 to 5.97% up to 4 days after storage (DAS) due to inversion. The results suggest that the sugar content in the stalks can be retained up to 3-days after harvest in the ambient field storage conditions under the mild winter conditions of November Sorghum Agronomy and Physiology - Detailed Report
Agro -climatic situation at different kharif sorghum centers The sowing details, physico-chemical properties of soil and weekly meteorological data on rainfall, temperature and relative humidity are given in for kharif cropping season are presented in Annexure I and II. Zone- I Coimbatore: The total rainfall received during kharif crop period (s t. week 24 - 43) was just 139 mm. The quantity and distribution of rainfall were not adequate to grow good kharif crop without irrigations. Mean maximum and minimum temperatures ranged from 29 – 330C and 20 – 240C, respectively. Palem: The soils are alfisols with sandy loamy texture having low available N and K. the rainfall received was 498mm just adequate to raise good kharif crop. The distribution was more or less uniform throughput the crop growth period. Zone- II Dharwad: Total rainfall received during crop period was 613mm with almost uniform distribution. Very high relative humidity (75 – 96%) was recorded through out the crop growth period. Hyderabad (NRCS): Total rainfall received during crop growth period was 785mm which is above normal. The distribution of rainfall was highly erratic with very late onset of monsoon by 2nd week of July. The crops sown in June suffered from seedling drought. This followed by torrential rains during August resulted in crop lodging due to water logging. Maximum and minimum temperatures ranged from 29 – 340C and 14 – 250C respectively.

5 Agronomy and P hysiology report-agm09.doc Page 6 of 25
Phaltan: Total rainfall received during cropping season was 365mm which was 19.4% below normal for the corresponding period. Early season and terminal droughts were prevailing. Soils are characterized as medium black clay (100cm deep) in texture and possess ing high available K (564 Kg/ha) content and low N (182 Kg). Akola: Actual total rainfall received was 565mm which was 27% less than normal 717mm for this location. The crop experienced midseason drought of two weeks followed by terminal drought in mid-September to late October. Soil has clay texture with low availability N (174Kg/ha) and moderate K (372Kg/ha). Parbhani: The rainfall received was adequate (562mm) to grow successful kharif crop and the distribution was also uniform in GS1, GS2 and GS3 stages of crop. Zone-III Gujarat: A total of 1254mm of rainfall was received in kharif season which was about 40% more than normal. Heavy downpour occurred in June and July months. Udaipur: Kharif crop received a total of 616mm rainfall which was near normal with uniform distribution throughout the season. Pantnagar: This location received unusually a very high rainfall of 1654mm which was 70% more than normal. Continuous torrential rains disrupted sowings and other crop management operations. The RH recorded at 8.00hr was 80 – 95% with temperature of 29 – 320C and 15 – 260C for maximum and minimum, respectively. A. Kharif Agronomy I. Kharif grain sorghum Trail 1KB: Agronomic investigation of advanced / pre released kharif grain sorghum genotypes for their yield potential under rainfed conditions, Kharif 2008 (Zone II). The experiment was conducted at 5 locations (Parbhani, Akola, Dharwad Indore and Surat). Results revealed that increasing fertility levels upto 150% of RDF significantly increased the grain yield at all the centres , and the magnitude of response was maximum at Surat. The test genotype SPV 1786 produced maximum grain yield (6329 kg/ha) at Indore which was at par with SPV 1616 (6072 kg/ha) but significantly superior to hybrid CSH 16’ (5729 kg/ha). The test variety also performed better as compared to other check varieties at Akola (Table 1KB-1). Over all, the highest grain yield (5288 kg/ha) was recorded at Indore and the lowest (1977kg/ha) at Parbhani. The interaction between fertility levels and genotypes was found significant at Parbhani centre. (Table 1KB-2). Among different genotypes, cultivar CSV 15 showed higher response at 150% RDF compared to 100% RDF.
Table 1KB-1: Grain yield (kg/ha) of promising grain sorghum genotypes as influenced by different fertility levels, Kharif 2008
Treatment Parbhani Akola Dharwad Indore Surat Mean Fertility levels Native fertility 1185 2548 2272 4471 1325 2360 50% RDF 1926 3134 3126 5192 1959 3067 100% RDF (80:40:40) 2218 3894 3493 5539 2446 3518 150% RDF 2579 4247 3667 5950 3349 3958 CD (p= 0.05) 117 232 188 338 181 229 Genotype SPV1786 1719 3725 3152 6329 2177 3420 CSV 17 1458 2912 3292 2399 2304 2473(38.3%) SPV 1616 2465 3338 2910 6072 2223 3402 CSV 15 1395 3276 2998 5912 2213 3159 (8.3%) CSH 16 2847 4028 3343 5729 2432 3676 CD (P= 0.05) 94 204 156 329 151 483 Location mean 1977 3456 3139 5288 2270

5 Agronomy and P hysiology report-agm09.doc Page 7 of 25
Table 1KB-2: Grain yield of grain sorghum genotype as influenced by fertility levels at Parbhani , Kharif 2008
Genotype Native fertility 50% RDF 100%RDF 150% RDF Mean
SPV1786 1065 1782 1852 2176 1719 CSV 17 880 1343 1667 1944 1458 SPV 1616 1551 2454 2824 3032 2465 CSV 15 694 1319 1435 2130 1395 CSH 16 1736 2731 3310 3611 2847 Mean 1185 1926 2218 2579 CD (p= 0.05) Aibi-Aibj 189 Aibi-Ajbi 205
Similarly, increasing levels of fertility up to 150% RDF had significantly increased the dry fodder at all the centres. However, the difference in yield between 100% RDF (18.82 t) and 150% RDF (17.36 t) at Indore centre was not significant. Test entry SPV 1786 produced higher fodder yield compared to other cultivars at all the centres except at Parbhani (Table 1KB-3). On an average, this genotype produced 24.7% and 9.2% higher yield over CSH 16 and SPV 1616 respectively. Over all, the highest dry fodder yield (16.19 t/ha) was recorded at Indore followed by Akola (11.42 t) and Dharwad (10.88t).
Table1KB-3: Dry fodder yield (t/ha) of grain sorghum as influenced by fertility levels and genotype, Kharif 2008
Treatment Parbhani Akola Dharwad Indore Surat Mean Fertility level s Native fertility 7.37 9.96 10.19 12.82 3.81 8.83 50% RDF 8.57 10.67 11.13 15.76 5.59 10.35 100% RDF (80:40:40) 9.13 11.93 10.52 17.36 7.02 11.19 150% RDF 9.66 13.11 11.66 18.82 9.57 12.57 CD (p= 0.05) 0.31 0.71 0.89 1.77 0.34 1.31 Genotype SPV1786 8.51 13.98 13.38 20.28 6.13 12.46 CSV 17 8.28 11.67 7.61 6.97 6.63 8.23 SPV 1616 8.96 8.89 13.01 19.88 6.34 11.47 CSV 15 8.36 12.87 12.36 18 6.27 11.57 CSH 16 9.29 9.68 8.02 15.83 7.11 9.99 CD (p= 0.05) 0.25 1.05 0.62 1.36 0.3 1.74 Location mean 8.68 11.42 10.88 16.19 6.5 10.73
Plant stand did not vary significantly due to fertility levels and genotypes (Table1KB-4). Increasing fertility levels from native to 150% of RDF reduced the number of days for 50% flowering from 70 to 68. Increasing levels of fertility significantly increased the plant height and 100 seed weight; however, the difference between 100% RDF and 150% RDF was not significant. Test entry SPV 1786 grew tall (247 cm) but, at par with SPV 1616 (245 cm) and CSV15 (237cm). 100-seed weight of SPV 1786 (2.82%) was at par with other check varieties but significantly lower than CSH 16 (3.40g) (Table1KB-4). Table1KB-4. Plant stand, phenology and yield components of grain sorghum as influenced by fertility
levels and genotype, Kharif 2008
Treatment Plant stand after thinning (1000/ha)
Days to 50% flow
Days to maturity
Plant height (cm)
100 seed wt (g)
Harvest index (%)
B:C ratio
Fertility levels Native fertility 143 70 111 194 2.77 23.54 2.14 50% RDF 147 69 111 206 2.93 24.92 2.39 100% RDF (80:40:40) 146 69 111 220 3.08 26.09 2.55 150% RDF 149 68 111 222 3.22 25.78 2.71 CD (p= 0.05) NS 1 NS 13 0.15 NS NS

5 Agronomy and P hysiology report-agm09.doc Page 8 of 25
Treatment Plant stand after thinning (1000/ha)
Days to 50% flow
Days to maturity
Plant height (cm)
100 seed wt (g)
Harvest index (%)
B:C ratio
Genotype SPV1786 149 71 113 247 2.82 23.57 2.72 CSV 17 144 61 104 132 2.85 22.79 2.04 SPV 1616 149 72 114 245 2.99 28.49 2.43 CSV 15 143 71 113 237 2.94 23.13 2.49 CSH 16 147 69 111 191 3.4 27.43 2.57 CD (p= 0.05) NS 1 2 17 0.14 4.31 0.36
Trail 1KC: Agronomic investigation of advanced/ pre released kharif grain sorghum genotypes for their yield potential under rainfed conditions, Kharif 2008 (Zone-III) This trial was conducted at Udaipur, Mauranipur and Deesa in zone III. Increasing fertility levels from native to 150% RDF has increased the grain yield from 2078 kg to 2924 kg/ha, respectively, which was on par with 100% RDF (2681 kg/ha). There was 13% and 24% increase in grain yield with 100 and 150% RDF as compared to 50% RDF (2369 kg/ha). The test genotype SPH 1596 (2634 kg/ha) was on par with SPV 1616 (2709 kg/ha) and SPV 462 (2633 kg/ha). Dry fodder yield (9.43 t/ha) produced at 100% RDF was at par with 150% RDF (10.31 t/ha). The test genotype SPH 1596 was late in 50% flowering (68 days) as compared to CSV 17 (51 days), but was on par with SPV 1616 (69 days) and SPV 462 (71 days) (Table1KC-2). Table .1KC-1. Effect of fertility levels on grain and fodder yield of kharif sorghum genotypes, Kharif 2008
Treatment Grain yield (kg/ha) Dry fodder yield (t/ha) Fertility levels Udaipur Mauranipur Deesa Mean Udaipur Maurinipur Deesa Mean Native fertility 3160 2292 783 2078 11.04 6.98 4.47 4.5 50% RDF 3421 2704 982 2369 12.8 7.76 5.23 8.59 100% RDF 3926 2979 1133 2681 14.12 8.2 5.98 9.43 150% RDF 4211 3176 1385 2924 14.38 8.5 8.07 10.31 CD (p= 0.05) 364 457 66 250 0.83 0.24 0.32 1.29 Genotype SPV1596 4287 2336 1281 2634 14.44 7.28 6.51 9.41 CSV 17 2959 2407 865 2075 8.03 6.37 3.58 6 SPV 1616 4012 3074 1041 2709 15.79 9.29 7.68 10.92 CSV 462 3465 3333 1101 2633 14.07 8.5 5.98 9.52 CD (p= 0.05) 401 442 66 371 1.2 0.45 0.33 1.14 Loc.mean 3679 2788 1072 2513 13.08 7.86 5.93 8.96 Table1KC-2. Effect of fertility levels on phenology and yield components of kharif sorghum genotypes
and net returns, Kharif 2008
Treatment Plant stand after thinning
Days to 50% flowering
100 seed weight (g) Net return (Rs./ha)
Fertility levels Native fertility 86.25 65 2.8 22428 50% RDF 85.79 65 2.85 25239 100% RDF 85.56 65 2.87 28892 150% RDF 85.19 65 2.9 29733 CD (p= 0.05) 1.0 NS 0.18 2153 Genotype SPV1596 93.43 68 3.03 32127 CSV 17 60.83 51 2.6 15137 SPV 1616 98.75 69 2.95 32354 CSV 462 89.77 71 2.83 26674 CD (p= 0.05) 1.33 5 0.15 3060
5 Agronomy and P hysiology report-agm09.doc Page 9 of 25
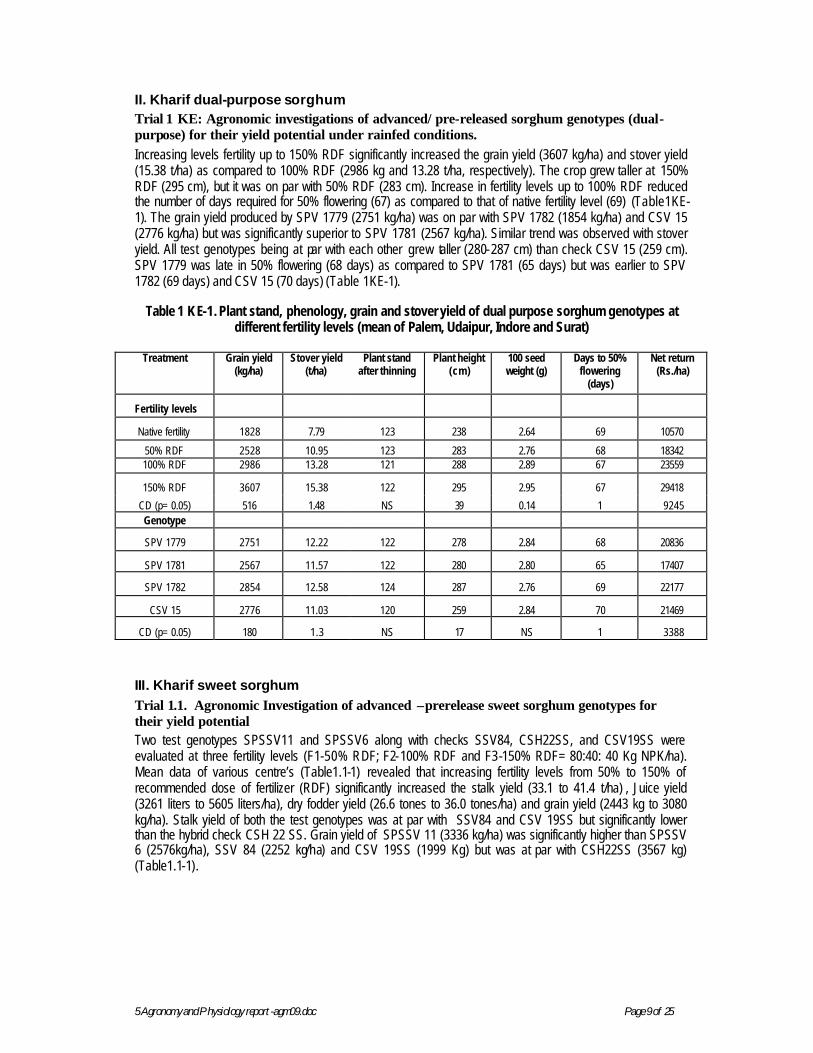
II. Kharif dual-purpose sorghum Trial 1 KE: Agronomic investigations of advanced/ pre-released sorghum genotypes (dual-purpose) for their yield potential under rainfed conditions. Increasing levels fertility up to 150% RDF significantly increased the grain yield (3607 kg/ha) and stover yield (15.38 t/ha) as compared to 100% RDF (2986 kg and 13.28 t/ha, respectively). The crop grew taller at 150% RDF (295 cm), but it was on par with 50% RDF (283 cm). Increase in fertility levels up to 100% RDF reduced the number of days required for 50% flowering (67) as compared to that of native fertility level (69) (Table1KE-1). The grain yield produced by SPV 1779 (2751 kg/ha) was on par with SPV 1782 (1854 kg/ha) and CSV 15 (2776 kg/ha) but was significantly superior to SPV 1781 (2567 kg/ha). Similar trend was observed with stover yield. All test genotypes being at par with each other grew taller (280-287 cm) than check CSV 15 (259 cm). SPV 1779 was late in 50% flowering (68 days) as compared to SPV 1781 (65 days) but was earlier to SPV 1782 (69 days) and CSV 15 (70 days) (Table 1KE-1).
Table 1 KE-1. Plant stand, phenology, grain and stover yield of dual purpose sorghum genotypes at different fertility levels (mean of Palem, Udaipur, Indore and Surat)
Treatment Grain yield
(kg/ha) Stover yield
(t/ha) Plant stand
after thinning Plant height
(cm) 100 seed weight (g)
Days to 50% flowering
(days)
Net return (Rs./ha)
Fertility levels
Native fertility 1828 7.79 123 238 2.64 69 10570
50% RDF 2528 10.95 123 283 2.76 68 18342 100% RDF 2986 13.28 121 288 2.89 67 23559
150% RDF 3607 15.38 122 295 2.95 67 29418
CD (p= 0.05) 516 1.48 NS 39 0.14 1 9245 Genotype
SPV 1779 2751 12.22 122 278 2.84 68 20836
SPV 1781 2567 11.57 122 280 2.80 65 17407
SPV 1782 2854 12.58 124 287 2.76 69 22177
CSV 15 2776 11.03 120 259 2.84 70 21469
CD (p= 0.05) 180 1.3 NS 17 NS 1 3388
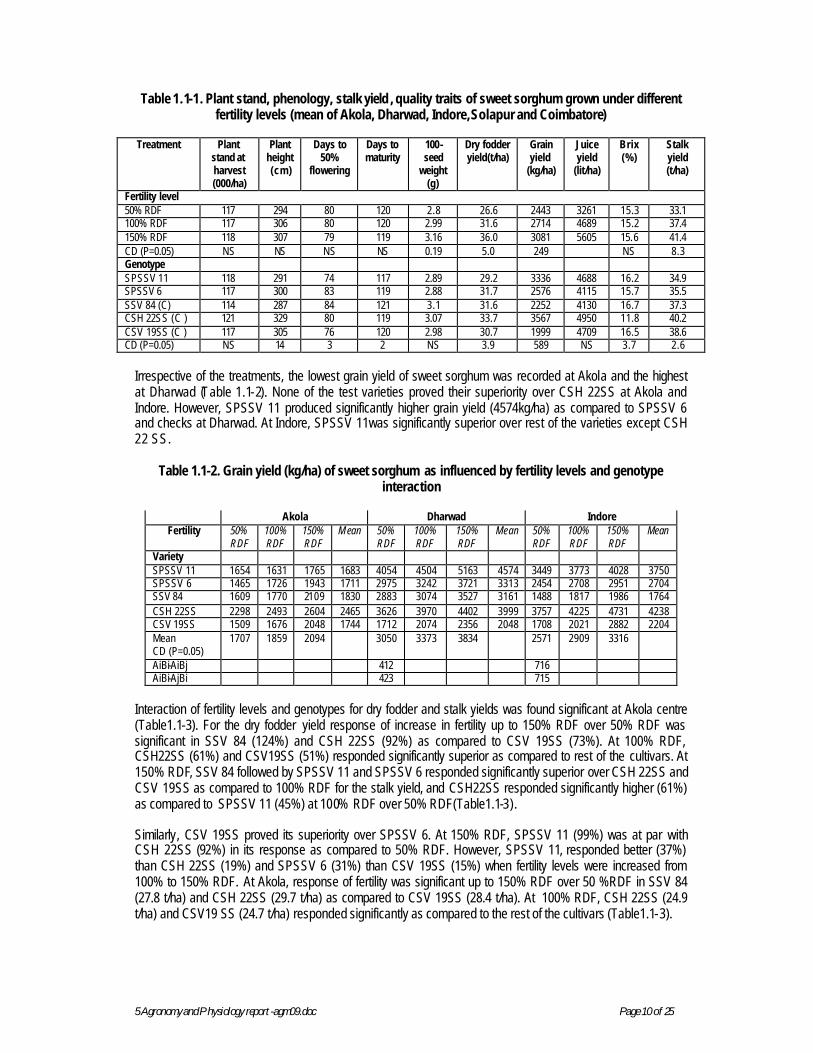
III. Kharif sweet sorghum Trial 1.1. Agronomic Investigation of advanced –prerelease sweet sorghum genotypes for their yield potential Two test genotypes SPSSV11 and SPSSV6 along with checks SSV84, CSH22SS, and CSV19SS were evaluated at three fertility levels (F1-50% RDF; F2-100% RDF and F3-150% RDF= 80:40: 40 Kg NPK/ha). Mean data of various centre’s (Table1.1-1) revealed that increasing fertility levels from 50% to 150% of recommended dose of fertilizer (RDF) significantly increased the stalk yield (33.1 to 41.4 t/ha) , Juice yield (3261 liters to 5605 liters/ha), dry fodder yield (26.6 tones to 36.0 tones/ha) and grain yield (2443 kg to 3080 kg/ha). Stalk yield of both the test genotypes was at par with SSV84 and CSV 19SS but significantly lower than the hybrid check CSH 22 SS. Grain yield of SPSSV 11 (3336 kg/ha) was significantly higher than SPSSV 6 (2576kg/ha), SSV 84 (2252 kg/ha) and CSV 19SS (1999 Kg) but was at par with CSH22SS (3567 kg) (Table1.1-1).
5 Agronomy and P hysiology report-agm09.doc Page 10 of 25
Table 1.1-1. Plant stand, phenology, stalk yield , quality traits of sweet sorghum grown under different fertility levels (mean of Akola, Dharwad, Indore, Solapur and Coimbatore)
Treatment Plant
stand at harvest (000/ha)
Plant height (cm)
Days to 50%
flowering
Days to maturity
100- seed
weight (g)
Dry fodder yield(t/ha)
Grain yield
(kg/ha)
Juice yield
(lit/ha)
Brix (%)
Stalk yield (t/ha)
Fertility level 50% RDF 117 294 80 120 2.8 26.6 2443 3261 15.3 33.1 100% RDF 117 306 80 120 2.99 31.6 2714 4689 15.2 37.4 150% RDF 118 307 79 119 3.16 36.0 3081 5605 15.6 41.4 CD (P=0.05) NS NS NS NS 0.19 5.0 249 NS 8.3 Genotype SPSSV 11 118 291 74 117 2.89 29.2 3336 4688 16.2 34.9 SPSSV 6 117 300 83 119 2.88 31.7 2576 4115 15.7 35.5 SSV 84 (C) 114 287 84 121 3.1 31.6 2252 4130 16.7 37.3 CSH 22SS (C ) 121 329 80 119 3.07 33.7 3567 4950 11.8 40.2 CSV 19SS (C ) 117 305 76 120 2.98 30.7 1999 4709 16.5 38.6 CD (P=0.05) NS 14 3 2 NS 3.9 589 NS 3.7 2.6
Irrespective of the treatments, the lowest grain yield of sweet sorghum was recorded at Akola and the highest at Dharwad (Table 1.1-2). None of the test varieties proved their superiority over CSH 22SS at Akola and Indore. However, SPSSV 11 produced significantly higher grain yield (4574kg/ha) as compared to SPSSV 6 and checks at Dharwad. At Indore, SPSSV 11was significantly superior over rest of the varieties except CSH 22 SS.
Table 1.1-2. Grain yield (kg/ha) of sweet sorghum as influenced by fertility levels and genotype interaction
Akola Dharwad Indore
Fertility 50% RDF
100% RDF
150% RDF
Mean 50% RDF
100% RDF
150% RDF
Mean 50% RDF
100% RDF
150% RDF
Mean
Variety SPSSV 11 1654 1631 1765 1683 4054 4504 5163 4574 3449 3773 4028 3750 SPSSV 6 1465 1726 1943 1711 2975 3242 3721 3313 2454 2708 2951 2704 SSV 84 1609 1770 2109 1830 2883 3074 3527 3161 1488 1817 1986 1764 CSH 22SS 2298 2493 2604 2465 3626 3970 4402 3999 3757 4225 4731 4238 CSV 19SS 1509 1676 2048 1744 1712 2074 2356 2048 1708 2021 2882 2204 Mean 1707 1859 2094 3050 3373 3834 2571 2909 3316 CD (P=0.05) AiBi-AiBj 412 716 AiBi-AjBi 423 715
Interaction of fertility levels and genotypes for dry fodder and stalk yields was found significant at Akola centre (Table1.1-3). For the dry fodder yield response of increase in fertility up to 150% RDF over 50% RDF was significant in SSV 84 (124%) and CSH 22SS (92%) as compared to CSV 19SS (73%). At 100% RDF, CSH22SS (61%) and CSV19SS (51%) responded significantly superior as compared to rest of the cultivars. At 150% RDF, SSV 84 followed by SPSSV 11 and SPSSV 6 responded significantly superior over CSH 22SS and CSV 19SS as compared to 100% RDF for the stalk yield, and CSH22SS responded significantly higher (61%) as compared to SPSSV 11 (45%) at 100% RDF over 50% RDF(Table1.1-3). Similarly, CSV 19SS proved its superiority over SPSSV 6. At 150% RDF, SPSSV 11 (99%) was at par with CSH 22SS (92%) in its response as compared to 50% RDF. However, SPSSV 11, responded better (37%) than CSH 22SS (19%) and SPSSV 6 (31%) than CSV 19SS (15%) when fertility levels were increased from 100% to 150% RDF. At Akola, response of fertility was significant up to 150% RDF over 50 %RDF in SSV 84 (27.8 t/ha) and CSH 22SS (29.7 t/ha) as compared to CSV 19SS (28.4 t/ha). At 100% RDF, CSH 22SS (24.9 t/ha) and CSV19 SS (24.7 t/ha) responded significantly as compared to the rest of the cultivars (Table1.1-3).
5 Agronomy and P hysiology report-agm09.doc Page 11 of 25
Table1.1-3. Dry fodder and stalk yields (t/ha) of sweet sorghum as influenced by interaction of fertility and genotypes at Akola
Dry fodder yield (t/ha) Stalk yield (t/ha)
Genotypes 50% RDF 100% RDF
150% RDF
Mean 50% RDF 100% RDF
150% RDF
Mean
SPSSV 11 13.6 19.9 27.3 20.3 21.4 31.1 42.6 31.7 SPSSV 6 16.1 22 28.8 22.3 25.1 34.3 45.0 34.8 SSV 84 ( C) 12.4 18.7 27.8 19.6 19.3 29.2 43.5 30.7 CSH 22SS(C) 15.5 24.9 29.7 23.4 24.2 39 46.4 36.5 CSV19SS (C ) 16.4 24.7 28.4 23.2 25.6 38.5 44.3 36.2 Mean 14.8 22 28.4 23.1 34.4 44.4 CD (P=0.05) AiBi-AiBj 2.1 3.2 AiBi-AjBi 2.2 3.1
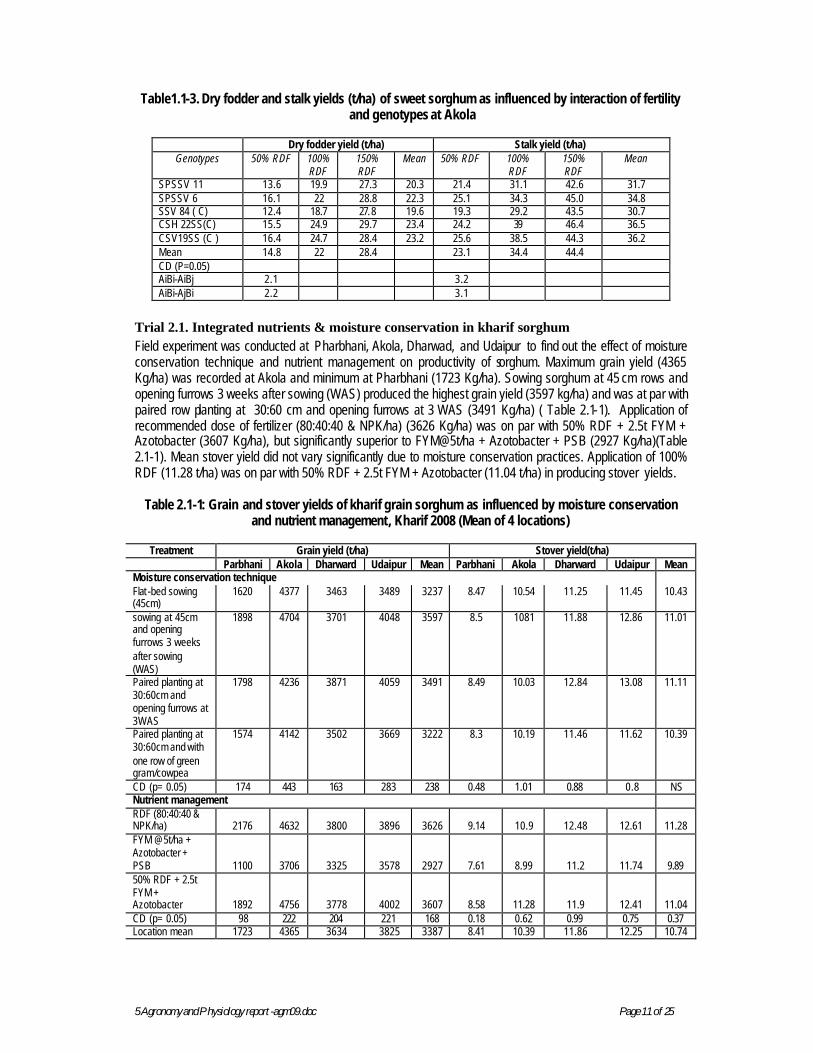
Trial 2.1. Integrated nutrients & moisture conservation in kharif sorghum Field experiment was conducted at Pharbhani, Akola, Dharwad, and Udaipur to find out the effect of moisture conservation technique and nutrient management on productivity of sorghum. Maximum grain yield (4365 Kg/ha) was recorded at Akola and minimum at Pharbhani (1723 Kg/ha). Sowing sorghum at 45 cm rows and opening furrows 3 weeks after sowing (WAS) produced the highest grain yield (3597 kg/ha) and was at par with paired row planting at 30:60 cm and opening furrows at 3 WAS (3491 Kg/ha) ( Table 2.1-1). Application of recommended dose of fertilizer (80:40:40 & NPK/ha) (3626 Kg/ha) was on par with 50% RDF + 2.5t FYM + Azotobacter (3607 Kg/ha), but significantly superior to FYM@5t/ha + Azotobacter + PSB (2927 Kg/ha)(Table 2.1-1). Mean stover yield did not vary significantly due to moisture conservation practices. Application of 100% RDF (11.28 t/ha) was on par with 50% RDF + 2.5t FYM + Azotobacter (11.04 t/ha) in producing stover yields.
Table 2.1-1: Grain and stover yields of kharif grain sorghum as influenced by moisture conservation and nutrient management, Kharif 2008 (Mean of 4 locations)
Treatment Grain yield (t/ha) Stover yield(t/ha)
Parbhani Akola Dharward Udaipur Mean Parbhani Akola Dharward Udaipur Mean Moisture conservation technique Flat -bed sowing (45cm)
1620 4377 3463 3489 3237 8.47 10.54 11.25 11.45 10.43
sowing at 45cm and opening furrows 3 weeks after sowing (WAS)
1898 4704 3701 4048 3597 8.5 1081 11.88 12.86 11.01
Paired planting at 30:60cm and opening furrows at 3WAS
1798 4236 3871 4059 3491 8.49 10.03 12.84 13.08 11.11
Paired planting at 30:60cm and with one row of green gram/cowpea
1574 4142 3502 3669 3222 8.3 10.19 11.46 11.62 10.39
CD (p= 0.05) 174 443 163 283 238 0.48 1.01 0.88 0.8 NS Nutrient management RDF (80:40:40 & NPK/ha) 2176 4632 3800 3896 3626 9.14 10.9 12.48 12.61 11.28 FYM @5t/ha + Azotobacter + PSB 1100 3706 3325 3578 2927 7.61 8.99 11.2 11.74 9.89 50% RDF + 2.5t FYM + Azotobacter 1892 4756 3778 4002 3607 8.58 11.28 11.9 12.41 11.04 CD (p= 0.05) 98 222 204 221 168 0.18 0.62 0.99 0.75 0.37 Location mean 1723 4365 3634 3825 3387 8.41 10.39 11.86 12.25 10.74
5 Agronomy and P hysiology report-agm09.doc Page 12 of 25
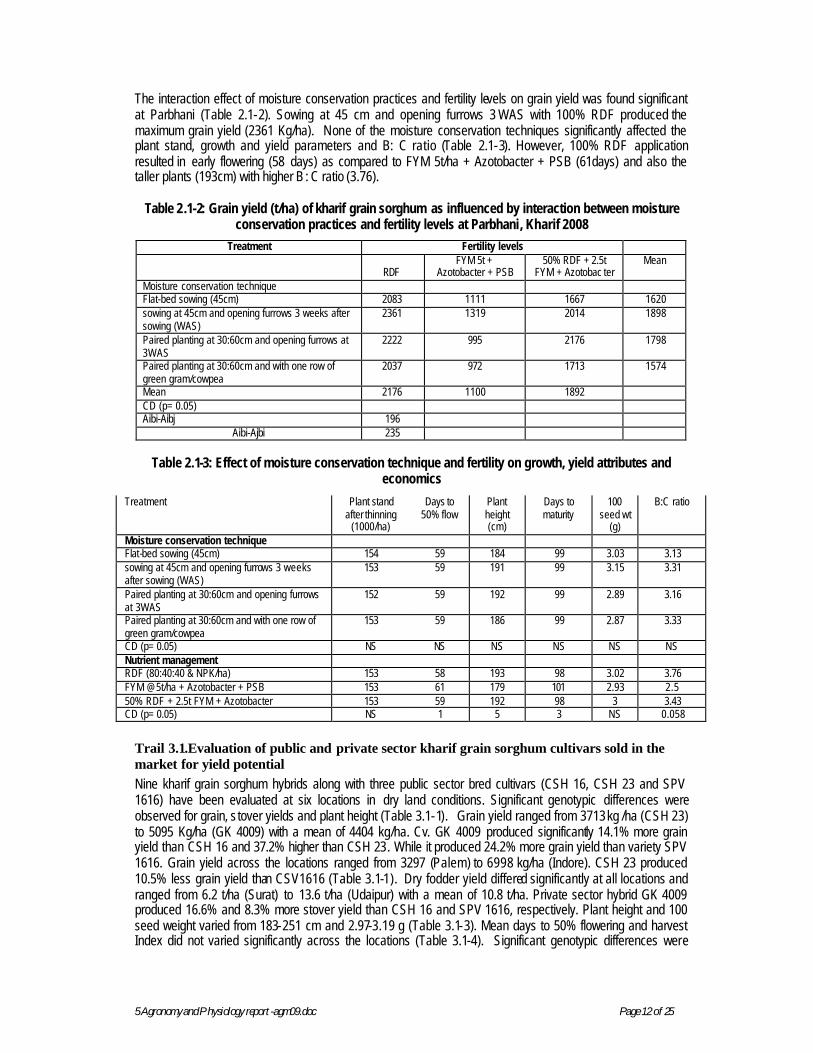
The interaction effect of moisture conservation practices and fertility levels on grain yield was found significant at Parbhani (Table 2.1-2). Sowing at 45 cm and opening furrows 3 WAS with 100% RDF produced the maximum grain yield (2361 Kg/ha). None of the moisture conservation techniques significantly affected the plant stand, growth and yield parameters and B: C ratio (Table 2.1-3). However, 100% RDF application resulted in early flowering (58 days) as compared to FYM 5t/ha + Azotobacter + PSB (61days) and also the taller plants (193cm) with higher B : C ratio (3.76).
Table 2.1-2: Grain yield (t/ha) of kharif grain sorghum as influenced by interaction between moisture conservation practices and fertility levels at Parbhani, Kharif 2008
Treatment Fertility levels
RDF FYM 5t +
Azotobacter + PSB 50% RDF + 2.5t
FYM + Azotobac ter Mean
Moisture conservation technique Flat-bed sowing (45cm) 2083 1111 1667 1620 sowing at 45cm and opening furrows 3 weeks after sowing (WAS)
2361 1319 2014 1898
Paired planting at 30:60cm and opening furrows at 3WAS
2222 995 2176 1798
Paired planting at 30:60cm and with one row of green gram/cowpea
2037 972 1713 1574
Mean 2176 1100 1892 CD (p= 0.05) Aibi-Aibj 196
Aibi-Ajbi 235
Table 2.1-3: Effect of moisture conservation technique and fertility on growth, yield attributes and economics
Treatment Plant stand after thinning
(1000/ha)
Days to 50% flow
Plant height (cm)
Days to maturity
100 seed wt
(g)
B:C ratio
Moisture conservation technique Flat-bed sowing (45cm) 154 59 184 99 3.03 3.13 sowing at 45cm and opening furrows 3 weeks after sowing (WAS)
153 59 191 99 3.15 3.31
Paired planting at 30:60cm and opening furrows at 3WAS
152 59 192 99 2.89 3.16
Paired planting at 30:60cm and with one row of green gram/cowpea
153 59 186 99 2.87 3.33
CD (p= 0.05) NS NS NS NS NS NS Nutrient management RDF (80:40:40 & NPK/ha) 153 58 193 98 3.02 3.76 FYM @5t/ha + Azotobacter + PSB 153 61 179 101 2.93 2.5 50% RDF + 2.5t FYM + Azotobacter 153 59 192 98 3 3.43 CD (p= 0.05) NS 1 5 3 NS 0.058
Trail 3.1.Evaluation of public and private sector kharif grain sorghum cultivars sold in the market for yield potential Nine kharif grain sorghum hybrids along with three public sector bred cultivars (CSH 16, CSH 23 and SPV 1616) have been evaluated at six locations in dry land conditions. Significant genotypic differences were observed for grain, s tover yields and plant height (Table 3.1-1). Grain yield ranged from 3713 kg /ha (CSH 23) to 5095 Kg/ha (GK 4009) with a mean of 4404 kg/ha. Cv. GK 4009 produced significantly 14.1% more grain yield than CSH 16 and 37.2% higher than CSH 23. While it produced 24.2% more grain yield than variety SPV 1616. Grain yield across the locations ranged from 3297 (Palem) to 6998 kg/ha (Indore). CSH 23 produced 10.5% less grain yield than CSV1616 (Table 3.1-1). Dry fodder yield differed significantly at all locations and ranged from 6.2 t/ha (Surat) to 13.6 t/ha (Udaipur) with a mean of 10.8 t/ha. Private sector hybrid GK 4009 produced 16.6% and 8.3% more stover yield than CSH 16 and SPV 1616, respectively. Plant height and 100 seed weight varied from 183-251 cm and 2.97-3.19 g (Table 3.1-3). Mean days to 50% flowering and harvest Index did not varied significantly across the locations (Table 3.1-4). Significant genotypic differences were

5 Agronomy and P hysiology report-agm09.doc Page 13 of 25
observed for gross returns, net returning, B: C ration at Akola, Surat and Udaipur. The net returns and B: C ranged from Rs 30497-40141 and 2.72-3.44, respectively. Bhagyalakshmi 296, GK 4009 and MSH 51 showed higher B: C ratio than others (Table 3.1-5). Table 3.1.1 Evaluation of public and private sector kharif grain sorghum cultivars sold in the market for
yield potentials, Kharif, 2008, ( Mean of 6 Loc-Palem, Parbh, Akola, Indore, Surat, & Udaipur)
S. No
Name Grain yield (kg/ha)
Stover yield
(kg/ha)
Plant height (cm)
100-seed wt(g)
Days to flowering
(days)
Harvest Index (%)
Net return (Rs/ha)
B:C ratio
1 MSH 51 4315 10152 183 3.15 64 30.7 37015 3.09 2 Glow 4355 11266 193 3.05 64 29.5 36366 2.96 3 PJH 65 4602 11395 214 3.17 64 29.8 39525 3.04 4 MRS 4094 4582 11115 197 2.98 66 29.7 34191 2.74 5 GK 4013 4273 9929 185 3.11 64 30.7 32018 2.72 6 GK 4009 5095 12157 200 3.19 66 30.7 40141 3.21 7 Ajeet 997 4633 11254 201 3.03 63 30.3 36127 2.99 8 Bhagyalakshmi 296 4439 11070 195 3.02 62 28.1 38891 3.44 9 Mahabeej 7 4275 10612 206 2.97 65 30.0 32844 2.92 10 CSH 23 3713 9602 195 3.06 62 29.2 30497 2.73 11 CSH 16 4464 10427 200 3.05 62 32.0 35381 2.84 12 SPV 1616 4104 11221 251 2.98 67 26.9 31949 2.89 LOC. MEAN 4404 10850 202 3.06 64 29.8 35412 2.96 CD (0.05) 628 1501 14 0.27 5 3.6 7503 0.67 CV (%) 12.3 12.0 5.88 6.82 5.3 6.1 9.4 9.35
Trial 4.1. Maximization of kharif sorghum yield Field experiments was conducted at 8 centers to find out the effect of increasing fertility levels on yields of different sorghum genotypes as influenced by various planting geometries (Table 4.1-1). Different planting geometries did not effect the grain yield except at Udaipur, where 45 x 15 cm spacing produced (10.3%) higher yield (4620 Kg/ha) than that of 45 x 10 cm (4188 Kg/ha). The performance of different genotypes varied across the centres indicated that SPV 1616 produced maximum grain yield at Coimbatore (4358 kg/ha) and Indore (7064 Kg/ha), where as CS H 16 yielded higher at parbhani (3226 kg/ha), Akola (4628 Kg/ha), dharwad (3435 Kg/ha) and Udaipur (4689 Kg/ha). Overall, CSH 16 being at par with SPV 1616 produced the maximum grain yield (3851 kg/ha) as compared to local checks (3166 Kg/ha). Increasing levels of fertility from 100% RDF to 150% RDF + 5t FYM/ ha significantly increased the grain yield at coimbatore, parbhani, akola and D harwad. There was no response of adding 5t FYM/ha at Indore and Udaipur centres. Application of 150% RDF and 150% RDF + 5t FYM/ ha increased the grain yield of sorghum by 12.6% and 19.8% respectively as compared to 100% RDF alone (Table 4.1-1). Table: effect of planting geometry, genotype and fertility levels on grain yield of kharif sorghum
Treatment Coimbatore Parbhani Akola Dharwad Indore Udaipur Maurinipur Deesa Mean Planting geometry 45 x 15 cm 4154 3251 3747 2929 5555 4620 1909 1903 3509 45 x 10 cm 4204 2241 3789 3151 5682 4188 2070 1977 3412 CD (p= 0.05) NS 149 NS NS NS 410 NS NS NS Genotype CSH 23 4029 2417 4308 2993 3863 4464 2004 2390 3309 CSH 16 4244 3226 4628 3435 6373 4689 2011 2199 3851 SPV 1616 4358 2916 3034 2969 7064 4117 1948 1721 3516 Local check 4086 2424 3103 2764 5176 4344 1995 1438 3166 CD (p= 0.05) 242 83 41 104 258 225 NS 106 437 Local check Co(s)28 PVK 801 SPV 669 DSV 6 JJ1022 CSV 23 N GJ39 N Fertility levels 100% RDF 3653 2364 3414 2847 4924 4213 1928 1645 3123 150% RDF 4167 2708 3826 3066 5988 4413 1977 1973 3517 150% RDF + 5t FYM 4717 3166 4065 3207 5944 4567 2064 2194 3740 CD (p= 0.05) 126 53 44 86 243 203 NS 106 96 Local mean 4179 2746 3768 3040 5619 4404 1990 1937 3460
5 Agronomy and P hysiology report-agm09.doc Page 14 of 25
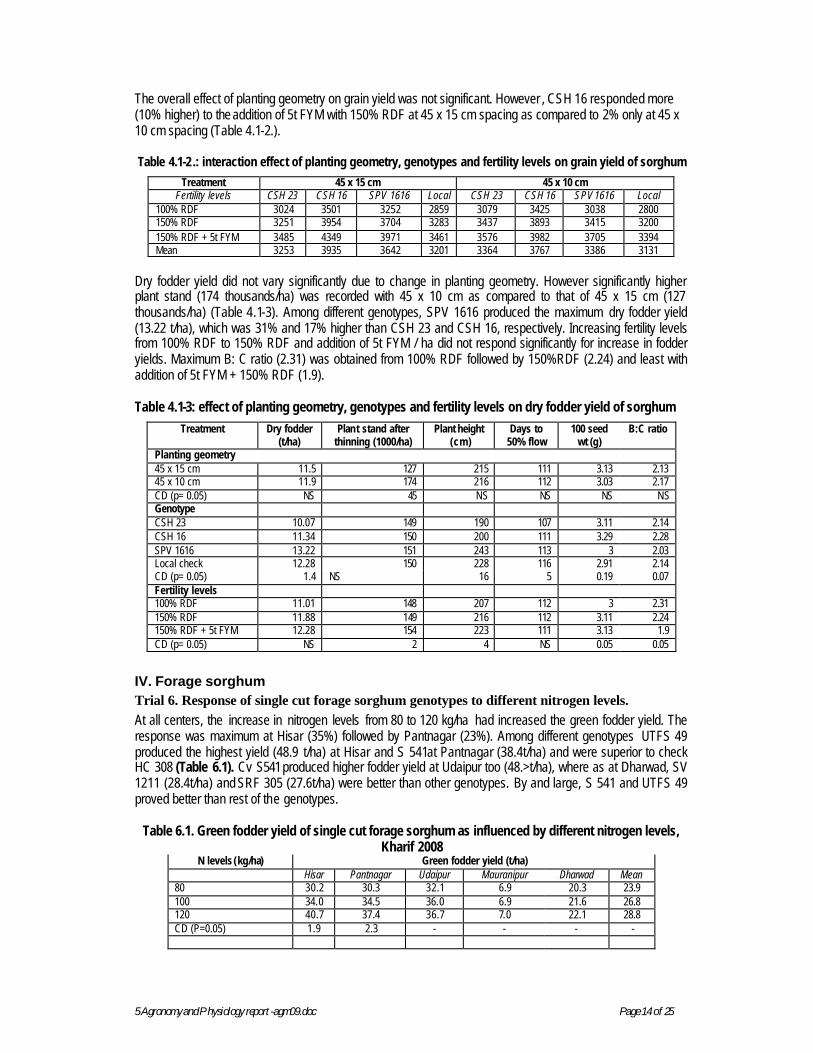
The overall effect of planting geometry on grain yield was not significant. However , CSH 16 responded more (10% higher) to the addition of 5t FYM with 150% RDF at 45 x 15 cm spacing as compared to 2% only at 45 x 10 cm spacing (Table 4.1-2.). Table 4.1-2.: interaction effect of planting geometry, genotypes and fertility levels on grain yield of sorghum
Treatment 45 x 15 cm 45 x 10 cm Fertility levels CSH 23 CSH 16 SPV 1616 Local CSH 23 CSH 16 SPV 1616 Local
100% RDF 3024 3501 3252 2859 3079 3425 3038 2800 150% RDF 3251 3954 3704 3283 3437 3893 3415 3200 150% RDF + 5t FYM 3485 4349 3971 3461 3576 3982 3705 3394 Mean 3253 3935 3642 3201 3364 3767 3386 3131
Dry fodder yield did not vary significantly due to change in planting geometry. However significantly higher plant stand (174 thousands/ha) was recorded with 45 x 10 cm as compared to that of 45 x 15 cm (127 thousands/ha) (Table 4.1-3). Among different genotypes, SPV 1616 produced the maximum dry fodder yield (13.22 t/ha), which was 31% and 17% higher than CSH 23 and CSH 16, respectively. Increasing fertility levels from 100% RDF to 150% RDF and addition of 5t FYM / ha did not respond significantly for increase in fodder yields. Maximum B: C ratio (2.31) was obtained from 100% RDF followed by 150%RDF (2.24) and least with addition of 5t FYM + 150% RDF (1.9). Table 4.1-3: effect of planting geometry, genotypes and fertility levels on dry fodder yield of sorghum
Treatment Dry fodder (t/ha)
Plant stand after thinning (1000/ha)
Plant height (cm)
Days to 50% flow
100 seed wt (g)
B:C ratio
Planting geometry 45 x 15 cm 11.5 127 215 111 3.13 2.13 45 x 10 cm 11.9 174 216 112 3.03 2.17 CD (p= 0.05) NS 45 NS NS NS NS Genotype CSH 23 10.07 149 190 107 3.11 2.14 CSH 16 11.34 150 200 111 3.29 2.28 SPV 1616 13.22 151 243 113 3 2.03 Local check 12.28 150 228 116 2.91 2.14 CD (p= 0.05) 1.4 NS 16 5 0.19 0.07 Fertility levels 100% RDF 11.01 148 207 112 3 2.31 150% RDF 11.88 149 216 112 3.11 2.24 150% RDF + 5t FYM 12.28 154 223 111 3.13 1.9 CD (p= 0.05) NS 2 4 NS 0.05 0.05
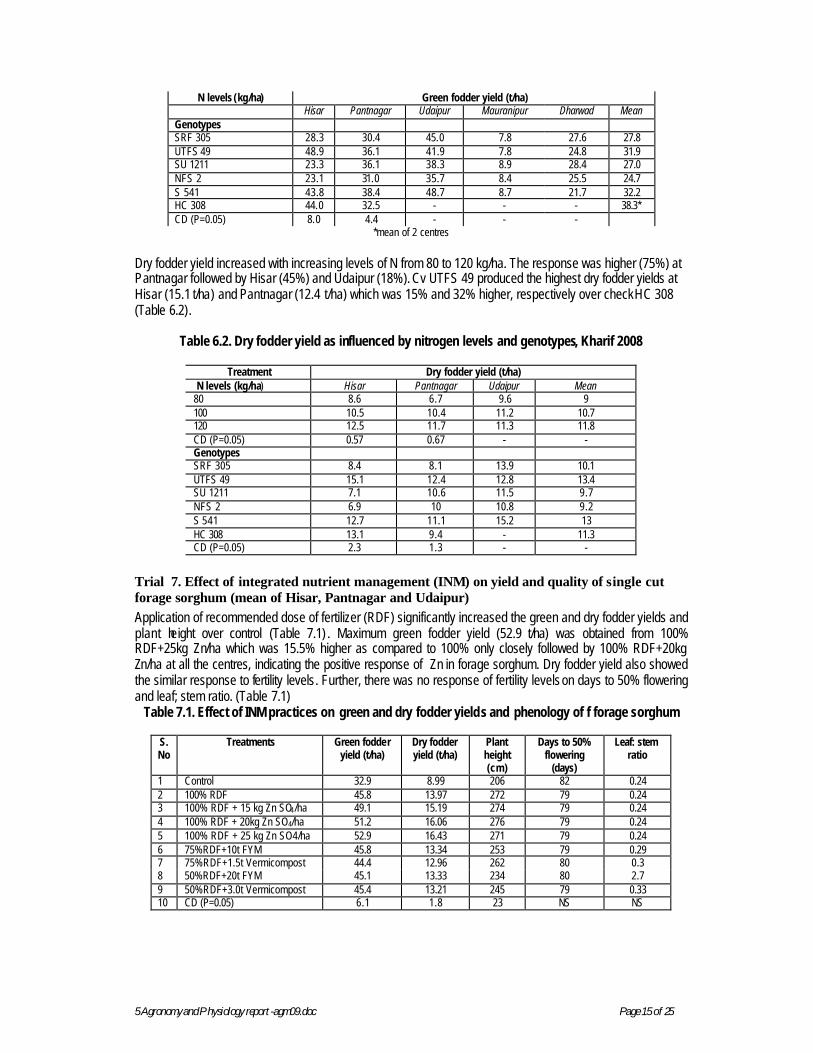
IV. Forage sorghum Trial 6. Response of single cut forage sorghum genotypes to different nitrogen levels. At all centers, the increase in nitrogen levels from 80 to 120 kg/ha had increased the green fodder yield. The response was maximum at Hisar (35%) followed by Pantnagar (23%). Among different genotypes UTFS 49 produced the highest yield (48.9 t/ha) at Hisar and S 541at Pantnagar (38.4t/ha) and were superior to check HC 308 (Table 6.1). Cv S541produced higher fodder yield at Udaipur too (48.>t/ha), where as at Dharwad, SV 1211 (28.4t/ha) and SRF 305 (27.6t/ha) were better than other genotypes. By and large, S 541 and UTFS 49 proved better than rest of the genotypes.
Table 6.1. Green fodder yield of single cut forage sorghum as influenced by different nitrogen levels, Kharif 2008
N levels (kg/ha) Green fodder yield (t/ha) Hisar Pantnagar Udaipur Mauranipur Dharwad Mean 80 30.2 30.3 32.1 6.9 20.3 23.9 100 34.0 34.5 36.0 6.9 21.6 26.8 120 40.7 37.4 36.7 7.0 22.1 28.8 CD (P=0.05) 1.9 2.3 - - - -
5 Agronomy and P hysiology report-agm09.doc Page 15 of 25
N levels (kg/ha) Green fodder yield (t/ha) Hisar Pantnagar Udaipur Mauranipur Dharwad Mean Genotypes SRF 305 28.3 30.4 45.0 7.8 27.6 27.8 UTFS 49 48.9 36.1 41.9 7.8 24.8 31.9 SU 1211 23.3 36.1 38.3 8.9 28.4 27.0 NFS 2 23.1 31.0 35.7 8.4 25.5 24.7 S 541 43.8 38.4 48.7 8.7 21.7 32.2 HC 308 44.0 32.5 - - - 38.3* CD (P=0.05) 8.0 4.4 - - -
*mean of 2 centres Dry fodder yield increased with increasing levels of N from 80 to 120 kg/ha. The response was higher (75%) at Pantnagar followed by Hisar (45%) and Udaipur (18%). Cv UTFS 49 produced the highest dry fodder yields at Hisar (15.1 t/ha) and Pantnagar (12.4 t/ha) which was 15% and 32% higher, respectively over check HC 308 (Table 6.2).
Table 6.2. Dry fodder yield as influenced by nitrogen levels and genotypes, Kharif 2008
Treatment Dry fodder yield (t/ha) N levels (kg/ha) Hisar Pantnagar Udaipur Mean 80 8.6 6.7 9.6 9 100 10.5 10.4 11.2 10.7 120 12.5 11.7 11.3 11.8 CD (P=0.05) 0.57 0.67 - - Genotypes SRF 305 8.4 8.1 13.9 10.1 UTFS 49 15.1 12.4 12.8 13.4 SU 1211 7.1 10.6 11.5 9.7 NFS 2 6.9 10 10.8 9.2 S 541 12.7 11.1 15.2 13 HC 308 13.1 9.4 - 11.3 CD (P=0.05) 2.3 1.3 - -
Trial 7. Effect of integrated nutrient management (INM) on yield and quality of single cut forage sorghum (mean of Hisar, Pantnagar and Udaipur) Application of recommended dose of fertilizer (RDF) significantly increased the green and dry fodder yields and plant height over control (Table 7.1) . Maximum green fodder yield (52.9 t/ha) was obtained from 100% RDF+25kg Zn/ha which was 15.5% higher as compared to 100% only closely followed by 100% RDF+20kg Zn/ha at all the centres, indicating the positive response of Zn in forage sorghum. Dry fodder yield also showed the similar response to fertility levels. Further, there was no response of fertility levels on days to 50% flowering and leaf; stem ratio. (Table 7.1)
Table 7.1. Effect of INM practices on green and dry fodder yields and phenology of f forage sorghum
S. No
Treatments Green fodder yield (t/ha)
Dry fodder yield (t/ha)
Plant height (cm)
Days to 50% flowering
(days)
Leaf: stem ratio
1 Control 32.9 8.99 206 82 0.24 2 100% RDF 45.8 13.97 272 79 0.24 3 100% RDF + 15 kg Zn SO4/ha 49.1 15.19 274 79 0.24 4 100% RDF + 20kg Zn SO4/ha 51.2 16.06 276 79 0.24 5 100% RDF + 25 kg Zn SO4/ha 52.9 16.43 271 79 0.24 6 75%RDF+10t FYM 45.8 13.34 253 79 0.29 7 75%RDF+1.5t Vermicompost 44.4 12.96 262 80 0.3 8 50%RDF+20t FYM 45.1 13.33 234 80 2.7 9 50%RDF+3.0t Vermicompost 45.4 13.21 245 79 0.33 10 CD (P=0.05) 6.1 1.8 23 NS NS

5 Agronomy and P hysiology report-agm09.doc Page 16 of 25
Trial 8. Inter cropping studies on single cut forage sorghum (Pantnagar) The experiment was conducted at Pantnagar to study the effect legume intercrops on forage Yield of sorghum. Two legumes v iz., Phillipesara and Cowpea were intercropped with forage sorghum in different proportions as 1:1, 2:1 and 2:2 (Table 8.1). Results revealed that intercropping of both legumes increased the total green fodder yields as compared to sorghum alone. None of the intercrops had direct increase on sorghum green fodder y ield. Sorghum + Phillipesara (2:1) and sorghum + Cowpea (2:2) produced higher sorghum green fodder as compared to other row ratios. Overall, Sorghum+Phillipesara intercropping was slightly better than sorghum + Cowpea intercropping in terms of total green fodder productivity. Sorghum + Phillipesara (2:1) produced equal amount of dry fodder of sorghum as sorghum alone in addition to 5.4 t/ha fodder y ield of Phillipesara.
Table: 8.1 Effect of intercropping on fodder yield of sorghum, Kharif 2008
Treatments Green fodder yield (t/ha) Dry fodder yield (t/ha) Sorghum Phillipesara Cowpea Total Sorghum Phillipesara Cowpea Total Sole sorghum 38.7 - - 38.7 10.5 - - 10.5 Sole Phillipesara (Wild moong) - 44.2 - 44.2 - 10.5 - 10.5 Sole Cowpea - - 53.8 53.8 - - 9.9 9.9 Sorghum+Philipesara (1:1) 29.2 28.8 - 58.0 5.8 5.6 - 11.4 (2:1) 34.2 25.8 - 60.0 10.5 5.4 - 15.9 (2:2) 30.8 32.1 - 62.9 6.7 5.9 - 12.6 Sorghum+Cowpea (1:1) 27.9 - 31.3 59.2 5.7 - 4.8 10.5 (2:1) 25.8 - 33.8 59.6 5.5 - 4.7 10.2 (2:2) 32.1 - 24.2 56.3 7.2 - 4.3 11.5 CD (P=0.05) 2.5 9.2 15.3 - 0.58 1.8 2.5 -
Trial 9. Response of multi cut forage sorghum genotypes to different nitrogen levels Increasing levels of N from 0 to 150 kg/ha significantly increased the green and dry fodder yields as well as plant height and leaf to stem ratio. Maximum green fodder (100.8 t/ha) and dry fodder yield (45.4 t/ha) was obtained with 150kg N/ha (Table 9.1). Among different genotypes, GK 909 (89.3t/ha) being at par with Local (87.5t) followed by CSH 20MF (85.3t/ha) produced the highest green fodder yield than others. Similar trend was observed with dry fodder yield too. Different genotypes did not vary significantly with respect to plant height and days to 50% flowering, however, significantly higher leaf to stem ratio (0.87 and 0.86) was obtained with GK 909 and UTMC 534 ( Table 9.1). Table 9.1. Effect of nitrogen levels and genotypes on dry and green fodder yields, phenology in multi-
cut forage sorghum, Kharif 2008
Treatment Green fodder yield (t/ha)
Dry fodder yield (t/ha)
Plant height (cm)
Leaf: stem ratio
Days to 50% flowering
N levels (kg/ha) 0 60.1 28.4 186 0.69 56 50 80.7 37.1 209 0.77 55 100 92.2 41.7 224 0.81 54 150 100.8 45.4 235 0.84 54 CD (p=0.05) 4.8 3.3 4 0.02 NS Genotypes UTMC 534 75.4 34.1 209 0.86 55 CSH 20MF 85.3 39.1 212 0.87 55 UTMCH 1304 79.7 35.5 207 0.65 54 GK 909 89.3 40.8 220 0.87 55 SSG 59 -3 (Local) 87.5 41.3 218 0.74 55 CD (p=0.05) 8.9 6.3 NS 0.02 NS
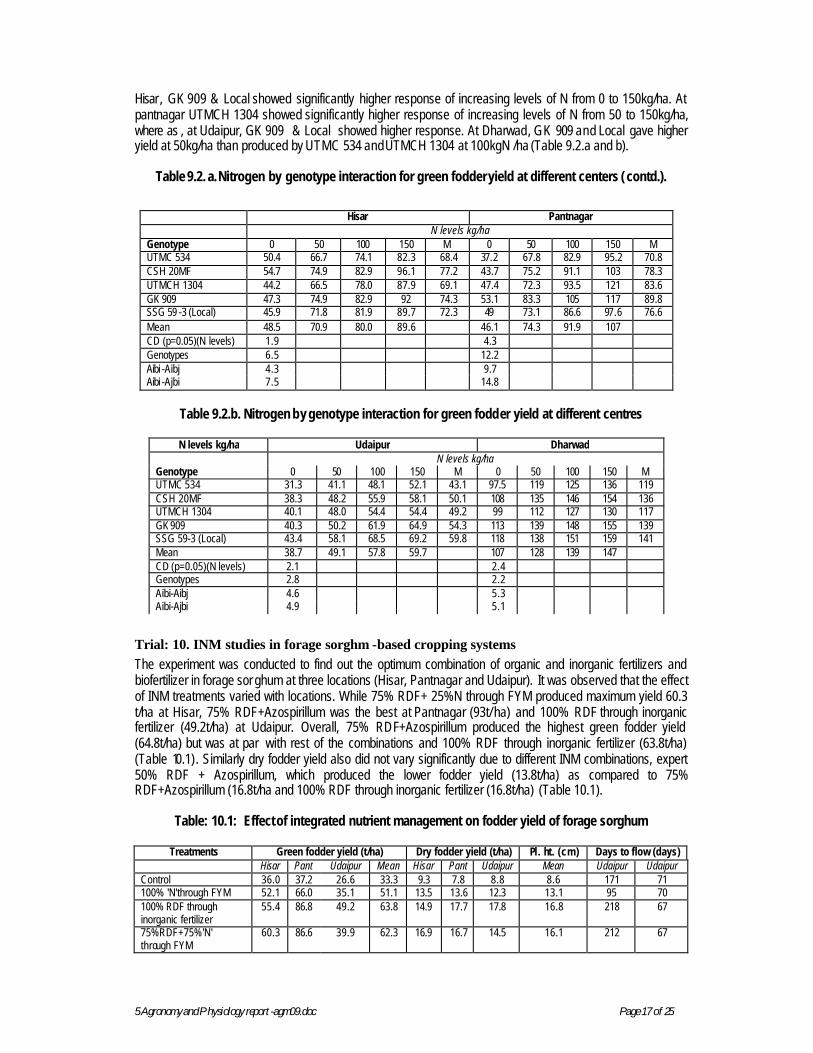
Interaction effect of nitrogen and genotypes for fodder yield was significant at different centres. At Hisar, the yields obtained from CSH 20MF (82.9), GK 909 (82.9) and Local (81.9) at 100 kg N/ha was as high as produced by UTMC 534 (82.3t/ha) at 150kg/ha (Table 9.2.a and b). At Udaipur the fodder yield obtained with Local (58.1t/ha) was as good as that obtained with UTMC 534, CSH 20MF and UTMCH 1304 at 150kg/ha. At
5 Agronomy and P hysiology report-agm09.doc Page 17 of 25
Hisar, GK 909 & Local showed significantly higher response of increasing levels of N from 0 to 150kg/ha. At pantnagar UTMCH 1304 showed significantly higher response of increasing levels of N from 50 to 150kg/ha, where as , at Udaipur, GK 909 & Local showed higher response. At Dharwad, GK 909 and Local gave higher yield at 50kg/ha than produced by UTMC 534 and UTMCH 1304 at 100kgN /ha (Table 9.2.a and b).
Table 9.2. a. Nitrogen by genotype interaction for green fodder yield at different centers ( contd.).
Table 9.2.b. Nitrogen by genotype interaction for green fodder yield at different centres
Trial: 10. INM studies in forage sorghm -based cropping systems The experiment was conducted to find out the optimum combination of organic and inorganic fertilizers and biofertilizer in forage sor ghum at three locations (Hisar, Pantnagar and Udaipur). It was observed that the effect of INM treatments varied with locations. While 75% RDF+ 25%N through FYM produced maximum yield 60.3 t/ha at Hisar, 75% RDF+Azospirillum was the best at Pantnagar (93t/ ha) and 100% RDF through inorganic fertilizer (49.2t/ha) at Udaipur. Overall, 75% RDF+Azospirillum produced the highest green fodder yield (64.8t/ha) but was at par with rest of the combinations and 100% RDF through inorganic fertilizer (63.8t/ha) (Table 10.1). Similarly dry fodder yield also did not vary significantly due to different INM combinations, expert 50% RDF + Azospirillum, which produced the lower fodder yield (13.8t/ha) as compared to 75% RDF+Azospirillum (16.8t/ha and 100% RDF through inorganic fertilizer (16.8t/ha) (Table 10.1).
Table: 10.1: Effect of integrated nutrient management on fodder yield of forage sorghum
Treatments Green fodder yield (t/ha) Dry fodder yield (t/ha) Pl. ht. (cm) Days to flow (days) Hisar Pant Udaipur Mean Hisar Pant Udaipur Mean Udaipur Udaipur Control 36.0 37.2 26.6 33.3 9.3 7.8 8.8 8.6 171 71 100% 'N'through FYM 52.1 66.0 35.1 51.1 13.5 13.6 12.3 13.1 95 70 100% RDF through inorganic fertilizer
55.4 86.8 49.2 63.8 14.9 17.7 17.8 16.8 218 67
75%RDF+75%'N' through FYM
60.3 86.6 39.9 62.3 16.9 16.7 14.5 16.1 212 67
Hisar Pantnagar N levels kg/ha Genotype 0 50 100 150 M 0 50 100 150 M UTMC 534 50.4 66.7 74.1 82.3 68.4 37.2 67.8 82.9 95.2 70.8 CSH 20MF 54.7 74.9 82.9 96.1 77.2 43.7 75.2 91.1 103 78.3 UTMCH 1304 44.2 66.5 78.0 87.9 69.1 47.4 72.3 93.5 121 83.6 GK 909 47.3 74.9 82.9 92 74.3 53.1 83.3 105 117 89.8 SSG 59 -3 (Local) 45.9 71.8 81.9 89.7 72.3 49 73.1 86.6 97.6 76.6 Mean 48.5 70.9 80.0 89.6 46.1 74.3 91.9 107 CD (p=0.05)(N levels) 1.9 4.3 Genotypes 6.5 12.2 Aibi -Aibj 4.3 9.7 Aibi -Ajbi 7.5 14.8
N levels kg/ha Udaipur Dharwad N levels kg/ha Genotype 0 50 100 150 M 0 50 100 150 M UTMC 534 31.3 41.1 48.1 52.1 43.1 97.5 119 125 136 119 CSH 20MF 38.3 48.2 55.9 58.1 50.1 108 135 146 154 136 UTMCH 1304 40.1 48.0 54.4 54.4 49.2 99 112 127 130 117 GK 909 40.3 50.2 61.9 64.9 54.3 113 139 148 155 139 SSG 59-3 (Local) 43.4 58.1 68.5 69.2 59.8 118 138 151 159 141 Mean 38.7 49.1 57.8 59.7 107 128 139 147 CD (p=0.05)(N levels) 2.1 2.4 Genotypes 2.8 2.2 Aibi-Aibj 4.6 5.3 Aibi-Ajbi 4.9 5.1
5 Agronomy and P hysiology report-agm09.doc Page 18 of 25
Treatments Green fodder yield (t/ha) Dry fodder yield (t/ha) Pl. ht. (cm) Days to flow (days) Hisar Pant Udaipur Mean Hisar Pant Udaipur Mean Udaipur Udaipur 50%RDF+50%'N' throughFYM
58.1 82.9 37.7 59.6 16.2 16.3 13.6 15.4 208 68
50%RDF+Azospirillum 50.2 79.8 35.6 55.2 13.1 15.5 12.8 13.8 199 69 50%RDf+25%'N'Through Fym+Azospirillum
53.9 82.7 47.2 61.3 14.6 16.2 17.1 16.0 210 67
75% RDF+ Azospirillum 52.7 93.0 48.6 64.8 13.4 19.3 17.6 16.8 214 69 CD(P=05) 4.3 12.7 5.6 12.9 1.6 3.2 1.9 2.7 1.4 NS
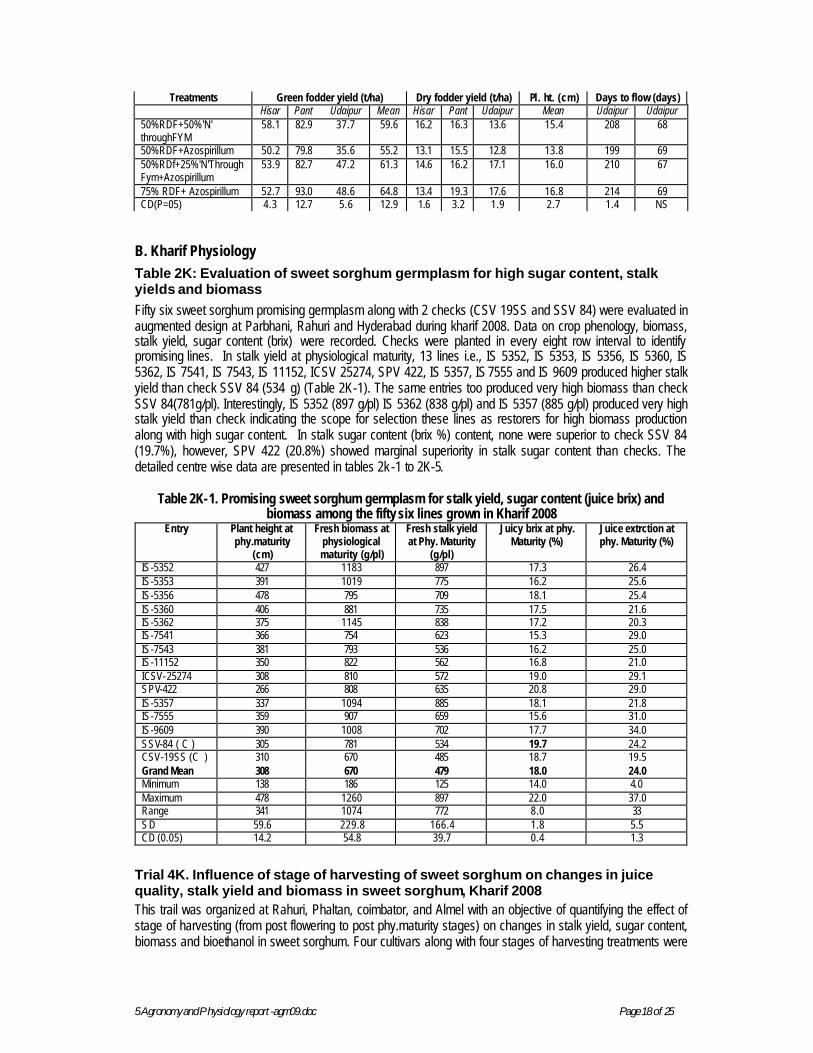
B. Kharif Physiology Table 2K: Evaluation of sweet sorghum germplasm for high sugar content, stalk yields and biomass Fifty six sweet sorghum promising germplasm along with 2 checks (CSV 19SS and SSV 84) were evaluated in augmented design at Parbhani, Rahuri and Hyderabad during kharif 2008. Data on crop phenology, biomass, stalk yield, sugar content (brix) were recorded. Checks were planted in every eight row interval to identify promising lines. In stalk yield at physiological maturity, 13 lines i.e., IS 5352, IS 5353, IS 5356, IS 5360, IS 5362, IS 7541, IS 7543, IS 11152, ICSV 25274, SPV 422, IS 5357, IS 7555 and IS 9609 produced higher stalk yield than check SSV 84 (534 g) (Table 2K-1). The same entries too produced very high biomass than check SSV 84(781g/pl). Interestingly, IS 5352 (897 g/pl) IS 5362 (838 g/pl) and IS 5357 (885 g/pl) produced very high stalk yield than check indicating the scope for selection these lines as restorers for high biomass production along with high sugar content. In stalk sugar content (brix %) content, none were superior to check SSV 84 (19.7%), however, SPV 422 (20.8%) showed marginal superiority in stalk sugar content than checks. The detailed centre wise data are presented in tables 2k -1 to 2K-5.
Table 2K-1. Promising sweet sorghum germplasm for stalk yield, sugar content (juice brix) and biomass among the fifty six lines grown in Kharif 2008
Entry Plant height at phy.maturity
(cm)
Fresh biomass at physiological maturity (g/pl)
Fresh stalk yield at Phy. Maturity
(g/pl)
Juicy brix at phy. Maturity (%)
Juice extrction at phy. Maturity (%)
IS-5352 427 1183 897 17.3 26.4 IS-5353 391 1019 775 16.2 25.6 IS-5356 478 795 709 18.1 25.4 IS-5360 406 881 735 17.5 21.6 IS-5362 375 1145 838 17.2 20.3 IS-7541 366 754 623 15.3 29.0 IS-7543 381 793 536 16.2 25.0 IS-11152 350 822 562 16.8 21.0 ICSV-25274 308 810 572 19.0 29.1 SPV-422 266 808 635 20.8 29.0 IS-5357 337 1094 885 18.1 21.8 IS-7555 359 907 659 15.6 31.0 IS-9609 390 1008 702 17.7 34.0 SSV-84 ( C ) 305 781 534 19.7 24.2 CSV-19SS (C ) 310 670 485 18.7 19.5 Grand Mean 308 670 479 18.0 24.0 Minimum 138 186 125 14.0 4.0 Maximum 478 1260 897 22.0 37.0 Range 341 1074 772 8.0 33 SD 59.6 229.8 166.4 1.8 5.5 CD (0.05) 14.2 54.8 39.7 0.4 1.3
Trial 4K. Influence of stage of harvesting of sweet sorghum on changes in juice quality, stalk yield and biomass in sweet sorghum, Kharif 2008 This trail was organized at Rahuri, Phaltan, coimbator, and Almel with an objective of quantifying the effect of stage of harvesting (from post flowering to post phy.maturity stages) on changes in stalk yield, sugar content, biomass and bioethanol in sweet sorghum. Four cultivars along with four stages of harvesting treatments were

5 Agronomy and P hysiology report-agm09.doc Page 19 of 25
tried in FRBD. Factor-A, comprising four cultivars include SSV84 (V1), CSH22SS (V2) CSV19SS (V3) and SPSSV 6 (V4), while, stages of harvesting (Factor B) include ;T1- harvesting at 15 days after flowering (DAF)-soft-dough stage; T2-harvesting at 30 DAF-hard-dough stage; T3-harvesting at 45 DAF- phy. maturity; and T4-harvesting at 60 DAF-post phy. maturity. Stalk Yields: Fresh stalk yield varied from 34.0 to 47.6 t/ha across cultivars and harvesting treatments with a mean of 41.0 t/ha. There were significant differences among cultivars for stalk yield but not among treatments. Similarly, the interaction effects were not significant. Stalk yield increased from 15 DAF to 45 DAF followed by a decline at 60 DAF. Harvesting at phy. maturity gave higher stalk yields than earlier stages. Juice brix: Brix values varied from 11 to 18% across cultivars and treatments. The differences in brix were significant among treatments but not the cultivars. Brix value increased significantly from 15 DAF to 60 DAF. Among the stages of harvest, brix value recorded was significantly higher by 17 % at physiological maturity than preceding stages, but on par with 60DAF (Table 4K.1). Juice extraction and yields: In general juice extraction declined from 15 DAF (43.6%) to 6 DAF (36.4%) across stages of harvest. Differences were significant among the treatments but not the cultivars. The extraction percent ranged between 36.0 and 45 % across the cultivars and treatments. Similarly, juice yields declined from 15 DAF to 60 DAF. Sugar Yields: Sugar yields ranged from 1.44 to 2.80 t/ha across cultivars and treatments. Sugar yields did not differed significantly among cultivars and treatments. It increased from 15 DAF to 30 DAF, while both 45 DAF and 60DAF treatments are at par to each other. Sugar yields declined by 22 % when sweet sorghum crop harvested at 45 DAF (phy mat) than at 30 DAF–hard dough stage. Bioethanol yields: Mean computed bioethanol yields varied from 725 to 1906 L/ha across cultivars and treatments (Table 4K.1). Differences in bioethanol yields were significant among cultivars and stages of harvest at Rahuri and Phaltan. Bioethanol yields increased from 15 DAF to 30 DAF, while, it declined at subsequent stages (45 DAF & 60 DAF). Harvesting at 45 DAF decreased the bioethanol yield by 20% as compared to that of 30 DAF.
Table 4K.-1 Effect of stage of crop harvesting and genotypes on bioethanol yield in kh arif sweet sorghum, Kharif 2008
Treatment Stalk yield ( t/ha) Bioethanol yield( L/ha)
Cultivars Rahuri Phaltan Coimbatore Mean Rahuri Phaltan Mean SSV84 43.9 25.7 36.1 35.2 789 815 802 CSH22SS 55.5 38.8 40.4 44.9 939 1401 1170 CSV19SS 53.3 45.8 38.9 46.0 940 1566 1253 SPSSV 6 52.4 27.7 33.5 37.8 853 854 854 CD (P=0.05) 1.7 10.1 2.6 9.1 18 314 - Stage of harvesting 15 DAF 49.1 34.9 32.9 39.0 785 1339 1062 30DAF 51.0 38.0 35.2 41.4 936 1367 1151 45DAF 52.1 34.7 40.3 42.4 885 1004 945 60DAF 53.1 30.2 40.6 41.3 916 926 921 CD (P=0.05) 7.2 3.7 4.4 3.0 13 138 - Location Mean 51.3 34.5 37.2 41.0 880 1159 1020
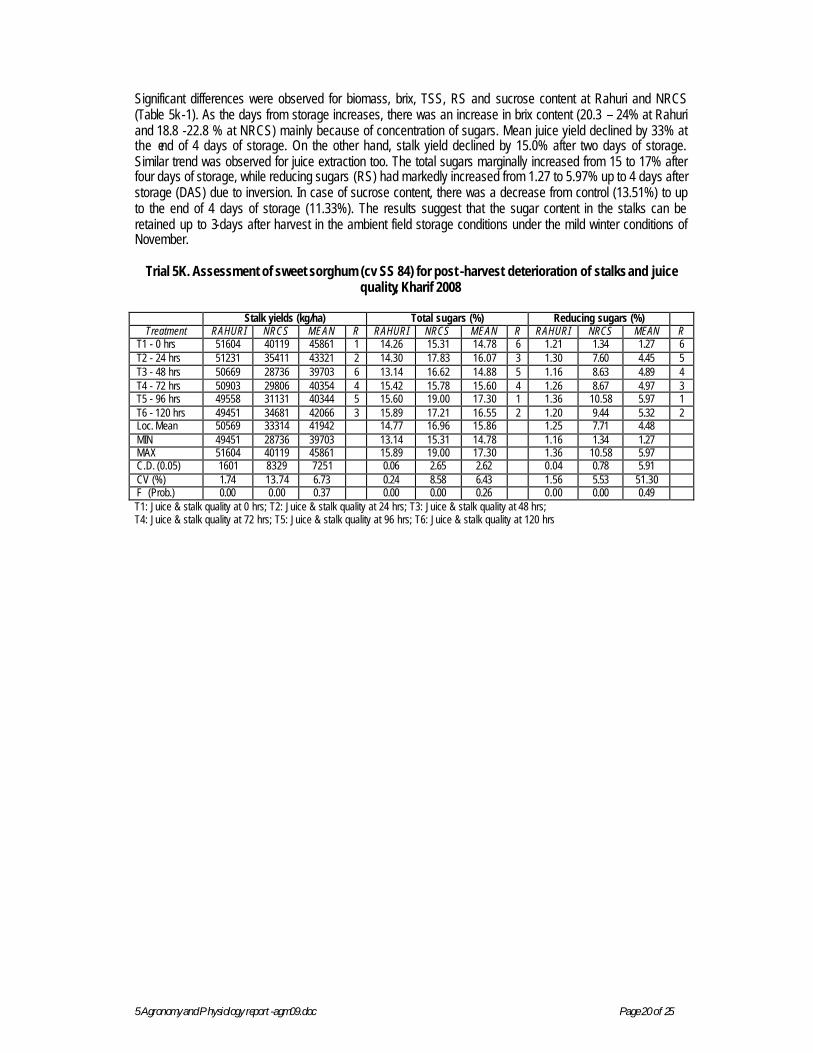
Trial 5K. Assessment of sweet sorghum for post-harvest deterioration of stalks and juice quality Sweet sorghum cultivar SSV 84 has been evaluated with an objective of assessing post-harvest deterioration of stalks and juice quality under ambient filed storage conditions. The stalks have been harvested immediately after physiological maturity and were stored in the ambient field conditions for five days. The juice was extracted at one day interval up to five days. Date on juice brix, components of sugar was analyzed every day up to five days after harvest along with a control (0 hour after harvest).
5 Agronomy and P hysiology report-agm09.doc Page 20 of 25
Significant differences were observed for biomass, brix, TSS, RS and sucrose content at Rahuri and NRCS (Table 5k-1). As the days from storage increases, there was an increase in brix content (20.3 – 24% at Rahuri and 18.8 -22.8 % at NRCS) mainly because of concentration of sugars. Mean juice yield declined by 33% at the end of 4 days of storage. On the other hand, stalk yield declined by 15.0% after two days of storage. Similar trend was observed for juice extraction too. The total sugars marginally increased from 15 to 17% after four days of storage, while reducing sugars (RS) had markedly increased from 1.27 to 5.97% up to 4 days after storage (DAS) due to inversion. In case of sucrose content, there was a decrease from control (13.51%) to up to the end of 4 days of storage (11.33%). The results suggest that the sugar content in the stalks can be retained up to 3-days after harvest in the ambient field storage conditions under the mild winter conditions of November.
Trial 5K. Assessment of sweet sorghum (cv SS 84) for post -harvest deterioration of stalks and juice quality, Kharif 2008
Stalk yields (kg/ha) Total sugars (%) Reducing sugars (%)
Treatment RAHURI NRCS MEAN R RAHURI NRCS MEAN R RAHURI NRCS MEAN R T1 - 0 hrs 51604 40119 45861 1 14.26 15.31 14.78 6 1.21 1.34 1.27 6 T2 - 24 hrs 51231 35411 43321 2 14.30 17.83 16.07 3 1.30 7.60 4.45 5 T3 - 48 hrs 50669 28736 39703 6 13.14 16.62 14.88 5 1.16 8.63 4.89 4 T4 - 72 hrs 50903 29806 40354 4 15.42 15.78 15.60 4 1.26 8.67 4.97 3 T5 - 96 hrs 49558 31131 40344 5 15.60 19.00 17.30 1 1.36 10.58 5.97 1 T6 - 120 hrs 49451 34681 42066 3 15.89 17.21 16.55 2 1.20 9.44 5.32 2 Loc. Mean 50569 33314 41942 14.77 16.96 15.86 1.25 7.71 4.48 MIN 49451 28736 39703 13.14 15.31 14.78 1.16 1.34 1.27 MAX 51604 40119 45861 15.89 19.00 17.30 1.36 10.58 5.97 C.D. (0.05) 1601 8329 7251 0.06 2.65 2.62 0.04 0.78 5.91 CV (%) 1.74 13.74 6.73 0.24 8.58 6.43 1.56 5.53 51.30 F (Prob.) 0.00 0.00 0.37 0.00 0.00 0.26 0.00 0.00 0.49 T1: Juice & stalk quality at 0 hrs; T2: Juice & stalk quality at 24 hrs; T3: Juice & stalk quality at 48 hrs; T4: Juice & stalk quality at 72 hrs; T5: Juice & stalk quality at 96 hrs; T6: Juice & stalk quality at 120 hrs

5 Agronomy and P hysiology report-agm09.doc Page 21 of 25
Annexure 1: Particulars of sowing and crop management followed at different centers - Agronomy and Physiology Trials, Kharif 2008
S.No Particulars Palem Coim-batore
Hydera-bad
Dhar-wad
Par-bhani
Akola Phaltan Indore Udaipur Pant-nagar
1 Soil texture Sandy loam Clay loam Clay loam Medium
Medium black soil Clay
Medium black clayey
Medium black soil Clay loam
Silty clay loam
2 Soil depth (cm): 100 Deep 75 100 100 3 Soil pH value (1:2.5 soils: water): 6.47 7.5 7.3 7.82 8.4 8.1 6.7 4 Field capacity (%): 32 18.1 5 Wilting point (%): 16 6.8 6 Bulk density(g/cc): 1.3 1.37 1.46 1.106 7 EC (1:2.5 soils: water) (d/Sm): 0.27 0.18 0.36 0.89 8 Soil organic matter (%) 0.72 0.88 0.54 0.741 0.49 9 Total soil nitrogen (%) 10 Available Nitrogen (kg/ha): 200 172.45 220 174 182 289.75 11 Available P2O5 (kg/ha): 28 15.8 21.2 15.4 23 20.35 44.1 12 Available K2O (kg/ha): 298 509.6 305 372 564 395.25 276
13 Date of sowing 27-Jun-08
18-Jun-08 19-Jun-08 15-Jun-08
26-Jun-08
2-Jul-08
25-Jun-08
22-Jun-08
3-Jul-08 30-Jun-08
14 Rainfall received during crop period (mm)
497.9 139 785 613 562 717 365 166.7 1654.4
5 Agronomy and P hysiology report-agm09.doc Page 22 of 25
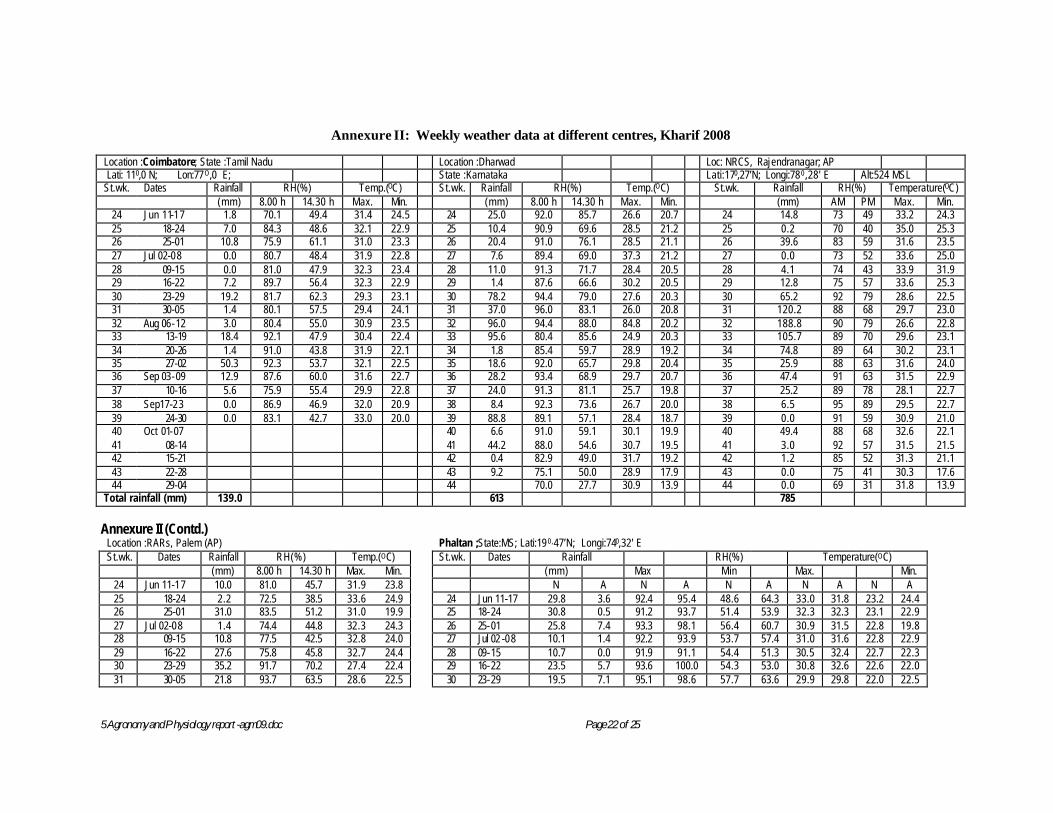
Annexure II: Weekly weather data at different centres, Kharif 2008
Location :Coimbatore; State :Tamil Nadu Location :Dharwad Loc: NRCS, Raj endranagar; AP Lati: 110,0 N; Lon:77O,0 E; State :Karnataka Lati:170,27’N; Longi:780,28' E Alt:524 MSL St.wk. Dates Rainfall RH(%) Temp.(OC) St.wk. Rainfall RH(%) Temp.(OC) St.wk. Rainfall RH(%) Temperature(OC) (mm) 8.00 h 14.30 h Max. Min. (mm) 8.00 h 14.30 h Max. Min. (mm) AM PM Max. Min.
24 Jun 11-17 1.8 70.1 49.4 31.4 24.5 24 25.0 92.0 85.7 26.6 20.7 24 14.8 73 49 33.2 24.3 25 18-24 7.0 84.3 48.6 32.1 22.9 25 10.4 90.9 69.6 28.5 21.2 25 0.2 70 40 35.0 25.3 26 25-01 10.8 75.9 61.1 31.0 23.3 26 20.4 91.0 76.1 28.5 21.1 26 39.6 83 59 31.6 23.5 27 Jul 02-08 0.0 80.7 48.4 31.9 22.8 27 7.6 89.4 69.0 37.3 21.2 27 0.0 73 52 33.6 25.0 28 09-15 0.0 81.0 47.9 32.3 23.4 28 11.0 91.3 71.7 28.4 20.5 28 4.1 74 43 33.9 31.9 29 16-22 7.2 89.7 56.4 32.3 22.9 29 1.4 87.6 66.6 30.2 20.5 29 12.8 75 57 33.6 25.3 30 23-29 19.2 81.7 62.3 29.3 23.1 30 78.2 94.4 79.0 27.6 20.3 30 65.2 92 79 28.6 22.5 31 30-05 1.4 80.1 57.5 29.4 24.1 31 37.0 96.0 83.1 26.0 20.8 31 120.2 88 68 29.7 23.0 32 Aug 06-12 3.0 80.4 55.0 30.9 23.5 32 96.0 94.4 88.0 84.8 20.2 32 188.8 90 79 26.6 22.8 33 13-19 18.4 92.1 47.9 30.4 22.4 33 95.6 80.4 85.6 24.9 20.3 33 105.7 89 70 29.6 23.1 34 20-26 1.4 91.0 43.8 31.9 22.1 34 1.8 85.4 59.7 28.9 19.2 34 74.8 89 64 30.2 23.1 35 27-02 50.3 92.3 53.7 32.1 22.5 35 18.6 92.0 65.7 29.8 20.4 35 25.9 88 63 31.6 24.0 36 Sep 03-09 12.9 87.6 60.0 31.6 22.7 36 28.2 93.4 68.9 29.7 20.7 36 47.4 91 63 31.5 22.9 37 10-16 5.6 75.9 55.4 29.9 22.8 37 24.0 91.3 81.1 25.7 19.8 37 25.2 89 78 28.1 22.7 38 Sep17-23 0.0 86.9 46.9 32.0 20.9 38 8.4 92.3 73.6 26.7 20.0 38 6.5 95 89 29.5 22.7 39 24-30 0.0 83.1 42.7 33.0 20.0 39 88.8 89.1 57.1 28.4 18.7 39 0.0 91 59 30.9 21.0 40 Oct 01-07 40 6.6 91.0 59.1 30.1 19.9 40 49.4 88 68 32.6 22.1 41 08-14 41 44.2 88.0 54.6 30.7 19.5 41 3.0 92 57 31.5 21.5 42 15-21 42 0.4 82.9 49.0 31.7 19.2 42 1.2 85 52 31.3 21.1 43 22-28 43 9.2 75.1 50.0 28.9 17.9 43 0.0 75 41 30.3 17.6 44 29-04 44 70.0 27.7 30.9 13.9 44 0.0 69 31 31.8 13.9
Total rainfall (mm) 139.0 613 785 Annexure II (Contd.)
Location :RARs, Palem (AP) Phaltan ;State:MS; Lati:190,47’N; Longi:740,32' E St.wk. Dates Rainfall RH(%) Temp.(OC) St.wk. Dates Rainfall RH(%) Temperature(OC) (mm) 8.00 h 14.30 h Max. Min. (mm) Max Min Max. Min.
24 Jun 11-17 10.0 81.0 45.7 31.9 23.8 N A N A N A N A N A 25 18-24 2.2 72.5 38.5 33.6 24.9 24 Jun 11-17 29.8 3.6 92.4 95.4 48.6 64.3 33.0 31.8 23.2 24.4 26 25-01 31.0 83.5 51.2 31.0 19.9 25 18-24 30.8 0.5 91.2 93.7 51.4 53.9 32.3 32.3 23.1 22.9 27 Jul 02-08 1.4 74.4 44.8 32.3 24.3 26 25-01 25.8 7.4 93.3 98.1 56.4 60.7 30.9 31.5 22.8 19.8 28 09-15 10.8 77.5 42.5 32.8 24.0 27 Jul 02 -08 10.1 1.4 92.2 93.9 53.7 57.4 31.0 31.6 22.8 22.9 29 16-22 27.6 75.8 45.8 32.7 24.4 28 09-15 10.7 0.0 91.9 91.1 54.4 51.3 30.5 32.4 22.7 22.3 30 23-29 35.2 91.7 70.2 27.4 22.4 29 16-22 23.5 5.7 93.6 100.0 54.3 53.0 30.8 32.6 22.6 22.0 31 30-05 21.8 93.7 63.5 28.6 22.5 30 23-29 19.5 7.1 95.1 98.6 57.7 63.6 29.9 29.8 22.0 22.5
5 Agronomy and P hysiology report-agm09.doc Page 23 of 25
Location :RARs, Palem (AP) Phaltan ;State:MS; Lati:190,47’N; Longi:740,32' E St.wk. Dates Rainfall RH(%) Temp.(OC) St.wk. Dates Rainfall RH(%) Temperature(OC) (mm) 8.00 h 14.30 h Max. Min. (mm) Max Min Max. Min.
32 Aug 06-12 95.0 99.7 78.4 26.1 21.6 31 30-05 18.6 15.8 94.1 98.3 59.7 66.3 29.5 30.1 22.1 22.5 33 13-19 66.4 98.4 67.4 27.9 22.4 32 Aug 06-12 17.1 23.4 95.3 100.0 62.8 74.9 28.8 27.6 22.3 22.4 34 20-26 13.2 85.5 59.8 29.6 22.4 33 13-19 6.9 15.0 94.3 100.0 56.3 68.9 29.8 29.0 21.9 22.1 35 27-02 0.0 82.7 47.4 32.3 23.9 34 20-26 23.8 4.8 95.2 100.0 55.3 55.1 30.2 31.6 21.7 20.0 36 Sep 03-09 34.0 103.5 69.8 33.8 25.5 35 27-02 15.2 67.3 94.4 100.0 54.4 56.3 30.5 33.1 21.4 22.6 37 10-16 32.6 105.2 77.8 31.8 28.3 36 Sep 03-09 30.2 156.0 95.6 100.0 53.0 69.6 31.0 31.4 21.6 22.4 38 Sep17-23 34.6 100.7 71.1 32.9 25.3 37 10-16 31.6 18.0 96.1 100.0 52.0 68.8 31.3 28.9 21.2 22.2 39 24-30 11.0 98.7 63.0 34.4 23.7 38 Sep17 -23 29.3 16.2 85.4 99.9 51.4 63.6 31.7 29.6 21.6 21.5 40 Oct 01-07 68.1 103.8 52.4 36.6 24.7 39 24-30 40.4 0.0 95.9 100.0 51.4 43.7 32.5 33.6 22.0 20.4 41 08-14 0.0 88.7 54.5 35.4 21.5 40 Oct 01-07 30.5 17.9 94.2 100.0 46.6 48.0 33.5 33.7 21.9 20.9 42 15-21 3.0 73.3 66.1 30.2 21.2 41 08-14 22.0 2.2 94.9 100.0 45.8 48.0 33.7 34.1 21.7 21.3 43 22-28 0.0 78.7 37.1 35.8 18.0 42 15-21 12.2 3.3 89.6 94.7 38.6 41.7 33.1 34.8 20.2 18.9 44 29-04 0.0 69.2 22.5 37.3 15.1 43 22-28 1.9 0.0 88.1 90.1 32.5 30.1 33.9 34.7 18.6 16.6
Total : 498 44 29-04 5.9 0.0 89.6 87.1 36.0 32.0 33.5 35.6 18.1 16.0 Total 435.79 365
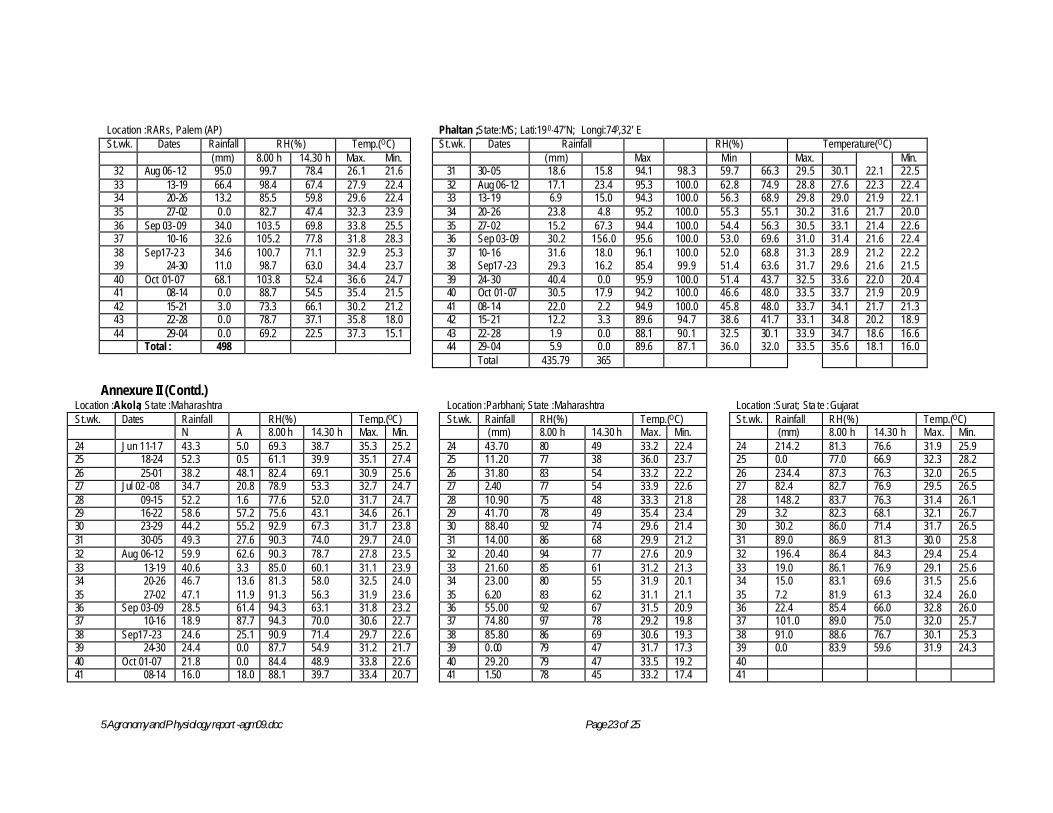
Annexure II (Contd.)
Location :Akola; State :Maharashtra Location :Parbhani; State :Maharashtra Location :Surat; Sta te :Gujarat St.wk. Dates Rainfall RH(%) Temp.(OC) St.wk. Rainfall RH(%) Temp.(OC) St.wk. Rainfall RH(%) Temp.(OC) N A 8.00 h 14.30 h Max. Min. (mm) 8.00 h 14.30 h Max. Min. (mm) 8.00 h 14.30 h Max. Min. 24 Jun 11-17 43.3 5.0 69.3 38.7 35.3 25.2 24 43.70 80 49 33.2 22.4 24 214.2 81.3 76.6 31.9 25.9 25 18-24 52.3 0.5 61.1 39.9 35.1 27.4 25 11.20 77 38 36.0 23.7 25 0.0 77.0 66.9 32.3 28.2 26 25-01 38.2 48.1 82.4 69.1 30.9 25.6 26 31.80 83 54 33.2 22.2 26 234.4 87.3 76.3 32.0 26.5 27 Jul 02 -08 34.7 20.8 78.9 53.3 32.7 24.7 27 2.40 77 54 33.9 22.6 27 82.4 82.7 76.9 29.5 26.5 28 09-15 52.2 1.6 77.6 52.0 31.7 24.7 28 10.90 75 48 33.3 21.8 28 148.2 83.7 76.3 31.4 26.1 29 16-22 58.6 57.2 75.6 43.1 34.6 26.1 29 41.70 78 49 35.4 23.4 29 3.2 82.3 68.1 32.1 26.7 30 23-29 44.2 55.2 92.9 67.3 31.7 23.8 30 88.40 92 74 29.6 21.4 30 30.2 86.0 71.4 31.7 26.5 31 30-05 49.3 27.6 90.3 74.0 29.7 24.0 31 14.00 86 68 29.9 21.2 31 89.0 86.9 81.3 30.0 25.8 32 Aug 06-12 59.9 62.6 90.3 78.7 27.8 23.5 32 20.40 94 77 27.6 20.9 32 196.4 86.4 84.3 29.4 25.4 33 13-19 40.6 3.3 85.0 60.1 31.1 23.9 33 21.60 85 61 31.2 21.3 33 19.0 86.1 76.9 29.1 25.6 34 20-26 46.7 13.6 81.3 58.0 32.5 24.0 34 23.00 80 55 31.9 20.1 34 15.0 83.1 69.6 31.5 25.6 35 27-02 47.1 11.9 91.3 56.3 31.9 23.6 35 6.20 83 62 31.1 21.1 35 7.2 81.9 61.3 32.4 26.0 36 Sep 03-09 28.5 61.4 94.3 63.1 31.8 23.2 36 55.00 92 67 31.5 20.9 36 22.4 85.4 66.0 32.8 26.0 37 10-16 18.9 87.7 94.3 70.0 30.6 22.7 37 74.80 97 78 29.2 19.8 37 101.0 89.0 75.0 32.0 25.7 38 Sep17-23 24.6 25.1 90.9 71.4 29.7 22.6 38 85.80 86 69 30.6 19.3 38 91.0 88.6 76.7 30.1 25.3 39 24-30 24.4 0.0 87.7 54.9 31.2 21.7 39 0.00 79 47 31.7 17.3 39 0.0 83.9 59.6 31.9 24.3 40 Oct 01-07 21.8 0.0 84.4 48.9 33.8 22.6 40 29.20 79 47 33.5 19.2 40 41 08-14 16.0 18.0 88.1 39.7 33.4 20.7 41 1.50 78 45 33.2 17.4 41

5 Agronomy and P hysiology report-agm09.doc Page 24 of 25
Location :Akola; State :Maharashtra Location :Parbhani; State :Maharashtra Location :Surat; Sta te :Gujarat St.wk. Dates Rainfall RH(%) Temp.(OC) St.wk. Rainfall RH(%) Temp.(OC) St.wk. Rainfall RH(%) Temp.(OC) N A 8.00 h 14.30 h Max. Min. (mm) 8.00 h 14.30 h Max. Min. (mm) 8.00 h 14.30 h Max. Min. 42 15-21 3.1 0.0 75.9 26.9 34.3 18.2 42 42 43 22-28 10.0 0.0 70.6 17.6 33.6 14.5 43 43 44 29-04 2.3 0.0 67.6 18.9 34.6 15.8 44 44 Total : 717 562 1254
Annexure II (C ontd.)
Location :Udaipur; State :Rajas than Location :Pantnagar ; State :Uttarkhand St.wk. Dates Rainfall (mm) RH(%) Temp.(OC) St.wk. Dates Rainfall RH(%) Temp.(OC) 8.00 h 14.30 h Max. Min. (mm) 8.00 h 14.30 h Max. Min.
24 Jun 11-17 30.2 79.0 61.0 31.8 24.9 24 Jun 11-17 115.6 87.0 68.0 31.5 25.4 25 18-24 0.0 69.4 48.0 32.7 25.6 25 18-24 19.6 84.0 70.0 31.3 25.3 26 25-01 25.6 74.6 53.6 34.5 25.5 26 25-01 113.4 87.0 76.0 30.2 25.0 27 Jul 02-08 10.4 76 59 32.0 24.7 27 Jul 02-08 139.6 88.0 73.0 31.4 25.4 28 09-15 61.0 85.1 78.9 28.3 24.0 28 09-15 77.2 84.0 70.0 31.5 25.2 29 16-22 0.0 79.7 54.4 31.5 24.6 29 16-22 264.0 95.0 84.0 28.6 24.3 30 23-29 39.5 81.4 65.9 32.1 24.6 30 23-29 28.2 92.0 72.0 30.9 25.0 31 30-05 50.4 90.0 80.9 29.8 24.1 31 30-05 172.0 89.0 76.0 30.3 24.8 32 Aug 06-12 58.4 84.4 75.9 30.1 23.7 32 Aug 06-12 102.2 86.0 72.0 31.3 25.5 33 13-19 11.0 85.7 69.1 29.4 22.9 33 13-19 24.2 91.0 83.0 28.5 24.5 34 20-26 36.6 82.3 65.3 30.4 22.5 34 20-26 135.4 90.0 74.0 31.5 24.8 35 27-02 8.4 85.7 60.0 30.5 22.5 35 27-02 24.2 87.0 65.0 32.3 24.5 36 Sep 03-09 5.0 82.0 57.9 33.0 23.0 36 Sep 03-09 16.4 88.0 61.0 32.4 23.9 37 10-16 151.7 89.0 71.6 31.7 22.4 37 10-16 50.4 85.0 68.0 31.6 24.0 38 Sep17-23 50.9 87.6 67.6 30.2 21.6 38 Sep17-23 347.6 89.0 75.0 28.6 22.0 39 24-30 15.4 83.3 47.1 31.3 19.8 39 24-30 0.0 88.0 60.0 31.3 21.3 40 Oct 01-07 29.0 83.4 47.9 34.7 21.8 40 Oct 01-07 19.6 87.0 65.0 30.9 23.1 41 08-14 0.0 73.1 29.1 34.4 19.8 41 08-14 4.8 82.0 57.0 31.0 19.8 42 15-21 32.0 74.7 33.4 33.8 17.4 42 15-21 0.0 80.0 47.0 30.1 15.9 43 22-28 43 22-28 0.0 83.0 40.0 29.3 15.1 44 29-04 44 29-04 0.0 84.0 47.0 29.4 14.7 Total : 616 Total : 1654
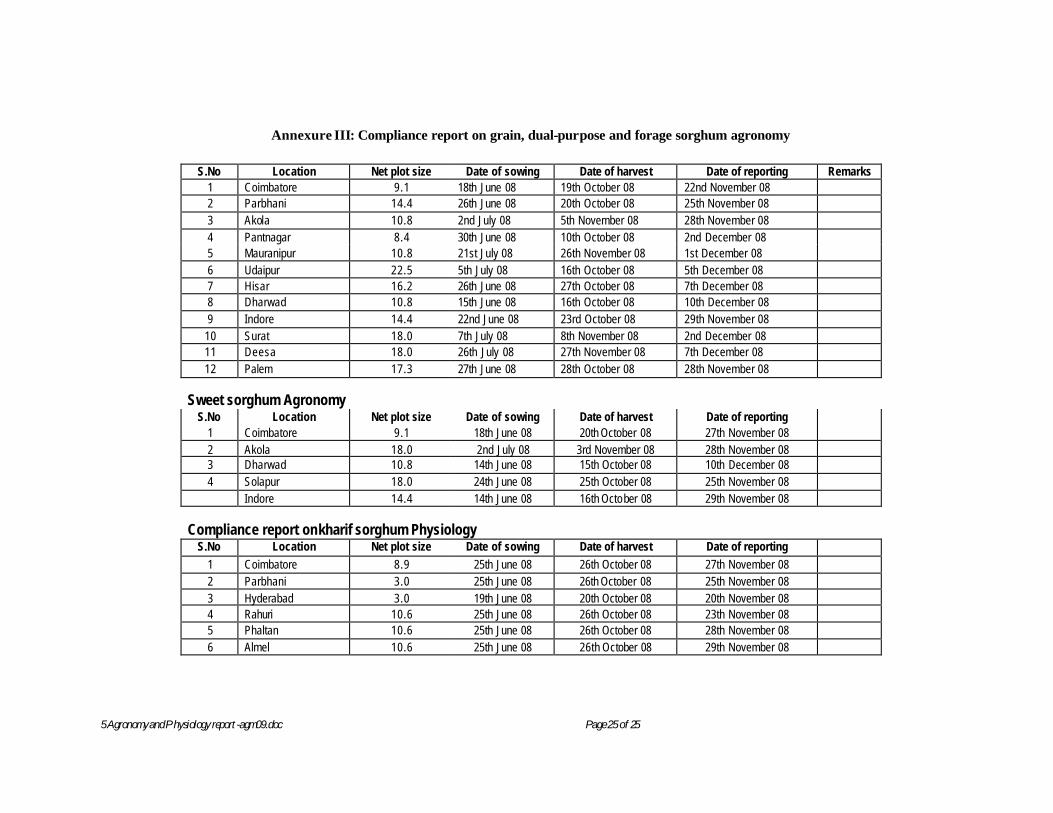
5 Agronomy and P hysiology report-agm09.doc Page 25 of 25
Annexure III: Compliance report on grain, dual-purpose and forage sorghum agronomy
S.No Location Net plot size Date of sowing Date of harvest Date of reporting Remarks 1 Coimbatore 9.1 18th June 08 19th October 08 22nd November 08 2 Parbhani 14.4 26th June 08 20th October 08 25th November 08 3 Akola 10.8 2nd July 08 5th November 08 28th November 08 4 Pantnagar 8.4 30th June 08 10th October 08 2nd December 08 5 Mauranipur 10.8 21st July 08 26th November 08 1st December 08 6 Udaipur 22.5 5th July 08 16th October 08 5th December 08 7 Hisar 16.2 26th June 08 27th October 08 7th December 08 8 Dharwad 10.8 15th June 08 16th October 08 10th December 08 9 Indore 14.4 22nd June 08 23rd October 08 29th November 08
10 Surat 18.0 7th July 08 8th November 08 2nd December 08 11 Deesa 18.0 26th July 08 27th November 08 7th December 08 12 Palem 17.3 27th June 08 28th October 08 28th November 08
Sweet sorghum Agronomy
S.No Location Net plot size Date of sowing Date of harvest Date of reporting 1 Coimbatore 9.1 18th June 08 20th October 08 27th November 08 2 Akola 18.0 2nd July 08 3rd November 08 28th November 08 3 Dharwad 10.8 14th June 08 15th October 08 10th December 08 4 Solapur 18.0 24th June 08 25th October 08 25th November 08 Indore 14.4 14th June 08 16th October 08 29th November 08
Compliance report on kharif sorghum Physiology
S.No Location Net plot size Date of sowing Date of harvest Date of reporting 1 Coimbatore 8.9 25th June 08 26th October 08 27th November 08 2 Parbhani 3.0 25th June 08 26th October 08 25th November 08 3 Hyderabad 3.0 19th June 08 20th October 08 20th November 08 4 Rahuri 10.6 25th June 08 26th October 08 23th November 08 5 Phaltan 10.6 25th June 08 26th October 08 28th November 08 6 Almel 10.6 25th June 08 26th October 08 29th November 08